Embed Size (px)
Citation preview

1
Operating Manual
EM-PQ 1500 Power Quality Monitor

2
User notes:
3
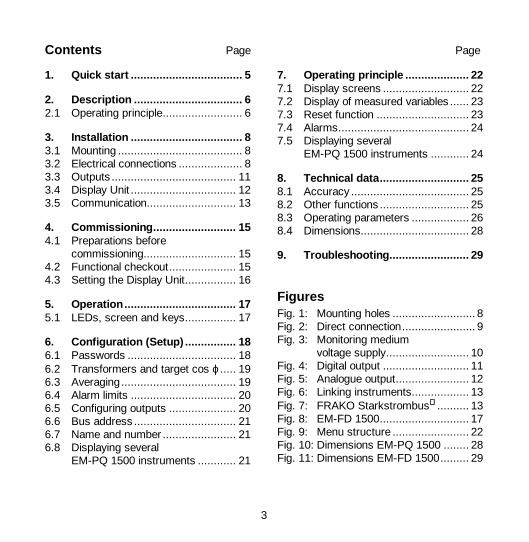
Contents Page Page
1. Quick start ................................... 5
2. Description .................................. 6 2.1 Operating principle......................... 6
3. Installation ................................... 8 3.1 Mounting ....................................... 8 3.2 Electrical connections .................... 8 3.3 Outputs ....................................... 11 3.4 Display Unit ................................. 12 3.5 Communication............................ 13
4. Commissioning.......................... 15 4.1 Preparations before
commissioning............................. 15 4.2 Functional checkout..................... 15 4.3 Setting the Display Unit................ 16
5. Operation................................... 17 5.1 LEDs, screen and keys................ 17
6. Configuration (Setup) ................ 18 6.1 Passwords .................................. 18 6.2 Transformers and target cos ϕ..... 19 6.3 Averaging.................................... 19 6.4 Alarm limits ................................. 20 6.5 Configuring outputs ..................... 20 6.6 Bus address ................................ 21 6.7 Name and number ....................... 21 6.8 Displaying several
EM-PQ 1500 instruments ............ 21
7. Operating principle .................... 22 7.1 Display screens ........................... 22 7.2 Display of measured variables ...... 23 7.3 Reset function ............................. 23 7.4 Alarms......................................... 24 7.5 Displaying several
EM-PQ 1500 instruments ............ 24
8. Technical data............................ 25 8.1 Accuracy ..................................... 25 8.2 Other functions ............................ 25 8.3 Operating parameters .................. 26 8.4 Dimensions.................................. 28
9. Troubleshooting......................... 29 Figures Fig. 1: Mounting holes .......................... 8 Fig. 2: Direct connection....................... 9 Fig. 3: Monitoring medium
voltage supply.......................... 10 Fig. 4: Digital output ........................... 11 Fig. 5: Analogue output....................... 12 Fig. 6: Linking instruments.................. 13 Fig. 7: FRAKO Starkstrombus .......... 13 Fig. 8: EM-FD 1500............................ 17 Fig. 9: Menu structure ........................ 22 Fig. 10: Dimensions EM-PQ 1500 ........ 28 Fig. 11: Dimensions EM-FD 1500......... 29

4
Safety instructions
!!! Important: read before commissioning !!!
• The user must ensure that all operators are familiar with this operating manual and follow it at all times.
• The operating manual must be read carefully before the instrument is mounted, installed and commissioned.
• All actions taken must follow this operating manual.
• The installation and commissioning may only be carried out by appropriately qualified personnel with due regard for all rules and regulations that are in force.
• The instrument contains live components at the AC supply voltage and must therefore not be opened.
• If the instrument is visibly damaged, it must not be installed, wired up or commissioned.
• If the instrument does not work after commissioning, it must be isolated from the power supply again.
• Any additional laws, standards, directives, etc. that relate to this product must be complied with.
5
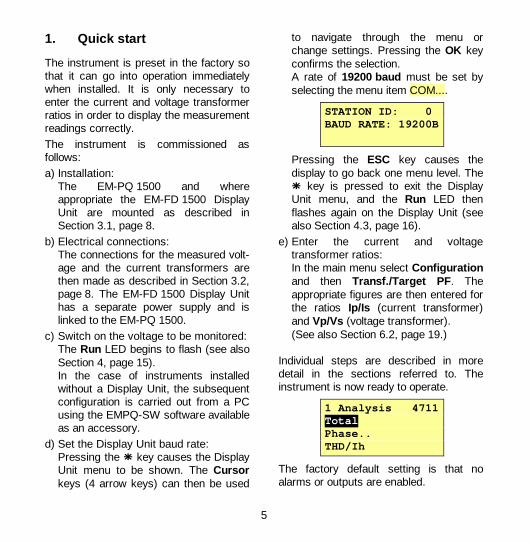
1. Quick start
The instrument is preset in the factory so that it can go into operation immediately when installed. It is only necessary to enter the current and voltage transformer ratios in order to display the measurement readings correctly. The instrument is commissioned as follows: a) Installation:
The EM-PQ 1500 and where appropriate the EM-FD 1500 Display Unit are mounted as described in Section 3.1, page 8.
b) Electrical connections: The connections for the measured volt-age and the current transformers are then made as described in Section 3.2, page 8. The EM-FD 1500 Display Unit has a separate power supply and is linked to the EM-PQ 1500.
c) Switch on the voltage to be monitored: The Run LED begins to flash (see also Section 4, page 15). In the case of instruments installed without a Display Unit, the subsequent configuration is carried out from a PC using the EMPQ-SW software available as an accessory.
d) Set the Display Unit baud rate: Pressing the key causes the Display Unit menu to be shown. The Cursor keys (4 arrow keys) can then be used
to navigate through the menu or change settings. Pressing the OK key confirms the selection. A rate of 19200 baud must be set by selecting the menu item COM....
STATION ID: 0 BAUD RATE: 19200B
Pressing the ESC key causes the display to go back one menu level. The key is pressed to exit the Display Unit menu, and the Run LED then flashes again on the Display Unit (see also Section 4.3, page 16).
e) Enter the current and voltage transformer ratios: In the main menu select Configuration and then Transf./Target PF . The appropriate figures are then entered for the ratios Ip/Is (current transformer) and Vp/Vs (voltage transformer). (See also Section 6.2, page 19.)
Individual steps are described in more detail in the sections referred to. The instrument is now ready to operate.
1 Analysis 4711 Total Phase.. THD/Ih
The factory default setting is that no alarms or outputs are enabled.

6
2. Description
The EM-PQ 1500 Power Quality Monitor measures, analyses, monitors, temporarily saves and transmits the quality-relevant parameters of an electrical supply network.
The instrument can give an alarm via a contact if these parameters go beyond set limits.
The EM-PQ 1500 has been designed as part of the FRAKO Energy Management System and exhibits its full potential if used in such a system. It can be connected to the FRAKO Starkstrombus via its built-in bus port. 2.1 Operating principle
2.1.1 Measured variables
The extreme values (generally maximum values, but for cosϕ the minimum value) of all measured variables are recorded in the instrument. A high alarm limit can be set for variables marked with ♣♣♣♣, while those marked with ♥♥♥♥ can also be assigned a low alarm limit.
The EM-PQ 1500 Power Quality Monitor measures and displays the following parameters (the corresponding symbols are shown in brackets):
Total power ♣ Active power (P) ♣ Reactive power (Q) • Apparent power (S) • Power factor cos ϕ (PF)
Averaged total power (bimetallic function) ♥ Active power (Pav) • Reactive power (Qav) ♣ Correction power required (Qz)
Voltages and currents per phase • Phase-phase r.m.s. voltage (V12) ♥ Phase-neutral r.m.s. voltage (V) ♥ r.m.s. current (I) ♣ Active power (P) ♣ Reactive power (Q) • Apparent power (S)
Averaged variables per phase (bimetallic function) ♣ r.m.s. current (I) ♥ Active power (P)
Total harmonic distortion per phase ♣ Total harmonic voltage distortion (THD V) ♣ Total harmonic current distortion (THD I) • Absolute harmonic current (Ih)
Currents in the neutral conductor ♣ Current in N conductor (IN) ♣ Averaged current in N conductor (INav) • Harmonic current in N conductor (INh)
7
Total work (energy) • Active work (Wa) • Reactive work (Wr) • Active work fed back (exported) to
supply (Wf) 2.1.2 Extreme value memory
If a measured variable exceeds a preset maximum, the new value is written to the extreme value memory. In the case of cos ϕ the minimum inductive (lagging) value is recorded. The extreme values can be reset to corre-spond to the current readings by means of a password-protected reset function. 2.1.3 Alarms
Those measured variables marked with ♣♣♣♣ and ♥♥♥♥ can be assigned alarm limits (set points). If the variable goes beyond its set limit, an alarm is given. Once the variable is again 1% inside its set limit, the alarm ceases.
The alarm messages are shown in the Display Unit. In addition, alarms can be transmitted via the two contacts in the EM-PQ 1500. The instrument can be programmed as desired regarding which alarms are transmitted via which contact. Two LEDs on the EM-PQ 1500 indicate the current alarm status.
2.1.4 Active and reactive work
Active and reactive work (energy) is calculated from the measured active and reactive power. The electronic meters record the active work drawn (Wa) and the exported active work (Wf) fed back into the supply system separately. In addition, the inductive reactive work (Wr) is metered.
If desired, a work meter can also function as a pulse output. 2.1.5 4–20 mA output
Any desired variable can be assigned to the passive 4–20 mA output of the EM-PQ 1500. 2.1.6 Display of several EM-PQ 1500
instruments
One EM-FD 1500 Display Unit can be used to display the data from up to 15 EM-PQ 1500 instruments linked together in a network. 2.1.7 Bus connection
All current measured variables, alarm messages and meter readings can be acquired via the FRAKO Starkstrombus. If the bus connection is disrupted, the Power Quality Monitor still remains in full working order.
8
3. Installation
3.1 Mounting
3.1.1 Mounting the EM-PQ 1500
The EM-PQ 1500 enclosure is designed for mounting on a standard 35 mm DIN rail in any desired orientation.
Important: The instrument is intended exclusively for installation in enclosed distribution panels or control cabinets. It must not be possible for persons to touch the terminals inadvertently during the sub-sequent operation of the instrument. 3.1.2 Mounting the EM-FD 1500
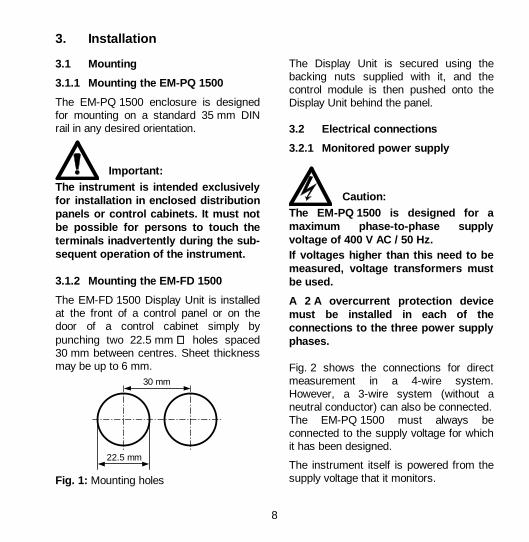
The EM-FD 1500 Display Unit is installed at the front of a control panel or on the door of a control cabinet simply by punching two 22.5 mm ∅∅∅∅ holes spaced 30 mm between centres. Sheet thickness may be up to 6 mm.
30 mm
22.5 mm
Fig. 1: Mounting holes
The Display Unit is secured using the backing nuts supplied with it, and the control module is then pushed onto the Display Unit behind the panel. 3.2 Electrical connections
3.2.1 Monitored power supply
Caution: The EM-PQ 1500 is designed for a maximum phase-to-phase supply voltage of 400 V AC / 50 Hz. If voltages higher than this need to be measured, voltage transformers must be used.
A 2 A overcurrent protection device must be installed in each of the connections to the three power supply phases. Fig. 2 shows the connections for direct measurement in a 4-wire system. However, a 3-wire system (without a neutral conductor) can also be connected. The EM-PQ 1500 must always be connected to the supply voltage for which it has been designed.
The instrument itself is powered from the supply voltage that it monitors.

9
2A 2A 2A
L1
L3
L2
IN Digital
from transf.
N e.g. 3 x 230 V phase-neutral 400 V phase-phase
L1 L1
L2 L3 N S2 S1 L2
S2 S1 L3
S2 S1 OUT
Digital OUT A / D
EM-PQ 1500-M
Display +24V 0V 2 3 1 4 5 Out
Starkstrombus ⊥⊥⊥⊥ B A
Display IN +24V 0V
Display Unit
Starkstrombus
24 V DC supply for
Display Unit (if connected)
Run
Alarm 1
Alarm 2
0.1 Wh secondary
Link
Fig. 2: Direct connection Additional notes: If the instrument is used to monitor a single-phase system, the two phase input terminals not in use should be connected to the neutral terminal N.
Fig. 3 shows the use of voltage transformers in the supply system. These must be earthed at phase voltages of 1 kV or more.

10
2A 2A 2A
L3
L1
L2
IN Digital
Incoming supply
e.g. 3 x 10 kV phase-phase Voltage transformer 10 kV / 100 V
L1 L1
L2 L3 N S2 S1 L2
S2 S1 L3
S2 S1 OUT
Digital OUT A / D
EM-PQ 1500-M
Starkstrombus ⊥⊥⊥⊥ B A
Display IN +24V 0V
Display Unit
Starkstrombus
24 V DC supply for
Display Unit (if connected)
Run
Alarm 1
Alarm 2
0.1 Wh secondary
PE
Link
Display +24V 0V 2 3 1 4 5 Out
Fig. 3: Monitoring medium voltage supply
3.2.2 Current transformers
Current in the three phases is measured using external current transformers. The EM-PQ 1500 has volt-free input terminals for the secondary currents. Fig. 2 and Fig. 3 show typical connections.
It must be ensured that the current circuit for each phase is correctly connected to correspond to the voltage circuit for that phase.

11
Current transformers of Class 0.5 or Class 1 accuracy are recommended. The connecting cables must have a cross section of at least 2.5 mm².
Particular care must be taken with the orientation and polarity of the current transformers, otherwise power draw will be measured as power fed back (ex-ported) to the supply system and inductive (lagging) currents will be measured as capacitive (leading) currents.
Caution: The maximum current in the current transformer secondary circuit must not exceed 6 A.
The lower limit for input current is 8 mA. Currents below this level are not detected.
Fig. 3 shows how the currents are measured in a 2-wattmeter circuit. This arrangement can be used in 3-wire systems having no neutral conductor.
Caution: In networks with voltages exceeding 1 kV the current transformers must be earthed.
3.3 Outputs
3.3.1 Digital output
The OUT Digital output can be used either as an alarm contact or as a pulse output for active or reactive work. The programming procedure is described in Section 6.5, page 20.
+ OUT - Digital
max48V DC
+ -
max. 100mA
Fig. 4: Digital output
Caution: The current in the digital output must be limited externally to 100 mA, and the voltage must not exceed 48 V DC.
The output can be connected directly to a standard S0 input (IEC 62053-31, Class A). If higher voltages or heavier currents need to be switched, an interface relay must be installed.
12
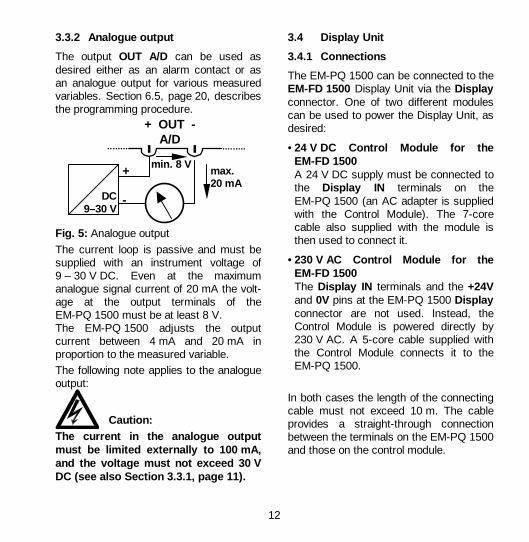
3.3.2 Analogue output
The output OUT A/D can be used as desired either as an alarm contact or as an analogue output for various measured variables. Section 6.5, page 20, describes the programming procedure.
+ OUT - A/D
DC 9–30 V
+ -
max. 20 mA
min. 8 V
Fig. 5: Analogue output The current loop is passive and must be supplied with an instrument voltage of 9 – 30 V DC. Even at the maximum analogue signal current of 20 mA the volt-age at the output terminals of the EM-PQ 1500 must be at least 8 V. The EM-PQ 1500 adjusts the output current between 4 mA and 20 mA in proportion to the measured variable. The following note applies to the analogue output:
Caution: The current in the analogue output must be limited externally to 100 mA, and the voltage must not exceed 30 V DC (see also Section 3.3.1, page 11).
3.4 Display Unit
3.4.1 Connections
The EM-PQ 1500 can be connected to the EM-FD 1500 Display Unit via the Display connector. One of two different modules can be used to power the Display Unit, as desired:
• 24 V DC Control Module for the EM-FD 1500 A 24 V DC supply must be connected to the Display IN terminals on the EM-PQ 1500 (an AC adapter is supplied with the Control Module). The 7-core cable also supplied with the module is then used to connect it.
• 230 V AC Control Module for the EM-FD 1500 The Display IN terminals and the +24V and 0V pins at the EM-PQ 1500 Display connector are not used. Instead, the Control Module is powered directly by 230 V AC. A 5-core cable supplied with the Control Module connects it to the EM-PQ 1500.
In both cases the length of the connecting cable must not exceed 10 m. The cable provides a straight-through connection between the terminals on the EM-PQ 1500 and those on the control module.
13
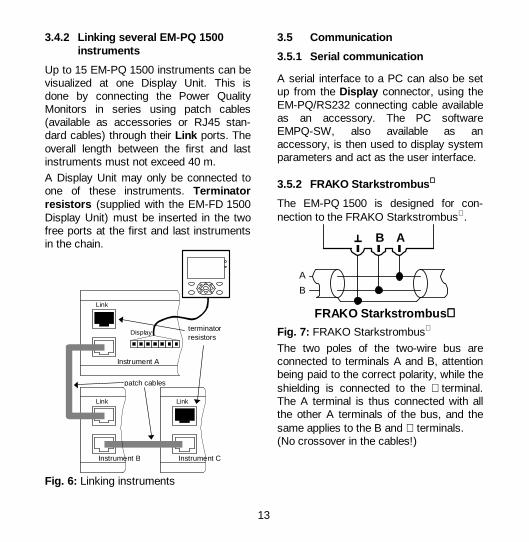
3.4.2 Linking several EM-PQ 1500 instruments
Up to 15 EM-PQ 1500 instruments can be visualized at one Display Unit. This is done by connecting the Power Quality Monitors in series using patch cables (available as accessories or RJ45 stan-dard cables) through their Link ports. The overall length between the first and last instruments must not exceed 40 m. A Display Unit may only be connected to one of these instruments. Terminator resistors (supplied with the EM-FD 1500 Display Unit) must be inserted in the two free ports at the first and last instruments in the chain.
Instrument A
Display
Instrument B Instrument C
Link
Link
Link
terminator resistors
patch cables
Fig. 6: Linking instruments
3.5 Communication
3.5.1 Serial communication
A serial interface to a PC can also be set up from the Display connector, using the EM-PQ/RS232 connecting cable available as an accessory. The PC software EMPQ-SW, also available as an accessory, is then used to display system parameters and act as the user interface. 3.5.2 FRAKO Starkstrombus
The EM-PQ 1500 is designed for con-nection to the FRAKO Starkstrombus.
FRAKO Starkstrombus
B A
A
B
Fig. 7: FRAKO Starkstrombus The two poles of the two-wire bus are connected to terminals A and B, attention being paid to the correct polarity, while the shielding is connected to the ⊥ terminal. The A terminal is thus connected with all the other A terminals of the bus, and the same applies to the B and ⊥ terminals. (No crossover in the cables!)

14
The bus must have a single-segment topology, all instruments being patched in to this segment or connected to it by a drop line up to 2 m in length. Star topologies can be constructed by using a repeater (component EMB 1101).
The total length of the bus must not exceed 1200 m. A repeater (component EMB 1101) must be installed in the line if greater distances are needed.
Recommended cable types: Surge impedance 100–120 Ω _ ; Ø ≥ 0.3 mm²; shielded twisted pairs;
Types: IBM Twinax 105 Ω Lapp Unitronic ® Bus CAN 1x2x0,34 / Helukabel CAN BUS 1x2x0,34
Note: The shielding ⊥⊥⊥⊥ must not be earthed on the EM-PQ 1500 instrument. Terminator resistors must be connected at the beginning and at the end of a bus segment. A 120 ohm resistor is connected between terminals A and B. In bus systems with less than 4 devices connected a 1 kohm resistor must also be in place between the A and ⊥ terminals. The resistors must have a 250 mW power rating.

15
4. Commissioning
4.1 Preparations before commissioning
Caution: It must be ensured that the instrument terminals can no longer be touched before the instrument is com-missioned. This can be by means of a closed cabinet door, a protective hood or similar.
Power must not be switched on to the instrument until the above precaution has been taken. 4.2 Functional checkout
When power is switched on, the RUN LEDs on the EM-PQ 1500 and the EM-FD 1500 Display Unit both flash. The Display Unit screen lights up and a menu appears. If the Display Unit has no contact yet with the EM-PQ 1500, the following message is shown:
Connection establishment in progress...
In this case the connection to the EM-PQ 1500 needs to be checked, or the EM-FD 1500 Display Unit has not yet been configured (see Section 4.3, page 16).
Important: If the instruments do not react as described above, their power supply must be switched off and the installation inspected.
Checking the displayed active and reactive power readings enables wrong con-nections in the measurement circuit to be quickly identified. If unrealistic values for active or reactive power are displayed, e.g. negative active power when in fact power is being drawn, or an extremely low value of cos ϕ, the connections must be checked.
Caution: The instrument must always be isolated from the power supply whenever wiring or installation work is carried out.

16
4.3 Setting the Display Unit
When the EM-FD 1500 Display Unit is started up for the first time, the connection parameters must be set. Pressing the key displays the following menu:
COM... MENU LANGUAGE... LIGHTING : 80% CONTRAST : 0
The and keys are used to navigate and select a menu item, then the OK key is pressed to confirm this selection. COM... is selected in order to set the baud rate for data communications. Select this menu item and confirm it with the OK key. Then select BAUD RATE in the submenu and again press OK to confirm. The keys must again beused to select a setting of 19200 baud .
STATION ID: 0 BAUD RATE: 19200B
Pressing the OK key now causes this change to be adopted. You can return to the main menu for the Display Unit Setup by pressing the ESC key. The toggle key can be pressed at any time to close the main menu or display it again. If the setting has been carried out correctly, the EM-PQ 1500 main menu will appear in the screen.
1 Analysis 004711 Total Phase
THD/Ih ↓↓↓↓
All subsequent settings can be carried out starting from this point.

17
5. Operation
If the EM-PQ 1500 is to be operated without a Display Unit, the basic settings must be made using the PC software EMPQ-SW available as an accessory. 5.1 LEDs, screen and keys
5.1.1 LEDs on the EM-PQ 1500
The EM-PQ 1500 has four LEDs as annunciators.
• Run (green) This LED flashes to show that the EM-PQ 1500 is ready to operate.
• Alarm 1 (red) Alarm signals that have been pro-grammed for the OUT Digital output are also indicated by this LED lighting up.
• Alarm 2 (red) Alarm signals that have been pro-grammed for the OUT A/D output are also indicated by this LED lighting up.
• 0.1kWh sec. (yellow) This LED lights up briefly every time 0.1 kWh work has been metered at the secondary side (without taking the current or voltage transformer ratios into account). This is independent of the pulse output at OUT Digital .
5.1.2 Operation of the EM-FD 1500
The EM-FD 1500 Display Unit has a small screen with four rows, each of 16 char-acters, plus two LEDs and nine keys.
FRAKOFRAKOFRAKOFRAKO EM-FD 1500
Run
(( ))
OK
ESC
>
*
< Unit Unit
Fig. 8: EM-FD 1500
• Four cursor keys (large arrows) These keys are used to navigate the menus. Individual menus display arrows (←←←←↑↑↑↑↓↓↓↓→→→→) to show in which directions it is possible to move. In addition, numerical values can also be entered using the cursor keys. The keys are used to change individual digits, while the keys move the cursor from one digit to the next. Pressing the OK confirms the value entered, while the ESC cancels an entry.

18
• OK key Pressing this key confirms a menu selection or completes a manual entry procedure. When measured variables are displayed, this key can be used to show the maximum values.
• ESC key Press this key to exit the submenu.
• UNIT < > keys If several EM-PQ 1500 instruments are linked to one Display Unit (see Section 6.8, page 21), these keys can be used to switch the display from one Power Quality Monitor to the next.
• key This is a toggle key used to call the Display Unit Setup menu and to exit from it.
5.1.3 EM-FD 1500 Display Unit screen
The screen of the EM-FD 1500 displays menus, measured variables and manual inputs. Keys located below the screen are used to operate the instrument.
The Run LED flashes when the EM-FD 1500 is operational. In this condition it has successfully interfaced with the EM-PQ 1500 instrument.
The (()) LED indicates that at least one measured variable has gone beyond its alarm limit. A corresponding message is also shown in the Display Unit.
6. Configuration (Setup)
In order for the instrument to work correctly, some values must be adjusted to suit local conditions. This is done by selecting Configuration in the main menu and then pressing the OK key. You are then prompted for the password. After this has been entered correctly, the Configuration menu is displayed.
1 Analysis 004711 Transf./Target PF ↑↑↑↑ Total Limits Limits L1–L3 Output/Alarms Station Language Password 1 Password 2 Data Import ↓↓↓↓
6.1 Passwords
6.1.1 Password entry
The following prompt is displayed:
1 Analysis 004711 Password 1 ****
When the OK key is pressed again, the default password 1 2 3 4 (factory setting) is suggested. The cursor keys can now be

19
used to change each individual digit to set the desired password (actually a misnomer, since it is a four-digit number). The OK key is then pressed to confirm the password.
Pressing the OK once more displays the Configuration submenu. 6.1.2 Changing passwords
The EM-PQ 1500 has two passwords. Password 1 protects the instrument configuration and resetting of the extreme (maximum) values. Password 2 protects resetting of the work meters. The currently valid passwords can be changed in the Configuration menu by selecting Password 1 or Password 2 as appropriate.
When changing Password 2, you are prompted to give the current password before entering the new one. The factory default settings are as follows: Password 1: 1 2 3 4 Password 2: 3 7 2 5 6.2 Transformers and target cos ϕϕϕϕ
Selecting Transf. / Target PF in the Configuration menu enables the current transformer ratio Ip/Is and the voltage transformer ratio Vp/Vs to be set by entering the appropriate values.
Example: A current transformer with a 400 A / 5 A rating is to be used. The CT ratio to be set is therefore 80.
Entering the cos ϕ (Target PF) enables the instrument to calculate the correction power Qz required. 6.3 Averaging
The EM-PQ 1500 can simulate a bimetallic instrument for some current and power variables. If Transf./Target PF is selected in the Configuration menu, the averaging intervals (sliding windows), TavI for currents and TavP for powers, can be set at values between 1 and 30 minutes.
Example: With an averaging interval of 10 min and a change in current from 0 A to 100 A, the measured Iav will have risen to about 63 A after 10 min. 100%
50%
Zeit 10min 50min 30min In the Display Unit the averaged measurement readings are identified by the additional letters av.

20
6.4 Alarm limits
If a value of 0 is entered for an alarm limit, the monitoring function concerned is immediately disabled. When entering an alarm limit, it is permis-sible to use multiplying prefixes such as k (kilo) or M (mega) before the units.
If Total Limits is selected in the Configuration menu, the following alarm limits can be set: • Pmax and Qmax for the maximum
momentary active and reactive powers • Pavmax and Pavmin for the upper and
lower limits of the averaged power • Qzmax is the alarm limit for the
maximum value of correction power required.
• INmax and INavmax are the alarm lim-its for the momentary and averaged neutral conductor currents respectively.
When Limits L1–L3 are selected in the configuration menu, the alarm limits are always applied to all three phases simultaneously: • Vmax , Vmin , Imax , Imin , Pmax and
Qmax monitor the momentary values of those variables.
• Iavmax , Pavmax und Pavmin are the alarm limits for the averaged values of current and power.
• THDVmax and THDImax monitor the momentary total harmonic distortion of the voltage and current respectively.
6.5 Configuring outputs
When Output/Alarms is selected in the configuration menu, the function of the two outputs OUT Digital (A1) and OUT A/D (A2) can be specified.
1 Analysis 004711 A1 Alarm/Pulse ↑↑↑↑ A2 Alarm/4–20 mA
The output from OUT Digital (A1) can be in the form of alarm signals or metering pulses from the work meters.
1 Analysis 004711 Total Alarms ↑↑↑↑ Alarms L1–L3 Pulse ↓↓↓↓
The menu items Total Alarms and Alarms L1–L3 can be used to assign the various alarm signals to the output. A 1 after the variable concerned indicates that its alarm is output via the contact. A 0 on the other hand indicates that the alarm message is given, but not output via the contact.
The menu item Pulse is used to direct the metering pulses of the active work (Wa), reactive work (Wr) and export (Wf) meters to the output, as required.
One pulse has a valency of:
1 Wh × CT ratio × VT ratio

21
Alarm signals can also be output at OUT A/D (A2) . This output also offers the option of transmitting a 4–20 mA analogue signal corresponding to a measured variable. Configuration of the alarm output is as described for OUT Digital (A1) . The 4–20 mA analogue signal can only be configured by means of the EMPQ-SW software (available as an accessory). 6.6 Bus address
If the instrument is connected to a FRAKO Starkstrombus, it will require its own unique bus address, which must not be assigned to any other instrument within the bus system. The number must be set between 9 and 124. Selecting Station in the Configuration menu displays a submenu in which Bus Address can be selected and the appropriate number assigned to it. 6.7 Name and number
Selecting Station in the Configuration menu displays a submenu. The instrument can be assigned a name with 14 characters by selecting Name in this submenu. The name is normally shown in the first row on the screen.
1 Analysis 004711 List ↑↑↑↑ Name Number Bus Address 30 ↓↓↓↓
Similarly, the instrument is assigned a station number in the range 1–9 and A – F. This can also be seen in the first row on the screen. 6.8 Displaying several EM-PQ 1500
instruments
In order to make use of this function, several EM-PQ 1500 instruments must be connected via the Link ports as described in Section 3.4.2, page 13. The additional instruments can then be registered by selecting Station in the Configuration menu and then List in that submenu.
1 Analysis 004711 1 1019 ↑↑↑↑ 2 2154 3 --------- ↓↓↓↓
The EM-PQ 1500 instrument connected directly to the EM-FD 1500 Display Unit is at position 1. Additional instruments must be registered at a free position number using the last four digits of their serial numbers. Anywhere other than in the List submenu the UNIT keys can be used to switch from one instrument to the next. When a key is pressed once, the name of the currently displayed instrument appears in the first row. Pressing the key again then displays the next instrument. The List submenu is only enabled when the first EM-PQ 1500 instrument is displayed.
22
7. Operating principle
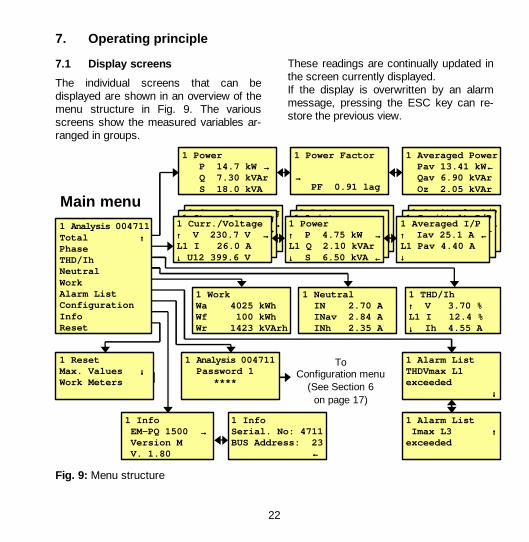
7.1 Display screens
The individual screens that can be displayed are shown in an overview of the menu structure in Fig. 9. The various screens show the measured variables ar-ranged in groups.
These readings are continually updated in the screen currently displayed. If the display is overwritten by an alarm message, pressing the ESC key can re-store the previous view.
1 Analysis 004711 Total ↑↑↑↑ Phase THD/Ih Neutral Work Alarm List Configuration Info Reset
1 Power P 14.7 kW →→→→ Q 7.30 kVAr S 18.0 kVA
1 Power Factor →→→→ PF 0.91 lag
1 Averaged Power Pav 13.41 kW ←←←← Qav 6.90 kVAr Qz 2.05 kVAr
1 Strom-Spannung ↑↑↑↑ U 230.7 V →→→→
1 Strom-Spannung ↑↑↑↑ U 230.7 V →→→→
1 Curr./Voltage ↑↑↑↑ V 230.7 V →→→→L1 I 26.0 A ↓↓↓↓ U12 399.6 V
1 Leistung →→→→
1 Leistung →→→→
1 Power ↑↑↑↑ P 4.75 kW →→→→ L1 Q 2.10 kVAr ↓↓↓↓ S 6.50 kVA ←←←←
1 Gemittelt I/P ↑↑↑↑ Im 25.1 A ←←←←
1 Gemittelt I/P ↑↑↑↑ Im 25.1 A ←←←←
1 Averaged I/P ↑↑↑↑ Iav 25.1 A ←←←← L1 Pav 4.40 A ↓↓↓↓
1 THD/Ih ↑↑↑↑ V 3.70 % L1 I 12.4 % ↓↓↓↓ Ih 4.55 A
1 Neutral IN 2.70 A INav 2.84 A INh 2.35 A
1 Work Wa 4025 kWh Wf 100 kWh Wr 1423 kVArh
1 Alarm List THDVmax L1 exceeded ↓↓↓↓
1 Info EM-PQ 1500 →→→→ Version M V. 1.80
1 Info Serial. No: 4711 BUS Address: 23 ←←←←
1 Reset Max. Values ↓↓↓↓ Work Meters
1 Alarm List Imax L3 ↑↑↑↑ exceeded
1 Analysis 004711 Password 1 ****
Main menu
Fig. 9: Menu structure
To Configuration menu
(See Section 6 on page 17)

23
7.1.1 Operation
The four cursor keys are used to navigate the menu or switch between display screens. When a menu item is selected, this is confirmed by pressing the OK key. The ESC key is pressed to exit a submenu. Operation of the instrument is described in greater detail in Section 5.1, page 17. 7.2 Display of measured variables
The measured variables are arranged in a menu structure for a clear overview (see Fig. 9, page 22). 7.2.1 Maximum values
Pressing the OK key when measured variables are being displayed causes the extreme (maximum) values of these variables to be shown. Pressing OK again then toggles the display back to the current values of the variables. 7.2.2 Power export
If the direction of the active power in the current transformer is reversed (to feed power back to the supply network), this condition is indicated by a minus sign in front of the displayed active power. The active work exported is totalized in the work meter Wf.
7.2.3 Reactive power
If the reactive power is capacitive (current leading), a minus sign is displayed in front of the reactive power readings and the cos ϕ reading. 7.2.4 Work meters
The meter Wa records the active work drawn. If the direction of the power flow is reversed (export condition), the Wa meter comes to a halt and the meter Wf records the active work exported.
Only inductive reactive work is recorded by the meter Wr. Capacitive reactive work is not metered.
No maximum values are determined for the work meters. The meter readings can be reset at zero with the Reset function. 7.3 Reset function
Selecting Reset in the main menu enables the user to reset the maximum values and the work meters. You are asked to give the appropriate password after selecting the function to be reset.
Maximum values: Password 1 Work meters: Password 2
The reset must be confirmed by pressing the OK key.
24
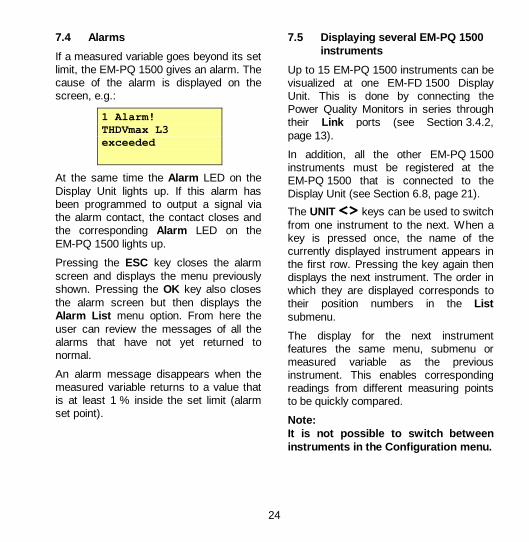
7.4 Alarms
If a measured variable goes beyond its set limit, the EM-PQ 1500 gives an alarm. The cause of the alarm is displayed on the screen, e.g.:
1 Alarm! THDVmax L3 exceeded
At the same time the Alarm LED on the Display Unit lights up. If this alarm has been programmed to output a signal via the alarm contact, the contact closes and the corresponding Alarm LED on the EM-PQ 1500 lights up.
Pressing the ESC key closes the alarm screen and displays the menu previously shown. Pressing the OK key also closes the alarm screen but then displays the Alarm List menu option. From here the user can review the messages of all the alarms that have not yet returned to normal.
An alarm message disappears when the measured variable returns to a value that is at least 1 % inside the set limit (alarm set point).
7.5 Displaying several EM-PQ 1500 instruments
Up to 15 EM-PQ 1500 instruments can be visualized at one EM-FD 1500 Display Unit. This is done by connecting the Power Quality Monitors in series through their Link ports (see Section 3.4.2, page 13).
In addition, all the other EM-PQ 1500 instruments must be registered at the EM-PQ 1500 that is connected to the Display Unit (see Section 6.8, page 21).
The UNIT keys can be used to switch from one instrument to the next. When a key is pressed once, the name of the currently displayed instrument appears in the first row. Pressing the key again then displays the next instrument. The order in which they are displayed corresponds to their position numbers in the List submenu.
The display for the next instrument features the same menu, submenu or measured variable as the previous instrument. This enables corresponding readings from different measuring points to be quickly compared.
Note: It is not possible to switch between instruments in the Configuration menu.

25
8. Technical data 8.1 Accuracy
All data given below are based on the use of .../5 A current transformers and do not take into account the accuracy of the particular transformer installed.
Voltages: 50Hz 57–230 V AC phase-neutral or 100–400 V AC phase-phase, secondary voltage accuracy ±0.5%
Currents: 20–250 mA V AC, secondary current accuracy ±1.5% 250 mA–5A V AC, secondary current accuracy ±1%
Neutral conductor current: 20 mA–5A V AC, secondary current (the factor for the current transformer of one phase applies) accuracy ±2%
Power: (active, reactive and apparent power)
15 W – 3.5 kW, ±1.5% of measured value, - negative active power indicates power export to supply
network - negative reactive power indicates a capacitive (leading)
power factor
Power factor cos ϕ: range: 0.01 leading – 1 – 0.00 lagging (accuracy: see active and reactive power above)
Active and reactive work: as per IEC 61036 Class 1
Total harmonic distortion: (in V and I)
0–100 % of r.m.s. value, accuracy: ±0.5 %
8.2 Other functions
Alarm: Voltages, powers, currents, cos ϕ, THD via Display Unit screen and digital output
Analogue output: Measured variables transmittable as standard 4–20 mA analogue signal if desired

26
8.3 Operating parameters
EM-PQ 1500 Power Quality Monitor Measurement inputs: • Voltage circuit: (phase-neutral) 3× 57–230 V AC ±10%
(phase-phase) 3× 100–400 V AC ±10%
- Frequency: 50 Hz - Power draw: max. 7 VA - Overcurrent protection: externally with 2 A protection
• Current circuit: 3× X/5 A (current transformer current >6 mA)
- Power draw: max. 0.5 VA per CT connection Inputs: • Display IN: 24 V DC ; instrument power supply for Display Units fitted
with a 24 V Control Module
Outputs: • OUT Digital: max. 48 V DC, max. 100 mA DC
• OUT Analogue/Digital: max. 30 V DC, max. 100 mA (DC 4–20 mA passive)
Interfaces: • FRAKO Starkstrombus : for connection to the FRAKO Energy Management System as
per EN 50170 (P-NET)
- Transmission rate: 76.8 kbit/s - Type / Protocol: RS485 / P-NET
• 2 Link ports for connecting other EM-PQ 1500 instruments to the same Display Unit.
- Type / Protocol: CAN / FRAKO internal
• Display Unit connection to EM-FD 1500 Display Unit
Operating conditions: • Ambient temperature: -20 °C to +60 °C
27
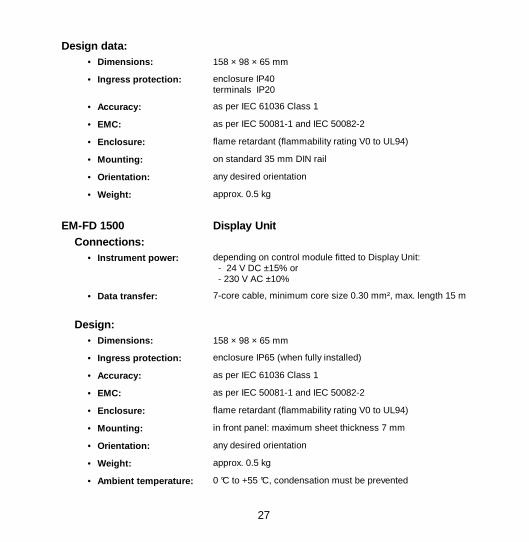
Design data: • Dimensions: 158 × 98 × 65 mm
• Ingress protection: enclosure IP40 terminals IP20
• Accuracy: as per IEC 61036 Class 1
• EMC: as per IEC 50081-1 and IEC 50082-2
• Enclosure: flame retardant (flammability rating V0 to UL94)
• Mounting: on standard 35 mm DIN rail
• Orientation: any desired orientation
• Weight: approx. 0.5 kg
EM-FD 1500 Display Unit Connections: • Instrument power: depending on control module fitted to Display Unit:
- 24 V DC ±15% or - 230 V AC ±10%
• Data transfer: 7-core cable, minimum core size 0.30 mm², max. length 15 m
Design: • Dimensions: 158 × 98 × 65 mm
• Ingress protection: enclosure IP65 (when fully installed)
• Accuracy: as per IEC 61036 Class 1
• EMC: as per IEC 50081-1 and IEC 50082-2
• Enclosure: flame retardant (flammability rating V0 to UL94)
• Mounting: in front panel: maximum sheet thickness 7 mm
• Orientation: any desired orientation
• Weight: approx. 0.5 kg
• Ambient temperature: 0 °C to +55 °C, condensation must be prevented

28
8.4 Dimensions
all dimensions in mm Fig. 10: Dimensions EM-PQ 1500

29
22.5 22.5 30
75
58
36.2
all dimensions in mm
Fig. 11: Dimensions EM-FD 1500
30
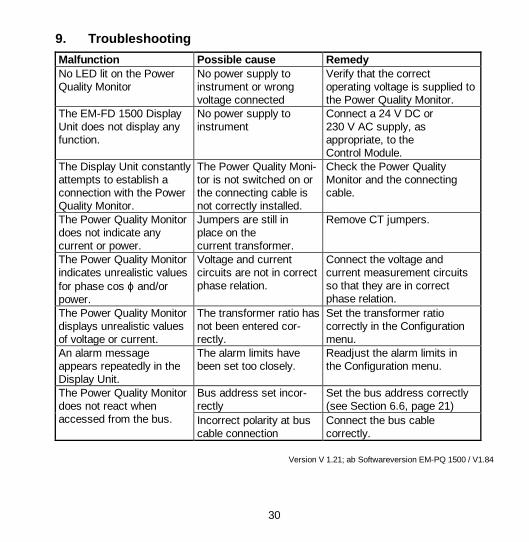
9. Troubleshooting
Malfunction Possible cause Remedy No LED lit on the Power Quality Monitor
No power supply to instrument or wrong voltage connected
Verify that the correct operating voltage is supplied to the Power Quality Monitor.
The EM-FD 1500 Display Unit does not display any function.
No power supply to instrument
Connect a 24 V DC or 230 V AC supply, as appropriate, to the Control Module.
The Display Unit constantly attempts to establish a connection with the Power Quality Monitor.
The Power Quality Moni-tor is not switched on or the connecting cable is not correctly installed.
Check the Power Quality Monitor and the connecting cable.
The Power Quality Monitor does not indicate any current or power.
Jumpers are still in place on the current transformer.
Remove CT jumpers.
The Power Quality Monitor indicates unrealistic values for phase cos ϕ and/or power.
Voltage and current circuits are not in correct phase relation.
Connect the voltage and current measurement circuits so that they are in correct phase relation.
The Power Quality Monitor displays unrealistic values of voltage or current.
The transformer ratio has not been entered cor-rectly.
Set the transformer ratio correctly in the Configuration menu.
An alarm message appears repeatedly in the Display Unit.
The alarm limits have been set too closely.
Readjust the alarm limits in the Configuration menu.
Bus address set incor-rectly
Set the bus address correctly (see Section 6.6, page 21)
The Power Quality Monitor does not react when accessed from the bus. Incorrect polarity at bus
cable connection Connect the bus cable correctly.
Version V 1.21; ab Softwareversion EM-PQ 1500 / V1.84

31
User notes:

32
Power capacitors for low voltage
Power factor correction systems
Power factor correction systems with reactors
Modules for power factor correction systems
Active filters
Dynamic compensation of harmonics
Reactive power control relays
Maximum demand control systems
Mains monitoring instruments
Cost allocation
Energy management systems
Sales Programme
EM-PQ 1500 Power Quality Monitor
Quality is our Motto Quality has a Name We are certified for ISO 9001 and ISO 14001
FR
AK
O 5
5-02
636
/ 08/
07 /
7893
/ ab
V1.
84 /
V1.
22
Sub
ject
to te
chni
cal a
ltera
tion


![000’(-...P7 Ł7 O PQ P ƒ7 Q P7 R S7 M12 ƒ[/ 012! P7 Ł7 O PQ? @7 O PQ V ₁12 X,2 / 012 &&" P7 Ł7 O PQ PH uH • MN2 uQ ó PQ è Q í @12 O PQ º ˇ7 u] &(& P7 Ł7 O PQ Y ⁄2](https://img.pdfslide.us/doc/110x75/5f061dee7e708231d4165fd6/000a-p7-7-o-pq-p-7-q-p7-r-s7-m12-012-p7-7-o-pq-7-o-pq-v-a12.jpg)