Embed Size (px)
Citation preview
PQ Monitoring & Analysis Techniques
Gary W. Chang, Ph.D., P.E., FIEEENational Chung Cheng University
TAIWAN
1
Panel SessionPower Quality Monitoring in Smart Grids
2
Outline
• Introduction• Power Quality and Smart Grid• Issues of Power Quality Monitoring• Review of Power Quality Analysis andDisturbance Detection Techniques
• Case Studies• Conclusions
2
3
Introduction• Enhancement of quality of supply voltage is a keyfunction of realizing the smart grid.
• By means of adopting advanced technologies forpower quality monitoring and metering, waveformcorrection devices, and condition monitoring, thepower quality for both customers and utilities can bemaintained.
• With judicious selections and applications ofdifferent key technologies for the smart grid, powerquality disturbances can be substantially mitigated.
3
4
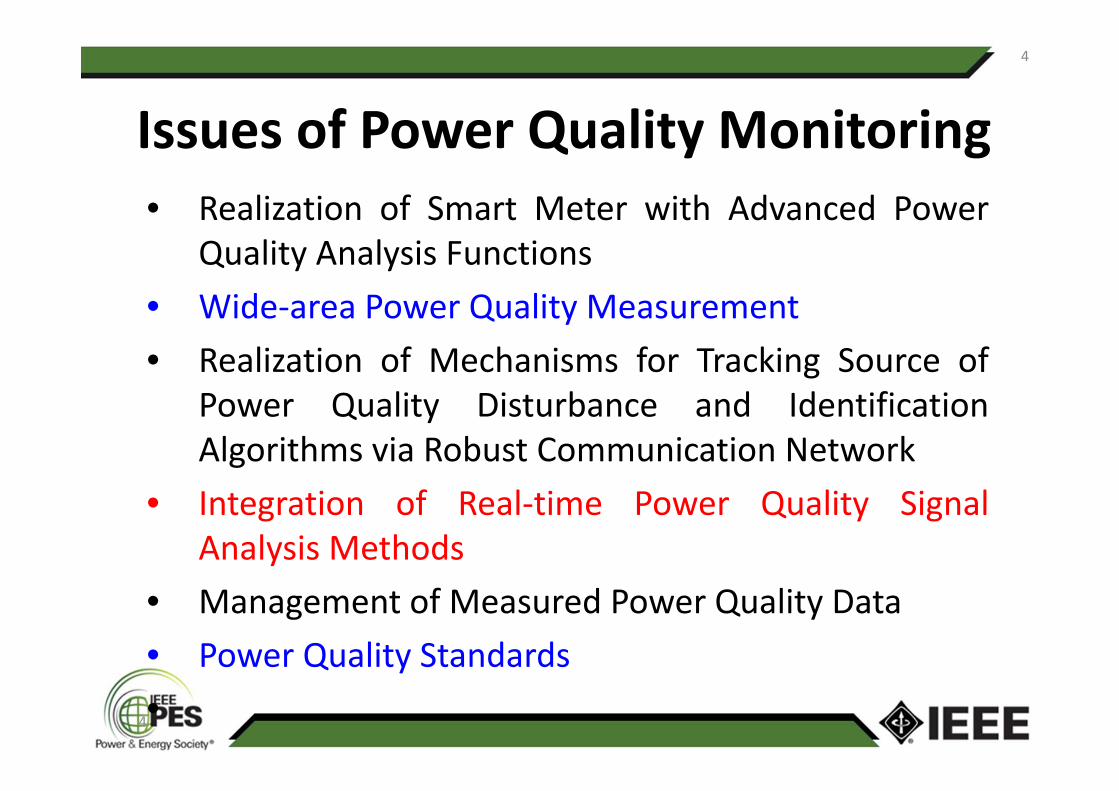
Issues of Power Quality Monitoring• Realization of Smart Meter with Advanced Power
Quality Analysis Functions• Wide‐area Power Quality Measurement• Realization of Mechanisms for Tracking Source of
Power Quality Disturbance and IdentificationAlgorithms via Robust Communication Network
• Integration of Real‐time Power Quality SignalAnalysis Methods
• Management of Measured Power Quality Data• Power Quality Standards•
4
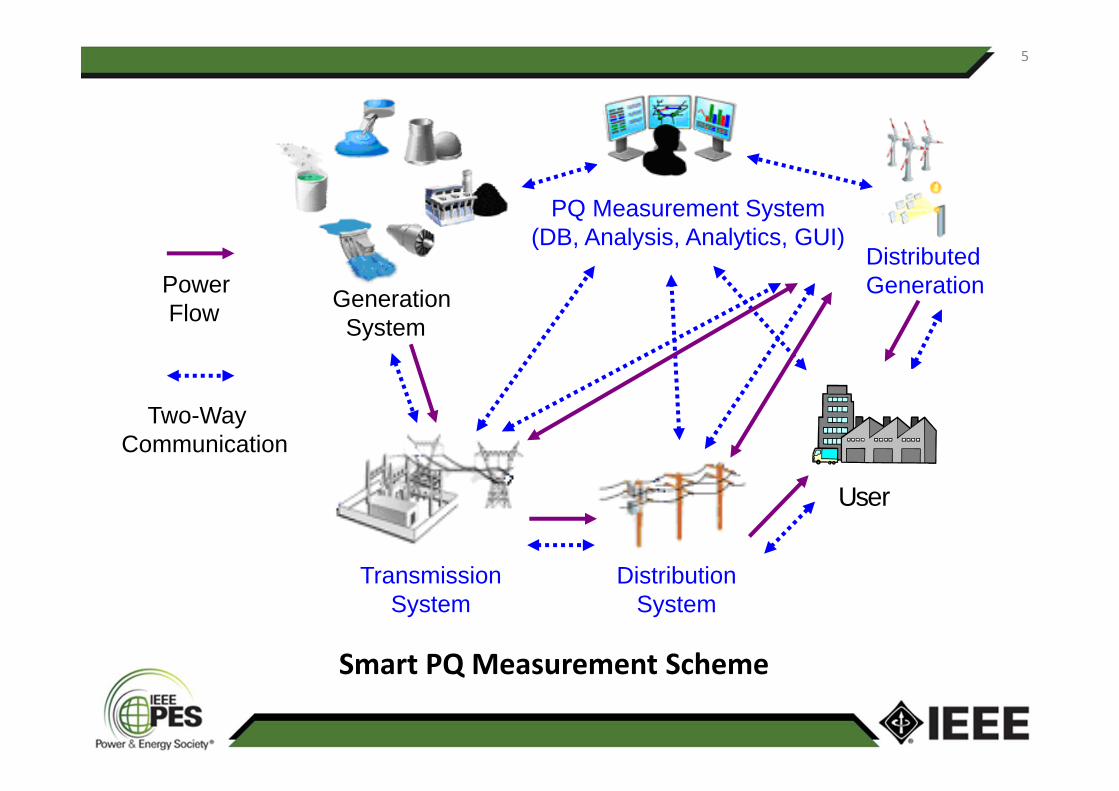
Smart PQ Measurement Scheme
GenerationSystem
Distributed Generation
TransmissionSystem
DistributionSystem
User
PowerFlow
Two-WayCommunication
SCADAPQ Measurement System
(DB, Analysis, Analytics, GUI)
5
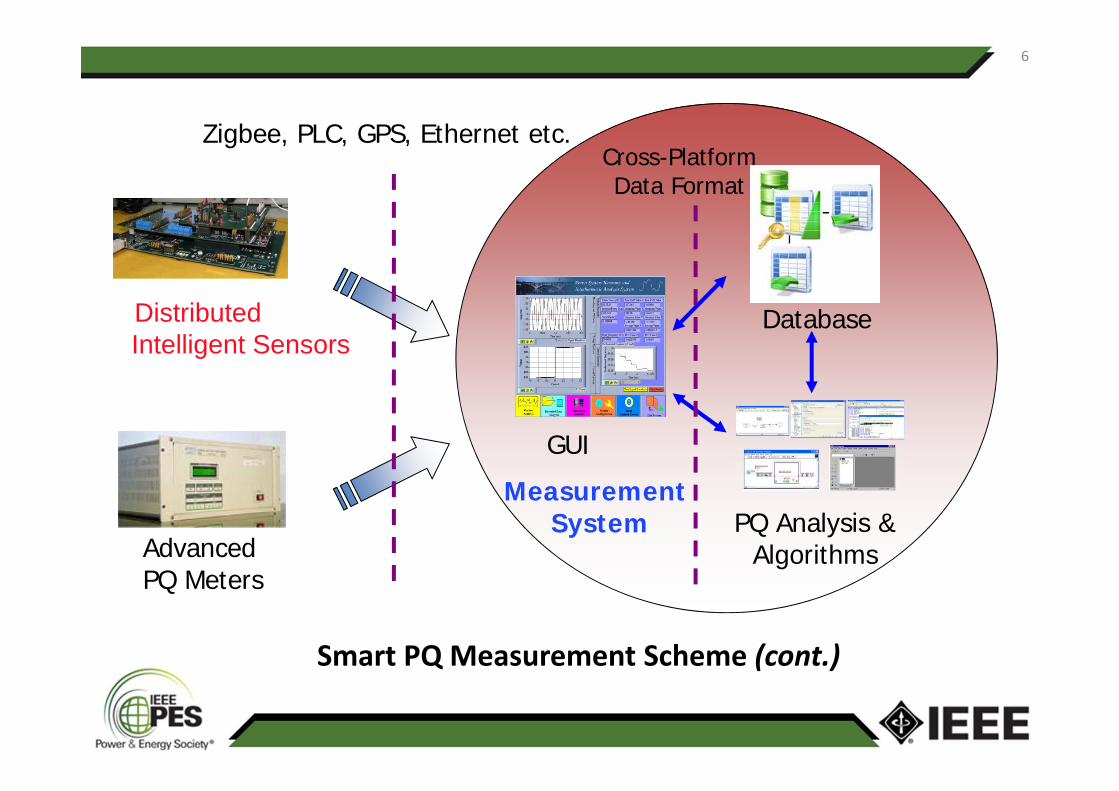
Smart PQ Measurement Scheme (cont.)
PQ Analysis &Algorithms
GUI
DatabaseDistributed Intelligent Sensors
Advanced PQ Meters
Zigbee, PLC, GPS, Ethernet etc.Cross-PlatformData Format
MeasurementSystem
6
7
Review of Power Quality Analysis and Disturbance Detection Techniques
• To achieve the efficient and accurate powerquality measurement under the smart grid, itrequires more advanced analysis anddetection methods.
• The following gives an overview of thetechniques required to perform such analysesand detections.
7
8
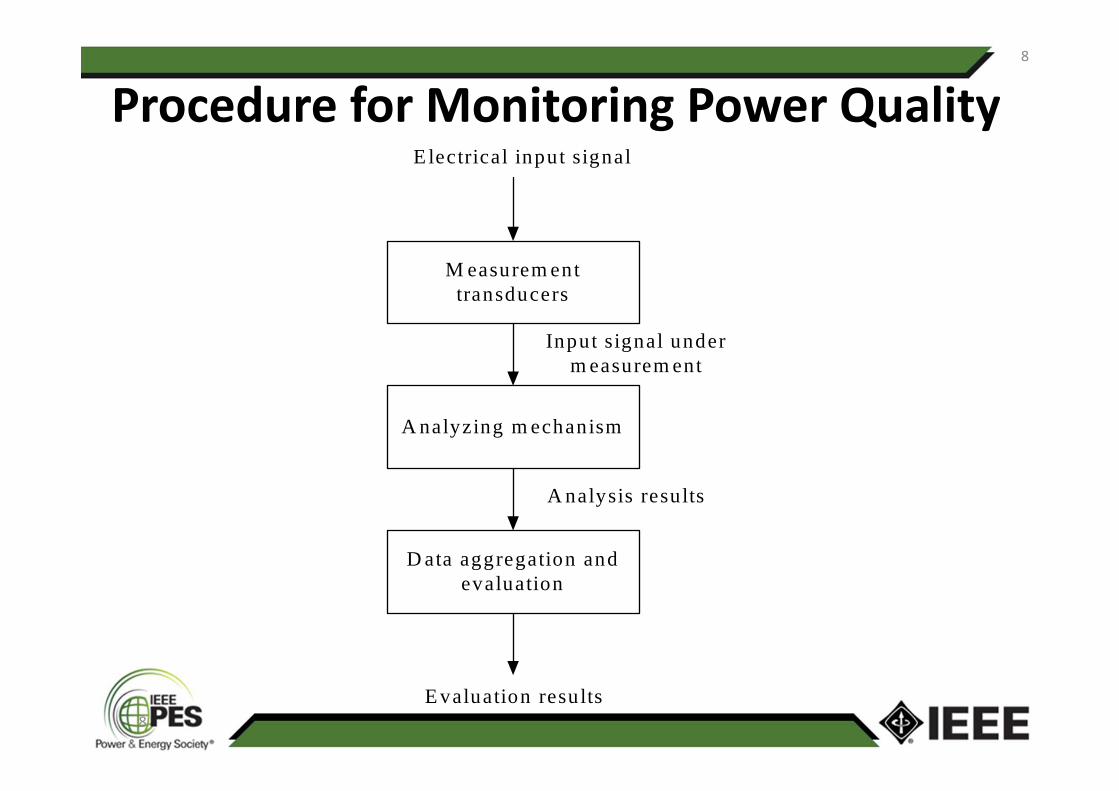
Procedure for Monitoring Power Quality
M easurem ent transducers
E lectrical input signal
Input signal under m easurem ent
A nalyzing m echanism
A nalysis results
D ata aggregation and evaluation
E valuation resu lts
8
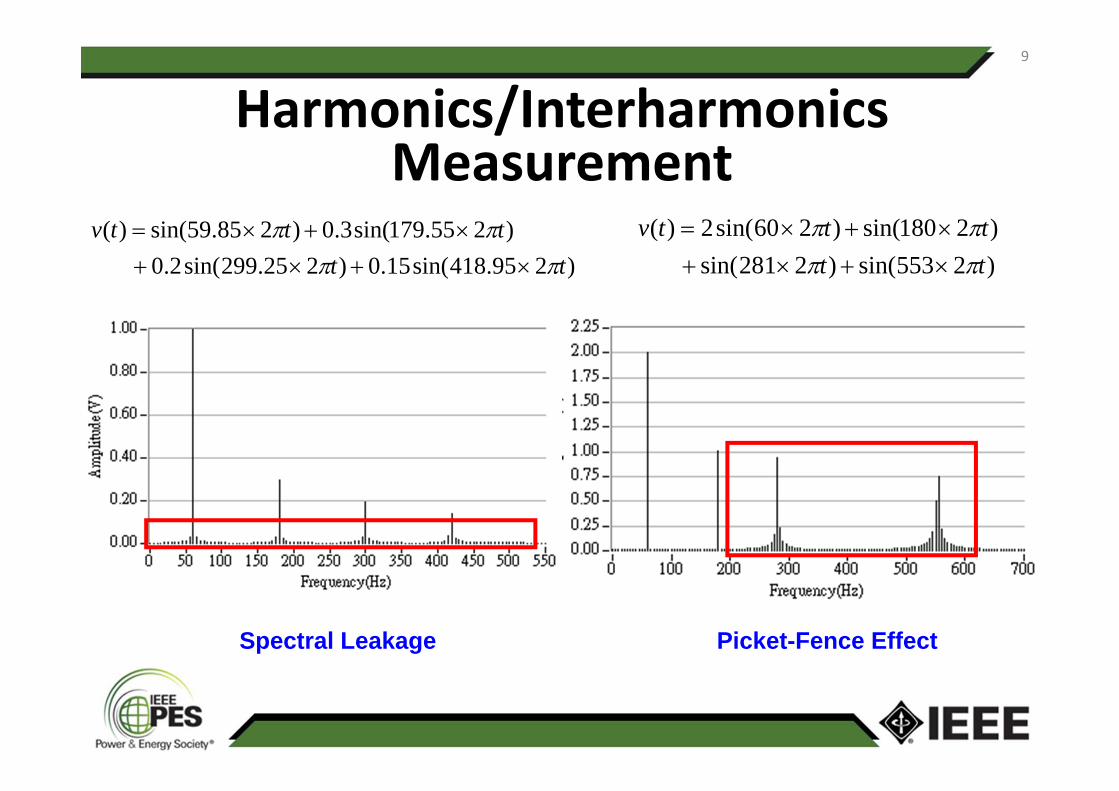
Harmonics/InterharmonicsMeasurement
)295.418sin(15.0)225.299sin(2.0 )255.179sin(3.0)285.59sin()(
tttttv
)2553sin()2281sin( )2180sin()260sin(2)(
tttttv
Spectral Leakage Picket-Fence Effect
9
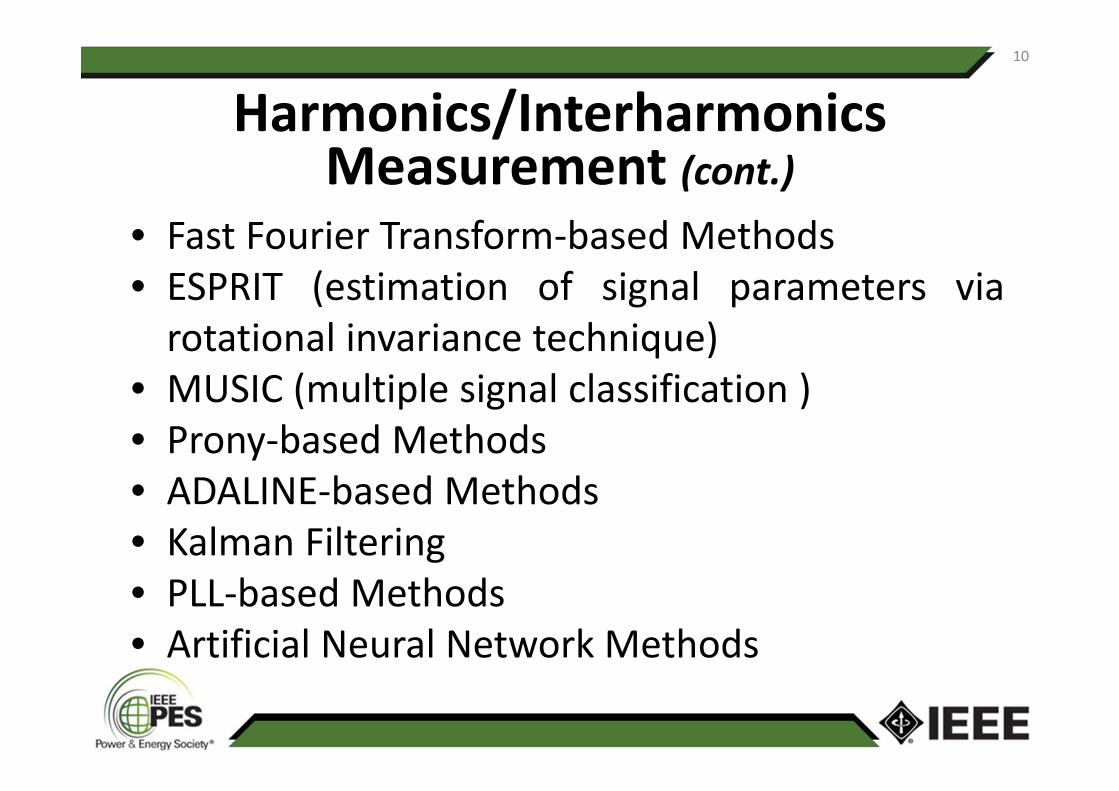
Harmonics/InterharmonicsMeasurement (cont.)
10
• Fast Fourier Transform‐based Methods• ESPRIT (estimation of signal parameters viarotational invariance technique)
• MUSIC (multiple signal classification )• Prony‐based Methods• ADALINE‐based Methods• Kalman Filtering• PLL‐based Methods• Artificial Neural Network Methods
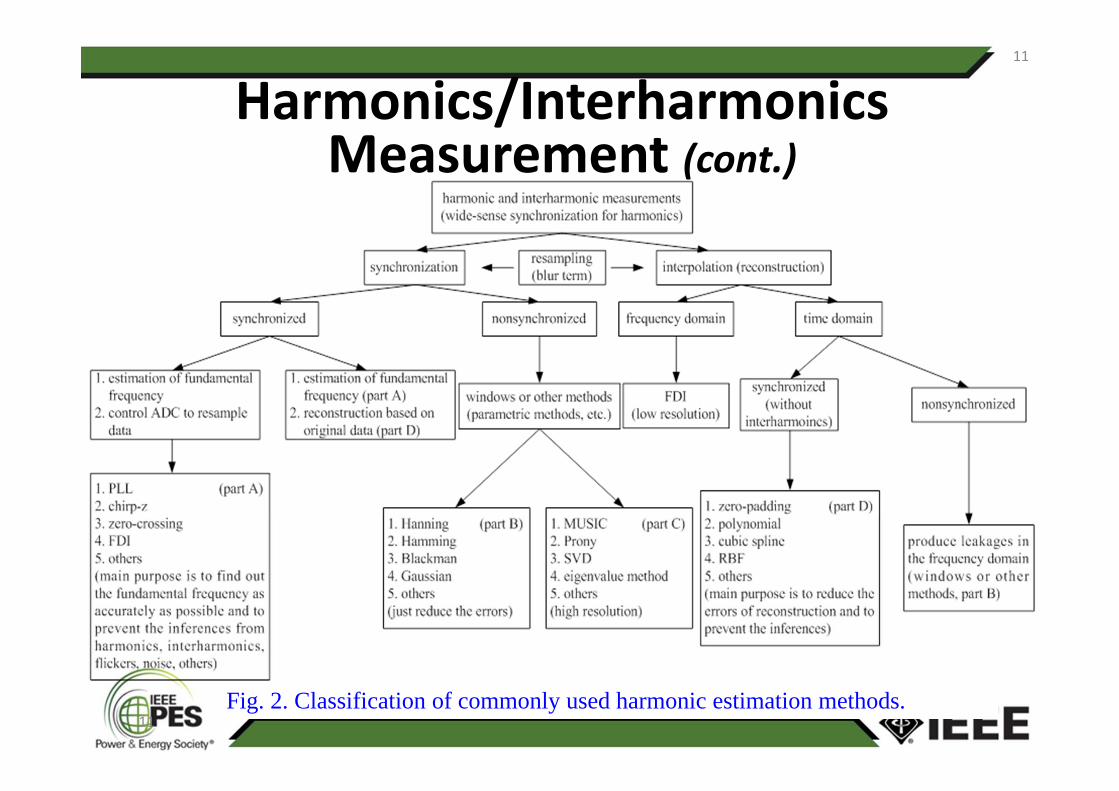
11Fig. 2. Classification of commonly used harmonic estimation methods.
11
Harmonics/InterharmonicsMeasurement (cont.)
12
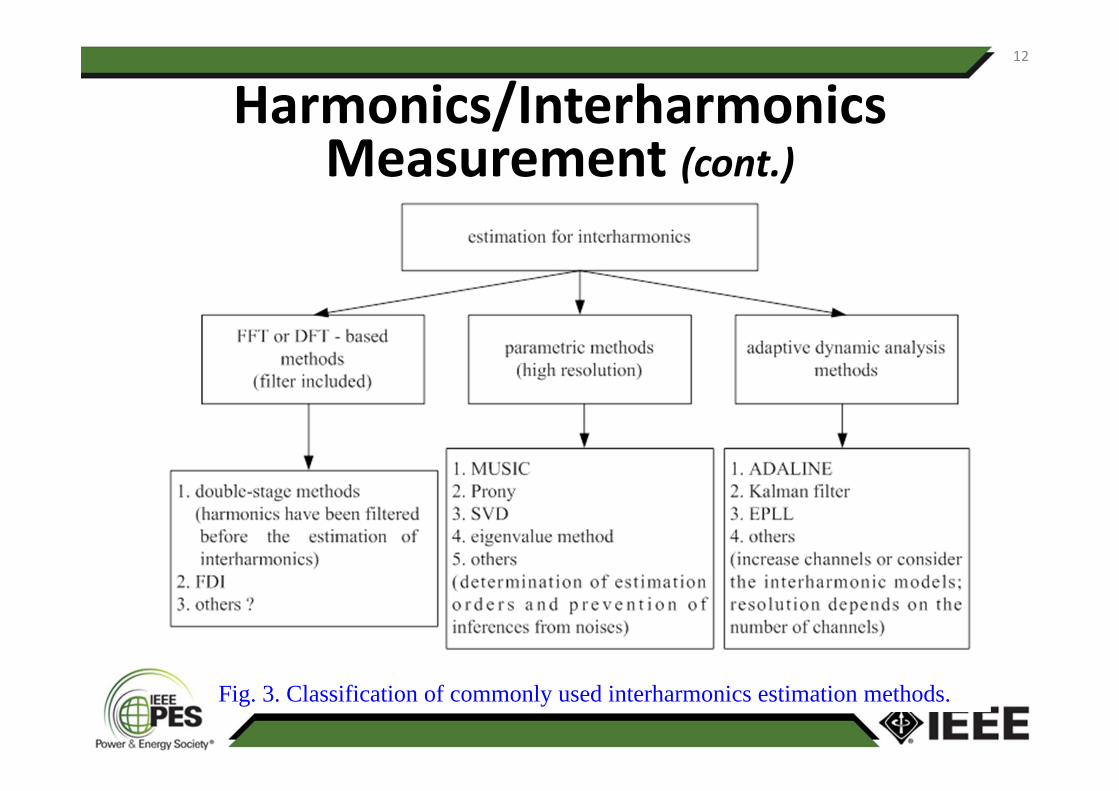
Fig. 3. Classification of commonly used interharmonics estimation methods.
Harmonics/InterharmonicsMeasurement (cont.)
Flicker Measurement• IEC Flickermeter• Squaring Demodulation Method• Discrete Wavelet Synchronous DetectionMethod
• ADALINE Detection Method• EPLL Detection Method• New Approaches
13
14
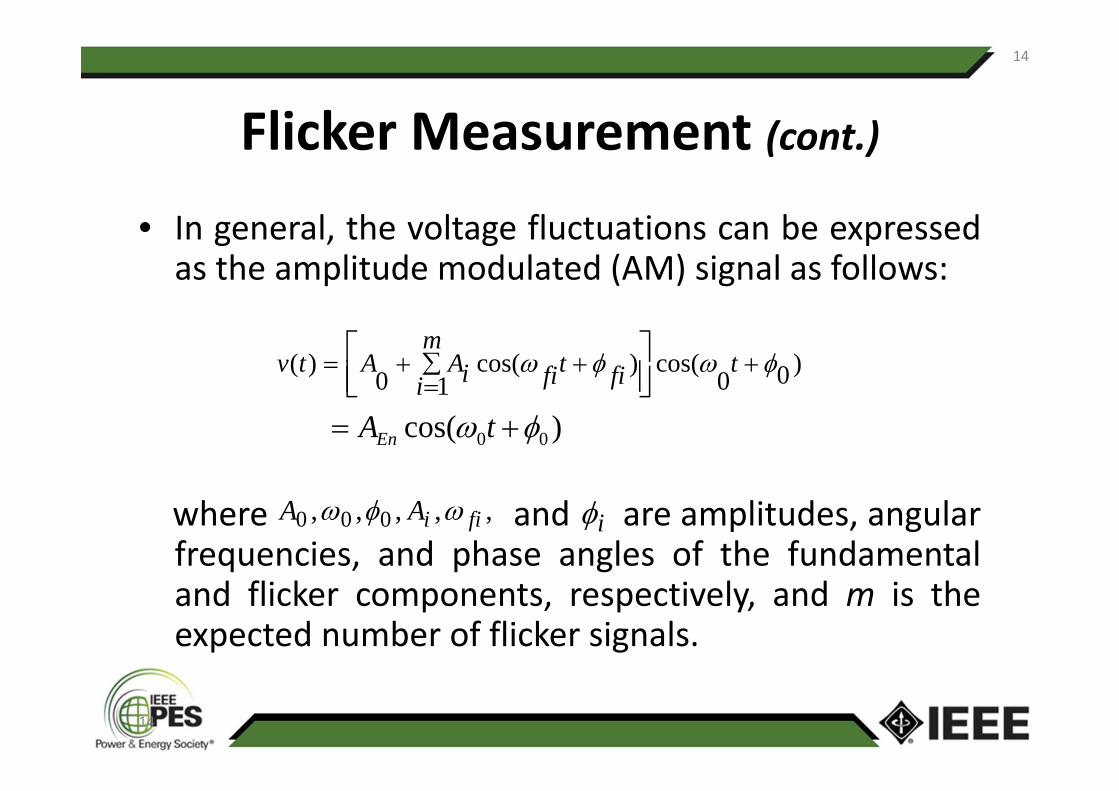
Flicker Measurement (cont.)• In general, the voltage fluctuations can be expressedas the amplitude modulated (AM) signal as follows:
where and are amplitudes, angularfrequencies, and phase angles of the fundamentaland flicker components, respectively, and m is theexpected number of flicker signals.
)cos( 00
)00cos(
1)cos(
0)(
tAEn
tm
i fitfiiAAtv
,,,,, 000 fiiAA i
14
Flicker Measurement (cont.)
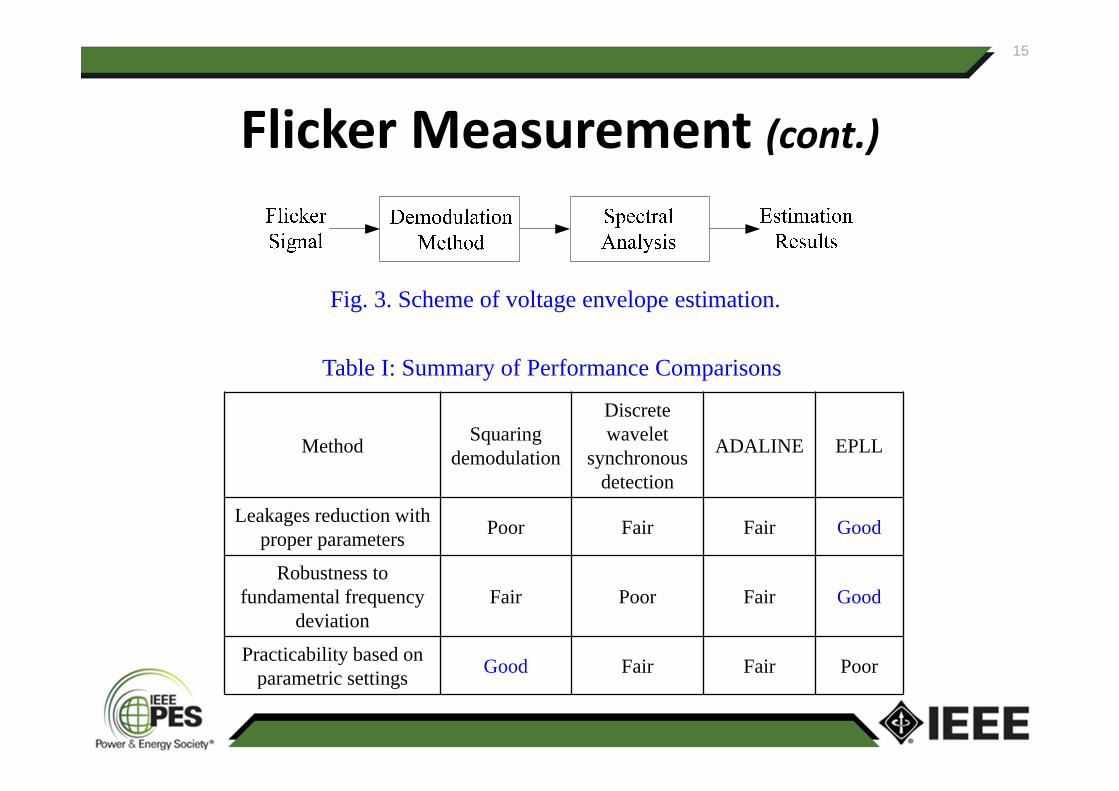
Fig. 3. Scheme of voltage envelope estimation.
Table I: Summary of Performance Comparisons
15
Method Squaring demodulation
Discrete wavelet
synchronousdetection
ADALINE EPLL
Leakages reduction with proper parameters Poor Fair Fair Good
Robustness to fundamental frequency
deviationFair Poor Fair Good
Practicability based on parametric settings Good Fair Fair Poor
16
Voltage Sag Detections
• The analysis for voltage disturbance eventscan be roughly grouped into two categories:– Detection Process: it is designed to identify theoccurrences of events and trigger thecorresponding automation and protectionmechanisms.
– Classification Process: it is mainly used to identifythe types of events according to differentproperties of power quality disturbances.
16
17
Voltage Sag Detections (cont.)17
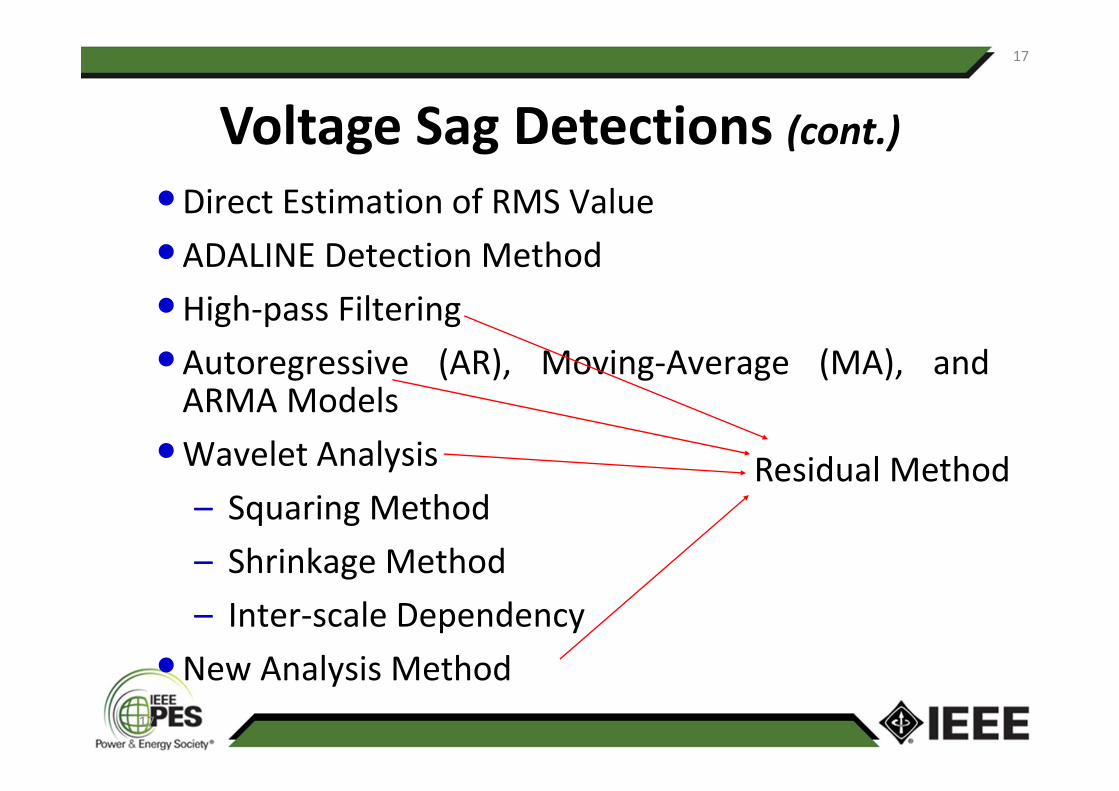
•Direct Estimation of RMS Value•ADALINE Detection Method•High‐pass Filtering•Autoregressive (AR), Moving‐Average (MA), andARMA Models
•Wavelet Analysis– Squaring Method– Shrinkage Method– Inter‐scale Dependency
•New Analysis Method
Residual Method
18
Voltage Sag Detections
• Several parameters of power quality events are necessary to be identified:– Starting‐time localization of events– Ending‐time localization of events– Duration of events– Classification of events– Variation of events
18
19
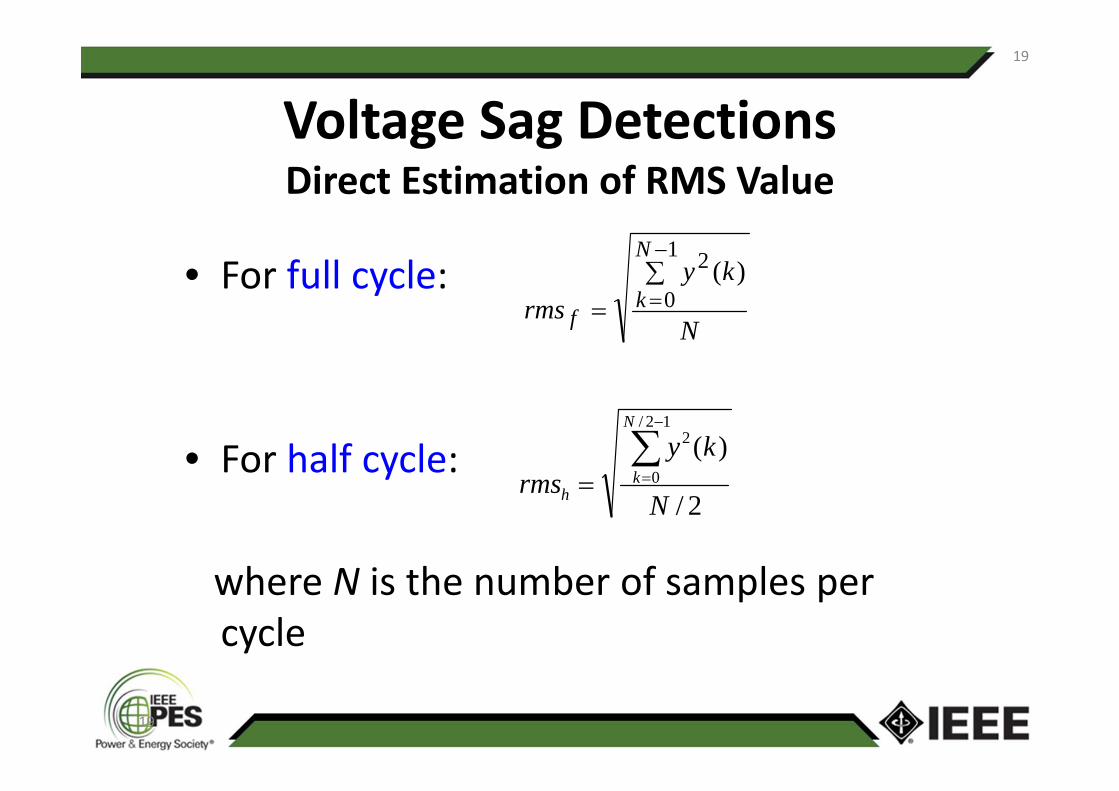
Voltage Sag DetectionsDirect Estimation of RMS Value
• For full cycle:
• For half cycle:
where N is the number of samples per cycle
N
kyrms
N
kf
1
0
2 )(
2/
)(12/
0
2
N
kyrms
N
kh
19
20
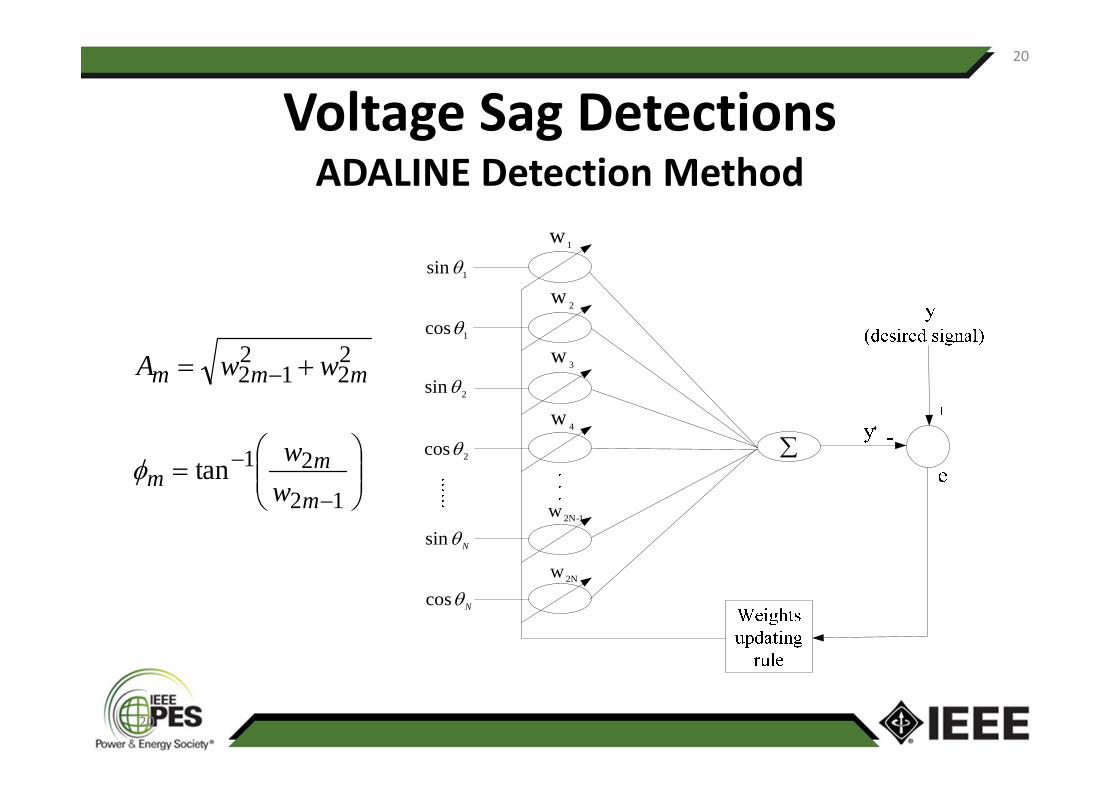
Voltage Sag DetectionsADALINE Detection Method
22
212 mmm wwA
12
21tanm
mm w
w
1w
2w
3w
4w
1-2Nw
2Nw
1sin
1 cos
2sin
2 cos
Nsin
N cos
20
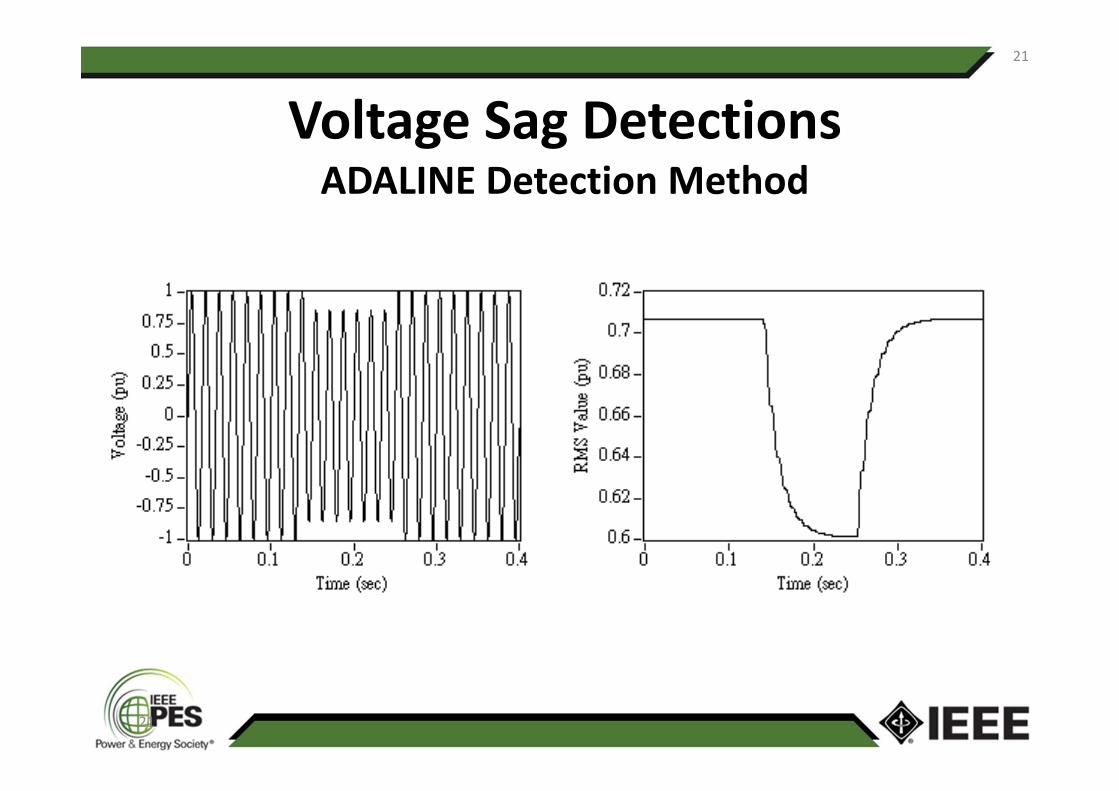
21
Voltage Sag DetectionsADALINE Detection Method
21
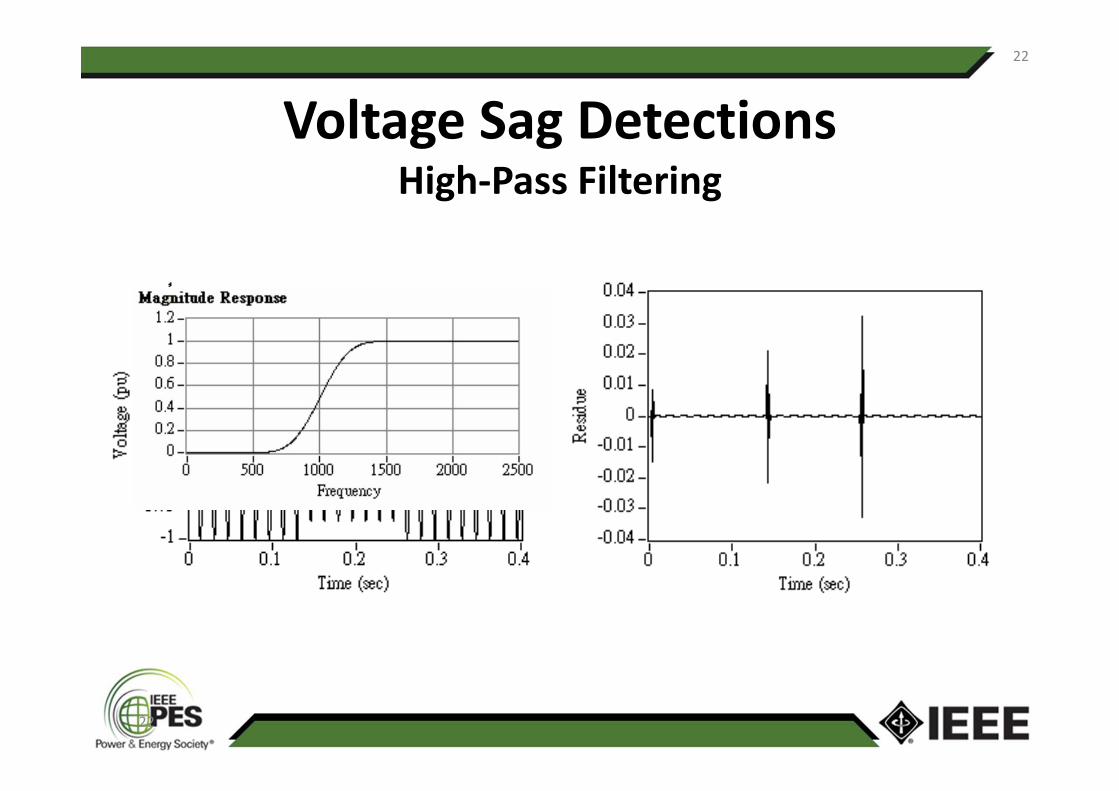
22
Voltage Sag DetectionsHigh‐Pass Filtering
22
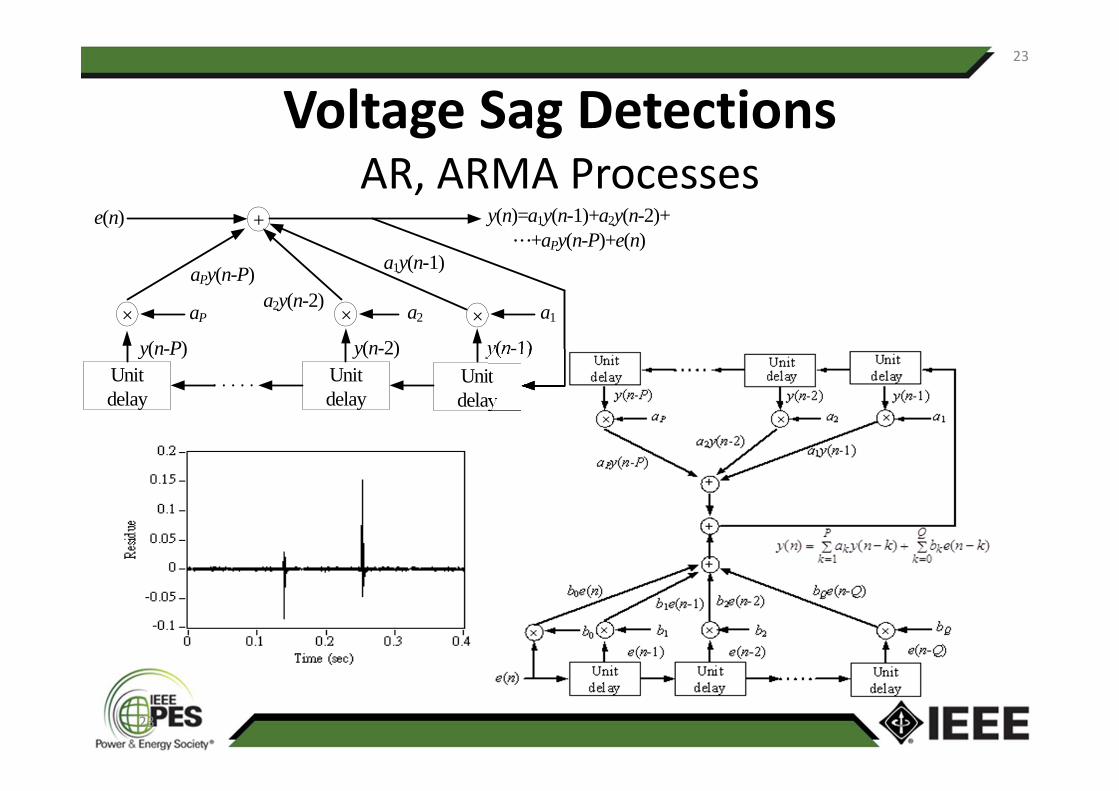
23
+
×
Unitdelay
×
Unitdelay
×
Unitdelay
e(n)
a1
y(n-1)
a2
y(n-2)
aP
y(n-P)
aPy(n-P)a2y(n-2)
a1y(n-1)
y(n)=a1y(n-1)+a2y(n-2)+…+aPy(n-P)+e(n)
Voltage Sag DetectionsAR, ARMA Processes
23
24
Voltage Sag DetectionsWavelet Analysis
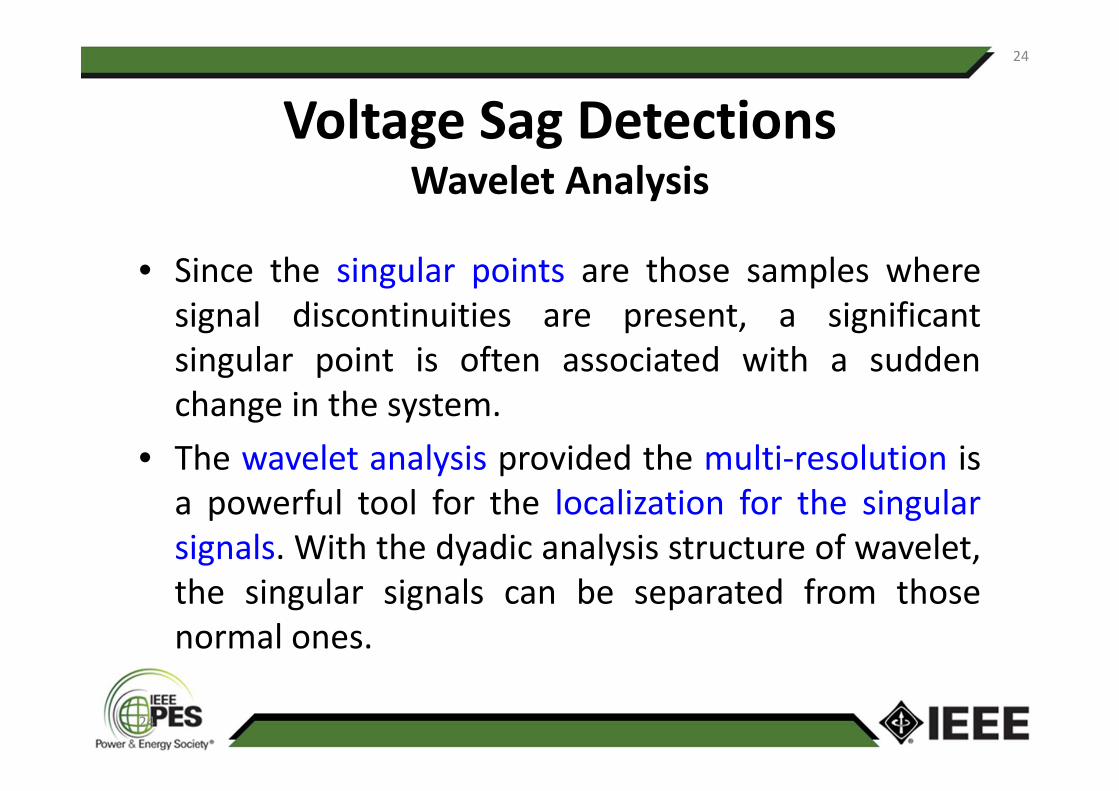
• Since the singular points are those samples wheresignal discontinuities are present, a significantsingular point is often associated with a suddenchange in the system.
• The wavelet analysis provided the multi‐resolution isa powerful tool for the localization for the singularsignals. With the dyadic analysis structure of wavelet,the singular signals can be separated from thosenormal ones.
24
25
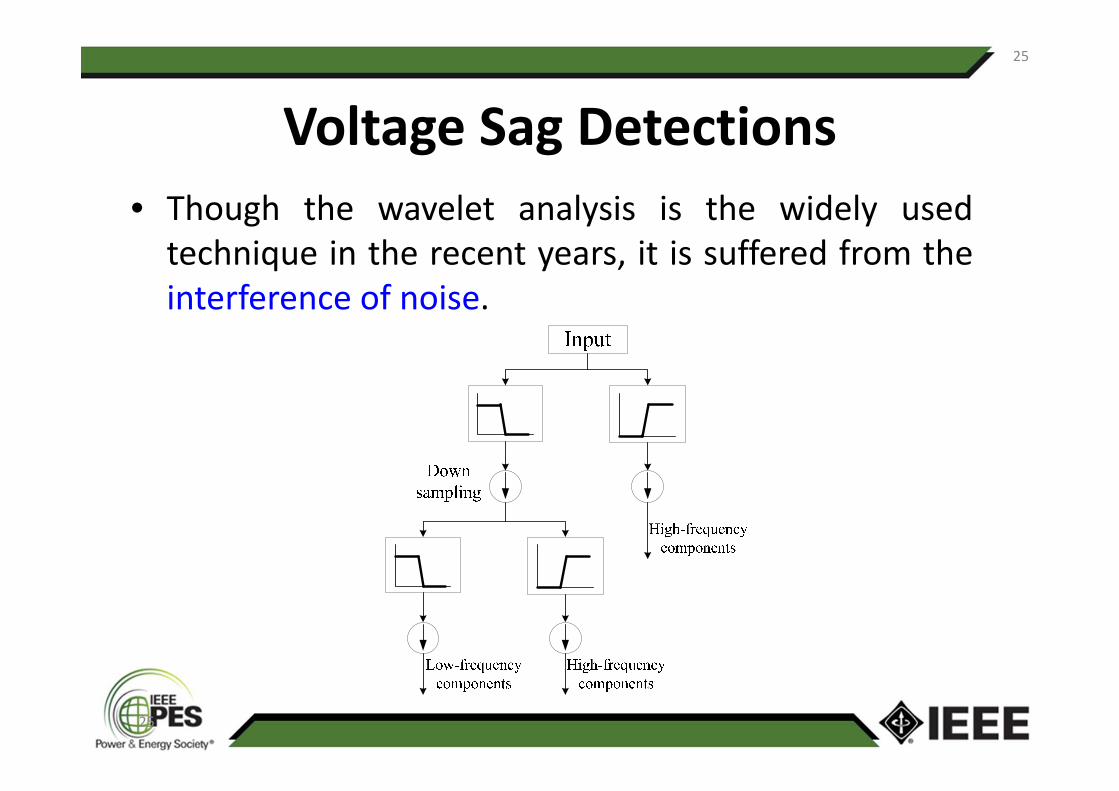
Voltage Sag Detections• Though the wavelet analysis is the widely usedtechnique in the recent years, it is suffered from theinterference of noise.
25
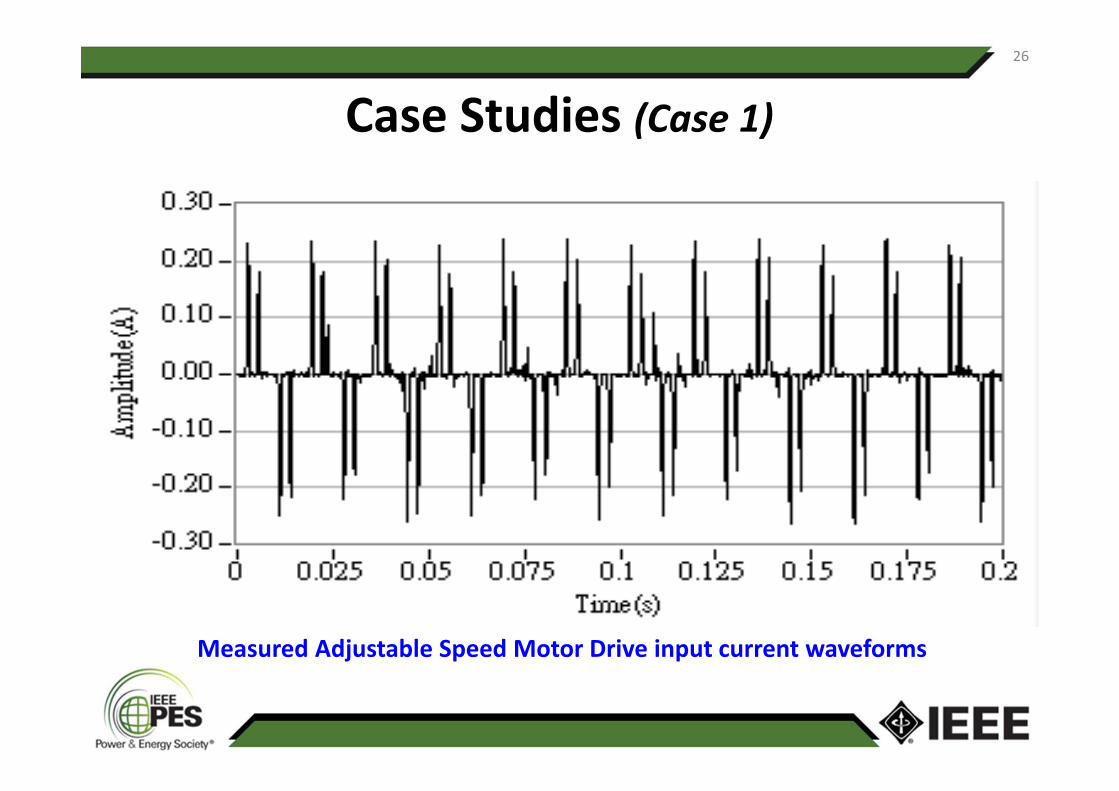
Case Studies (Case 1)
Measured Adjustable Speed Motor Drive input current waveforms
26
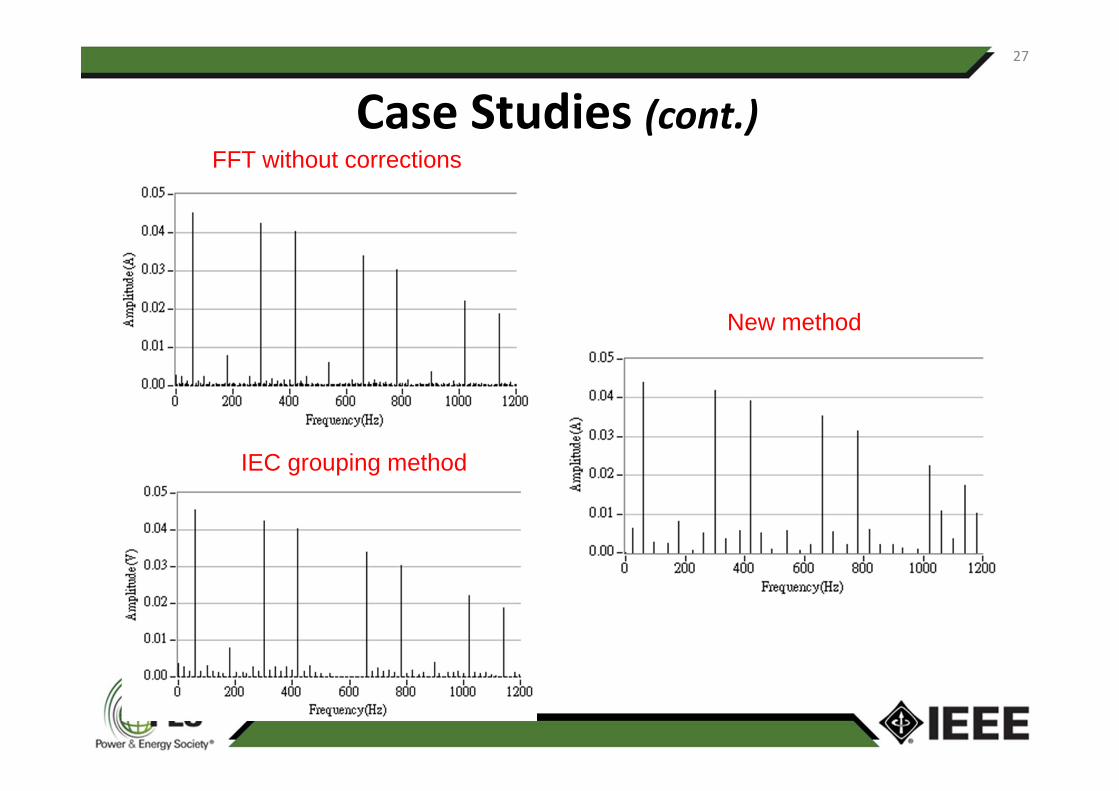
Case Studies (cont.)FFT without corrections
IEC grouping method
New method
27
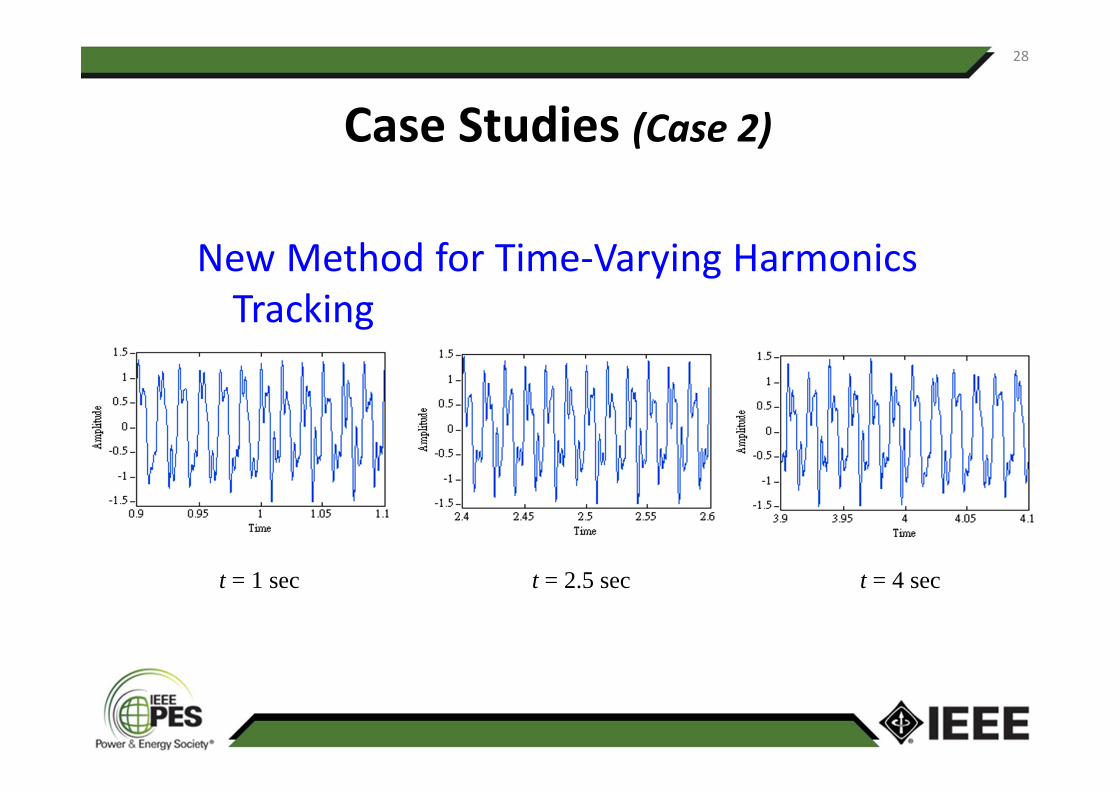
Case Studies (Case 2)
New Method for Time‐Varying HarmonicsTracking
t = 1 sec t = 2.5 sec t = 4 sec
28
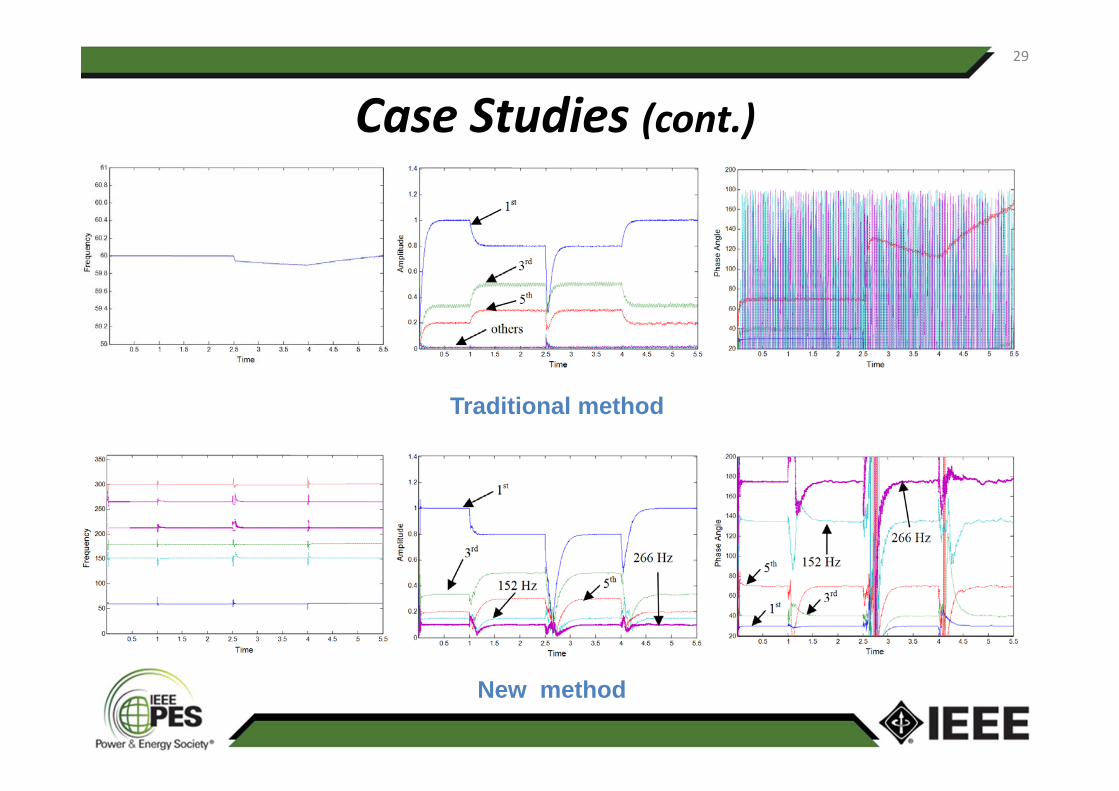
Case Studies (cont.)
Traditional method
New method
29
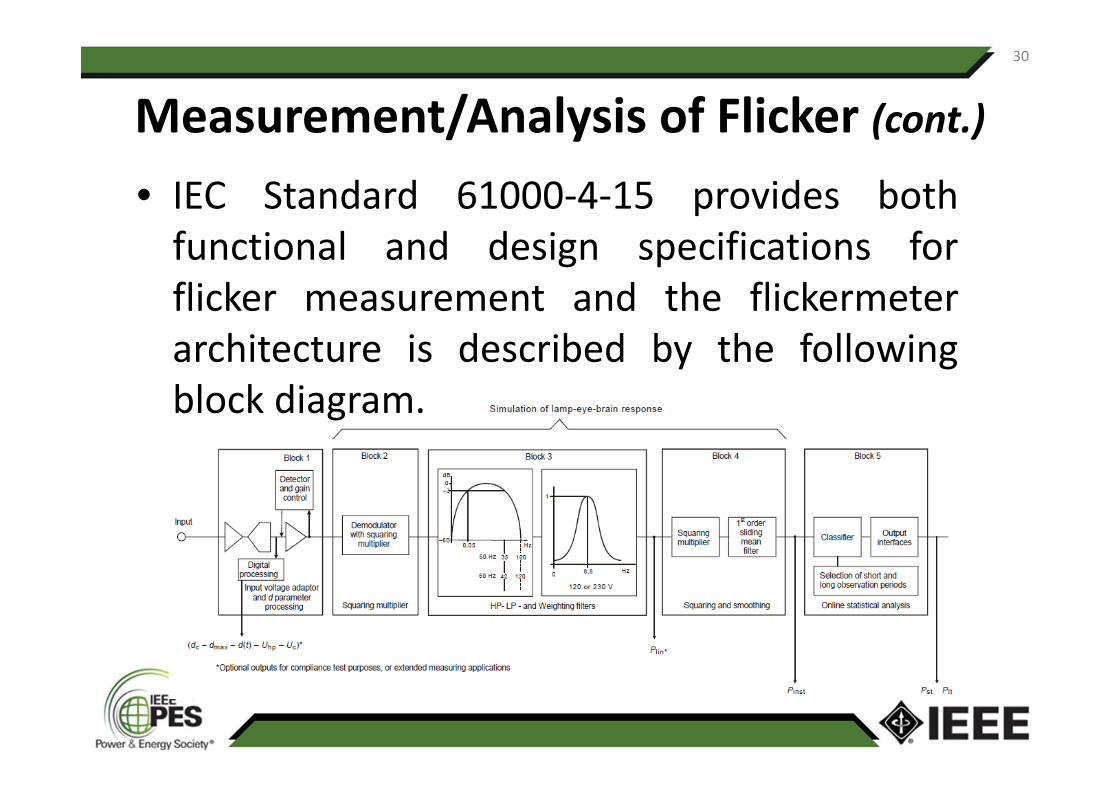
Measurement/Analysis of Flicker (cont.)• IEC Standard 61000‐4‐15 provides bothfunctional and design specifications forflicker measurement and the flickermeterarchitecture is described by the followingblock diagram.
30
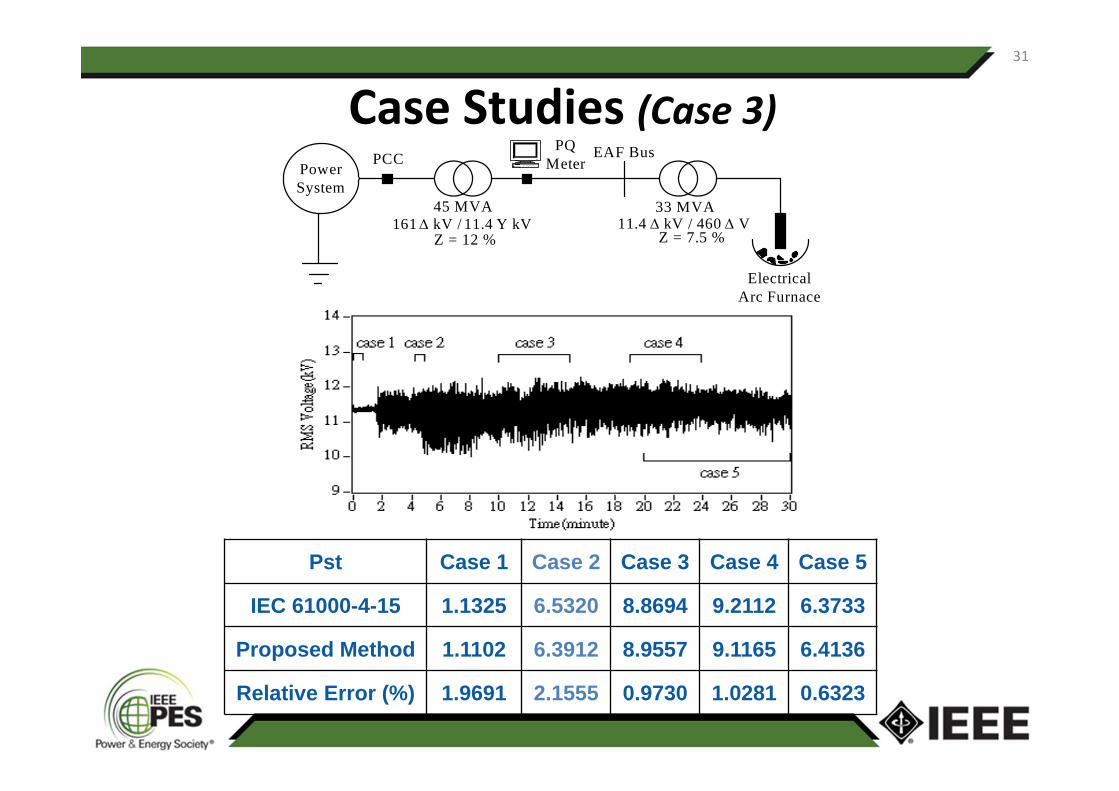
Case Studies (Case 3)
Pst Case 1 Case 2 Case 3 Case 4 Case 5
IEC 61000-4-15 1.1325 6.5320 8.8694 9.2112 6.3733
Proposed Method 1.1102 6.3912 8.9557 9.1165 6.4136
Relative Error (%) 1.9691 2.1555 0.9730 1.0281 0.6323
Power System
45 MVAkV Y 4.11 / kV 161
33 MVAV 604 / kV 4.11
PCC
Electrical Arc Furnace
PQMeter
EAF Bus
Z = 12 % Z = 7.5 %
31
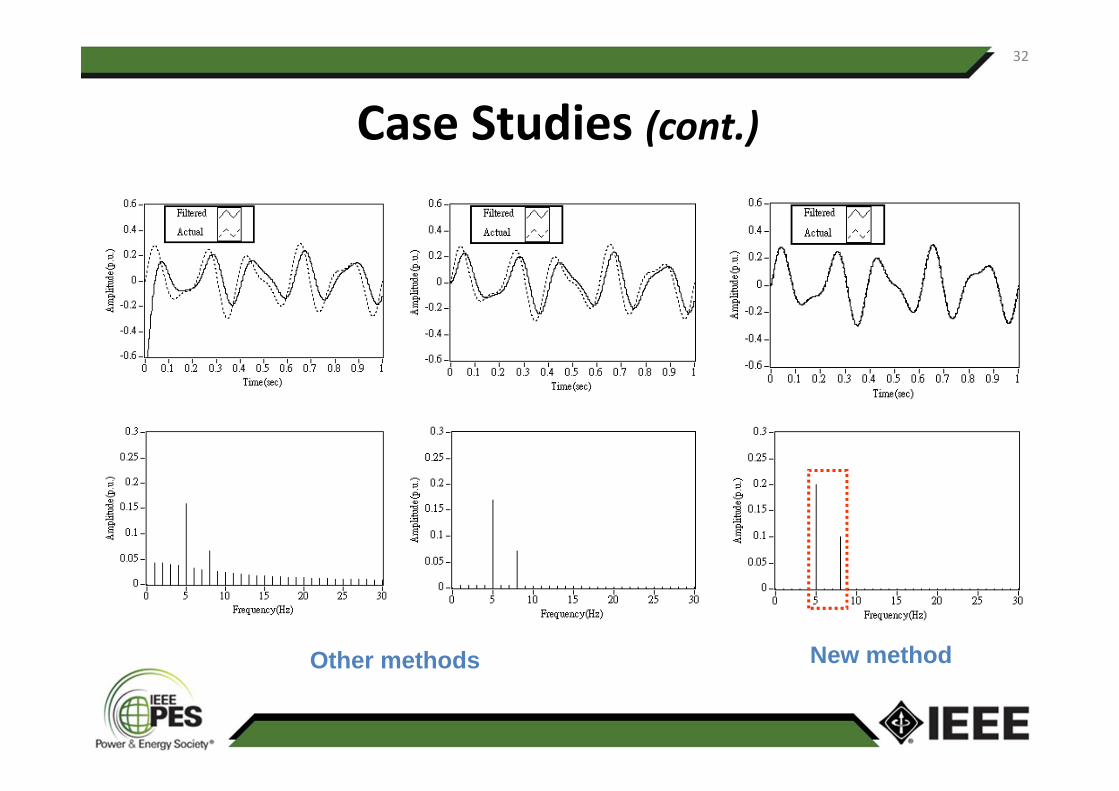
Case Studies (cont.)
Other methods New method
32
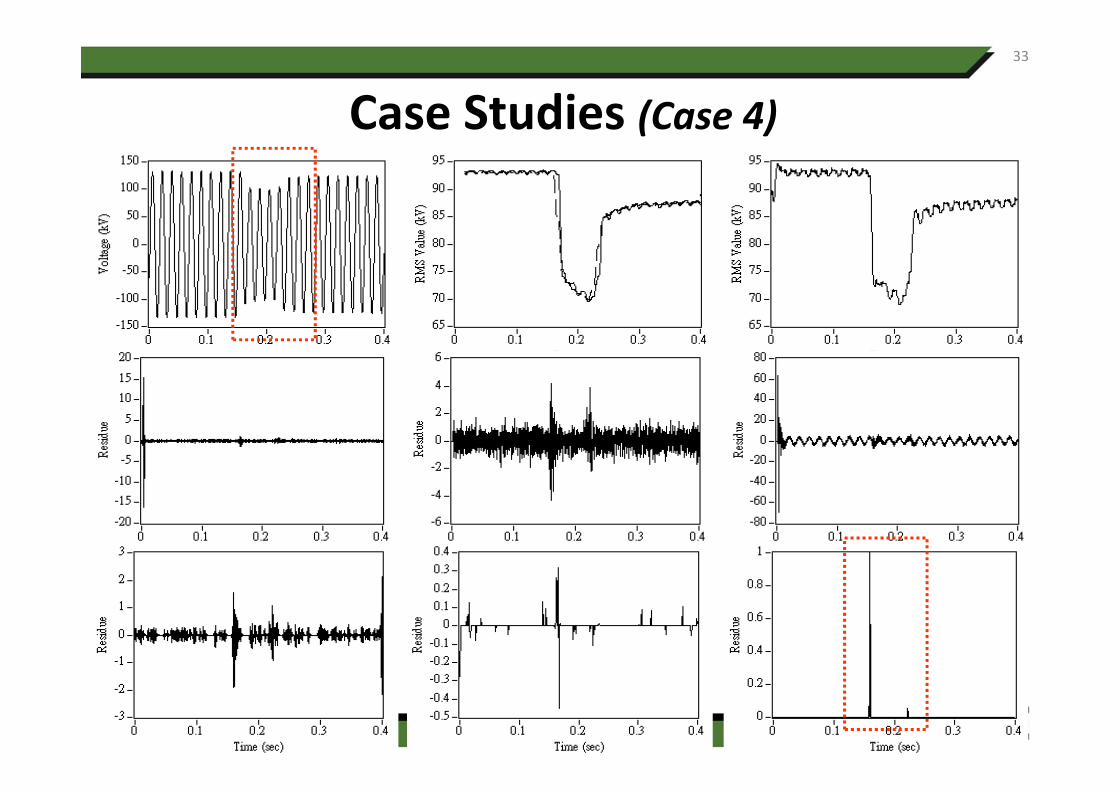
Case Studies (Case 4)33
34
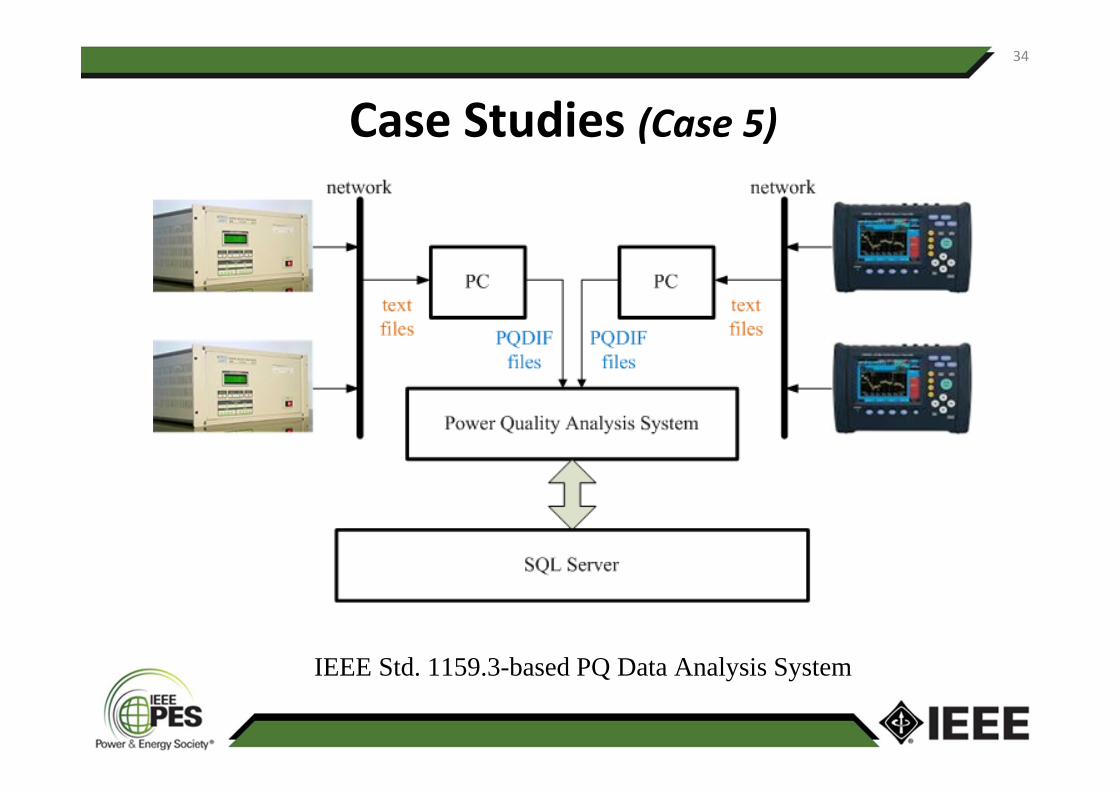
IEEE Std. 1159.3-based PQ Data Analysis System
Case Studies (Case 5)
35
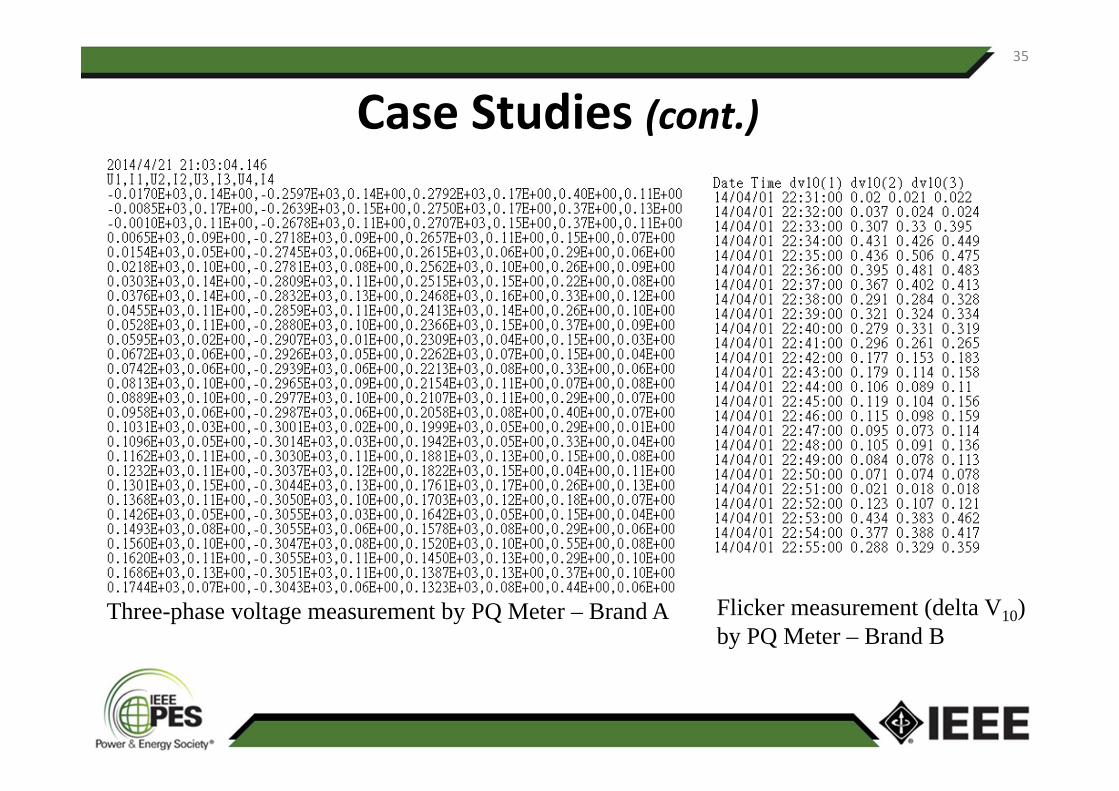
Three-phase voltage measurement by PQ Meter – Brand A Flicker measurement (delta V10) by PQ Meter – Brand B
Case Studies (cont.)
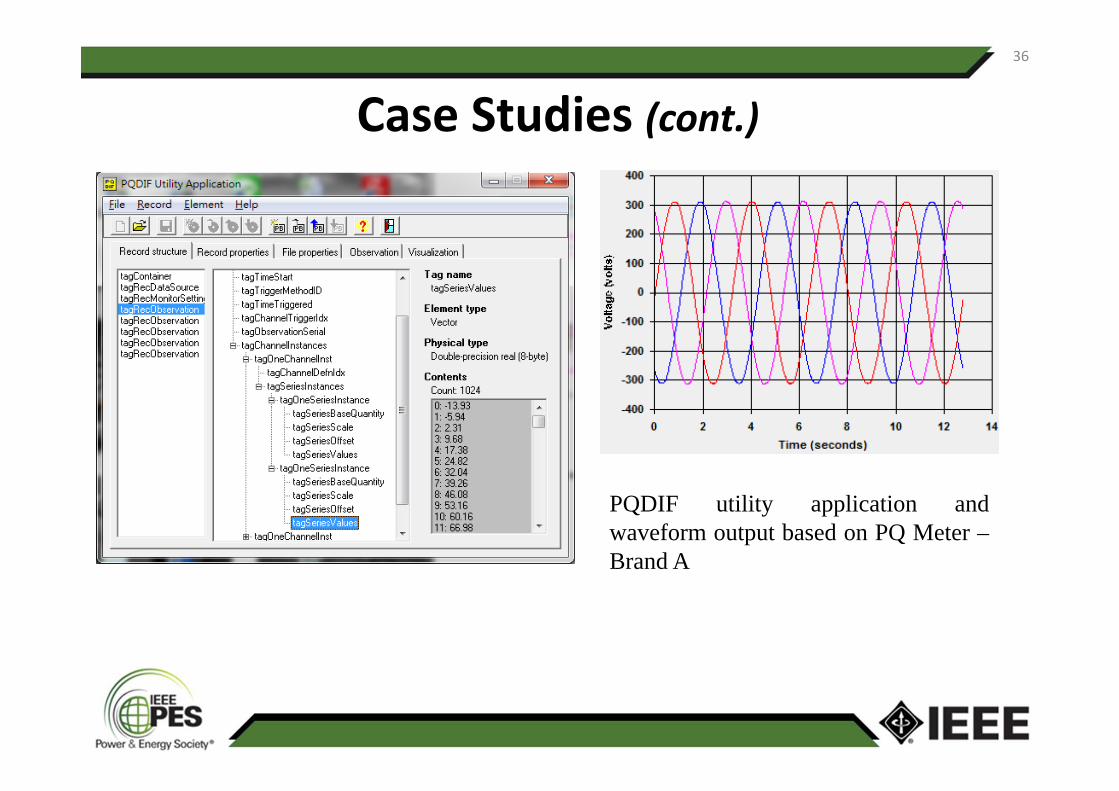
36
PQDIF utility application andwaveform output based on PQ Meter –Brand A
Case Studies (cont.)
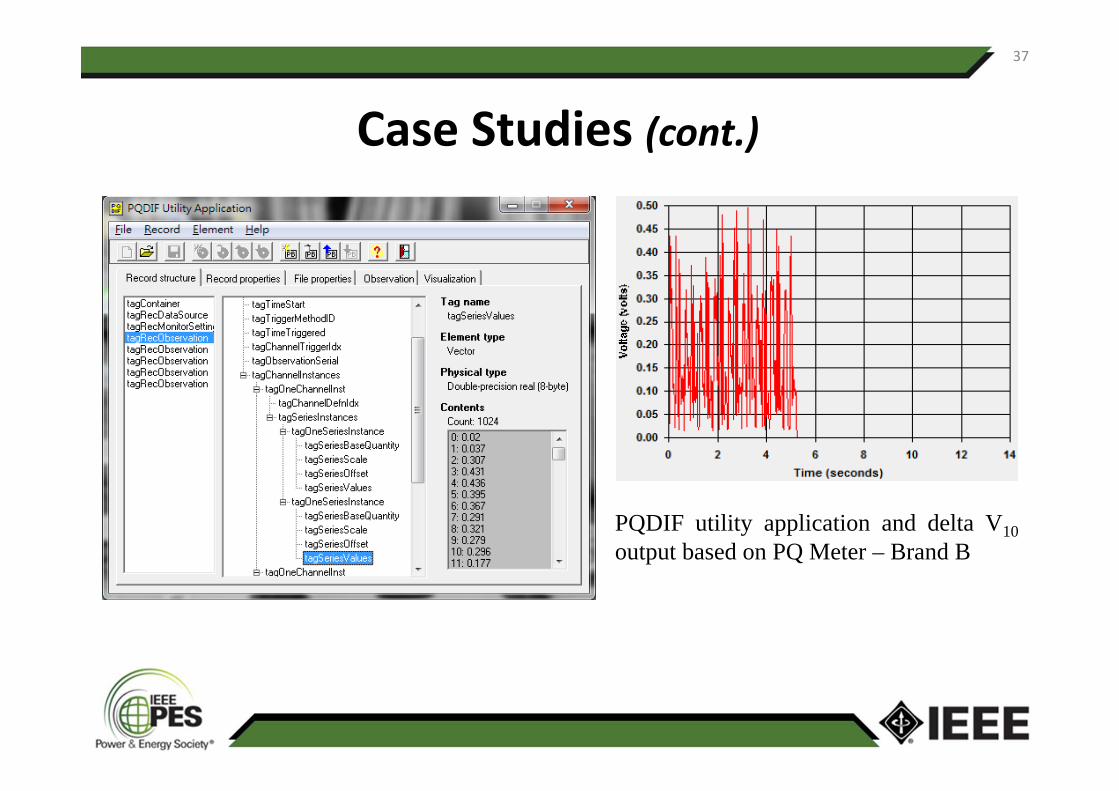
37
PQDIF utility application and delta V10output based on PQ Meter – Brand B
Case Studies (cont.)
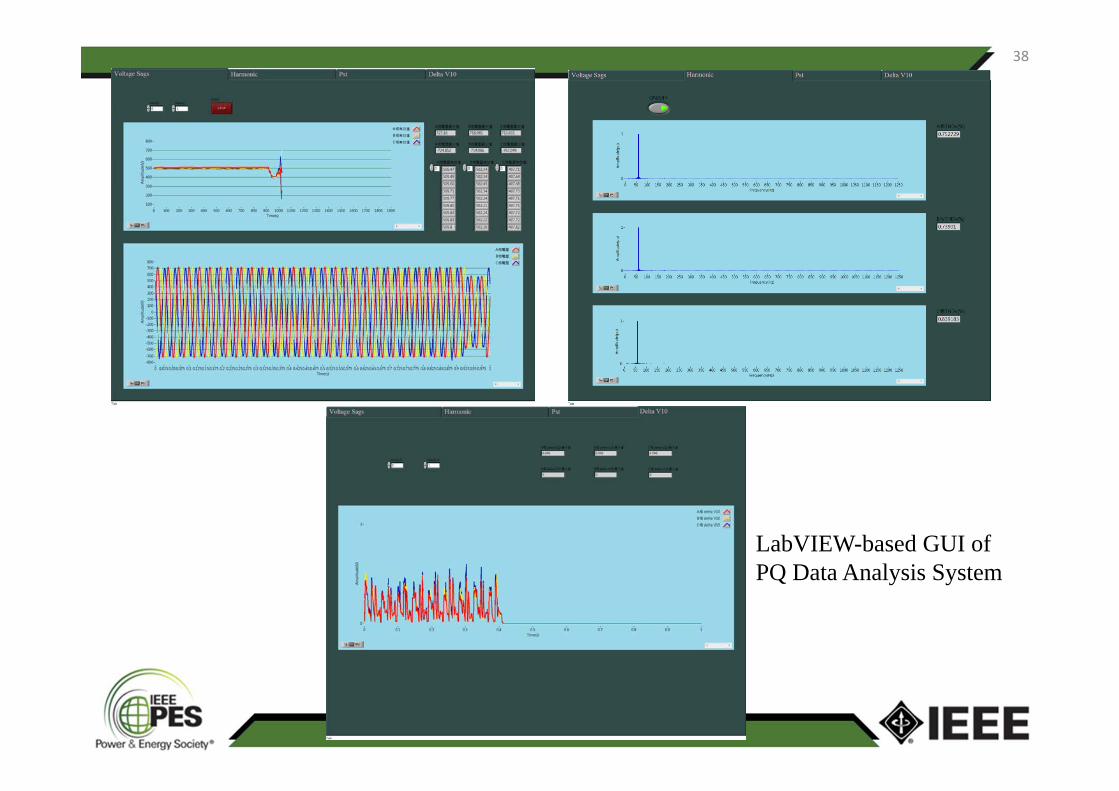
38
LabVIEW-based GUI of PQ Data Analysis System
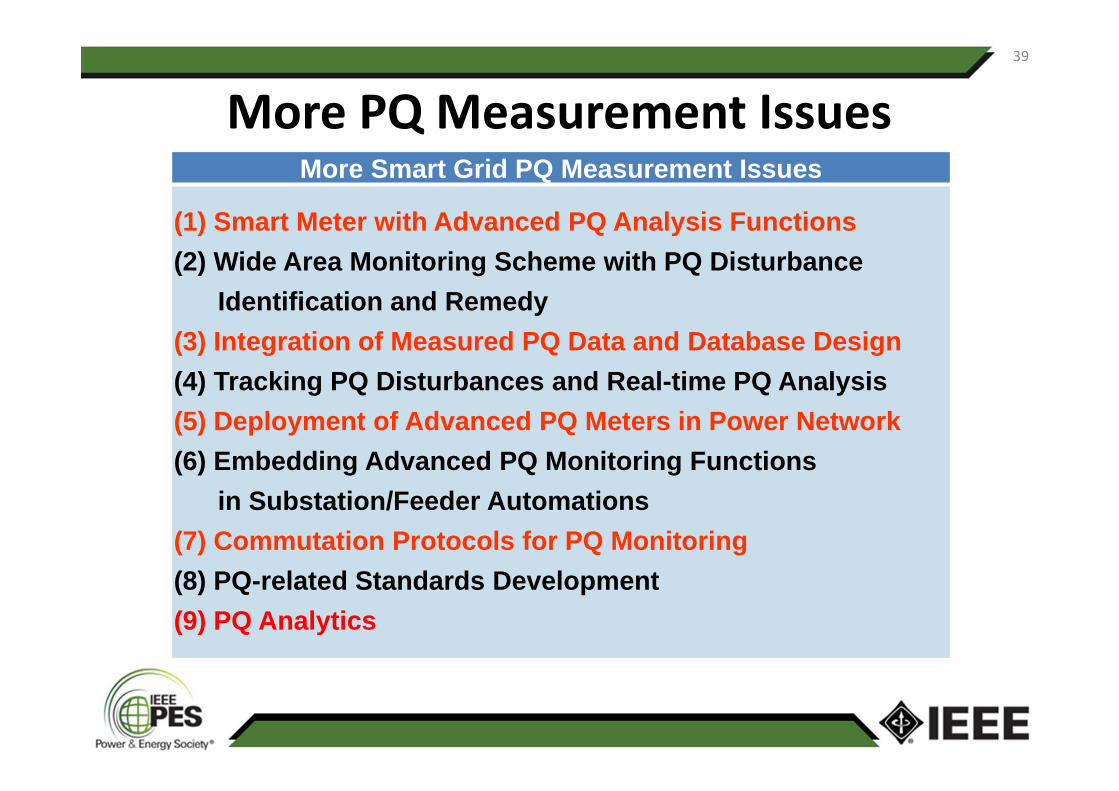
More PQ Measurement IssuesMore Smart Grid PQ Measurement Issues
(1) Smart Meter with Advanced PQ Analysis Functions(2) Wide Area Monitoring Scheme with PQ Disturbance
Identification and Remedy(3) Integration of Measured PQ Data and Database Design(4) Tracking PQ Disturbances and Real-time PQ Analysis(5) Deployment of Advanced PQ Meters in Power Network(6) Embedding Advanced PQ Monitoring Functions
in Substation/Feeder Automations(7) Commutation Protocols for PQ Monitoring(8) PQ-related Standards Development(9) PQ Analytics
39
40
Conclusions• Several commonly used signal processing techniquesfor analysis of harmonics, flickers, sags, swells, andinterruptions are introduced.
• The communication mechanism and information systemdeployment for power quality monitoring system becomecritical factors for the success of smart grid.
• The power quality measurement system shall record thedetail waveforms during the fault and rms values of voltageand current. To different venders of power quality meters,associated issues of interoperationability and relatedstandards must be taken into account.
40


![000’(-...P7 Ł7 O PQ P ƒ7 Q P7 R S7 M12 ƒ[/ 012! P7 Ł7 O PQ? @7 O PQ V ₁12 X,2 / 012 &&" P7 Ł7 O PQ PH uH • MN2 uQ ó PQ è Q í @12 O PQ º ˇ7 u] &(& P7 Ł7 O PQ Y ⁄2](https://img.pdfslide.us/doc/110x75/5f061dee7e708231d4165fd6/000a-p7-7-o-pq-p-7-q-p7-r-s7-m12-012-p7-7-o-pq-7-o-pq-v-a12.jpg)