Embed Size (px)
Citation preview
109. Lin ZY, Chen JDZ, McCallum RW, Parolisi S, Shifflett J,Peura D. The prevalence of electrogastrogram abnormalitiesinpatientswith non-ulcer andH.pylori infection: resultsofH.pylori eradication. Dig Dis Sci 2001;46(4):739–745.
110. Stern RM, Koch KL, Leibowitz HW, Lindblad I, Shupert C,Stewart WR. Tachygastria and motion sickness. AviatSpace Environ Med 1985;56:1074–1077.
111. Koch KL, Tran TN, Stern RM, Bringaman S, et al.Gastricmyoelectrical activity in premature and term infants. JGastrointest Motil 1993;5:41–47.
112. Koch KL, Bringaman S, Tran TN, Stern RM. Visceralperceptions and gastric myoelectrical activity in healthywomen and in patients with bulimia nervosa. Neurogastro-netrol Motil 1998;10:3–10.
113. Hathaway DK, Abell T, Cardoso S, Heartwig MS, Gebely S,Gaber AO. Improvement in autonomic and gastric functionfollowing pancreas-kidney versus kidney-alone transplan-tation and the correlation with quality of life. Transplanta-tion 1994;57:816.
114. Gaber AO, Hathaway DK, Abell T, Cardoso S, Heartwig MS,Gebely S. Improved autonomic and gastric function in pan-creas-kidney vs. kidney-alone transplantation contributesto quality of life. Transplant Proc 1994;26:515.
115. Cashion AK, Holmes SL, Hathaway DK, Gaber AO. Gastro-paresis following kidney/pancreas transplant. Clin Trans-plant 2004;18:306–311.
116. Levanon D, Chen JDZ. Electrogastrography: its role inmanaging gastric disorders. (Invited Review). J PediatrGastroenterol Nutr 1998;27:431–443.
117. Chen JDZ, Co E, Liang J, Pan J, Sutphen J, Torres-PinedoRB, Orr WC. Patterns of gastric myoelectrical activity inhuman subjects of different ages. Am J Physiol 1997;272:G1022–G1027.
118. Liang J, Co E, Zhang M, Pineda J, Chen JDZ. Developmentof gastric slow waves in preterm infants measured by elec-trogastrography. Am J Physiol (Gastrointest Liver Physiol)1998;37:G503–G508.
119. Levy J, Harris J, Chen J, Sapoznikov D, Riley B, De La NuezW, Khaskeberg A. Electrogastrographic norms in children:toward the development of standard methods, reproducibleresults, and reliable normative data. J Pediatr Gastroen-terol Nutr 2001;33(4):455–461.
120. Cucchiara S, Riezzo G, Minella R, et al. Electrogastrographyin non-ulcer dyspepsia. Arch Disease Childhood 1992;67(5):613–617.
121. Ravelli AM, Ledermann SE, Bisset WM, Trompeter RS,Barratt TM, Milla PJ. Gastric antral myoelectrical activityin children wit chronic renal failure. In: Chen JDZ,McCallum RW, editors. Electrogastrography: Principlesand Applications. New York: Raven Press; 1994. p 411–418.
122. Devane SP, Ravelli AM, Bisset WM, Smith VV, Lake BD,Milla PJ. Gastric antral dysrhythmias in children witchronic idiopathic intestinal pseudoobstruction. Gut 1992;33:1477–1481.
123. Forster J, Damjanov I, Lin ZY, Sarosiek I, Wetzel P, McCal-lum RW. Absence of the interstitial cells of Cajal in patientswith gastroparesis and correlation with clinical findings.J Gastrointest Sur 2005;9:102–108.
124. Lin ZY, Chen JDZ. Advances in electrical stimulation of thegastrointestinal tract. Crit Rev Biomed Eng 2002;30(4–6):419–457.
125. Abell T, McCallum RW, Hocking M, Koch K, AbrahamssionH, LeBlang I, Lindberg G, Konturek J, Nowak T,Quigley EMM, Tougas G, Starkebaum W. Gastric electricalstimulation for medically refractory gastroparesis. Gastro-enterology 2003;125:421–428.
126. Dickens EJ, Hirst GD, Tomita T. Identification of rhythmi-cally active cells in guinespig stomach. J Physiol (London)1999;514:515–531.
127. Ordog T, Ward SM, Sanders KM. Interstitial cells of Cajalgenerate slow waves in the murine stomach. J Physiol 1999;518:257–269.
128. Hanani M, Freund HR. Interstitial cells of Cajal—their rolein pacing and signal transmission in digestive system. ActaPhysiol Scand 170;177–190.
129. Lin ZY, Sarosiek I, Forster J, McCallum RW. Associationbetween baseline parameters of the electrogastrogram andlong-term symptom improvement in gastroparetic patientstreated with gastric electrical stimulation. Neurogastroen-terol Motil 2003;15:345–346.
Reading List
Stern RM, Koch KL. Using electrogastrography to study motionsickness. In: Chen JDZ, McCallum RW, editors. Electrogastro-graphy: Principles and Applications. New York: Raven Press;1994. p 199–218.
See also GASTROINTESTINAL HEMORRHAGE; GRAPHIC RECORDERS.
ELECTROMAGNETIC FLOWMETER. SeeFLOWMETERS, ELECTROMAGNETIC.
ELECTROMYOGRAPHY
CARLO DE LUCA
Boston UniversityBoston, Massachusetts
INTRODUCTION
Electromyography is the discipline that deals with thedetection, analysis, and use of the electrical signal thatemanates from contracting muscles.
This signal is referred to as the electromyographic(EMG) signal, a term that was more appropriate in thepast than in the present. In days past, the only way tocapture the signal for subsequent study was to obtain a‘‘graphic’’ representation. Today, of course, it is possible tostore the signal on magnetic tape, disks, and electronicscomponents. Even more means will become available in thenear future. This evolution has made the graphics aspect ofthe nomenclature a limited descriptor. Although a growingnumber of practitioners choose to use the term ‘‘myoelectric(ME) signal’’, the term ‘‘EMG’’ still commands dominantusage, especially in clinical environments.
An example of the EMG signal can be seen in Fig. 1.Here the signal begins with a low amplitude, which whenexpanded reveals the individual action potentials asso-ciated with the contractile activity of individual (or a smallgroup) of muscle fibers. As the force output of the musclecontraction increases, more muscle fivers are activated andthe firing rate of the fibers increases. Correspondingly, theamplitude of the signal increases taking on the appearanceand characteristics of a Gaussian distributed variable.
98 ELECTROMYOGRAPHY
The novice in this field may well ask, why study elec-tromyography? Why bother understanding the EMG sig-nal? There are many and varied reasons for doing so. Evena superficial acquaintance with the scientific literature willuncover various current applications in fields such asneurophysiology, kinesiology, motor control, psychology,rehabilitation medicine, and biomedical engineering.Although the state of the art provides a sound and richcomplement of applications, it is the potential of futureapplications that generates genuine enthusiasm.
HISTORICAL PERSPECTIVE
Electromyography had its earliest roots in the custompracticed by the Greeks of using electric eels to ‘‘shock’’ailments out of the body. The origin of the shock thataccompanied this earliest detection and application ofthe EMG signal was not appreciated until 1666 when anItalian, Francesco Redi, realized that it originated frommuscle tissue (1). This relationship was later proved byLuigi Galvani (2) in 1791 who staunchly defended thenotion. During the ensuing six decades, a few investigatorsdabbled with this newly discovered phenomenon, but itremained for DuBois Reymond (3) in 1849 to prove that theEMG signal could be detected from human muscle during avoluntary contraction. This pivotal discovery remaineduntapped for eight decades awaiting the development oftechnological implements to exploit its prospects. Thisinterval brought forth new instruments such as the cath-ode ray tube, vacuum tube amplifiers, metal electrodes,and the revolutionary needle electrode which providedmeans for conveniently detecting the EMG signal. Thissimple implement introduced by Adrian and Bronk (4) in1929 fired the imagination of many clinical researcherswho embraced electromyography as an essential resourcefor diagnostic procedures. Noteworthy among these wasthe contribution of Buchthal and his associates.
Guided by the work of Inman et al. (5), in the mid-1940sto the mid-1950s several investigations revealed a mono-tonic relationship between the amplitude of the EMGsignal and the force and velocity of a muscle contraction.This significant finding had a considerable impact: It dra-matically popularized the use of electromyographic studiesconcerned with muscle function, motor control, and kine-siology. Kinesiological investigations received yet anotherimpetus in the early 1960s with the introduction of wireelectrodes. The properties of the wire electrode were dili-gently exploited by Basmajian and his associates duringthe next two decades.
In the early 1960s, another dramatic evolution occurredin the field: myoelectric control of externally poweredprostheses. During this period, engineers from severalcountries developed externally powered upper limb pros-theses that were made possible by the miniaturization ofelectronics components and the development of lighter,more compact batteries that could be carried by amputees.Noteworthy among the developments of externally pow-ered prostheses was the work of the Yugoslavian engineerTomovic and the Russian engineer Kobrinski, who in thelate 1950s and early 1960s provided the first examples ofsuch devices.
In the following decade, a formal theoretical basis forelectromyography began to evolve. Up to this time, allknowledge in the field had evolved from empirical andoften anecdotal observations. De Luca (6,7) described amathematical model that explained many properties of thetime domain parameters of the EMG signal, and Lindstrom(8) described a mathematical model that explained manyproperties of the frequency domain parameters of the EMGsignal. With the introduction of analytical and simulationtechniques, new approaches to the processing of the EMGsignal surfaced. Of particular importance was the work ofGraupe and Cline (9), who employed the autoregressivemoving average technique for extracting information fromthe signal.
The late 1970s and early 1980s saw the use of sophis-ticated computer algorithms and communication theory todecompose the EMG signal into the individual electricalactivities of the muscle fibers (10–12). Today, the decom-position approach promises to revolutionize clinical elec-tromyography and to provide a powerful tool forinvestigating the detailed control schemes used by thenervous system to produce muscle contractions. In thesame vein, the use of a thin tungsten wire electrode fordetecting the action potential from single fibers was popu-larized for clinical applications (13,14). Other techniquesusing the surface EMG signal, such as the use of medianand mean frequencies of the EMG signal to describe thefunctional state of a muscle and the use of the conductionvelocity of the EMG signal to provide information on themorphology of the muscle fibers began to take hold. For areview, see De Luca (15).
The 1990s saw the effective application of modern signalprocessing techniques for the analysis and use of the EMGsignal. Some examples are the use of time and frequencyanalysis of the surface EMG signal for measuring therelative contribution of low back muscles during thepresence and absence of low back pain (16); the use of
ELECTROMYOGRAPHY 99
Figure 1. The EMG signal recorded with surface electrodes loca-ted on the skin above the first dorsal interosseous muscle in thehand. The signal increases in amplitude as the force produced bythe muscle increases.
systematic measurements of the muscle fiber conductionvelocity for measuring the severity of the Duchenne Dys-trophy (17); the analysis of motor unit action potential delayfor locating the origin, the ending and the innervation zoneof muscle fibers (18); and the application of time–frequencyanalysis of the EMG signal to the field of laryngology (19).
New and exciting developments are on the horizon. Forexample, the use of large-scale multichannel detection ofEMG signals for locating sources of muscle fiber abnorm-ality (20); application of neural networks to provide greaterdegrees of freedom for the control of myoelectric prostheses(21), and for the analysis of EMG sensors data for assessingthe motor activities and performance of sound subjects (22)and Stroke patients (23). Yet another interesting develop-ment is the emerging use of sophisticated Artificial Intelli-gence techniques for the decomposing the EMG signal (24).The reader who is interested in more historical and factualdetails is referred to the book Muscles Alive (25).
DESCRIPTION OF THE EMG SIGNAL
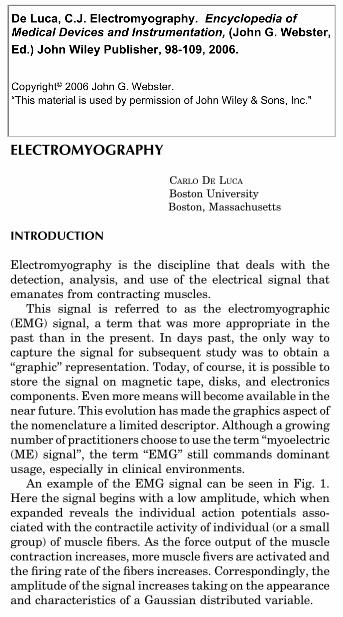
The EMG signal is the electrical manifestation of theneuromuscular activation associated with a contractingmuscle. The signal represents the current generated bythe ionic flow across the membrane of the muscle fibersthat propagates through the intervening tissues to reachthe detection surface of an electrode located in the envir-onment. It is a complicated signal that is affected by theanatomical and physiological properties of muscles and thecontrol scheme of the nervous system, as well as thecharacteristics of the instrumentation used to detect andobserve it. Some of the complexity is presented in Fig. 2that depicts a schematic diagram of the main physiological,anatomical and biochemical factors that affect the EMGsignal. The connecting lines in the diagram show theinteraction among three classes of factors that influencethe EMG signal. The causative factors have a basic orelemental effect on the signal. The intermediate factorsrepresent physical and physiological phenomena that are
influenced by one or more of the causative factors and inturn influence the deterministic factors that representphysical characteristics of the action potentials. Forfurther details see De Luca (26).
In order to understand the EMG signal, it is necessary toappreciate some fundamental aspects of physiology. Mus-cle fibers are innervated in groups called motor units,which when activated generate a motor unit action poten-tial. The activation from the central nervous system isrepeated continuously for as long as the muscle is requiredto generate force. This continued activation generatesmotor unit action potential trains. These trains from theconcurrently active motor units superimpose to form theEMG signal. As the excitation from the Central NervousSystem increases to generate greater force in the muscle, agreater number of motor units are activated (or recruited)and the firing rates of all the active motor units increases.
Motor Unit Action Potential
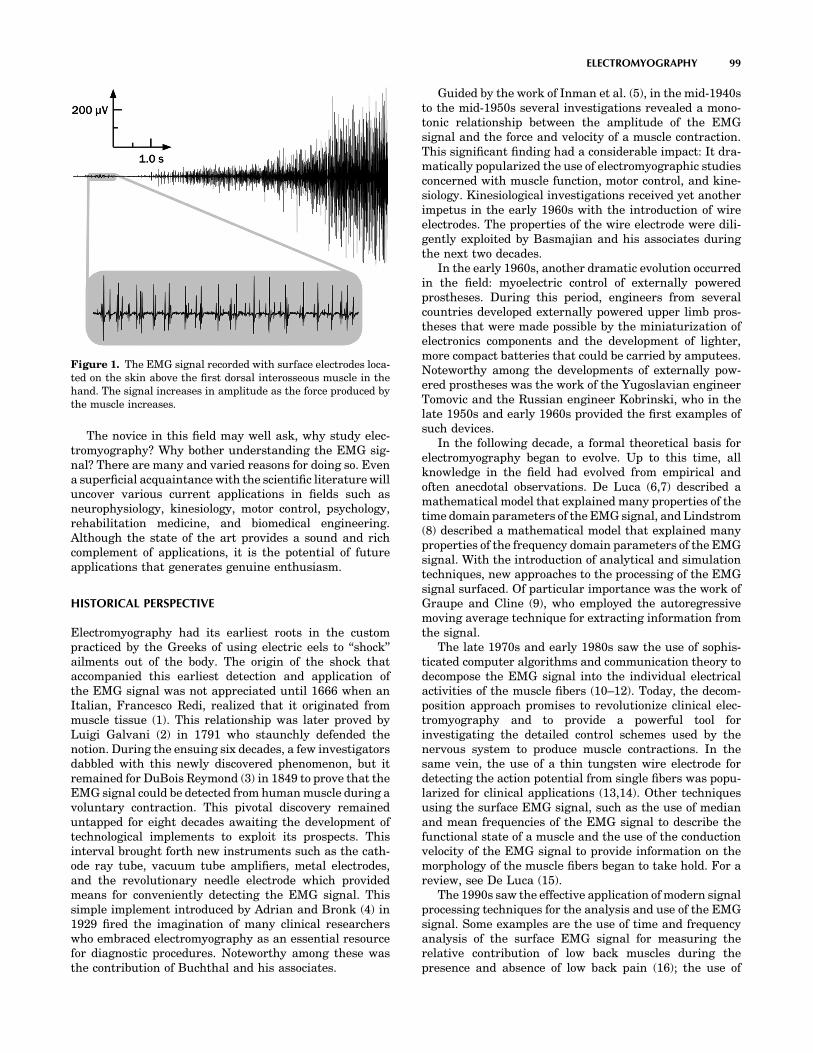
The most fundamental functional unit of a muscle is calledthe motor unit. It consists of an a-motoneuron and all themuscle fibers that are innervated by the motoneuron’saxonal branches. The electrical signal that emanates fromthe activation of the muscle fibers of a motor unit that arein the detectable vicinity of an electrode is called the motorunit action potential (MUAP). This constitutes the funda-mental unit of the EMG signal. A schematic representationof the genesis of a MUAP is presented in Fig. 3. Note themany factors that influence the shape of the MUAP. Someof these are (1) the relative geometrical relationship of thedetection surfaces of the electrode and the muscles fibers ofthe motor unit in its vicinity; (2) the relative position of thedetection surfaces to the innervation zone, that is, theregion where the nerve branches contact the muscle fibers;(3) the size of the muscle fibers (because the amplitude ofthe individual action potential is proportional to the dia-meter of the fiber); and (4) the number of muscle fibers of anindividual motor unit in the detectable vicinity of theelectrode.
100 ELECTROMYOGRAPHY
CAUSATIVE
FACTORS
INTERMEDIATE DETERMINISTIC
EMG SIGNAL INTERPRETATION
EXTRINISIC
ELECTRODE:
-MOTOR POINT
-MUSCLE EDGE
-FIBER ORIENT.
-TENDON
INTRINSIC
NUMBER ACTIVE MU
FIBER DIAMETER
FIBER LOCATION
OTHER FACTORS
SUPERPOSITION
AMPLITUDE(RMS/ARV)
SPECTRALVARIABLES
(MEDIAN/MEAN FREQ.)
(FORCE-NETTORQUE)
MUSCLEACTIVATION
(ON/OFF)
MUSCLEFATIGUE
MUSCLE
MU FORCETWITCH
MU FIRINGRATE
NUMBERDETECTED MU
MUAPDURATION
MUAPSHAPE
RECRUITMENTSTABILITY
MUSCLEFORCE
BIOCHEM.
-CONFIGURATION
FIBER TYPELACTIC ACID (pH)
ELECTRODE
SUBCUTANEOUSTISSUE
MU FIRING RATE(SYNCHRONIZATION)
SPATIALFILTERING
DETECTIONVOLUME
NUMBERACTIVE MU
CONDUCTIONVELOCITY
SIGNALCROSSTALK
MUAPAMPLITUDE
DIFF. ELECTRODE
MUSCLE FIBERINTERACTIONS
FILTER
BLOOD FLOW
.
.
.
.
.
.
.
...
.
.
..
..
.
.
.
.
.
..
.
.
.
.............
.
.
.
.
..
CJ DeLuca
MU FORCE TWITCH
Figure 2. Relationship among the various factors that affect the EMG signal. [Reproduced withPermission from C. J. De Luca, ‘‘The Use of Surface Electromyography in Biomechanics.’’ In theJournal of Applied Biomechanics, Vol. 13(No 2): p 139, Fig. 1.]
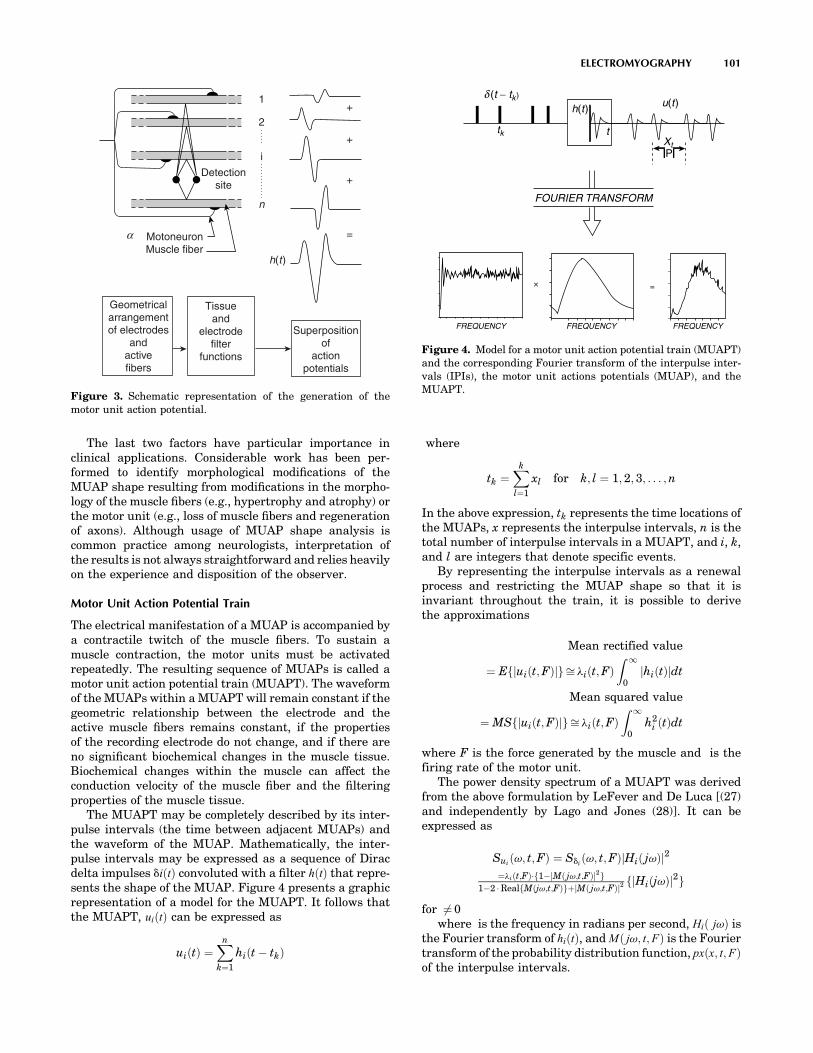
The last two factors have particular importance inclinical applications. Considerable work has been per-formed to identify morphological modifications of theMUAP shape resulting from modifications in the morpho-logy of the muscle fibers (e.g., hypertrophy and atrophy) orthe motor unit (e.g., loss of muscle fibers and regenerationof axons). Although usage of MUAP shape analysis iscommon practice among neurologists, interpretation ofthe results is not always straightforward and relies heavilyon the experience and disposition of the observer.
Motor Unit Action Potential Train
The electrical manifestation of a MUAP is accompanied bya contractile twitch of the muscle fibers. To sustain amuscle contraction, the motor units must be activatedrepeatedly. The resulting sequence of MUAPs is called amotor unit action potential train (MUAPT). The waveformof the MUAPs within a MUAPT will remain constant if thegeometric relationship between the electrode and theactive muscle fibers remains constant, if the propertiesof the recording electrode do not change, and if there areno significant biochemical changes in the muscle tissue.Biochemical changes within the muscle can affect theconduction velocity of the muscle fiber and the filteringproperties of the muscle tissue.
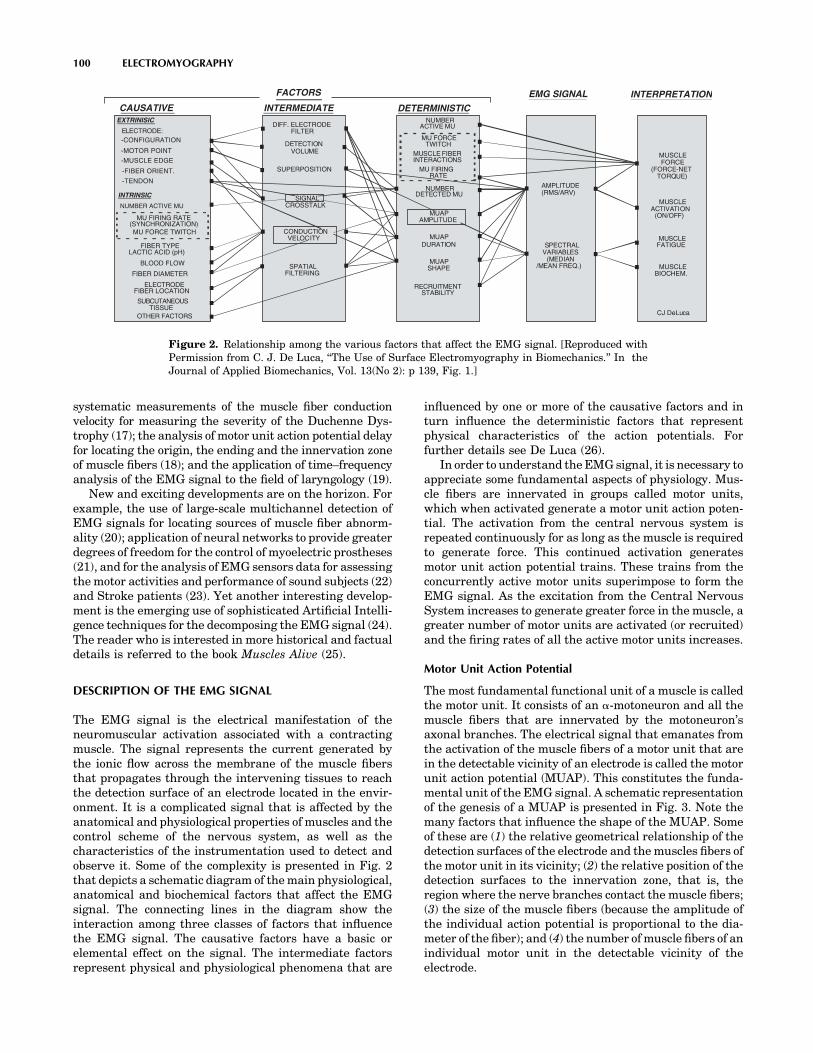
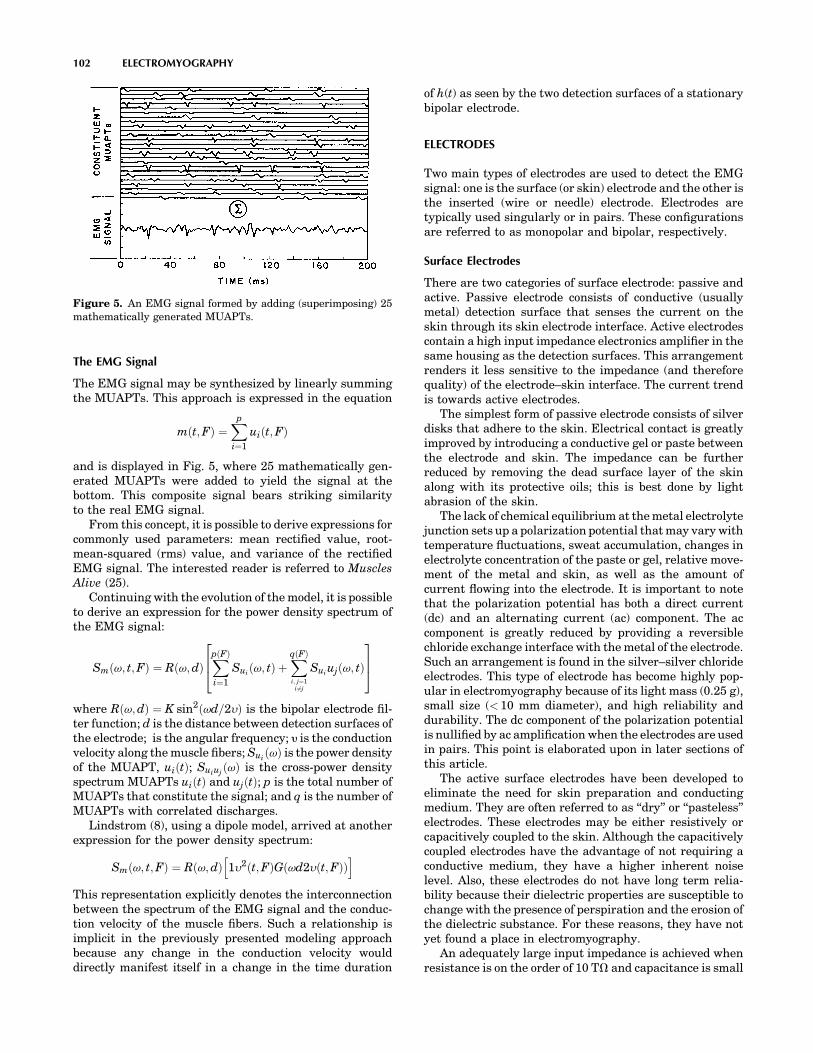
The MUAPT may be completely described by its inter-pulse intervals (the time between adjacent MUAPs) andthe waveform of the MUAP. Mathematically, the inter-pulse intervals may be expressed as a sequence of Diracdelta impulses diðtÞ convoluted with a filter hðtÞ that repre-sents the shape of the MUAP. Figure 4 presents a graphicrepresentation of a model for the MUAPT. It follows thatthe MUAPT, uiðtÞ can be expressed as
uiðtÞ ¼Xn
k¼1
hiðt � tkÞ
where
tk ¼Xk
l¼1
xl for k; l ¼ 1; 2; 3; . . . ;n
In the above expression, tk represents the time locations ofthe MUAPs, x represents the interpulse intervals, n is thetotal number of interpulse intervals in a MUAPT, and i, k,and l are integers that denote specific events.
By representing the interpulse intervals as a renewalprocess and restricting the MUAP shape so that it isinvariant throughout the train, it is possible to derivethe approximations
Mean rectified value
¼ Efjuiðt;FÞjgffi liðt;FÞZ 1
0jhiðtÞjdt
Mean squared value
¼ MSfjuiðt;FÞjgffi liðt;FÞZ 1
0h2
i ðtÞdt
where F is the force generated by the muscle and is thefiring rate of the motor unit.
The power density spectrum of a MUAPT was derivedfrom the above formulation by LeFever and De Luca [(27)and independently by Lago and Jones (28)]. It can beexpressed as
Suiðv; t;FÞ ¼ Sdi
ðv; t;FÞjHið jvÞj2
¼liðt;FÞf1�jMð jv;t;FÞj2g1�2 RealfMðjv;t;FÞgþjMð jv;t;FÞj2 fjHiðjvÞj2g
for 6¼ 0where is the frequency in radians per second, Hið jvÞ is
the Fourier transform of hiðtÞ, and Mð jv; t;FÞ is the Fouriertransform of the probability distribution function, pxðx; t;FÞof the interpulse intervals.
ELECTROMYOGRAPHY 101
Detectionsite
MotoneuronMuscle fiber
Geometricalarrangementof electrodes
andactivefibers
Tissueand
electrodefilter
functions
Superpositionof
actionpotentials
h(t )
1
2
i
n
=
+
+
+
α
Figure 3. Schematic representation of the generation of themotor unit action potential.
FOURIER TRANSFORM
FREQUENCY FREQUENCY FREQUENCY
=×
tkXt
h(t ) u(t )
t
d (t − tk )
P
Figure 4. Model for a motor unit action potential train (MUAPT)and the corresponding Fourier transform of the interpulse inter-vals (IPIs), the motor unit actions potentials (MUAP), and theMUAPT.
The EMG Signal
The EMG signal may be synthesized by linearly summingthe MUAPTs. This approach is expressed in the equation
mðt;FÞ ¼Xp
i¼1
uiðt;FÞ
and is displayed in Fig. 5, where 25 mathematically gen-erated MUAPTs were added to yield the signal at thebottom. This composite signal bears striking similarityto the real EMG signal.
From this concept, it is possible to derive expressions forcommonly used parameters: mean rectified value, root-mean-squared (rms) value, and variance of the rectifiedEMG signal. The interested reader is referred to MusclesAlive (25).
Continuing with the evolution of the model, it is possibleto derive an expression for the power density spectrum ofthe EMG signal:
Smðv; t;FÞ ¼ Rðv;dÞXpðFÞ
i¼1
Suiðv; tÞ þ
XqðFÞ
i; j¼1i 6¼j
Suiujðv; tÞ
264
375
where Rðv;dÞ ¼ K sin2ðvd=2yÞ is the bipolar electrode fil-ter function; d is the distance between detection surfaces ofthe electrode; is the angular frequency; y is the conductionvelocity along the muscle fibers; Sui
ðvÞ is the power densityof the MUAPT, uiðtÞ; Suiuj
ðvÞ is the cross-power densityspectrum MUAPTs uiðtÞ and ujðtÞ; p is the total number ofMUAPTs that constitute the signal; and q is the number ofMUAPTs with correlated discharges.
Lindstrom (8), using a dipole model, arrived at anotherexpression for the power density spectrum:
Smðv; t;FÞ ¼ Rðv;dÞ 1y2ðt;FÞG vd2yðt;FÞð Þh i
This representation explicitly denotes the interconnectionbetween the spectrum of the EMG signal and the conduc-tion velocity of the muscle fibers. Such a relationship isimplicit in the previously presented modeling approachbecause any change in the conduction velocity woulddirectly manifest itself in a change in the time duration
of h(t) as seen by the two detection surfaces of a stationarybipolar electrode.
ELECTRODES
Two main types of electrodes are used to detect the EMGsignal: one is the surface (or skin) electrode and the other isthe inserted (wire or needle) electrode. Electrodes aretypically used singularly or in pairs. These configurationsare referred to as monopolar and bipolar, respectively.
Surface Electrodes
There are two categories of surface electrode: passive andactive. Passive electrode consists of conductive (usuallymetal) detection surface that senses the current on theskin through its skin electrode interface. Active electrodescontain a high input impedance electronics amplifier in thesame housing as the detection surfaces. This arrangementrenders it less sensitive to the impedance (and thereforequality) of the electrode–skin interface. The current trendis towards active electrodes.
The simplest form of passive electrode consists of silverdisks that adhere to the skin. Electrical contact is greatlyimproved by introducing a conductive gel or paste betweenthe electrode and skin. The impedance can be furtherreduced by removing the dead surface layer of the skinalong with its protective oils; this is best done by lightabrasion of the skin.
The lack of chemical equilibrium at the metal electrolytejunction sets up a polarization potential that may vary withtemperature fluctuations, sweat accumulation, changes inelectrolyte concentration of the paste or gel, relative move-ment of the metal and skin, as well as the amount ofcurrent flowing into the electrode. It is important to notethat the polarization potential has both a direct current(dc) and an alternating current (ac) component. The accomponent is greatly reduced by providing a reversiblechloride exchange interface with the metal of the electrode.Such an arrangement is found in the silver–silver chlorideelectrodes. This type of electrode has become highly pop-ular in electromyography because of its light mass (0.25 g),small size (< 10 mm diameter), and high reliability anddurability. The dc component of the polarization potentialis nullified by ac amplification when the electrodes are usedin pairs. This point is elaborated upon in later sections ofthis article.
The active surface electrodes have been developed toeliminate the need for skin preparation and conductingmedium. They are often referred to as ‘‘dry’’ or ‘‘pasteless’’electrodes. These electrodes may be either resistively orcapacitively coupled to the skin. Although the capacitivelycoupled electrodes have the advantage of not requiring aconductive medium, they have a higher inherent noiselevel. Also, these electrodes do not have long term relia-bility because their dielectric properties are susceptible tochange with the presence of perspiration and the erosion ofthe dielectric substance. For these reasons, they have notyet found a place in electromyography.
An adequately large input impedance is achieved whenresistance is on the order of 10 TV and capacitance is small
102 ELECTROMYOGRAPHY
Figure 5. An EMG signal formed by adding (superimposing) 25mathematically generated MUAPTs.
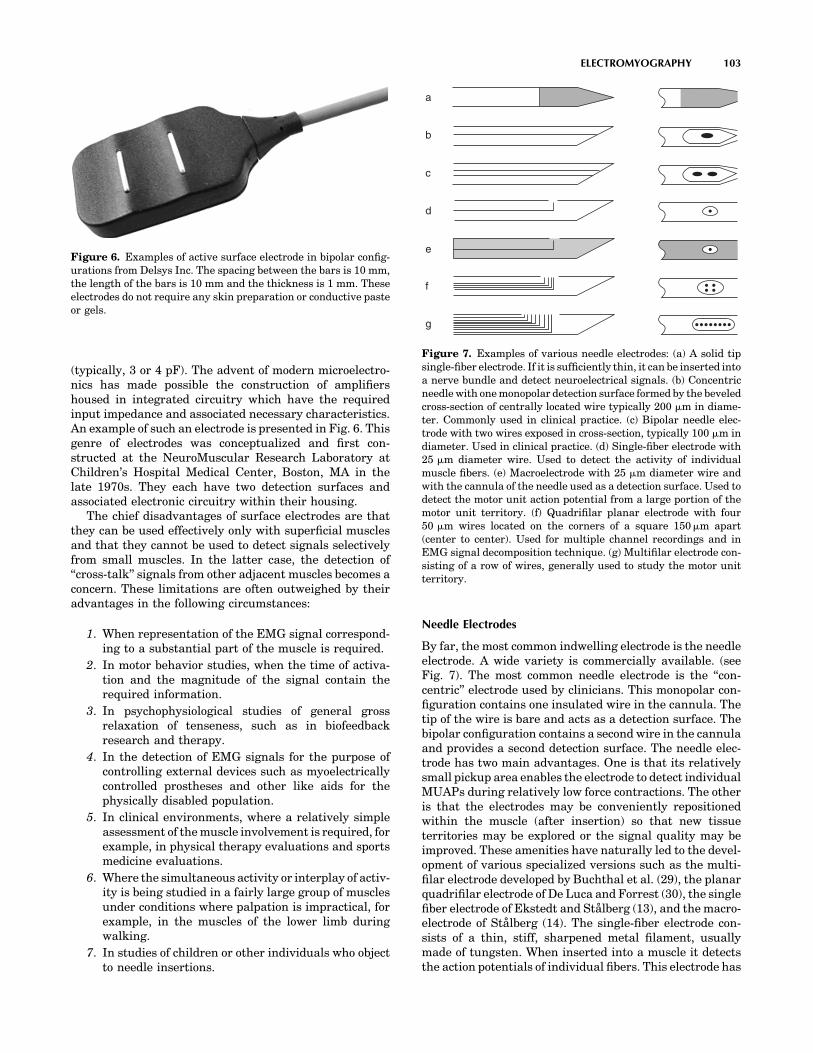
(typically, 3 or 4 pF). The advent of modern microelectro-nics has made possible the construction of amplifiershoused in integrated circuitry which have the requiredinput impedance and associated necessary characteristics.An example of such an electrode is presented in Fig. 6. Thisgenre of electrodes was conceptualized and first con-structed at the NeuroMuscular Research Laboratory atChildren’s Hospital Medical Center, Boston, MA in thelate 1970s. They each have two detection surfaces andassociated electronic circuitry within their housing.
The chief disadvantages of surface electrodes are thatthey can be used effectively only with superficial musclesand that they cannot be used to detect signals selectivelyfrom small muscles. In the latter case, the detection of‘‘cross-talk’’ signals from other adjacent muscles becomes aconcern. These limitations are often outweighed by theiradvantages in the following circumstances:
1. When representation of the EMG signal correspond-ing to a substantial part of the muscle is required.
2. In motor behavior studies, when the time of activa-tion and the magnitude of the signal contain therequired information.
3. In psychophysiological studies of general grossrelaxation of tenseness, such as in biofeedbackresearch and therapy.
4. In the detection of EMG signals for the purpose ofcontrolling external devices such as myoelectricallycontrolled prostheses and other like aids for thephysically disabled population.
5. In clinical environments, where a relatively simpleassessment of the muscle involvement is required, forexample, in physical therapy evaluations and sportsmedicine evaluations.
6. Where the simultaneous activity or interplay of activ-ity is being studied in a fairly large group of musclesunder conditions where palpation is impractical, forexample, in the muscles of the lower limb duringwalking.
7. In studies of children or other individuals who objectto needle insertions.
Needle Electrodes
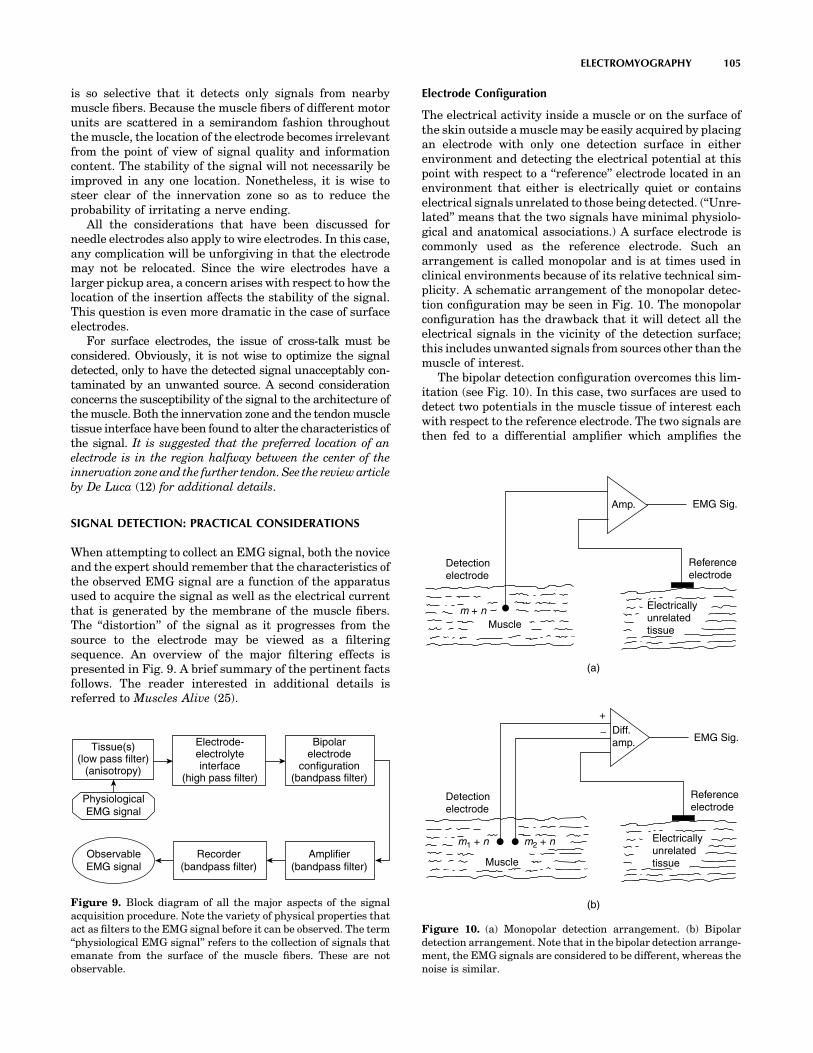
By far, the most common indwelling electrode is the needleelectrode. A wide variety is commercially available. (seeFig. 7). The most common needle electrode is the ‘‘con-centric’’ electrode used by clinicians. This monopolar con-figuration contains one insulated wire in the cannula. Thetip of the wire is bare and acts as a detection surface. Thebipolar configuration contains a second wire in the cannulaand provides a second detection surface. The needle elec-trode has two main advantages. One is that its relativelysmall pickup area enables the electrode to detect individualMUAPs during relatively low force contractions. The otheris that the electrodes may be conveniently repositionedwithin the muscle (after insertion) so that new tissueterritories may be explored or the signal quality may beimproved. These amenities have naturally led to the devel-opment of various specialized versions such as the multi-filar electrode developed by Buchthal et al. (29), the planarquadrifilar electrode of De Luca and Forrest (30), the singlefiber electrode of Ekstedt and Stalberg (13), and the macro-electrode of Stalberg (14). The single-fiber electrode con-sists of a thin, stiff, sharpened metal filament, usuallymade of tungsten. When inserted into a muscle it detectsthe action potentials of individual fibers. This electrode has
ELECTROMYOGRAPHY 103
Figure 6. Examples of active surface electrode in bipolar config-urations from Delsys Inc. The spacing between the bars is 10 mm,the length of the bars is 10 mm and the thickness is 1 mm. Theseelectrodes do not require any skin preparation or conductive pasteor gels.
a
b
c
d
e
f
g
Figure 7. Examples of various needle electrodes: (a) A solid tipsingle-fiber electrode. If it is sufficiently thin, it can be inserted intoa nerve bundle and detect neuroelectrical signals. (b) Concentricneedle with one monopolar detection surface formed by the beveledcross-section of centrally located wire typically 200 mm in diame-ter. Commonly used in clinical practice. (c) Bipolar needle elec-trode with two wires exposed in cross-section, typically 100 mm indiameter. Used in clinical practice. (d) Single-fiber electrode with25 mm diameter wire. Used to detect the activity of individualmuscle fibers. (e) Macroelectrode with 25 mm diameter wire andwith the cannula of the needle used as a detection surface. Used todetect the motor unit action potential from a large portion of themotor unit territory. (f) Quadrifilar planar electrode with four50 mm wires located on the corners of a square 150mm apart(center to center). Used for multiple channel recordings and inEMG signal decomposition technique. (g) Multifilar electrode con-sisting of a row of wires, generally used to study the motor unitterritory.

proven to be useful for neurological examinations of dein-nervated muscles. Examples of these electrodes may beseen in Fig. 7.
Wire Electrodes
Since the early 1960s, this type of electrode has beenpopularized by Basmajian and Stecko (31). Similar elec-trodes that differ only in minor details of construction weredeveloped independently at about the same time by otherresearchers. Wire electrodes have proved a boon to kine-siological studies because they are extremely fine, they areeasily implanted and withdrawn from skeletal muscles,and they are generally less painful than needle electrodeswhose cannula remains inserted in the muscle throughoutthe duration of the test.
Wire electrodes may be made from any small diameter,highly nonoxidizing, stiff wire with insulation. Alloys ofplatinum, silver, nickel, and chromium are typically used.Insulations, such as nylon, polyurethane, and Teflon, areconveniently available. The preferable alloy is 90% plati-num, 10% iridium; it offers the appropriate combination ofchemical inertness, mechanical strength, stiffness andeconomy. The Teflon and nylon insulations are preferredbecause they add some mechanical rigidity to the wires,making them easier to handle. The electrode is constructedby inserting two insulated fine (25–100 mm in diameter)wires through the cannula of a hypodermic needle.Approximately 1–2 mm of the distal tips of the wire isdeinsulated and bent to form two staggered hooks (seeFig. 8 for completed version). The electrode is introducedinto the muscle by inserting the hypodermic needle andthen withdrawing it. The wires remain lodged in themuscle tissues. They may be removed by gently pullingthem out: They are so pliable that the hooks straighten outon retraction.
In kinesiological studies, where the main purpose ofusing wire electrodes is to record a signal that is propor-tional to the contraction level of muscle, repositioning ofthe electrode is not important. But for other applications,such as recording distinguishable MUAPTs, this limitationis counterproductive. Some have used the phrase ‘‘poke andhope’’ to describe the standard wire electrode technique forthis particular application. Another limitation of the wireelectrode is its tendency to migrate after it has beeninserted, especially during the first few contractions ofthe muscle. The migration usually stops after a few con-tractions. Consequently, it is recommended to perform ahalf dozen or so short duration contraction before theactual recording session begins.
Electrode Maintenance
Proper usage of wire and needle electrodes requires con-stant surveillance of the physical and electrical character-istics of the electrode detection surfaces. Particularattention should be given to keeping the tips free of debrisand oxidation. The reader is referred to the book MusclesAlive (25) for details on these procedures as well as sugges-tions for sterilization.
How to Choose the Proper Electrode
The specific type of electrode chosen to detect the EMGsignal depends on the particular application and the con-venience of use. The application refers to the informationthat is expected to be obtained from the signal; for example,obtaining individual MUAPs or the gross EMG signalreflecting the activity of many muscle fibers. The conve-nience aspect refers to the time and effort the investigatorwishes to devote to the disposition of the subject or patient.Children, for example, are generally resistant to havingneedles inserted in their muscles.
The following electrode usage is recommended. Thereader, however, should keep in the mind that crossoverapplications are always possible for specific circumstances.
Surface Electrodes
Time force relationship of EMG signals.
Kinesiological studies of surface muscles.
Neurophysiological studies of surface muscles.
Psychophysiological studies.
Interfacing an individual with external electromechan-ical devices.
Needle Electrode
MUAP characteristics.
Control properties of motor units (firing rate, recruit-ment, etc.).
Exploratory clinical electromyography.
Wire Electrodes
Kinesiological studies of deep muscles.
Neurophysiological studies of deep muscles.
Limited studies of motor unit properties.
Comfortable recording procedure from deep muscles.
Where to Locate the Electrode
The location of the electrode should be determined by threeimportant considerations: (1) signal/noise ratio, (2) signalstability (reliability), and (3) cross-talk from adjacent mus-cles. The stability consideration addresses the issue of themodulation of the signal amplitude due to relative move-ment of the active fibers with respect to the detectionsurfaces of the electrode. The issue of cross-talk concernsthe detection by the electrode of signals emanating fromadjacent muscles.
For most configurations of needle electrodes, the ques-tion of cross-talk is of minor concern because the electrode
104 ELECTROMYOGRAPHY
Figure 8. A bipolar wire electrode with its carrier needle used forinsertion.
is so selective that it detects only signals from nearbymuscle fibers. Because the muscle fibers of different motorunits are scattered in a semirandom fashion throughoutthe muscle, the location of the electrode becomes irrelevantfrom the point of view of signal quality and informationcontent. The stability of the signal will not necessarily beimproved in any one location. Nonetheless, it is wise tosteer clear of the innervation zone so as to reduce theprobability of irritating a nerve ending.
All the considerations that have been discussed forneedle electrodes also apply to wire electrodes. In this case,any complication will be unforgiving in that the electrodemay not be relocated. Since the wire electrodes have alarger pickup area, a concern arises with respect to how thelocation of the insertion affects the stability of the signal.This question is even more dramatic in the case of surfaceelectrodes.
For surface electrodes, the issue of cross-talk must beconsidered. Obviously, it is not wise to optimize the signaldetected, only to have the detected signal unacceptably con-taminated by an unwanted source. A second considerationconcerns the susceptibility of the signal to the architecture ofthe muscle. Both the innervation zone and the tendon muscletissue interface have been found to alter the characteristics ofthe signal. It is suggested that the preferred location of anelectrode is in the region halfway between the center of theinnervation zone and the further tendon. See the review articleby De Luca (12) for additional details.
SIGNAL DETECTION: PRACTICAL CONSIDERATIONS
When attempting to collect an EMG signal, both the noviceand the expert should remember that the characteristics ofthe observed EMG signal are a function of the apparatusused to acquire the signal as well as the electrical currentthat is generated by the membrane of the muscle fibers.The ‘‘distortion’’ of the signal as it progresses from thesource to the electrode may be viewed as a filteringsequence. An overview of the major filtering effects ispresented in Fig. 9. A brief summary of the pertinent factsfollows. The reader interested in additional details isreferred to Muscles Alive (25).
Electrode Configuration
The electrical activity inside a muscle or on the surface ofthe skin outside a muscle may be easily acquired by placingan electrode with only one detection surface in eitherenvironment and detecting the electrical potential at thispoint with respect to a ‘‘reference’’ electrode located in anenvironment that either is electrically quiet or containselectrical signals unrelated to those being detected. (‘‘Unre-lated’’ means that the two signals have minimal physiolo-gical and anatomical associations.) A surface electrode iscommonly used as the reference electrode. Such anarrangement is called monopolar and is at times used inclinical environments because of its relative technical sim-plicity. A schematic arrangement of the monopolar detec-tion configuration may be seen in Fig. 10. The monopolarconfiguration has the drawback that it will detect all theelectrical signals in the vicinity of the detection surface;this includes unwanted signals from sources other than themuscle of interest.
The bipolar detection configuration overcomes this lim-itation (see Fig. 10). In this case, two surfaces are used todetect two potentials in the muscle tissue of interest eachwith respect to the reference electrode. The two signals arethen fed to a differential amplifier which amplifies the
ELECTROMYOGRAPHY 105
Tissue(s)(low pass filter)
(anisotropy)
Electrode-electrolyteinterface
(high pass filter)
Bipolarelectrode
configuration(bandpass filter)
Amplifier(bandpass filter)
Recorder(bandpass filter)
ObservableEMG signal
PhysiologicalEMG signal
Figure 9. Block diagram of all the major aspects of the signalacquisition procedure. Note the variety of physical properties thatact as filters to the EMG signal before it can be observed. The term‘‘physiological EMG signal’’ refers to the collection of signals thatemanate from the surface of the muscle fibers. These are notobservable.
Amp.
Detectionelectrode
Detectionelectrode
m + n
m1 + n m2 + n
Muscle
Muscle
Electricallyunrelatedtissue
Electricallyunrelatedtissue
Referenceelectrode
Referenceelectrode
EMG Sig.
EMG Sig.Diff.amp.
+
(a)
(b)
Figure 10. (a) Monopolar detection arrangement. (b) Bipolardetection arrangement. Note that in the bipolar detection arrange-ment, the EMG signals are considered to be different, whereas thenoise is similar.
difference of the two signals, thus eliminating any ‘‘com-mon mode’’ components in the two signals. Signals ema-nating from the muscle tissue of interest near the detectionsurface will be dissimilar at each detection surface becauseof the localized electrochemical events occurring in thecontracting muscle fibers, whereas ‘‘ac noise’’ signals ori-ginating from a more distant source (e.g., 50 or 60 Hzelectromagnetic signals radiating from power cords, out-lets, and electrical devices) and ‘‘dc noise’’ signals (e.g.,polarization potentials in the metal electrolyte junction)will be detected with an essentially similar amplitude atboth detection surfaces. Therefore, they will be subtracted,but not necessarily nullified prior to being amplified. Themeasure bf the ability of the differential amplifier to elim-inate the common mode signal is called the common moderejection ratio.
Spatial Filtering
1. As the signal propagates through the tissues, theamplitude decreases as a function of distance. Theamplitude of the EMG signal decreases to approxi-mately 25% within 100 mm. Thus, an indwellingelectrode will detect only signals from nearby musclefibers.
2. The filtering characteristic of the muscle tissues is afunction of the distance between the active musclefibers and the detection surface(s) of the electrode. Inthe case of surface electrodes, the thickness of thefatty and skin tissues must also be considered. Thetissues behaves as a low pass filter whose bandwidthand gain decrease as the distance increases.
3. The muscle tissue is anisotropic. Therefore, the orien-tation of the detection surfaces of the electrode withrespect to the length of the muscle fibers is critical.
Electrode Electrolyte Interface
1. The contact layer between the metallic detectionsurface of the electrode and the conductive tissueforms an electrochemical junction that behaves as ahigh pass filter.
2. The gain and bandwidth will be a function of the areaof the detection surfaces and any chemical electricalalteration of the junction.
Bipolar Electrode Configuration
1. This configuration ideally behaves as a bandpassfilter; however, this is true only if the inputs to theamplifier are balanced and the filtering aspects of theelectrode electrolyte junctions are equivalent.
2. A larger interdetection surface spacing will render alower bandwidth. This aspect is particularly signifi-cant for surface electrodes.
3. The greater the interdetection surface spacing, thegreater the susceptibility of the electrode to detectingmeasurable amplitudes of EMG signals from adja-cent and deep muscles. Again, this aspect is parti-cularly significant for surface electrodes.
4. An interdetection surface spacing of 1.0 cm is recom-mended for surface electrodes.
Amplifier Characteristics
1. These should be designed and/or set for values thatwill minimally distort the EMG signal detected bythe electrodes.
2. The leads to the input of the amplifier (actually, thefirst stage of the amplification) should be as short aspossible and should not be susceptible to movement.This may be accomplished by building the first stageof the amplifier (the preamplifier) in a small config-uration which should be located near (within 10 cm)the electrode. For surface EMG amplifiers thefirst stage is often located in the housing of theelectrodes.
3. The following are typical specifications that can beattained by modern day electronics. It is worth notingthat the values below will improve as more advancedelectronics components become available in thefuture.
(a) Common-mode input impedance: As large as possible(typically > 1015 V in parallel with < 7 pF).
(b) Common mode rejection ratio: > 85 dB.
(c) Input bias current: as low as possible (typically < 5 fA).
(d) Noise (shorted inputs) < 1.5 mV rms for 20–500 Hzbandwidth.
(e) Bandwidth in hertz (3 dB points for 12 dB/octave ormore rolloff):
Surface electrodes 20–500
Wire electrodes 20–2,000
Monopolar and bipolarneedle electrodes for general use
20–5,000
Needle electrodes for signaldecomposition
1,000–10,000
Single fiber electrode 1,000–10,000
Macroelectrode 20–5,000
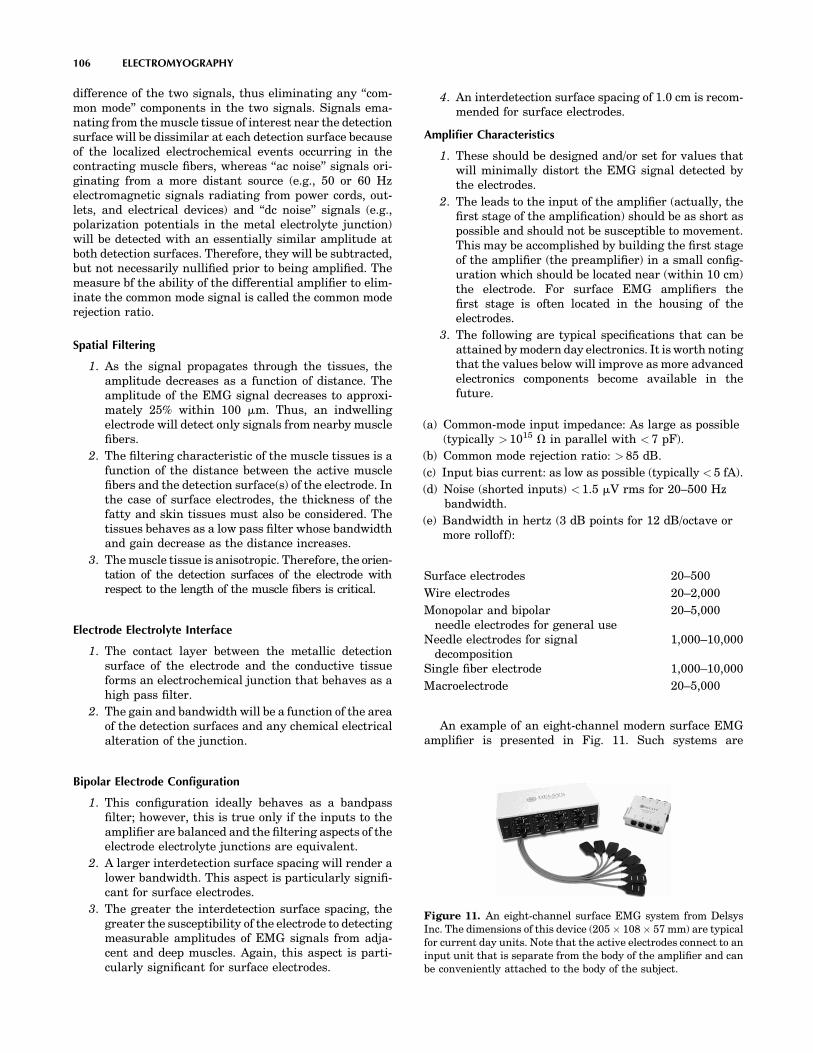
An example of an eight-channel modern surface EMGamplifier is presented in Fig. 11. Such systems are
106 ELECTROMYOGRAPHY
Figure 11. An eight-channel surface EMG system from DelsysInc. The dimensions of this device (205 108 57 mm) are typicalfor current day units. Note that the active electrodes connect to aninput unit that is separate from the body of the amplifier and canbe conveniently attached to the body of the subject.
available in configurations of various channels up to 32, but8 and 16 channel versions are most common.
Recording Characteristics
The effective or actual bandwidth of the device or algorithmthat is used to record or store the signal must be greaterthan that of the amplifiers.
Other Considerations
1. It is preferable to have the subject, the electrode, andthe recording equipment in an electromagneticallyquiet environment. If all the procedures and cautionsdiscussed in this article are followed and heeded,high quality recordings will be obtained in the elec-tromagnetic environments found in most institu-tions, including hospitals.
2. In the use of indwelling electrodes, great cautionshould be taken to minimize (eliminate, if possible)any relative movement between the detection sur-faces of the electrodes and the muscle fibers. Relativemovements of 0.1 mm may dramatically alter thecharacteristics of the detected EMG signal and maypossibly cause the electrode to detect a differentmotor unit population.
SIGNAL ANALYSIS TECHNIQUES
The EMG signal is a time and force (and possibly otherparameters) dependent signal whose amplitude varies in arandom nature above and below the zero value. Thus,simple average aging of the signal will not provide anyuseful information.
Rectification
A simple method that is commonly used to overcome theabove restriction is to rectify the signal before performingmode pertinent analysis. The process of rectificationinvolves the concept of rendering only positive deflectionsof the signal. This may be accomplished either by eliminat-ing the negative values (half-wave rectification) or byinverting the negative values (full-wave rectification).The latter is the preferred procedure because it retainsall the energy of the signal.
Averages or Means of Rectified Signals
The equivalent operation to smoothing in a digital sense isaveraging. By taking the average of randomly varyingvalues of a signal, the larger fluctuations are removed,thus achieving the same results as the analog smoothingoperation. The mathematical expression for the average ormean of the rectified EMG signal is
jmðtÞjtj�ti¼ 1tj � ti
Z tj
ti
jmðtÞjdt
where ti and tj are the points in time over which theintegration and, hence, the averaging is performed. Theshorter the time interval, the less smooth the averagedvalue will be.
The preceding expression will provide only one valueover the time window T ¼ tj � ti. To obtain the time varyingaverage of a complete record of a signal, it is necessary tomove the time window T duration along the record. Thisoperation is referred to as moving average.
jmðtÞj ¼ 1T
Z tþT
tjmðtÞjdt
Like the equivalent operation in the analogue sense, thisoperation introduces a lag; that is, T time must pass beforethe value of the average of the T time interval can beobtained. In most cases, this outcome does not present aserious restriction, especially if the value of T is chosenwisely. For typical applications, values ranging from 100 to200 ms are suggested. It should be noted that shorter timewindows, T, yield less smooth time dependent average(mean) of the rectified signal.
Integration
The most commonly used and abused data reduction pro-cedure in electromyography is integration. The literatureof the past three decades is swamped with improper usageof this term, although happily within the past decade it ispossible to find increasing numbers of proper usage. Whenapplied to a procedure for processing a signal, the tempintegration has a well-defined meaning that is expressed ina mathematical sense. It applies to a calculation thatobtains the area under a signal or a curve. The units ofthis parameter are volt seconds (Vs). It is apparent that anobserved EMG signal with an average value of zero willalso have a total area (integrated value) of zero. Therefore,the concept of integration may be applied only to therectified value of the EMG signal.
IfjmðtÞjg ¼Z tþT
tjmðtÞjdt
Note that the operation is a subset of the procedure ofobtaining the average rectified value. Since the rectifiedvalue is always positive, the integrated rectified value willincrease continuously as a function of time. The onlydifference between the integrated rectified value andthe average rectified value is that in the latter case thevalue is divided by T, the time over which the average iscalculated. If a sufficiently long integration time T ischosen, the integrated rectified value will provide asmoothly varying measure of the signal as a function oftime. There is no additional information in the integratedrectified value.
Root-Mean-Square (rms) Value
Mathematical derivations of the time and force dependentparameters indicate that the rms value provides more amore rigorous measure of the information content of thesignal because it measures the energy of the signal. Its usein electromyography, however, has been sparse in the past.The recent increase is due possibly to the availability ofanalog chips that perform the rms operation and tothe increased technical competence in electromyography.The time-varying rms value is obtained by performing the
ELECTROMYOGRAPHY 107
operations described by the term in reverse order; that is,
rms fmðtÞg ¼ 1T
Z tþT
tm2ðtÞdt
!1=2
This parameter is recommended above the others.
Zero Crossings and Turns Counting
This method consists of counting the number of times perunit time that the amplitude of the signal contains either apeak or crosses a zero value of the signal. It was popular-ized in electromyography by Williston (32). The relativeease with which these measurements could be obtainedquickly made this technique popular among clinicians.Extensive clinical applications have been reported, someindicating that discrimination may be made between myo-pathic and normal muscle; however, such distinctions areusually drawn on a statistical basis.
This technique is not recommended for measuring thebehavior of the signal as a function of force (when recruit-ment or derecruitment of motor units occurs) or as afunction of time during a sustained contraction. Lindstromet al. (33) showed that the relationship between the turnsor zeros and the number of MUAPTs is linear for low levelcontractions. But as the contraction level increases, theadditionally recruited motor units contribute MUAPTs tothe EMG signal. When the signal amplitude attains thecharacter of Gaussian random noise, the linear proportion-ality no longer holds.
Frequency Domain Analysis
Analysis of the EMG signal in the frequency domaininvolves measurements and parameters that describe spe-cific aspects of the frequency spectrum of the signal. FastFourier transform techniques are commonly available andare convenient for obtaining the power density spectrum ofthe signal.
Three parameters of the power density spectrum may beconveniently used to provide useful measures of the spec-trum. They are the median frequency, the mean frequency,and the bandwidth of the spectrum. Other parameters,such as the mode frequency and ratios of segments of thepower density spectrum, have been used by some investi-gators, but are not considered reliable measures given theinevitably noisy nature of the spectrum. The medianfrequency and the mean frequency are defined by theequations: Z fmed
0Smð f Þdf ¼
Z 1
fmed
Smð f Þdf
fmean ¼Z f
0fSmð f Þdf
Z f
0Smð f Þdf
where Smð f Þ is the power density spectrum of the EMGsignal. Stulen and De Luca (34) performed a mathematicalanalysis to investigate the restrictions in estimating var-ious parameters of the power density spectrum. The med-ian and mean frequency parameters were found to be themost reliable, and of these two the median frequency wasfound to be less sensitive to noise. This quality is particu-
larly useful when a signal is obtained during low levelcontractions where the signal to-noise ratio may be < 6.
The above discussion on frequency spectrum parametersremoves temporal information from the calculated para-meters. This approach is appropriate for analyzing signalsthat are stationary or nearly stationary, such as thoseemanating from isometric, constant-force contractions.Measurement of frequency parameters during dynamic con-tractions requires techniques that retain the temporal infor-mation. During the past decade time–frequency analysestechniques have evolved in the field of Electromyography, asthey have in the realm of other biosignals such as ECG andEEG. Early among the researchers to apply these techni-ques to the EMG signal were Contable et al. (35) whoinvestigated the change in the frequency content of EMGsignals during high jumps, and Roark et al. (19) who inves-tigated the movement of the thyroarytenoid muscles duringvocalization. In both these applications, the time–frequencytechniques were essential because they investigated mus-cles that contracted dynamically and briefly.
Much of the work presented here is adapted, withpermission, from Refs. 25, pp. 38, 58, 68, 74, and 81. Theauthor thanks Williams & Wilkens for permission toextract this material.
BIBLIOGRAPHY
Cited References
1. Biederman W. Electrophysiology. 1898.2. Galvani L. De Viribus Electricitatis. (R. Green, Transl.)
London and New York: Cambridge University Press; 1953.3. Du Bois RE. Untersuchungen uber theirische electricitat. 2,
2nd P. Berlin: Verlag von G. Reimer; 1849.4. Adrian ED, Bronk DW. J Physiol (London) 1929;67:19.5. Inman VT, Sauders JBCM, Abbott LC J. Bone Jt Surg
1944;26:1.6. De Luca CJ. MS [dissertation]. University of New Brunswick;
1968.7. De Luca CJ. Biol Cybernet 1975;19:159.8. Lindstrom LR. On the Frequency Spectrum of EMG Signals.
Technical Report, Research Laboratory of Medical Electronics.Gothenburg, Sweden: Chalmers University of Technology;1970.
9. Graupe D, Cline WK. IEEE Trans Syst Man Cybernet SMC1975;5:252.
10. LeFever RS, De Luca CJ. Proceedings of the 8th AnnualMeeting of Social Neuroscience; 1985. p 299.
11. LeFever RS, De Luca CJ. IEEE Trans Biomed Eng BME1982;29:149.
12. McGill KC, Cummins KL, Dorfman LJ. IEEE Trans BiomedEng 1985;32:470–477.
13. Ekstedt J, Stalberg E. In: Desmedt JE, editor. New Develop-ment EMG Clinical Neurophysiology 1. S. Karger; 1973. p 84.
14. Stalberg EJ. Neurol Neurosurg Psychiat 1980;43:475.15. De Luca CJ. CRC Crit Rev Biomed Eng 1984;11:251–279.16. Roy SH, De Luca CJ, Emley MC. J Rehab Res Dev 1997;34(4):
405–414.17. Knaflitz M, Balestra G, Angelini C, Cadaldini M. Basic App
Myol 1996;6(2):70,115.18. Masuda T, Miyano H, Sadoyama T. EEG Clin Neurophysiol
1983;55(5):594–600.19. Roark RM, Dowling EM, DeGroat RD, Watson BC, Schaefer
SD. J Speech Hear Res 1995;38(2):289–303.
108 ELECTROMYOGRAPHY
20. Zwarts MJ, Stegeman DF. Muscle Nerve 2003;28(1):1–17.21. Light CM, Chappell PH, Hudgins B, Engelhart K. Med Eng
Technol 2002;26(4):139–146.22. Nawab SH, Roy SH, De Luca CJ. The 26th Int Conf IEEE Eng
Med Biol Soc; San Francisco; 2004. p 979–982.23. Roy SH, Cheng MS, De Luca CJ. Boston: ISEK Congress;
2004.24. Nawab SH, Wotiz R, Hochstein L, De Luca CJ. Proceedings of
the Second Joint Meeting of the IEEE Eng Med and Biol Socand the Biomed Eng Soc; Houston: 2002. p 36–36.
25. Basmajian JV, De Luca CJ. Muscles Alive. 5th ed. Baltimore:Williams & Wilkins; 1985.
26. De Luca CJ. Muscle Nerve 1993;16:210–216.27. LeFever RS, De Luca CJ. Proc Annu Conf Eng Med Biol
1976;18:56.28. Lago P, Jones NB. Med Biol Eng Comput 1977;15:648.29. Buchthal F, Guld C, Rosenfalck P. Acta Physiol Scand
1957;39:83.30. De Luca CJ, Forrest WJ. IEEE Trans Biomed Eng BME
1972;19:367.31. Basmajian JV, Stecko GA. J Appl Physiol 1962;17:849.32. Willison RG. J Physiol (London) 1963;168:35.33. Lindstrom LR, Broman H, Magnusson R, Petersen I.
Neurophysiology 1973;7:801.34. Stulen FB, De Luca CJ. IEEE Trans Biomed Eng BME
1981;28:515.35. Constable R, Thornhill RJ, Carpenter RR. Biomed Sci
Instrum 1994;30:69.
See also ELECTROPHYSIOLOGY; REHABILITATION AND MUSCLE TESTING.
ELECTRON MICROSCOPY. See MICROSCOPY,ELECTRON.
ELECTRONEUROGRAPHY
THOMAS SINKJÆR
KEN YOSHIDA
WINNIE JENSEN
VEIT SCHNABEL
Aalborg UniversityAalborg, Denmark
INTRODUCTION
Recording techniques developed over the past three dec-ades have made it possible to study the peripheral andcentral nervous system (CNS) in detail and often duringunconstrained conditions. There have been many studiesusing the ElectroNeuroGram (ENG) to investigate thephysiology of the neuromuscular system, in particular,chronic studies in freely moving animals (1,2). Other stu-dies relate to monitoring the state of the nerve (e.g., inrelation to axotomized nerves and regeneration of nervefibers). Clinically, the ENG is used to measure the conduc-tion velocities and latencies in peripheral nerves by stimu-lating a nerve at different points along the nerve.Extracellular potentials can be recorded by either con-
centric needle electrodes or surface electrodes. The poten-tials can be derived from purely sensory nerve, fromsensory components of mixed nerve, or from motor nerves(3). The study of extracellular potentials from sensorynerves in general has been shown to be of considerablevalue in diagnosing peripheral nerve disorders. For anindebt description of the ENG in clinical neurophysiologysee Ref. 4. Several studies pertain to the use of sensorysignals as feedback information to control neuroprostheticdevices. Studies (5) have shown that the application ofclosed-loop control techniques can improve the regulationof the muscle activation. Techniques using an electricalinterface to nerves innervating natural sensors (6–12),such as those found in the skin, muscles, tendons, andjoints are an attractive alternative to artificial sensors.Since these natural sensors are present throughout thebody, remain functional after injury, and are optimallyplaced through evolution to provide information for nat-ural feedback control, a rich source of information thatcould be used to control future FES devices exists as long asa method can be found to access them.
Interestingly, much of the peripheral sensory apparatusin spinal and brain-injured human individuals is viable.This means that the natural sensors are transmittingrelevant nerve signals through the peripheral nervoussystem. Therefore, if the body’s natural sensors are toprovide a suitable feedback signal for the control of FESsystems in paralyzed subjects, the challenge is to be able toextract reliable and relevant information from the nerveinnervating the sensors over extended periods.
The nerve cuff electrode still has an unrivaled positionas a tool for recording ENG signals from peripheral nervesin chronic experiments (13,14) and as means to provideinformation to be used in neural prosthesis systems(9,15,16). Other kinds of electrodes are to challenge thecuff electrode, such as intra-fascicular electrodes (6,10,18)or multisite electrodes with hundreds of contacts within afew cubic millimeters (2,10,11,17–19). These types ofnerve-interface provide advantages with respect to selec-tivity and number of sensors.
This article describes the characteristics of the periph-eral nerve signals, principals of neural recordings, and thesignals obtained with different electrodes in long-termimplants. An essential part in the success of recordingperipheral neural signals or activating peripheral neuraltissue is the neural interface.
THE PERIPHERAL NERVOUS SYSTEM
A peripheral nerve contains thousands of nerve fibers, eachof them transmitting information, either from the periph-ery to the CNS or from the CNS to the periphery. Theefferent fibers transmit information to actuators; mainlymuscles, whereas afferent fibers transmit sensory infor-mation about the state of organs and events (e.g., musclelength, touch, skin temperature, joint angles, nociception,and several other modalities of sensory information). Mostof the peripheral nerves contain both afferent and efferentfibers, and the peripheral nerve can thus be seen as abidirectional information channel.
ELECTRONEUROGRAPHY 109