Embed Size (px)
Citation preview

233
5
Voltage Regulation
One of a utility’s core responsibilities is to deliver voltage to customerswithin a suitable range, so utilities must regulate the voltage. On distributioncircuits, voltage drops due to current flowing through the line impedances.Primary and secondary voltage drop can be allocated as necessary along thecircuit to provide end users with suitable voltage. Voltage regulators — inthe substation or on feeders — can adjust primary voltage. This chapterdiscusses voltage regulators and regulation standards and techniques.
5.1 Voltage Standards
Most regulatory bodies and most utilities in America follow the ANSI voltagestandards (ANSI C84.1-1995). This standard specifies acceptable operationalranges at two locations on electric power systems:
•
Service voltage
— The service voltage is the point where the electricalsystems of the supplier and the user are interconnected. This isnormally at the meter. Maintaining acceptable voltage at the serviceentrance is the
utility’s
responsibility.•
Utilization voltage
— The voltage at the line terminals of utilizationequipment. This voltage is the
facility’s
responsibility. Equipmentmanufacturers should design equipment which operates satisfacto-rily within the given limits.
The standard allows for some voltage drop within a facility, so servicevoltage requirements are tighter than utilization requirements.
The standard also defines two ranges of voltage:
•
Range A —
Most service voltages are within these limits, and utilitiesshould design electric systems to provide service voltages within
9576_C05.fm Page 233 Friday, October 14, 2005 9:20 AM
Copyright © 2006 Taylor & Francis Group, LLC

234
Electric Power Distribution Equipment and Systems
these limits. As the standard says, voltage excursions “should beinfrequent.”
•
Range B —
These requirements are more relaxed than Range A limits.According to the standard: “Although such conditions are a part ofpractical operations, they shall be limited in extent, frequency, andduration. When they occur, corrective measures shall be undertakenwithin a reasonable time to improve voltages to meet Range Arequirements.” Utilization equipment should give acceptable per-formance when operating within the Range B utilization limits,“insofar as practical” according to the standard.
These limits only apply to sustained voltage levels and not to momentaryexcursions, sags, switching surges, or short-duration interruptions.
Table 5.1 shows the most important limits, the limits on low-voltage sys-tems. The table is given on a 120-V base; it applies at 120 V but also to anylow-voltage system up to and including 600 V. The main target for utilitiesis the Range A service voltage, 114 to 126 V.
ANSI C84.1 defines three voltage classes: low voltage (1 kV or less),medium voltage (greater than 1 kV and less than 100 kV), and high voltage(greater than or equal to 100 kV). Within these classes, ANSI provides stan-dard nominal system voltages along with the voltage ranges. A more detailedsummary of the ANSI voltages is shown in Table 5.2 and Table 5.3.
For low-voltage classes, two nominal voltages are given — one for theelectric system and a second, somewhat lower, nominal for the utilizationequipment (for low-voltage motors and controls; other utilization equipmentmay have different nominal voltages). In addition, the standard gives com-mon nameplate voltage ratings of equipment as well as information on whatnominal system voltages the equipment is applicable to. As the standardpoints out, there are many inconsistencies between equipment voltage rat-ings and system nominal voltages.
For medium-voltage systems, ANSI C84.1 gives tighter limits for RangesA and B. Range A is –2.5 to +5%, and Range B is –5 to +5.8%. However, mostutilities do not follow these as limits for their primary distribution systems(utilities use the ANSI service voltage guidelines and set their primary volt-age limits to meet the service voltage guidelines based on their practices).The three-wire voltages of 4,160, 6,900, and 13,800 V are mainly suited forindustrial customers with large motors. Industrial facilities use motors onthese systems with ratings of 4,000, 6,600, and 13,200 V, respectively.
TABLE 5.1
ANSI C84.1 Voltage Ranges for 120 V
Service Voltage
Utilization VoltageMinimum Maximum Minimum Maximum
Range A 114 (–5%) 126 (+5%) 110 (–8.3%) 125 (+4.2%)Range B 110 (–8.3%) 127 (+5.8%) 106 (–11.7%) 127 (+5.8%)
9576_C05.fm Page 234 Friday, October 14, 2005 9:20 AM
Copyright © 2006 Taylor & Francis Group, LLC

Voltage Regulation
235
Improper voltage regulation can cause many problems for end users. Sus-tained overvoltages or undervoltages can cause the following end-useimpacts:
•
Improper or less-efficient equipment operation
— For example, lightsmay give incorrect illumination or a machine may run fast or slow.
•
Tripping of sensitive loads
— For example, an uninterruptible powersupply (UPS) may revert to battery storage during high or lowvoltage. This may drain the UPS batteries and cause an outage tocritical equipment.
In addition, undervoltages can cause
•
Overheating of induction motors
— For lower voltage, an inductionmotor draws higher current. Operating at 90% of nominal, the full-load current is 10 to 50% higher, and the temperature rises by 10 to15%. With less voltage, the motor has reduced motor starting torque.
TABLE 5.2
ANSI Standard Nominal System Voltages and Voltage Ranges for
Low-Voltage Systems
NominalSystemVoltage
NominalUtilization
Voltage
Range A
Range B
Maximum
Minimum
Maximum
MinimumUtilizationand Service
Voltage
a
ServiceVoltage
UtilizationVoltage
Utilizationand Service
VoltageServiceVoltage
UtilizationVoltage
Two Wire, Single Phase
120 115 126 114 110 127 110 106
Three Wire, Single Phase
120/240 115/230 126/252 114/228 110/220 127/254 110/220 106/212
Four Wire, Three Phase
208Y/120 200 218/126 197/114 191/110 220/127 191/110 184/106240/120 230/115 252/126 228/114 220/110 254/127 220/110 212/106
480Y/277 460 504/291 456/263 440/254 508/293 440/254 424/245
Three Wire, Three Phase
240 230 252 228 220 254 220 212
480 460 504 456 440 508 440 424
600 575 630 570 550 635 550 530
Note:
Bold entries show preferred system voltages.
a
The maximum utilization voltage for Range A is 125 V or the equivalent (+4.2%) for othernominal voltages through 600 V.
9576_C05.fm Page 235 Friday, October 14, 2005 9:20 AM
Copyright © 2006 Taylor & Francis Group, LLC
236
Electric Power Distribution Equipment and Systems
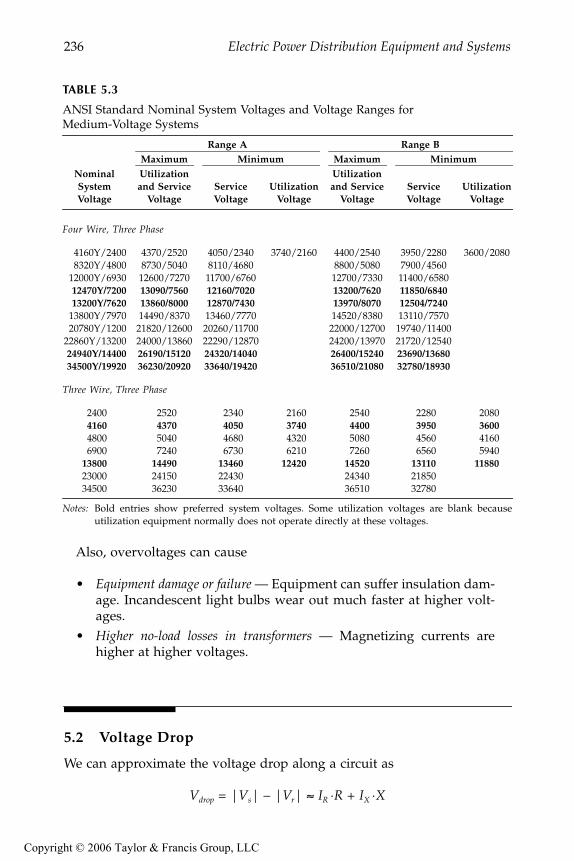
Also, overvoltages can cause
•
Equipment damage or failure
— Equipment can suffer insulation dam-age. Incandescent light bulbs wear out much faster at higher volt-ages.
•
Higher no-load losses in transformers
— Magnetizing currents arehigher at higher voltages.
5.2 Voltage Drop
We can approximate the voltage drop along a circuit as
V
drop
= |V
s
| – |V
r
|
≈
I
R
·R + I
X
·X
TABLE 5.3
ANSI Standard Nominal System Voltages and Voltage Ranges for
Medium-Voltage Systems
NominalSystemVoltage
Range A
Range B
Maximum
Minimum
Maximum
MinimumUtilizationand Service
VoltageServiceVoltage
UtilizationVoltage
Utilizationand Service
VoltageServiceVoltage
UtilizationVoltage
Four Wire, Three Phase
4160Y/2400 4370/2520 4050/2340 3740/2160 4400/2540 3950/2280 3600/20808320Y/4800 8730/5040 8110/4680 8800/5080 7900/4560
12000Y/6930 12600/7270 11700/6760 12700/7330 11400/6580
12470Y/7200 13090/7560 12160/7020 13200/7620 11850/684013200Y/7620 13860/8000 12870/7430 13970/8070 12504/7240
13800Y/7970 14490/8370 13460/7770 14520/8380 13110/757020780Y/1200 21820/12600 20260/11700 22000/12700 19740/11400
22860Y/13200 24000/13860 22290/12870 24200/13970 21720/12540
24940Y/14400 26190/15120 24320/14040 26400/15240 23690/1368034500Y/19920 36230/20920 33640/19420 36510/21080 32780/18930
Three Wire, Three Phase
2400 2520 2340 2160 2540 2280 2080
4160 4370 4050 3740 4400 3950 3600
4800 5040 4680 4320 5080 4560 41606900 7240 6730 6210 7260 6560 5940
13800 14490 13460 12420 14520 13110 11880
23000 24150 22430 24340 2185034500 36230 33640 36510 32780
Notes:
Bold entries show preferred system voltages. Some utilization voltages are blank becauseutilization equipment normally does not operate directly at these voltages.
9576_C05.fm Page 236 Friday, October 14, 2005 9:20 AM
Copyright © 2006 Taylor & Francis Group, LLC

Voltage Regulation
237
where
V
drop
= voltage drop along the feeder, V
R
= line resistance,
Ω
X
= line reactance,
Ω
I
R
= line current due to real power flow (in phase with the voltage), A
I
X
= line current due to reactive power flow (90
°
out of phase with the voltage), A
In terms of the load power factor,
pf
, the real and reactive line currents are
where
I =
magnitude of the line current, A
pf
= load power factor
qf
= load reactive power factor = sin(cos
–1
(
pf
))
θ
= angle between the voltage and the current
While just an approximation, Brice (1982) showed that
I
R
·R + I
X
·X
is quiteaccurate for most distribution situations. The largest error occurs underheavy current and leading power factor. The approximation has an error lessthan 1% for an angle between the sending and receiving end voltages up to8
°
(which is unlikely on a distribution circuit). Most distribution programsuse the full complex phasor calculations, so the error is mainly a consider-ation for hand calculations.
This approximation highlights two important aspects about voltage drop:
•
Resistive load
— At high power factors, the voltage drop stronglydepends on the resistance of the conductors. At a power factor of0.95, the reactive power factor (
qf
) is 0.31; so even though the resis-tance is normally smaller than the reactance, the resistance plays amajor role.
•
Reactive load
— At moderate to low power factors, the voltage dropdepends mainly on the reactance of the conductors. At a power factorof 0.8, the reactive power factor is 0.6, and because the reactance isusually larger than the resistance, the reactive load causes most of thevoltage drop. Poor power factor significantly increases voltage drop.
Voltage drop is higher with lower voltage distribution systems, poor powerfactor, single-phase circuits, and unbalanced circuits. The main ways toreduce voltage drop are to:
• Increase power factor (add capacitors)• Reconductor with a larger size
I I pf I
I I qf I I pf
R
X
= ⋅ =
= ⋅ = = −
cos
sin sin(cos ( ))
θ
θ 1
9576_C05.fm Page 237 Friday, October 14, 2005 9:20 AM
Copyright © 2006 Taylor & Francis Group, LLC
238
Electric Power Distribution Equipment and Systems
• Balance circuits• Convert single-phase sections to three-phase sections• Reduce load• Reduce length
In many cases, we can live with significant voltage drop as long as wehave enough voltage regulation equipment to adjust for the voltage drop onthe circuit.
5.3 Regulation Techniques
Distribution utilities have several ways to control steady-state voltage. Themost popular regulation methods include:
• Substation load tap-changing transformers (LTCs)• Substation feeder or bus voltage regulators• Line voltage regulators• Fixed and switched capacitors
Most utilities use LTCs to regulate the substation bus and supplementaryfeeder regulators and/or switched capacitor banks where needed.
Taps on distribution transformers are another tool to provide proper volt-age to customers. Distribution transformers are available with and withoutno-load taps (meaning the taps are to be changed without load) with stan-dard taps of
±
2.5 and
±
5%. Utilities can use this feature to provide a fixedboost for customers on a circuit with low primary voltage. This also allowsthe primary voltage to go lower than most utilities would normally allow.Remember, the service entrance voltage is most important. Most distributiontransformers are sold without taps, so this practice is not widespread. It alsorequires consistency; an area of low primary voltage may have several trans-formers to adjust — if one is left out, the customers fed by that transformercould receive low voltage.
5.3.1 Voltage Drop Allocation and Primary Voltage Limits
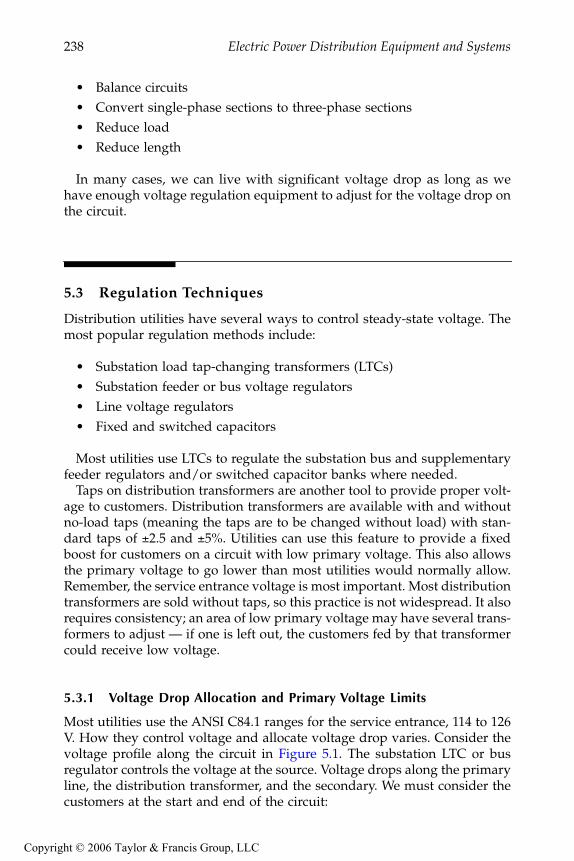
Most utilities use the ANSI C84.1 ranges for the service entrance, 114 to 126V. How they control voltage and allocate voltage drop varies. Consider thevoltage profile along the circuit in Figure 5.1. The substation LTC or busregulator controls the voltage at the source. Voltage drops along the primaryline, the distribution transformer, and the secondary. We must consider thecustomers at the start and end of the circuit:
9576_C05.fm Page 238 Friday, October 14, 2005 9:20 AM
Copyright © 2006 Taylor & Francis Group, LLC
Voltage Regulation
239
•
End — Heavily loaded
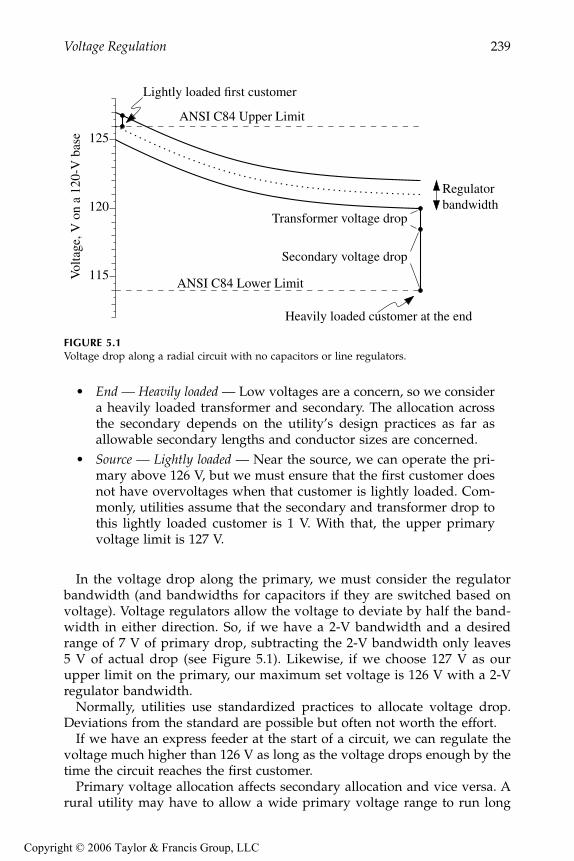
— Low voltages are a concern, so we considera heavily loaded transformer and secondary. The allocation acrossthe secondary depends on the utility’s design practices as far asallowable secondary lengths and conductor sizes are concerned.
•
Source — Lightly loaded
— Near the source, we can operate the pri-mary above 126 V, but we must ensure that the first customer doesnot have overvoltages when that customer is lightly loaded. Com-monly, utilities assume that the secondary and transformer drop tothis lightly loaded customer is 1 V. With that, the upper primaryvoltage limit is 127 V.
In the voltage drop along the primary, we must consider the regulatorbandwidth (and bandwidths for capacitors if they are switched based onvoltage). Voltage regulators allow the voltage to deviate by half the band-width in either direction. So, if we have a 2-V bandwidth and a desiredrange of 7 V of primary drop, subtracting the 2-V bandwidth only leaves5 V of actual drop (see Figure 5.1). Likewise, if we choose 127 V as ourupper limit on the primary, our maximum set voltage is 126 V with a 2-Vregulator bandwidth.
Normally, utilities use standardized practices to allocate voltage drop.Deviations from the standard are possible but often not worth the effort.
If we have an express feeder at the start of a circuit, we can regulate thevoltage much higher than 126 V as long as the voltage drops enough by thetime the circuit reaches the first customer.
Primary voltage allocation affects secondary allocation and vice versa. Arural utility may have to allow a wide primary voltage range to run long
FIGURE 5.1
Voltage drop along a radial circuit with no capacitors or line regulators.
115
120
125
ANSI C84 Upper Limit
ANSI C84 Lower Limit
Lightly loaded first customer
Heavily loaded customer at the end
Transformer voltage drop
Secondary voltage drop
Regulatorbandwidth
Vol
tage
,Von
a12
0-V
base
9576_C05.fm Page 239 Friday, October 14, 2005 9:20 AM
Copyright © 2006 Taylor & Francis Group, LLC

240
Electric Power Distribution Equipment and Systems
circuits, which leaves little voltage drop left for the transformer and second-ary. Since rural loads are typically each fed by their own transformer, ruralutilities can run the primary almost right to the service entrance. Using low-impedance distribution transformers and larger-than-usual transformersalso helps reduce the voltage drop beyond the primary. For the secondaryconductors, triplex instead of open wire and larger size conductors helpreduce secondary drop. Utilities that allow less primary voltage drop canrun longer secondaries.
Utility practices on voltage limits on the primary range widely, as shownin Table 5.4. The upper range is more consistent — most are from 125 to 127V — unless the utility uses voltage reduction (for energy conservation orpeak shaving). The lower range is more variable, anywhere from 112 to 123V. Obviously, the utility that uses a 112-V lower limit is not required to abideby the ANSI C84.1 limits.
5.3.2 Load Flow Models
Load flows provide voltage profiles that help when planning new distribu-tion circuits, adding customers, and tracking down and fixing voltage prob-lems. Most distribution load-flow programs offer a function to plot thevoltage as a function of distance from the source.
We can model a distribution circuit at many levels of detail. Many utilitiesare modeling more of their systems in more detail. For most load flows,
TABLE 5.4
Primary Voltage Ranges at Several Utilities
Service Area Type Minimum MaximumPercentRange
Dense urban area 120 127 5.4Dense urban area 117 126 7.5Urban/suburban 114 126 10.0Urban/suburban 115 125 8.3Urban/suburban
No conservation reduction 119 126 5.8With conservation reduction 119 123 3.3
Multi-state area 117 126 7.5Multi-state area
Urban standard 123 127 3.3Rural standard 119 127 6.6
Suburban and rural 113 125 10.0Suburban and rural
Urban standard 116 125 7.5Rural standard 112 125 10.8
Urban and rural 115 127 10.0Rural, mountainous 116 126 8.3Rural, mountainous 113 127 11.7
Source:
Willis, H. L.,
Power Distribution Planning Reference Book
, MarcelDekker, New York, 1997b, with additional utilities added.
9576_C05.fm Page 240 Friday, October 14, 2005 9:20 AM
Copyright © 2006 Taylor & Francis Group, LLC

Voltage Regulation
241
utilities normally just model the primary. Modeling the secondary is occa-sionally useful for modeling specific problems at a customer. We can stillhave very good models with simplifications. Modeling long laterals orbranches is normally a good idea, but we can lump most laterals togetheras a load where they tie into the main line. Modeling each transformer as aload is rarely worth the effort; we can combine loads together and maintainaccuracy with some common sense. Most mainline circuits can be accuratelymodeled if broken into 10 to 20 sections with load lumped with each section.Of course, accurate models of capacitors and line regulators are a good idea.
Correctly modeling load phasing provides a better voltage profile on eachphase. Unbalanced loads cause more voltage drop because of:
•
Higher loop impedance
— The impedance seen by unbalanced loads,the loop impedance including the zero-sequence impedance, ishigher than the positive-sequence impedance seen by balancedloads.
•
Higher current on the loaded phases
— If the current splits unevenlyby phases, the more heavily loaded phases see more voltage drop.
Utilities often do not keep accurate phasing information, but it helpsimprove load-flow results. We do not need the phasing on every transformer,but we will have better accuracy if we know the phasing of large single-phase taps.
Of the data entered into the load flow model, the load allocation is thetrickiest. Most commonly, loads are entered in proportion to the transformerkVA. If a circuit has a peak load equal to the sum of the kVA of all of theconnected transformers divided by 2.5, then each load is modeled as thegiven transformer size in kVA divided by 2.5. Incorporating metering datais another more sophisticated way to allocate load. If a utility has a trans-former load management system or other system that ties metered kilowatt-hour usage to a transformer to estimate loadings, feeding this data to theload flow can yield a more precise result. In most cases, all of the loads aregiven the same power factor, usually what is measured at the substation.Additional measurements could be used to fine-tune the allocation of powerfactor. Some utilities also assign power factor by customer class.
Most distribution load flow programs offer several load types, normallyconstant power, constant current, and constant impedance:
•
Constant power load
— The real and reactive power stays constant asthe voltage changes. As voltage decreases, this load draws morecurrent, which increases the voltage drop. A constant power modelis good for induction motors.
•
Constant current load —
The current stays constant as the voltagechanges, and the power increases with voltage. As voltage decreases,the current draw stays the same, so the voltage drop does not change.
9576_C05.fm Page 241 Friday, October 14, 2005 9:20 AM
Copyright © 2006 Taylor & Francis Group, LLC

242
Electric Power Distribution Equipment and Systems
•
Constant impedance load
— The impedance is constant as the voltagechanges, and the power increases as the square of the voltage. Asvoltage decreases, the current draw drops off linearly; so the voltagedrop decreases. The constant impedance model is good for incan-descent lights and other resistive loads.
Normally, we can model most circuits as something like 40 to 60% constantpower and 40 to 60% constant impedance (see Table 5.5 for one set ofrecommendations). Modeling all loads as constant current is a good approx-imation for many circuits. Modeling all loads as constant power is conser-vative for voltage drop.
5.3.3 Voltage Problems
Voltage complaints (normally undervoltages) are regular trouble calls forutilities. Some are easy to fix; others are not. First, check the secondary. Beforetackling the primary, confirm that the voltage problem is not isolated to thecustomers on the secondary. If secondary voltage drop is occurring, checkloadings, make sure the transformer is not overloaded, and check for a loosesecondary neutral.
If the problem is on the primary, some things to look for include:
•
Excessive unbalance
— Balancing currents helps reduce voltage drop.•
Capacitors
— Look for blown fuses, incorrect time clock settings,other incorrect control settings, or switch malfunctions.
•
Regulators
— Check settings. See if more aggressive settings canimprove the voltage profile enough: a higher set voltage, more linedrop compensation, and/or a tighter bandwidth.
These problems are relatively easy to fix. If it is not these, and if there istoo much load for the given amount of impedance, we will have to addequipment to fix the problem. Measure the primary voltage (and if possiblethe loadings) at several points along the circuit. An easy way to measure the
TABLE 5.5
Load Modeling Approximations Recommended by Willis (1997a)
Feeder TypePercent
Constant PowerPercent
Constant Impedance
Residential and commercial, summer peaking 67 33Residential and commercial, winter peaking 40 60Urban 50 50Industrial 100 0Developing countries 25 75
Source:
Willis, H. L., “Characteristics of Distribution Loads,” in
Electrical Transmission andDistribution Reference Book
. Raleigh, NC, ABB Power T&D Company, 1997.
9576_C05.fm Page 242 Friday, October 14, 2005 9:20 AM
Copyright © 2006 Taylor & Francis Group, LLC

Voltage Regulation
243
primary voltage is to find a lightly loaded distribution transformer andmeasure the secondary voltage. Measure the power factor at the substation.A poor power factor greatly increases the voltage drop.
Load flows are a good tool to try out different options to improve voltageon a circuit. If possible, match voltage profiles with measurements on thecircuit. Measurements provide a good sanity check. Try to measure duringpeak load conditions. Regulator and capacitor controllers can provide extrainformation if they have data logging capability. Normally, we allocate theload for the model equally by transformer kVA. This may not always beright, and measurements can help “tweak” the model. A load flow can helpdetermine the best course of action. Where do we need a supplementary lineregulator? How many? Can fixed capacitors do the job? Do we need switchedcapacitors? Circuits with poor power factor are the best candidates for capac-itors as they will help reduce line losses as well as improve voltage.
In addition to extra regulating equipment, consider other options. Some-times, we can move one or more circuit sections to a different feeder toreduce the loading on the circuit. If transformers have taps, investigatechanging the transformer taps. Though it is expensive, we can also buildnew circuits, upgrade to a higher voltage, or reconductor.
5.3.4 Voltage Reduction
Utilities can use voltage adjustments as a way to manage system load.Voltage reduction can reduce energy consumption and/or reduce peakdemand. Several studies have shown roughly a linear response relationshipbetween voltage and energy use — a 1% reduction in voltage reduces energyusage by 1% (or just under 1%, depending on the study). Kirshner andGiorsetto (1984) analyzed trials of conservation voltage reduction (CVR) atseveral utilities. While results varied significantly, most test circuits hadenergy savings of between 0.5 and 1% for each 1% voltage reduction. Theirregression analysis of the feeders found that residential energy savings were0.76% for each 1% reduction in voltage, while commercial and industrialloads had reductions of 0.99% and 0.41% (but the correlations between loadclass and energy reduction were fairly small).
Voltage reduction works best with resistive loads because the power drawnby a resistive load decreases with the voltage squared. Lighting and resistiveheating loads are the dominant resistive loads; these are not ideal resistiveloads. For example, the power on incandescent lights varies as the voltageto the power of about 1.6, which is not quite to the power of 2 but close.Residential and commercial loads have higher percentages of resistive load.For water heaters and other devices that regulate to a temperature, reducingvoltage does not reduce overall energy usage; the devices just run more often.
Voltage reduction to reduce demand has even more impact than that onenergy reduction. The most reduction occurs right when the voltage isreduced, and then some of the reduction is lost as some loads keep running
9576_C05.fm Page 243 Friday, October 14, 2005 9:20 AM
Copyright © 2006 Taylor & Francis Group, LLC

244
Electric Power Distribution Equipment and Systems
longer than normal to compensate for lower voltage. For example, Priessand Warnock (1978) found that during a 4-h, 5% voltage reduction, thedemand on one typical residential circuit dropped by 4% initially and dimin-ished to a 3% drop by the end of the 4-h period.
Voltage reduction works best on short feeders — those that do not havemuch voltage drop. On these, we can control reduction just through adjust-ments of the station LTC regulator settings. It is straightforward to set up asystem where operators can change the station set voltage through SCADA.On longer circuits, we need extra measures. Some strategies include:
•
Extra regulators — Extra regulators can help flatten the voltage profilealong the circuit. Each regulator is set with a set voltage and com-pensation settings appropriate for a tighter voltage range. Thisapproach is most appropriate for energy conservation. Controllingthe regulators to provide peak shaving is difficult; the communica-tions and controls add significantly to the cost.
• Feeder capacitors — The vars injected by capacitors help flatten thevoltage profile and allow a lower set voltage on the station LTC. Onmany circuits, just fixed capacitors can flatten the profile enough toreduce the station set voltage. McCarthy (2000) reported how Geor-gia Power used this strategy to reduce peak loads by 500 kW oncircuits averaging approximately 18 MW.
• Tighter bandwidth — With a smaller regulator bandwidth, the voltagespread on the circuit is smaller. A smaller bandwidth requires morefrequent regulator or LTC maintenance (the regulator changes tapsmore often) but not drastic differences. Kirshner (1990) reported thatreducing the bandwidth from 3 to 1.5 V doubled the number ofregulator tap changes.
• Aggressive line drop compensation — An aggressive line-drop com-pensation scheme can try to keep the voltage at the low end (say,at 114 V) for the last customer at all times. The set voltage in thestation may be 115 to 117 V, depending on the circuit voltage profile.Aggressive compensation boosts the voltage during heavy loads,while trying to keep voltages low at the ends of circuits. Duringlight loads, the station voltage may drop to well under 120 V. Thisstrategy helps the least at heavy load periods, so it is more usefulfor energy conservation than for peak shaving. Aggressive com-pensation makes low voltages more likely at the end of circuits. Ifany of the planning assumptions are wrong, especially power fac-tor and load placement, customers at the end of circuits can havelow voltages.
• Others — Other voltage profile improvement options help whenimplementing a voltage reduction program, although some of theseoptions, such as reconductoring, undergrounding, load balancing,and increasing primary voltage levels, are quite expensive.
9576_C05.fm Page 244 Friday, October 14, 2005 9:20 AM
Copyright © 2006 Taylor & Francis Group, LLC

Voltage Regulation 245
5.4 Regulators
Voltage regulators are autotransformers with automatically adjusting taps.Commonly, regulators provide a range from –10 to +10% with 32 steps. Eachstep is 5/8%, which is 0.75 V on a 120-V scale.
A single-phase regulator has three bushings: the source (S), the load (L),and the source-load (SL). The series winding is between S and L. Figure 5.2shows a straight regulator (ANSI type A) with the taps on the load side. AnANSI type B, the inverted design, has the taps on the source bushing. Theregulator controller measures current with a CT at the L bushing and mea-sures the voltage with a PT between L and SL. Regulators have a reversingswitch that can flip the series winding around to change back and forthbetween the boost and the buck connection.
Regulators are rated on current (IEEE Std. C57.15-1999). Regulators alsohave a kVA rating which is the two-winding transformer rating and not theload-carrying capability. A regulator at 7.62 kV line to ground with a ±10%range and a load current rating of 100 A has a kVA rating of 0.1(7.62kV)(100A) = 76 kVA. The load-carrying capability is ten times the regulator’skVA rating.
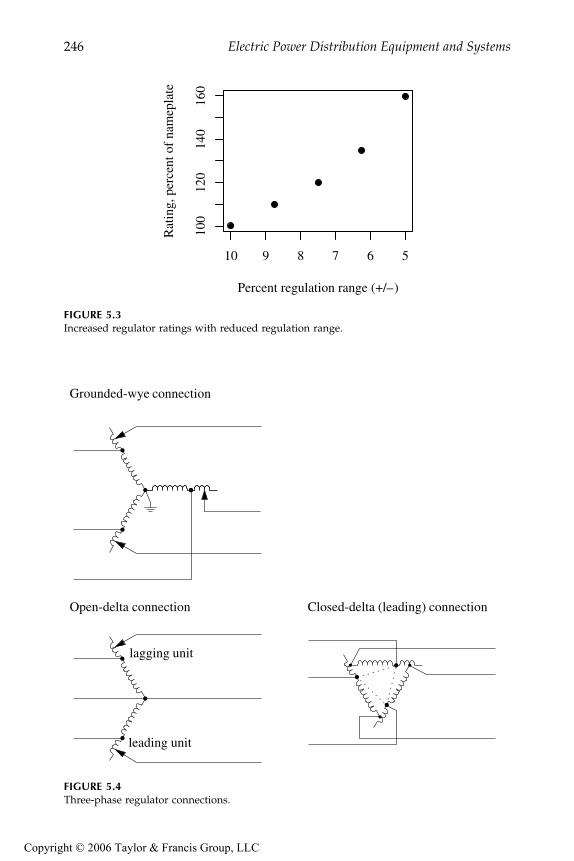
By reducing the range of regulation, we can extend the rating of theregulator. Reducing the range from ±10 to ±5% increases the rating by 60%(see Figure 5.3).
The impedance is the two-winding impedance times a base value aboutten times as large. Because the impedance is so small, we can normallyneglect it.
Three-phase regulators, often used in stations, are used on wye or deltasystems. A three-phase regulator controls all three phases simultaneously.These are normally larger units. The normal connection internally is a wyeconnection with the neutral point floating.
Commonly, utilities use single-phase units, even for regulating three-phasecircuits. We can connect single-phase regulators in several ways [see Figure5.4 and (Bishop et al., 1996)]:
FIGURE 5.2ANSI type A single-phase regulator, meaning taps on the load bushing.
Boost connection
SL
SL
Buck connection
SL
SL
9576_C05.fm Page 245 Friday, October 14, 2005 9:20 AM
Copyright © 2006 Taylor & Francis Group, LLC
246 Electric Power Distribution Equipment and Systems
FIGURE 5.3Increased regulator ratings with reduced regulation range.
FIGURE 5.4Three-phase regulator connections.
Percent regulation range (+/–)
Rat
ing,
per
cent
of
nam
epla
te
10 9 8 7 6 5
100
120
140
160
Grounded-wye connection
Open-delta connection Closed-delta (leading) connection
lagging unit
leading unit
9576_C05.fm Page 246 Friday, October 14, 2005 9:20 AM
Copyright © 2006 Taylor & Francis Group, LLC
Voltage Regulation 247
• Line to neutral — On four-wire systems, three-phase circuits normallyhave three single-phase regulators connected line to neutral. Line-to-neutral connections are also appropriate for single-phase and two-phase circuits. Each regulator independently controls voltage, whichhelps control voltage unbalance as well as steady-state voltage.
• Open delta — Only two single-phase regulators are needed, eachconnected phase to phase.
• Closed delta — Three regulators are connected phase to phase. Usingthe closed delta extends the regulation range by 50%, from ±10 to±15%.
In both of the delta connections, the regulators see a current phase-shiftedrelative to the voltage. In the leading connection with unity power factorloads, the line current through the regulator leads the line-to-line voltage by30°. The lagging connection has the current reversed: for a unit power factorload, the line current lags the line-to-line voltage by 30°. In the open-deltaconfiguration, one of the units is leading and the other is lagging. In theclosed-delta arrangement, all three units are either leading or all three arelagging. Although uncommon, both of the delta connections can be appliedon four-wire systems.
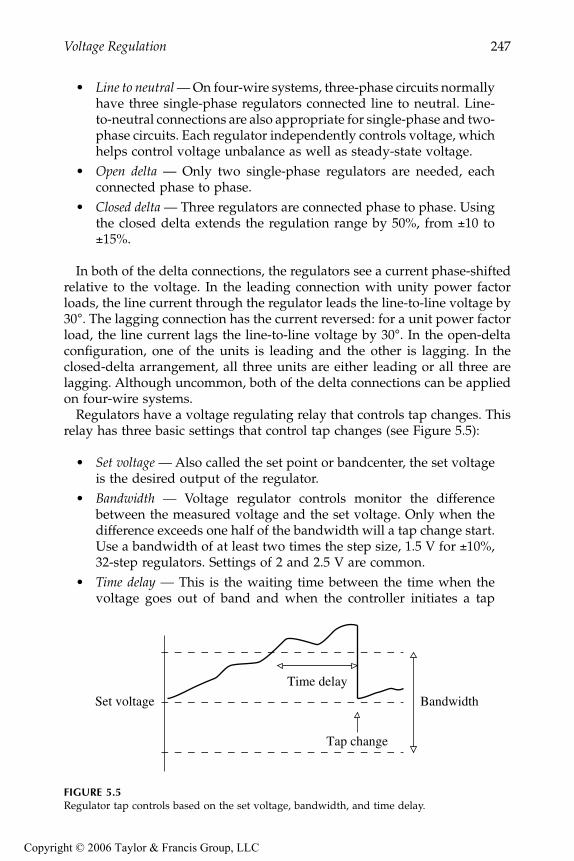
Regulators have a voltage regulating relay that controls tap changes. Thisrelay has three basic settings that control tap changes (see Figure 5.5):
• Set voltage — Also called the set point or bandcenter, the set voltageis the desired output of the regulator.
• Bandwidth — Voltage regulator controls monitor the differencebetween the measured voltage and the set voltage. Only when thedifference exceeds one half of the bandwidth will a tap change start.Use a bandwidth of at least two times the step size, 1.5 V for ±10%,32-step regulators. Settings of 2 and 2.5 V are common.
• Time delay — This is the waiting time between the time when thevoltage goes out of band and when the controller initiates a tap
FIGURE 5.5Regulator tap controls based on the set voltage, bandwidth, and time delay.
BandwidthSet voltage
Time delay
Tap change
9576_C05.fm Page 247 Friday, October 14, 2005 9:20 AM
Copyright © 2006 Taylor & Francis Group, LLC

248 Electric Power Distribution Equipment and Systems
change. Longer time delays reduce the number of tap changes. Typ-ical time delays are 30 to 60 sec.
If the voltage is still out of bounds after a tap change, the controller makesadditional tap changes until the voltage is brought within bounds. The exactdetails vary by controller, and some provide programmable modes. In somemodes, controllers make one tap change at a time. In other modes, thecontroller may initiate the number of tap changes it estimates are needed tobring the voltage back within bounds. The time delay relay resets if thevoltage is within bounds for a certain amount of time.
A larger bandwidth reduces the number of tap changes, but at a cost. Withlarger bandwidth, the circuit is not as tightly regulated. We should includethe bandwidth in voltage profile calculations to ensure that customers arenot given over or under voltages. Voltage that was used for bandwidth canbe used for voltage drop along the circuit. With a higher bandwidth we mayneed more regulators on a given line. So, use at least two times the step size,but do not use excessively high bandwidths such as 3 or 3.5 V.
In addition to these basics, regulator controllers also have line-drop com-pensation to boost voltages more during heavy load. Controllers also mayhave high and low voltage limits to prevent regulation outside of a desiredrange of voltages. In addition to the regulator and control application infor-mation provided here, see Beckwith (1998), Cooper Power Systems (1978),General Electric (1979), and Westinghouse (1965).
Many regulators are bi-directional units; they can regulate in either direc-tion, depending on the direction of power flow. A bi-directional regulatormeasures voltage on the source side using an extra PT or derives an estimatefrom the current. If the regulator senses reverse power flow, it switches toregulating the side that is normally the source side. We need reverse modefor a regulator on circuits that could be fed by an alternate source in thereverse direction. Without a reverse mode, the regulator can cause voltageproblems during backfeeds. If a unidirectional regulator is fed “backwards,”the regulator PT is now on the side of the source. Now, if the voltage drops,the regulator initiates a tap raise. However, the voltage the PT sees does notchange because it is on the source side (very stiff). What happened was thevoltage on the load side went down (but the regulator controller does notknow that because it is not measuring that side). The controller still seeslow voltage, so it initiates another tap raise which again lowers the voltageon the other side of the regulator. The controller keeps trying to raise thevoltage until it reaches the end of its regulation range. So, we have an alreadylow voltage that got dropped by an extra 10% by the unidirectional regulator.If the controller initially sees a voltage above its set voltage, it ratchets allthe way to the high end causing a 10% overvoltage. Also, if the incomingvoltage varies above and below the bandwidth, the regulator can run backand forth between extremes. A bi-directional regulator prevents these run-aways. Depending on its mode, under reverse power, a bi-directional reg-ulator can regulate in the reverse direction, halt tap changes, or move to the
9576_C05.fm Page 248 Friday, October 14, 2005 9:20 AM
Copyright © 2006 Taylor & Francis Group, LLC

Voltage Regulation 249
neutral point (these last two do not require PTs on both sides but just powerdirection sensing).
Regulators also have an operations counter. The counter helps identifywhen a regulator is due for refurbishment. Regulators are designed to per-form many tap changes, often over one million tap changes over the life ofa regulator. A regulator might change taps 70 times per day, which is 25,000times per year (Sen and Larson, 1994). A regulator counter also provides agood warning indicator; excessive operations suggest that something iswrong, such as wrong line drop compensation settings, a bandwidth or timedelay that is too small, or widely fluctuating primary voltages.
Regulators have “drag hands” — markers on the tap position indicatorthat show the maximum and minimum tap positions since the drag handswere last reset. The drag hands are good indicators of voltage problems. Ifmaintenance reviews continually show the drag upper hand pegging out at+10%, the upstream voltage is probably too low. More work is needed tocorrect the circuit’s voltage profile. Advanced controllers record much moreinformation, including tap change records and demand metering to profilevoltages, currents, and power factors.
5.4.1 Line-Drop Compensation
LTC transformer and regulator controls can be augmented with line-dropcompensation. During heavy load, the controller boosts voltage the most,and during light load, voltage is boosted the least. The line-drop compen-sator uses an internal model of the impedance of the distribution line tomatch the line impedance. The user can set the R and X values in thecompensator to adjust the compensation. The controller adjusts taps basedon the voltage at the voltage regulating relay, which is the PT voltage plusthe voltage across the line-drop compensator circuit (see Figure 5.6). Withno compensation, the voltage regulating relay adjusts the taps based on thePT voltage.
Since load on a typical distribution line is distributed, R and X compen-sator settings are chosen so that the maximum desired boost is obtained
FIGURE 5.6Line drop compensator circuit.
PT
CT Regulation point
Voltage Regulating
Relay
R XR X
I
I/ct
V/pt (R+jX)(I/ct)
9576_C05.fm Page 249 Friday, October 14, 2005 9:20 AM
Copyright © 2006 Taylor & Francis Group, LLC
250 Electric Power Distribution Equipment and Systems
under heavy load while a given voltage is obtained under light load. Thereare two main approaches for selecting settings:
• Load center — The settings are chosen to regulate the voltage at agiven point downstream of the regulator.
• Voltage spread — The R and X settings are chosen to keep the voltagewithin a chosen band when operating from light load to full load.The R and X settings may or may not be proportional to the line’sR and X.
The main complication of all of the methods is that the load and powerfactors change (especially with downstream capacitor banks). Many regula-tors are set up without line drop compensation. It is obviously easier andless prone to mistakes, but we are losing out on some significant capability.If we set the regulator set voltage at 120 V, and we do not get enough boostalong the line, we will need more regulators. With a higher set voltage suchas 126 V, we do not need as many regulators, but we have high voltages atlight load and possibly overvoltages if the circuit has capacitors. With linedrop compensation, we have boost when we need it during heavy load, butnot during light load (see Figure 5.7). Line-drop compensation also normallyleads to a smaller range of fluctuations in voltage through the day forcustomers along the circuit.
5.4.1.1 Load-Center Compensation
The classic way to set compensator settings is to use the load-center method.Consider a line with impedances RL and XL with a load at the end. Now, ifwe pick the Rset and Xset of the compensator to match those of the line, asthe load changes the regulator responds and adjusts the regulator taps tokeep the voltage constant, not at the regulator but at the load. To achievethis, we can set the Rset and Xset of the regulator as
whereRset = regulator setting for resistive compensation, VXset = regulator setting for reactive compensation, VICT = primary rating of the current transformer, A
NPT = potential transformer ratio (primary voltage/secondary voltage)RL = primary line resistance from the regulator to the regulation point, ΩXL = primary line reactance from the regulator to the regulation point, Ω
RIN
R
XIN
X
setCT
PTL
setCT
PTL
=
=
9576_C05.fm Page 250 Friday, October 14, 2005 9:20 AM
Copyright © 2006 Taylor & Francis Group, LLC

Voltage Regulation 251
A regulator’s R and X compensator settings are in units of volts. By usingvolts as units, we can directly see the impact of the regulator on a 120-Vscale. Consider an example where the set voltage is 120 V. With a current atunity power factor and Rset = 6 V (Xset does not matter at unity power factor),the controller regulates the voltage to 120 + 6 = 126 V when the current isat the peak CT rating. If the current is at half of the CT rating, the controllerregulates to the set voltage plus 3 or 123 V. Available compensator settingsare normally from –24 to +24 V.
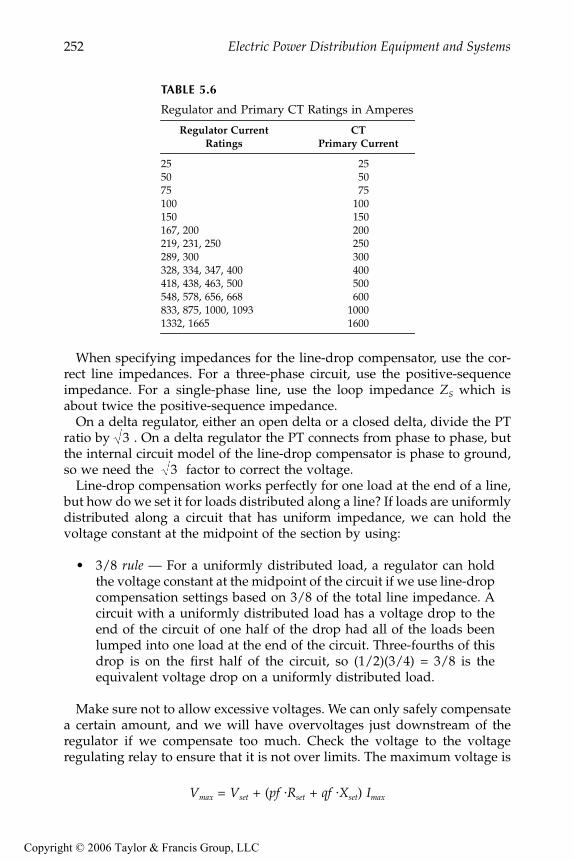
Note that the primary CT rating is an important part of the conversion tocompensator settings. The CT rating may be the same as the regulator ratingor it may be higher. The CT rating is given on the nameplate. Table 5.6 showsthe regulator ratings and primary CT current rating for one manufacturer.Regulators may be applied where the nameplate voltage does not match thesystem voltage if they are close enough to still allow the desired regulationrange at the given location. Also, some regulators have taps that allow themto be used at several voltages. Make sure to use the appropriate PT ratio forthe tap setting selected.
FIGURE 5.7Voltage profiles on a circuit with various forms of regulation.
Vset=120 V, No line drop compensation
114
118
122
126
Vset=126 V, No line drop compensation
Vol
tage
114
118
122
126
Line drop compensation
Source End114
118
122
126
Full loadLight load
9576_C05.fm Page 251 Friday, October 14, 2005 9:20 AM
Copyright © 2006 Taylor & Francis Group, LLC
252 Electric Power Distribution Equipment and Systems
When specifying impedances for the line-drop compensator, use the cor-rect line impedances. For a three-phase circuit, use the positive-sequenceimpedance. For a single-phase line, use the loop impedance ZS which isabout twice the positive-sequence impedance.
On a delta regulator, either an open delta or a closed delta, divide the PTratio by . On a delta regulator the PT connects from phase to phase, butthe internal circuit model of the line-drop compensator is phase to ground,so we need the factor to correct the voltage.
Line-drop compensation works perfectly for one load at the end of a line,but how do we set it for loads distributed along a line? If loads are uniformlydistributed along a circuit that has uniform impedance, we can hold thevoltage constant at the midpoint of the section by using:
• 3/8 rule — For a uniformly distributed load, a regulator can holdthe voltage constant at the midpoint of the circuit if we use line-dropcompensation settings based on 3/8 of the total line impedance. Acircuit with a uniformly distributed load has a voltage drop to theend of the circuit of one half of the drop had all of the loads beenlumped into one load at the end of the circuit. Three-fourths of thisdrop is on the first half of the circuit, so (1/2)(3/4) = 3/8 is theequivalent voltage drop on a uniformly distributed load.
Make sure not to allow excessive voltages. We can only safely compensatea certain amount, and we will have overvoltages just downstream of theregulator if we compensate too much. Check the voltage to the voltageregulating relay to ensure that it is not over limits. The maximum voltage is
Vmax = Vset + (pf ⋅Rset + qf ⋅Xset) Imax
TABLE 5.6
Regulator and Primary CT Ratings in Amperes
Regulator CurrentRatings
CTPrimary Current
25 2550 5075 75100 100150 150167, 200 200219, 231, 250 250289, 300 300328, 334, 347, 400 400418, 438, 463, 500 500548, 578, 656, 668 600833, 875, 1000, 1093 10001332, 1665 1600
3
3
9576_C05.fm Page 252 Friday, October 14, 2005 9:20 AM
Copyright © 2006 Taylor & Francis Group, LLC
Voltage Regulation 253
whereVset = regulator set voltageRset = resistive setting for compensation, VXset = reactive setting for compensation, V
pf = load power factorqf = load reactive power factor = sin(cos–1(pf))
Imax = maximum load current in per unit relative to the regulator CT rating
If V is more than what you desired, reduce Rset and Xset appropriately to meetyour desired limit.
5.4.1.2 Voltage-Spread Compensation
In another method, the voltage-spread method, we find compensator settingsby specifying the band over which the load-side voltage should operate. Forexample, we might want the regulator to regulate to 122 V at light load and126 V at full load. If we know or can estimate the light-load and full-loadcurrent, we can find R and X compensator settings to keep the regulatedvoltage within the proper range. If we want the regulator to operate over agiven compensation range C, we can choose settings to satisfy the following:
C = V – Vset = pf ⋅Rset + qf ⋅Xset
whereRset = resistive setting for compensation, VXset = reactive setting for compensation, V
pf = load power factorqf = load reactive power factor = sin(cos–1(pf))C = total desired compensation voltage, V
Vset = regulator set voltage, VV = voltage that the controller will try to adjust the regulator to, V
With line current operating to the regulator CT rating limit (which is oftenthe regulator size) and the current at the given power factor, these settingswill boost the regulator by C volts on a 120-V scale. Any number of settingsfor Rset and Xset are possible to satisfy this equation. If we take where the X/R ratio is selectable, the settings are
X RsetXR set=
RC
pf qf
XC
pf qfR
set XR
set
XR
XR
XR set
=+
=+
=
9576_C05.fm Page 253 Friday, October 14, 2005 9:20 AM
Copyright © 2006 Taylor & Francis Group, LLC

254 Electric Power Distribution Equipment and Systems
where = X/R ratio of the compensator settings
Note that C must be given as seen on the regulator PT secondaries, on a120-V base. As an example, if the feeder voltage should be not more than126 V at the limit of the regulator, and the desired voltage at no load is 122 V,set the regulator set voltage at 122 V and find Rset and Xset to give C = 4 V.For a power factor of 0.85 and = 3, the equations above give Rset = 1.64V and Xset = 4.94 V.
To control the voltage range for a light load other than zero and for a peakload other than the regulator CT rating, we can use the following to find thevoltage swing from light load to full load as
Vmax – Vmin = (pf ⋅Rset + qf ⋅Xset)Imax – (pf ⋅Rset + qf ⋅Xset)Imin
whereVmax = desired voltage at the maximum load current on a 120-V base, VVmin = desired voltage at the minimum load current on a 120-V base, VImax = maximum load current in per-unit relative to the regulator CT ratingImin = minimum load current in per-unit relative to the regulator CT rating
Now, the R and X settings are
And, the regulator set voltage is
With a compensator X/R ratio equal to the line X/R ratio, these equationsmove the effective load center based on the choice of voltage and currentminimums and maximums.
Just like we can choose to have the compensator X/R ratio equal the lineX/R ratio, we can choose other values as well. There are good reasons whywe might want to use other ratios; this is done mainly to reduce the sensi-tivity to power factor changes. The zero reactance method of selecting com-pensator makes Xset = 0 (and the compensator X/R = 0) but otherwise usesthe same equations as the voltage spread method (General Electric, 1979).
XR
XR
RV
pf qf I I
X R
set XR
setXR set
=−
+ −
=
max min
max min
V( )( )
V V pf R qf X Iset set set= − ⋅ + ⋅ = −−
−min min minmax min
max minminV
V VI I
I( )
9576_C05.fm Page 254 Friday, October 14, 2005 9:20 AM
Copyright © 2006 Taylor & Francis Group, LLC

Voltage Regulation 255
By making Xset zero, the compensator is not sensitive to variations in powerfactor caused by switched capacitors or load variation; only real powerchanges cause regulator movement. This method also simplifies applicationof regulators. The equations become
And, the regulator set voltage is
Vset = Vmin – (pf ⋅Rset)Imin
The equations simplify more if we assume that Imin = 0 (our error with thisis that voltages run on the high side during light load). A further simplifi-cation is to assume that the power factor is one. If the power factor is lessthan that at full load, the regulator will not boost the voltage quite as much.Often, we do not know the power factor at the regulator location anyway.
This method is useful with switched capacitor banks close to the regulator.It does not perform well for low power factors if we have assumed a powerfactor near unity. With this control, the regulator will not provide enoughboost with poor power-factor load.
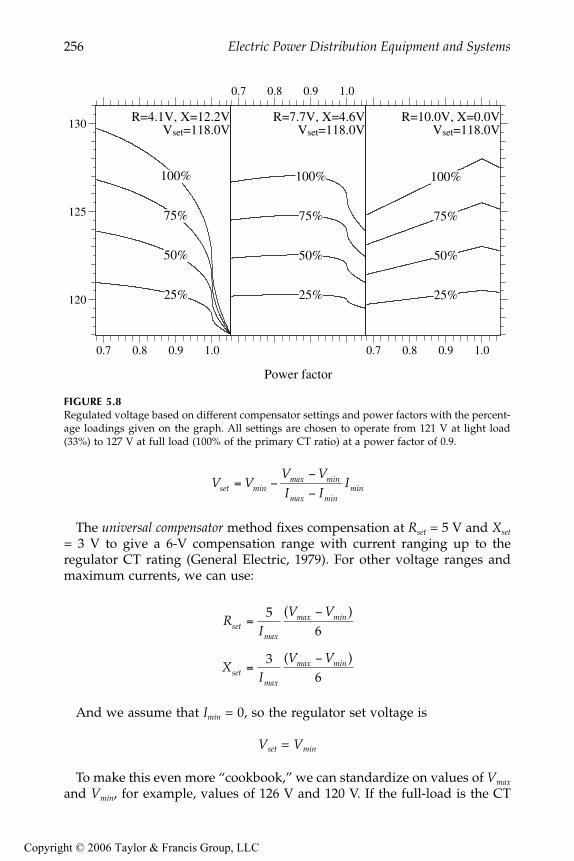
Another option is to take X/R = 0.6, which weights the real power flowmore than the reactive power flow, but not as extremely as the zero reactancecompensation method. So, although the controller is somewhat desensitizedto changes in power factor, the regulator provides some action based onreactive power. Figure 5.8 shows several X/R compensator settings chosento provide an operating band from 121 V at light load to 127 V at full load.The settings were chosen based on a power factor of 0.9, and the curvesshow the voltage as the power factor varies. The middle graph with X/R =0.6 performs well over a wide range of power factors. The graph on the left,where X/R = 3 which is the line X/R ratio, has the most variation with changesin power factor. If power factor is lower than we expected, the compensatorwill cause high voltages.
With X/R = 0.6 and pf = 0.9, the voltage spread equations are
And, the regulator set voltage is
R
X
set
set
=−
−
=
V Vpf(I I )
max min
max min
0
R
X R
set
set set
=−
−
=
0 86
0 6
.
.
V V(I I )
max min
max min
9576_C05.fm Page 255 Friday, October 14, 2005 9:20 AM
Copyright © 2006 Taylor & Francis Group, LLC
256 Electric Power Distribution Equipment and Systems
The universal compensator method fixes compensation at Rset = 5 V and Xset
= 3 V to give a 6-V compensation range with current ranging up to theregulator CT rating (General Electric, 1979). For other voltage ranges andmaximum currents, we can use:
And we assume that Imin = 0, so the regulator set voltage is
Vset = Vmin
To make this even more “cookbook,” we can standardize on values of Vmax
and Vmin, for example, values of 126 V and 120 V. If the full-load is the CT
FIGURE 5.8Regulated voltage based on different compensator settings and power factors with the percent-age loadings given on the graph. All settings are chosen to operate from 121 V at light load(33%) to 127 V at full load (100% of the primary CT ratio) at a power factor of 0.9.
R=4.1V, X=12.2VVset=118.0V
25%
50%
75%
100%
0.7 0.8 0.9 1.0
120
125
130R=7.7V, X=4.6V
Vset=118.0V
25%
50%
75%
100%
0.7 0.8 0.9 1.0
R=10.0V, X=0.0VVset=118.0V
25%
50%
75%
100%
0.7 0.8 0.9 1.0
Power factor
V VV VI I
Iset minmax min
max minmin= −
−
−
RI
XI
set
set
=−
=−
56
36
max
max min
max
max min
V V
V V
( )
( )
9576_C05.fm Page 256 Friday, October 14, 2005 9:20 AM
Copyright © 2006 Taylor & Francis Group, LLC

Voltage Regulation 257
rating (which we might want in order to be conservative), the default settingsbecome Rset = 5 V and Xset = 3 V. The universal compensation method is easyyet relatively robust.
With any of the voltage-spread methods of setting the R and X line-dropcompensation, the peak current is an important parameter. If we underesti-mate the load current, the regulator can overcompensate and cause high volt-ages (if we do not have a voltage override limiter or if it is disabled). Checkregulator loadings regularly to ensure that the compensation is appropriate.
5.4.1.3 Effects of Regulator Connections
On an open-delta regulator, one regulator is connected leading, and the otherlagging. We need to adjust the compensator settings to account for the 30°phase shift. On the leading regulator, the current leads the voltage by 30°;so we need to subtract 30° from the compensator settings, which is the sameas multiplying by 1∠30° or (cos 30° – j sin 30°). Modify the settings for theleading regulator (Cooper Power Systems, 1978; Westinghouse Electric Cor-poration, 1965) with
R′set = 0.866 Rset + 0.5Xset
X′set = 0.866 Xset – 0.5Rset
And for the lagging regulator we need to add 30°, which gives
R′set = 0.866 Rset – 0.5Xset
X′set = 0.866 Xset + 0.5Rset
For an X/R ratio above 1.67, R′set is negative on the lagging regulator; andfor a ratio below 0.58, X′set is negative on the leading regulator. Most con-trollers allow negative compensation.
In the field, how do we tell between the leading and the lagging regulator?Newer regulator controllers can tell us which is which from phase anglemeasurements. For older controllers, we can modify the compensator set-tings to find out (Lokay and Custard, 1954). Set the resistance value on bothregulators to zero, and set the reactance setting on both to the same nonzerovalue. The unit that moves up the most number of tap positions is the laggingunit (with balanced voltages, this is the unit that goes to the highest raiseposition). If the initial reactance setting is not enough, raise the reactancesettings until the leading and lagging units respond differently.
With a closed-delta regulator, all three regulators are connected eitherleading or lagging. All three regulators have the same set of compensatorsettings; adjust them all with either the leading or the lagging equationsdescribed for the open-delta regulator.
9576_C05.fm Page 257 Friday, October 14, 2005 9:20 AM
Copyright © 2006 Taylor & Francis Group, LLC

258 Electric Power Distribution Equipment and Systems
On a three-phase regulator, even on a delta system, the compensator set-tings do not need adjustment. The controller accounts for any phase shiftthat might occur inside the regulator.
5.4.2 Voltage Override
Use the voltage override feature on the regulator controller. No matter howwe select the line-drop compensation settings, an important feature is anupper voltage limit on the regulation action. The regulator keeps the regu-lated voltage below this limit regardless of the line-drop compensation set-tings. Always use this feature to protect against overvoltages caused byincorrect line-drop compensation settings or unusually high loadings. Thisupper voltage limiter is also called “first house protection,” as it is the firstfew customers downstream that could have overvoltages due to regulatoraction. With a voltage limit, we can set line-drop compensator settings moreaggressively and not worry about causing overvoltages to customers. On aregulator without an upper limit (normally older units), increase estimatedpeak loadings when calculating line-drop compensation settings in order toreduce the risk of creating overvoltages. Voltage override functions usuallyhave a deadband type setting on the voltage limit to prevent repeated tapchanges. For example, we might set a 126-V upper limit with a deadbandof an extra 2 V. Above 128 V the controller immediately taps the regulatordown to 126 V, and between 126 and 128 V the controller prohibits tap raises(different controllers implement this function somewhat differently; someinclude time delays). Even without line-drop compensation, the voltageoverride function helps protect against sudden changes in upstream voltages(the out-of-limit response is normally faster than normal time-delay settingsprogrammed into regulators).
5.4.3 Regulator Placement
With no feeder regulators, the entire voltage drop on a circuit must be withinthe allowed primary voltage range. One feeder regulator can cover primaryvoltage drops up to twice the allowed voltage variation. Similarly, two sup-plementary regulators can cover primary voltage drops up to three timesthe allowed variation. For a uniformly distributed load, optimum locationsfor two regulators are at distances from the station of approximately 20% ofthe feeder length for one and 50% for the other. For one feeder regulator, theoptimum location for a uniformly distributed load is at 3/8 of the line lengthfrom the station.
When placing regulators and choosing compensator settings, allow forsome load growth on the circuit. If a regulator is applied where the load isright near its rating, it may not be able to withstand the load growth. How-ever, it is more than just concern about the regulator’s capability. If we wantto keep the primary voltage above 118 V, and we add a regulator to a circuit
9576_C05.fm Page 258 Friday, October 14, 2005 9:20 AM
Copyright © 2006 Taylor & Francis Group, LLC
Voltage Regulation 259
right at the point where the primary voltage falls to 118 V, that will correctthe voltage profile along the circuit with present loadings. If loadingsincrease in the future, the voltage upstream of the regulator will drop below118 V. As previously discussed, when setting line-drop compensator settings,the maximum load on the regulator should allow room for load growth toreduce the chance that the regulator boosts the voltage too much.
Several regulators can be strung together on a circuit. Though this canmeet the steady-state voltage requirements of customers, it will create a veryweak source for them. Flicker problems from motors and other fluctuatingloads are more likely.
Also consider the effect of dropped load on regulators. A common case isa recloser downstream of a line regulator. If the regulator is tapped upbecause of heavy load and the recloser suddenly drops a significant portionof the load, the voltage downstream of the regulator will pop up until theregulator controller shifts the taps back down.
5.4.4 Other Regulator Issues
Normally, voltage regulators help with voltage unbalance as each regulatorindependently controls its phase. If we aggressively compensate, the line-dropcompensation can cause voltage unbalance. Consider a regulator set to operatebetween 120 V at no load and 126 V at full load. If one phase is at 50% loadand the other two are at 0% load, the line-drop compensator will tap to 123 Von the loaded phase and to 120 V on the unloaded phases. Depending oncustomer placements, this may be fine if the voltages correct themselves alongthe line. But if the unbalance is due to a large tapped lateral just downstreamof the regulator, the regulator needlessly unbalances the voltages.
Capacitor banks pose special coordination issues with regulators. A fixedcapacitor bank creates a constant voltage rise on the circuit and a constantreactive contribution to the current. Either fixed or switched, capacitorsupstream of a regulator do not interfere with the regulator’s control action.Downstream capacitors pose the problem. A capacitor just downstream ofa regulator affects the current that the regulator sees, but it does not mea-surably change the shape of the voltage profile beyond the regulator. In thiscase, we would like the line-drop compensation to ignore the capacitor. Thevoltage-spread compensation with a low compensator X/R or the zero-reac-tance compensator settings work well because they ignore or almost ignorethe reactive current, so it works with fixed or switched banks downstreamof the regulator. The load-center approach is more difficult to get to workwith capacitors.
We do not want to ignore the capacitor at the end of a circuit section weare regulating because the capacitor significantly alters the profile along thecircuit. In this case, we do not want zero-reactance compensation; we wantsome X to compensate for the capacitive current.
Switched capacitors can interact with the tap-changing controls on regu-lators upstream of the capacitors. This sort of interaction is rare but can
9576_C05.fm Page 259 Friday, October 14, 2005 9:20 AM
Copyright © 2006 Taylor & Francis Group, LLC
260 Electric Power Distribution Equipment and Systems
happen if the capacitor is controlled by voltage (not radio, not time of day,not vars). A regulator may respond to an upstream or downstream capacitorswitching, but that does not add up to many extra tap changes since thecapacitor switches infrequently. Normally, the capacitor cannot cycle backand forth against the regulator. The only case might be if the regulator hasnegative settings for the reactive line-drop compensation.
With several regulators in series, adjustments to the time delay settingsare the proper way to coordinate operations between units. Set the down-stream regulator with the longest time delay so it does not change tapsexcessively. For multiple regulators, increase the time delay with increasingdistance from the source. Tap changes by a downstream regulator do notchange the voltage upstream, but tap changes by an upstream regulatoraffect all downstream regulators. If a downstream regulator acts before theupstream regulator, the downstream regulator may have to tap again to meetits set voltage. Making the downstream regulator wait longer prevents itfrom tapping unnecessarily. Separate the time delays by at least 10 to 15 secto allow the upstream unit to complete tap change operations.
5.5 Station Regulation
Utilities most commonly use load tap changing transformers (LTCs) to con-trol distribution feeder voltages at the substation. In many cases (short, urban,thermally limited feeders) an LTC is all the voltage support a circuit needs.
An LTC or a stand-alone voltage regulator must compensate for the voltagechange on the subtransmission circuit as well as the voltage drop throughthe transformer. Of these, the voltage drop through the transformer is nor-mally the largest. Normally, the standard ±10% regulator can accomplishthis. A regulator can hit the end of its range if the load has especially poorpower factor. The voltage drop across a transformer follows:
Vdrop = IR · R + IX ·X
Since a transformer’s X/R ratio is so high, the reactive portion of the loadcreates the most voltage drop across the transformer. Consider a 10% imped-ance transformer at full load with a load power factor of 0.8, which meansthe reactive power factor is 0.6. In this case, the voltage drop across thetransformer is 6%. If the subtransmission voltage is 120 V (on a 120-V scale),the maximum that the regulator can boost the voltage to is 124 V. If thisexample had a transformer loaded to more than its base open-air rating(OA or ONAN), the regulator would be more limited in range. In mostcases, we do not run into this problem as power factors are normally muchbetter than these.
9576_C05.fm Page 260 Friday, October 14, 2005 9:20 AM
Copyright © 2006 Taylor & Francis Group, LLC

Voltage Regulation 261
In most cases, bus regulation suffices. For cases where circuits have sig-nificant voltage drop, individual feeder regulation can be better. Individualfeeder regulation also performs better on circuits with different load cycles.If commercial feeders are on the same bus as residential feeders, it is lesslikely that a bus regulator can keep voltages in line on all circuits. Normally,we handle this by using bus regulation and supplementary line regulators.In some cases, individual feeder regulation in the station is more appropriate.
The voltage on feeders serving secondary networks is controlled at theprimary substation with LTC transformers. These circuits are short enoughthat feeder regulators are unnecessary. Network feeders are often suppliedby parallel station transformers; paralleling LTC units raises several issuesthat are discussed in the next section.
5.5.1 Parallel Operation
With care, we can parallel regulators. The most common situation is in asubstation where a utility wants to parallel two LTC transformers. If twoparalleled transformers do not have the same turns ratio, current will circu-late to balance the voltages. The circulating current is purely reactive, but itadds extra loading on the transformer.
Some of the methods to operate LTC transformers in parallel (Jauch, 2001;Westinghouse Electric Corporation, 1965) include
• Negative-reactance control — The reactance setting in the line-dropcompensator is set to a negative value, so higher reactive currentforces the control to lower taps. The transformer with the higher taphas more reactive current, and the transformer with the lower tapis absorbing this reactive current (it looks capacitive to this trans-former). So, a negative-reactance setting forces the transformer withthe highest tap (and most reactive current) to lower its taps andbring it into alignment with the other unit. This method limits theuse of line-drop compensation and can lead to lower bus voltages.
• Master-follower — One controller, the master, regulates the voltageand signals the other tap changers (the followers) to match the tapsetting. The master control normally gets feedback from the follow-ers to confirm their operation.
• Var balancing — The controller adjusts taps as required to equalizethe vars flowing in parallel transformers. Auxiliary circuitry isrequired. This method has the advantage that it works with trans-formers fed from separate transmission sources.
• Circulating current method — This is the most common control. Aux-iliary circuitry is added to separate the load current through eachtransformer from the circulating current. Each transformer LTC con-trol is fed the load current. The controller adjusts taps to minimize
9576_C05.fm Page 261 Friday, October 14, 2005 9:20 AM
Copyright © 2006 Taylor & Francis Group, LLC

262 Electric Power Distribution Equipment and Systems
the difference in current between parallel units. Removing a unitdoes not require changing controller settings.
The complications associated with paralleling regulators are another rea-son utilities normally avoid closed bus ties in distribution substations.
5.5.2 Bus Regulation Settings
Although too often left unused, bus regulators (whether stand-alone regu-lators or load tap changing transformers) can use line-drop compensation.The concept of a load center rarely has good meaning for a bus supportingseveral circuits, but the voltage spread methods allow the regulator to boostvoltage under heavy load.
The voltage-spread equations assume that the power factor at full load isthe same as the power factor at light load. If the power factor is different atlight and peak loads, we can use this information to provide more precisesettings. We could solve the following to find new R and X settings withdifferent power factors
Vmax – Vmin = (pfmax ⋅ Rset + qfmax ⋅ Xset)Imax – (pfmin ⋅ Rset + qfmin ⋅ Xset)Imin
However, it is easier to use the equations in Section 5.4.1.2 and use theaverage of the power factor at peak load and the power factor at light load.With line-drop compensation for bus regulation, the voltage-override featurehelps to ensure that the LTC or regulator does not cause excessive voltages.
Individual substation feeder regulators are set the same as line feederregulators. We can tune controller settings more precisely based on theindividual characteristics of a given feeder. If the first part of the feeder isan express feeder with no load on it, we could boost the voltage higher thannormal, especially if the circuit is voltage limited. Our main constraint ismaking sure that the first customer does not have high voltage.
5.6 Line Loss and Voltage Drop Relationships
Line losses are from the line current flowing through the resistance of theconductors. After distribution transformer losses, primary line losses are thelargest cause of losses on the distribution system. Like any resistive losses,line losses are a function of the current squared multiplied by the resistance(I2R). Ways to reduce line losses include
• Use a higher system voltage• Balance circuits
9576_C05.fm Page 262 Friday, October 14, 2005 9:20 AM
Copyright © 2006 Taylor & Francis Group, LLC

Voltage Regulation 263
• Convert single-phase circuits to three-phase circuits• Reduce loads• Increase power factor (capacitors)• Reconductor with a larger size
Because losses are a function of the current squared, most losses occur onthe primary near the substation. Losses occur regardless of the power factorof the circuit. Reducing the reactive portion of current reduces the totalcurrent, which can significantly impact losses.
Approximations using uniform load distributions are useful. A uniformlydistributed load along a circuit of length l has the same losses as a singlelumped load placed at a length of l/3 from the source end. For voltage drop,the equivalent circuits are different: a uniformly distributed load along acircuit of length l has the same voltage drop as a single lumped load placedat a length of l/2 from the source end. This 1/2 rule for voltage drop andthe 1/3 rule for losses are helpful approximations when doing hand calcu-lations or when making simplifications to enter in a load-flow program.
For a uniformly increasing load, the equivalent lumped load is at 0.53l ofthe length from the source. Figure 5.9 shows equivalent circuits for a uniformload and a uniformly increasing load.
Line losses decrease as operating voltage increases because the currentdecreases. Schultz (1978) derived several expressions for primary feeder I2Rlosses on circuits with uniform load densities. His analysis showed that most15 to 35 kV circuits are not voltage-drop limited — most are thermallylimited. As the system voltage varies, the losses change the most for voltage-limited circuits (Schultz, 1978):
whereV1, V2 = voltage on circuits 1 and 2L1, L2 = feeder I2R losses on circuits 1 and 2
On a system-wide basis, losses are expected to change with voltage withan exponent somewhere between 2/3 and 2.
Losses, voltage drop, and capacity are all interrelated. Three-phase circuitshave the highest power transfer capacity, the lowest voltage drop, and thelowest losses. Table 5.7 compares capacity, voltage drop, and losses of abalanced three-phase system with several other phasing configurations.
LVV
L
LVV
L
21
2
2
1
21
2
2 3
1
=⎛
⎝⎜
⎞
⎠⎟
=⎛
⎝⎜
⎞
⎠⎟
for a voltage-limited circuit
for a thermally-limited circuit/
9576_C05.fm Page 263 Friday, October 14, 2005 9:20 AM
Copyright © 2006 Taylor & Francis Group, LLC

264 Electric Power Distribution Equipment and Systems
FIGURE 5.9Equivalent circuits of uniform loads.
Uniform load Uniformly increasing load
0
I
0
I2
0
l0
I
l0
l0 l0
I
I2
I
I
I
Equivalent circuits with one lumped load
Equivalent voltage drop
Equivalent line losses
12 l
13 l
Equivalent voltage drop12 l
I
I
Equivalent voltage drop23 l
815 l
Equivalent line losses
Line currents
Line currents squared
0
9576_C05.fm Page 264 Friday, October 14, 2005 9:20 AM
Copyright © 2006 Taylor & Francis Group, LLC

Voltage Regulation 265
Utilities consider both peak losses and energy losses. Peak losses areimportant because they compose a portion of the peak demand; energy lossesare the total kilowatt-hours wasted as heat in the conductors. The peak lossesare more easily estimated from measurements and models. The averagelosses can be found from the peak losses using the loss factor Fls:
Normally, we do not have enough information to directly measure the lossfactor. We do have the load factor (the average demand over the peakdemand). The loss factor is some function of the load factor squared. Themost common approximation (Gangel and Propst, 1965) is
This is often used for evaluating line losses and transformer load losses(which are also a function of I2R). Load factors closer to one result in lossfactors closer to one. Another common expression is . Fig-ure 5.10 shows both relationships.
TABLE 5.7
Characteristics of Various Systems
SystemCapacity
in per Unit
Voltage Dropin per Unit
for Equal kVA
Line Lossesin per Unit
for Equal kVA
Balanced three phase 1.0 1.0 1.0Two phases 0.5 2.0 2.0Two phases and a multigrounded neutral 0.67 2.0–3.3 1.2–3.0Two phases and a unigrounded neutral 0.67 2.5–4.5 2.25One phase and a multigrounded neutral 0.33 3.7–4.5 3.5–4.0One phase and a unigrounded neutral 0.33 6.0 6.0
Note: The two-phase circuits assume all load is connected line to ground. Neutrals are thesame size as the phases. Reduced neutrals increase voltage drop and (usually) line losses.The voltage drop and line loss ratios for circuits with multigrounded neutrals vary withconductor size.
Fls = Average losses
Peak losses
F F Fls ld ld= +0 15 0 85 2. .
F F Fls ld ld= +0 3 0 7 2. .
9576_C05.fm Page 265 Friday, October 14, 2005 9:20 AM
Copyright © 2006 Taylor & Francis Group, LLC

266 Electric Power Distribution Equipment and Systems
References
ANSI C84.1-1995, American National Standards for Electric Power Systems and Equipment— Voltage Ratings (60 Hz).
Beckwith, Basic Considerations for the Application of LTC Transformers and AssociatedControls, Beckwith Electric Company, Application Note #17, 1998.
Bishop, M. T., Foster, J. D., and Down, D. A., “The Application of Single-Phase VoltageRegulators on Three-Phase Distribution Systems,” IEEE Industry ApplicationsMagazine, pp. 38–44, July/August 1996.
Brice, C. W., “Comparison of Approximate and Exact Voltage Drop Calculations forDistribution Lines,” IEEE Transactions on Power Apparatus and Systems, vol. PAS-101, no. 11, pp. 4428–31, November, 1982.
Cooper Power Systems, “Determination of Regulator Compensator Settings,” 1978.Publication R225-10-1.
Gangel, M. W. and Propst, R. F., “Distribution Transformer Load Characteristics,”IEEE Transactions on Power Apparatus and Systems, vol. 84, pp. 671–84, August1965.
General Electric, Omnitext, 1979. GET-3537B.IEEE Std. C57.15-1999, IEEE Standard Requirements, Terminology, and Test Code for Step-
Voltage Regulators.Jauch, E. T., “Advanced Transformer Paralleling,” IEEE/PES Transmission and Dis-
tribution Conference and Exposition, 2001.Kirshner, D., “Implementation of Conservation Voltage Reduction at Commonwealth
Edison,” IEEE Transactions on Power Systems, vol. 5, no. 4, pp. 1178–82, Novem-ber 1990.
FIGURE 5.10Relationship between load factor and loss factor.
0.0 0.5 1.00.0
0.2
0.4
0.6
0.8
1.0
Load factor
Los
s fa
ctor
Fls 0 3Fld 0 7F2ld
Fls 0 15Fld 0 85F 2ld
9576_C05.fm Page 266 Friday, October 14, 2005 9:20 AM
Copyright © 2006 Taylor & Francis Group, LLC

Voltage Regulation 267
Kirshner, D. and Giorsetto, P., “Statistical Tests of Energy Savings Due to VoltageReduction,” IEEE Transactions on Power Apparatus and Systems, vol. PAS-103,no. 6, pp. 1205–10, June 1984.
Lokay, H. E. and Custard, R. L., “A Field Method for Determining the Leading andLagging Regulator in an Open-Delta Connection,” AIEE Transactions, vol. 73,Part III, pp. 1684–6, 1954.
McCarthy, C., “CAPS — Choosing the Feeders, Part I,” in Systems Engineering Tech-nical Update: Cooper Power Systems, 2000.
Priess, R. F. and Warnock, V. J., “Impact of Voltage Reduction on Energy and De-mand,” IEEE Transactions on Power Apparatus and Systems, vol. PAS-97, no. 5,pp. 1665–71, Sept/Oct 1978.
Schultz, N. R., “Distribution Primary Feeder I2R Losses,” IEEE Transactions on PowerApparatus and Systems, vol. PAS-97, no. 2, pp. 603–9, March–April 1978.
Sen, P. K. and Larson, S. L., “Fundamental Concepts of Regulating DistributionSystem Voltages,” IEEE Rural Electric Power Conference, Department of Elec-trical Engineering, Colorado University, Denver, CO, 1994.
Westinghouse Electric Corporation, Distribution Systems, vol. 3, 1965.Willis, H. L., “Characteristics of Distribution Loads,” in Electrical Transmission and
Distribution Reference Book. Raleigh, NC: ABB Power T&D Company, 1997a.Willis, H. L., Power Distribution Planning Reference Book, Marcel Dekker, New York,
1997b.
Regs? Treat them with respect. They are a transformer. Anyone who has droppedload with a tx knows that you can build a fire if you don’t take the load intoconsideration. The difference with regs is that the load is the feeder. Get it?
anonymous postwww.powerlineman.com
9576_C05.fm Page 267 Friday, October 14, 2005 9:20 AM
Copyright © 2006 Taylor & Francis Group, LLC


![Evaluation of Requirements for Volt/Var Control and ... · utilities follow the ANSI American National Standards Institute voltage standards (ANSI C84.1-1995) [7]-[9]. The acceptable](https://img.pdfslide.us/doc/110x75/5e7411d0add64c47ed0b5312/evaluation-of-requirements-for-voltvar-control-and-utilities-follow-the-ansi.jpg)


![Advanced(Laboratory(Tes1ng(Methods( · PDF fileAdvanced(Laboratory(Tes1ng(Methods ... outside the requirements of ANSI C84.1-1995, Range A” [18]. ... limits from ANSI C84.1 Range](https://img.pdfslide.us/doc/110x75/5aa44e417f8b9a1d728bb2eb/advancedlaboratorytes1ngmethods-laboratorytes1ngmethods-outside-the.jpg)