Embed Size (px)
Citation preview
Relion. Thinking beyond the box.
Designed to seamlessly consolidate functions, Relion relays are smarter,
more flexible and more adaptable. Easy to integrate and with an
extensive function library, the Relion family of protection and control
delivers advanced functionality and improved performance.
This webinar brought to you by the Relion® product family
ABB is pleased to provide you with technical information regarding protective
relays. The material included is not intended to be a complete presentation of
all potential problems and solutions related to this topic. The content is
generic and may not be applicable for circumstances or equipment at any
specific facility. By participating in ABB's web-based Protective Relay School,
you agree that ABB is providing this information to you on an informational
basis only and makes no warranties, representations or guarantees as to the
efficacy or commercial utility of the information for any specific application or
purpose, and ABB is not responsible for any action taken in reliance on the
information contained herein. ABB consultants and service representatives
are available to study specific operations and make recommendations on
improving safety, efficiency and profitability. Contact an ABB sales
representative for further information.
ABB Protective Relay School Webinar SeriesDisclaimer
Volt-VAR OptimizationStephen Trachian and Aroldo Couto
November 4, 2014
ABB Protective Relay School Webinar Series

Presenter
Stephen graduated from the University of Tennessee at Chattanooga
with a Bachelor of Science in Engineering in 2001.
He began his career in the electric utility industry as a Design Engineer
with the Tennessee Valley Authority.
While at the TVA, Stephen worked in the Protection and Control,
Substation Communications, and Communications Planning and
Architecture groups.
Stephen is currently a System Architect for the ABB Smart Grid Center
of Excellence in Raleigh, North Carolina
November 4, 2014 | Slide 4©ABB
Presenter
Aroldo Couto has spent over 15 years as an applications engineer
delivering automation and control systems solutions for both
manufacturing and electrical industry.
During his career, he has worked on a variety of automation and
controls projects including transmission and distribution substation
automation, machine vision and control systems providing feedback for
product development and process improvements.
He holds a Master in Electrical and Computer Engineering from
Auburn University and Bachelors in Electrical and Computer
Engineering from UFG Brazil.
Aroldo is currently a “System Verification Engineer” for “Smart Grid
Distribution Automation” in ABB for the North America Region.
November 4, 2014 | Slide 5©ABB
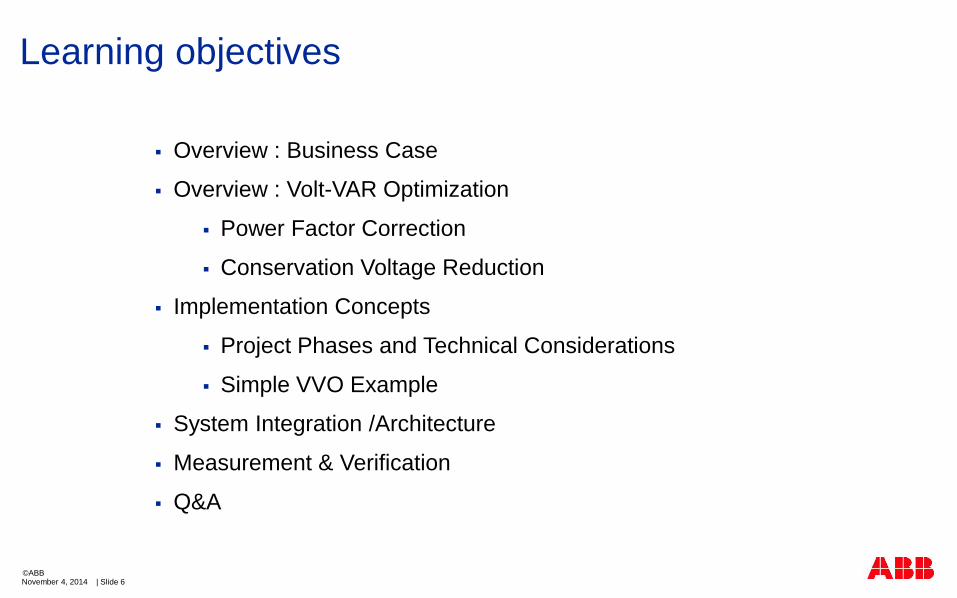
Learning objectives
Overview : Business Case
Overview : Volt-VAR Optimization
Power Factor Correction
Conservation Voltage Reduction
Implementation Concepts
Project Phases and Technical Considerations
Simple VVO Example
System Integration /Architecture
Measurement & Verification
Q&A
November 4, 2014 | Slide 6©ABB
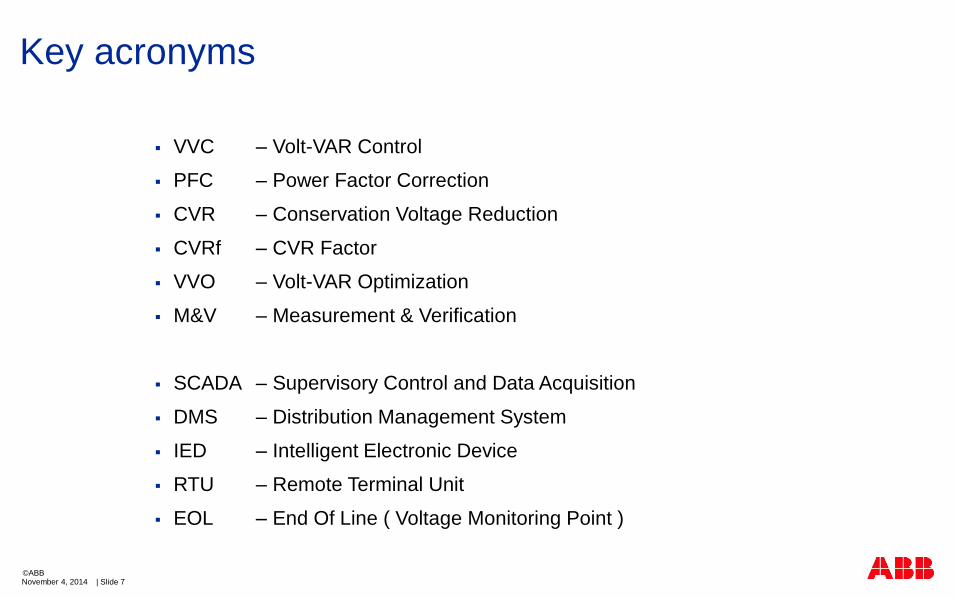
Key acronyms
VVC – Volt-VAR Control
PFC – Power Factor Correction
CVR – Conservation Voltage Reduction
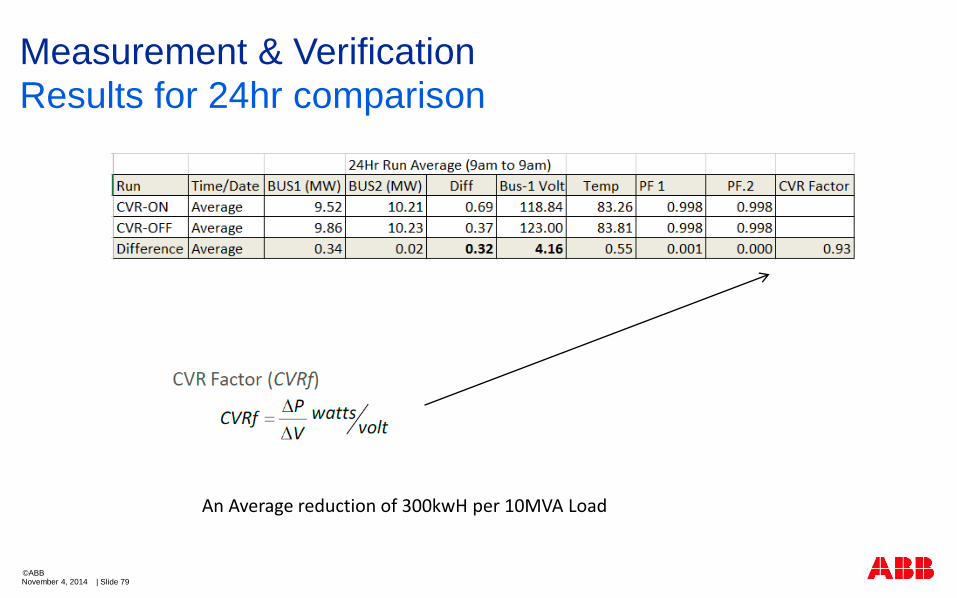
CVRf – CVR Factor
VVO – Volt-VAR Optimization
M&V – Measurement & Verification
SCADA – Supervisory Control and Data Acquisition
DMS – Distribution Management System
IED – Intelligent Electronic Device
RTU – Remote Terminal Unit
EOL – End Of Line ( Voltage Monitoring Point )
November 4, 2014 | Slide 7©ABB
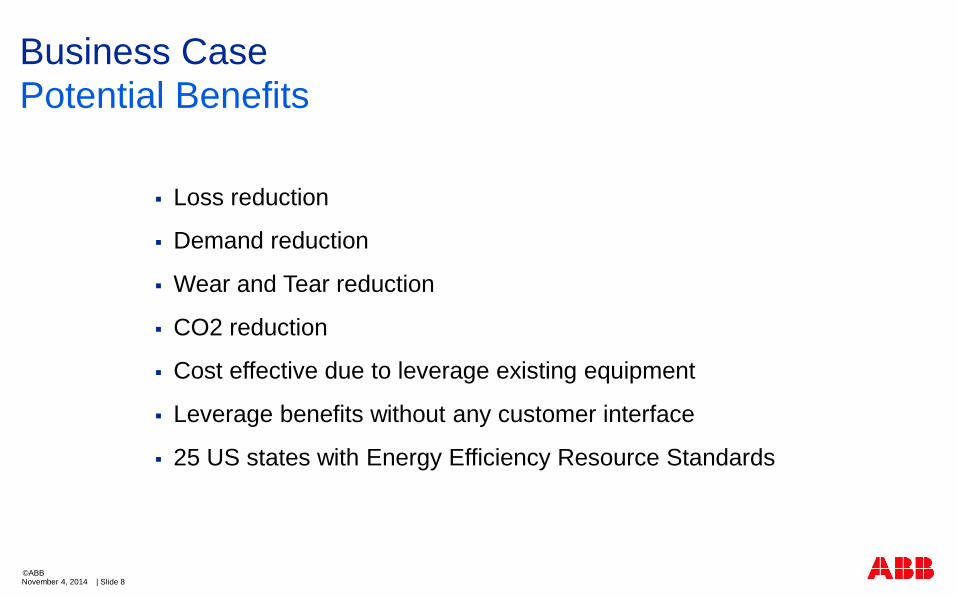
Business Case
Potential Benefits
November 4, 2014 | Slide 8©ABB
Loss reduction
Demand reduction
Wear and Tear reduction
CO2 reduction
Cost effective due to leverage existing equipment
Leverage benefits without any customer interface
25 US states with Energy Efficiency Resource Standards
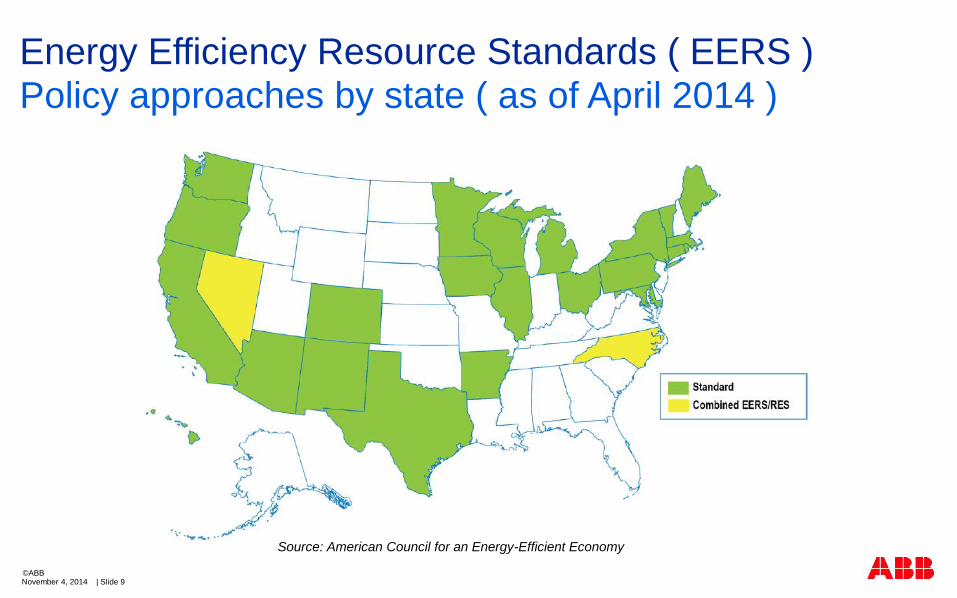
Energy Efficiency Resource Standards ( EERS )
Policy approaches by state ( as of April 2014 )
November 4, 2014 | Slide 9©ABB
Source: American Council for an Energy-Efficient Economy

Business Case
Power Factor Correction ONLY
November 4, 2014 | Slide 10©ABB
Simple VAR Support Calculator
12/16/20MVA Transformer - Average Load 8.5MWh
Variable Utility
Number of Substations 1
Number of Feeder Circuits 4
Annual Load [MWh] 74,555
Starting Power Factor 0.980
Ending Power Factor 0.998
Percentage Reduction [%] in System Load due to Power Factor Improvement 1.8%
Calculations Volt/VAR
Total Annual Load Savings (MWh) [Percentage Reduction * Annual Load] 1,342
Average rate [$/kwh] $0.098
Value of Annual Load Savings [$] [Average rate * Total Annual Load Savings] 131,515
First Year - Implementation Cost 125,000
Annual Savings (Starting in Year 2) 131,515
Simple Payback [years] 2.08
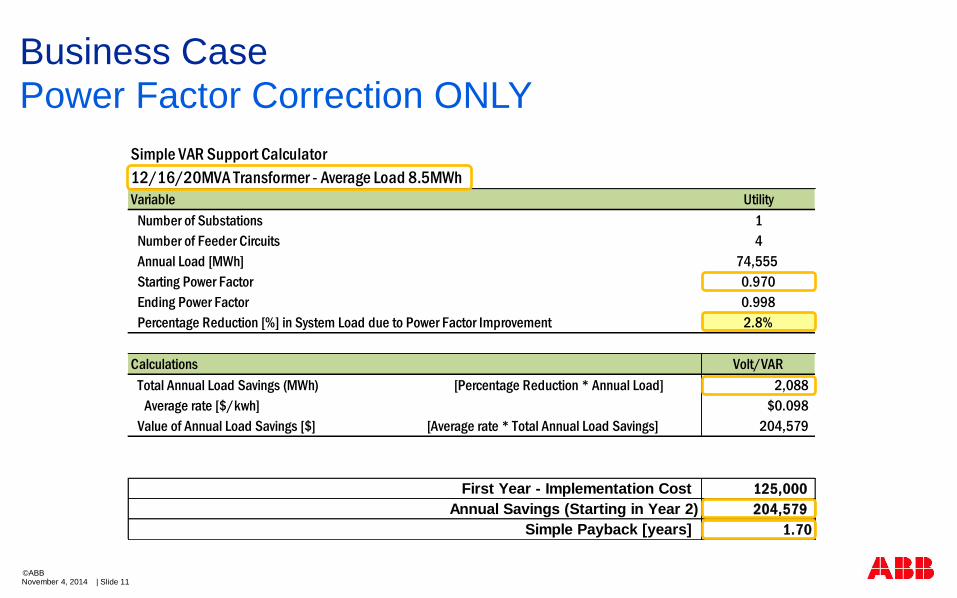
Business Case
Power Factor Correction ONLY
November 4, 2014 | Slide 11©ABB
Simple VAR Support Calculator
12/16/20MVA Transformer - Average Load 8.5MWh
Variable Utility
Number of Substations 1
Number of Feeder Circuits 4
Annual Load [MWh] 74,555
Starting Power Factor 0.970
Ending Power Factor 0.998
Percentage Reduction [%] in System Load due to Power Factor Improvement 2.8%
Calculations Volt/VAR
Total Annual Load Savings (MWh) [Percentage Reduction * Annual Load] 2,088
Average rate [$/kwh] $0.098
Value of Annual Load Savings [$] [Average rate * Total Annual Load Savings] 204,579
First Year - Implementation Cost 125,000
Annual Savings (Starting in Year 2) 204,579
Simple Payback [years] 1.70
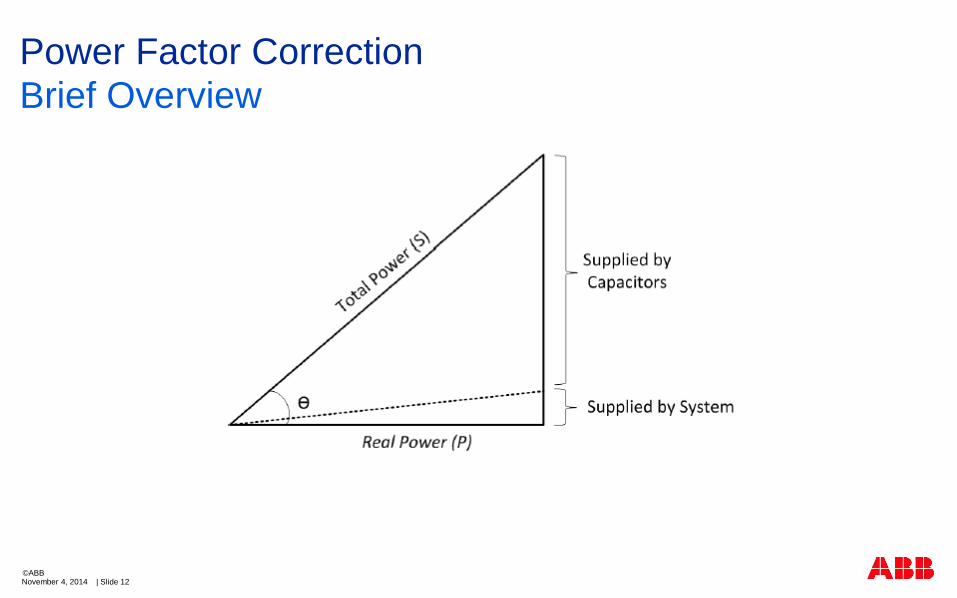
Power Factor Correction
Brief Overview
November 4, 2014 | Slide 12©ABB
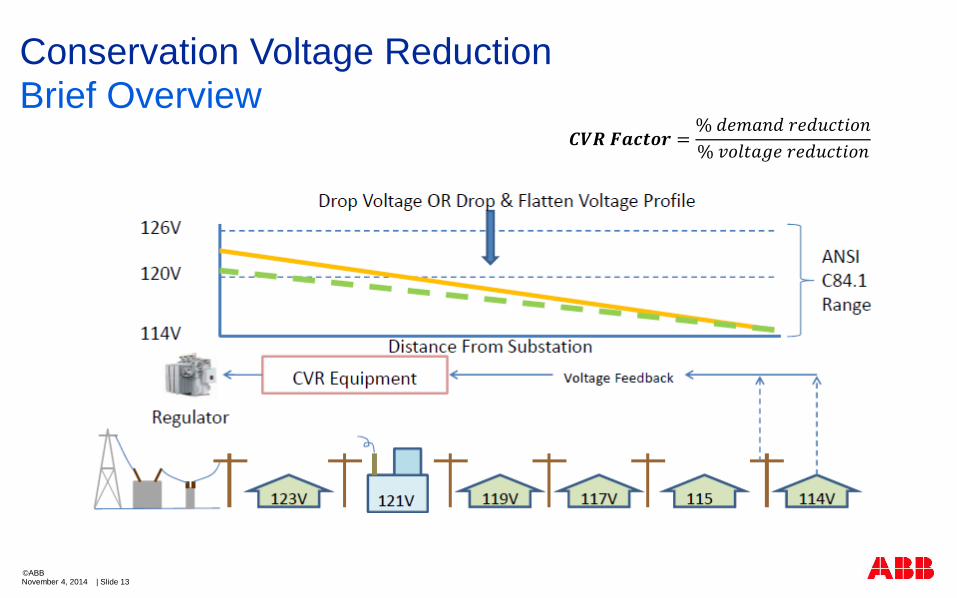
Conservation Voltage Reduction
Brief Overview
November 4, 2014 | Slide 13©ABB
𝑪𝑽𝑹 𝑭𝒂𝒄𝒕𝒐𝒓 =% 𝑑𝑒𝑚𝑎𝑛𝑑 𝑟𝑒𝑑𝑢𝑐𝑡𝑖𝑜𝑛
% 𝑣𝑜𝑙𝑡𝑎𝑔𝑒 𝑟𝑒𝑑𝑢𝑐𝑡𝑖𝑜𝑛
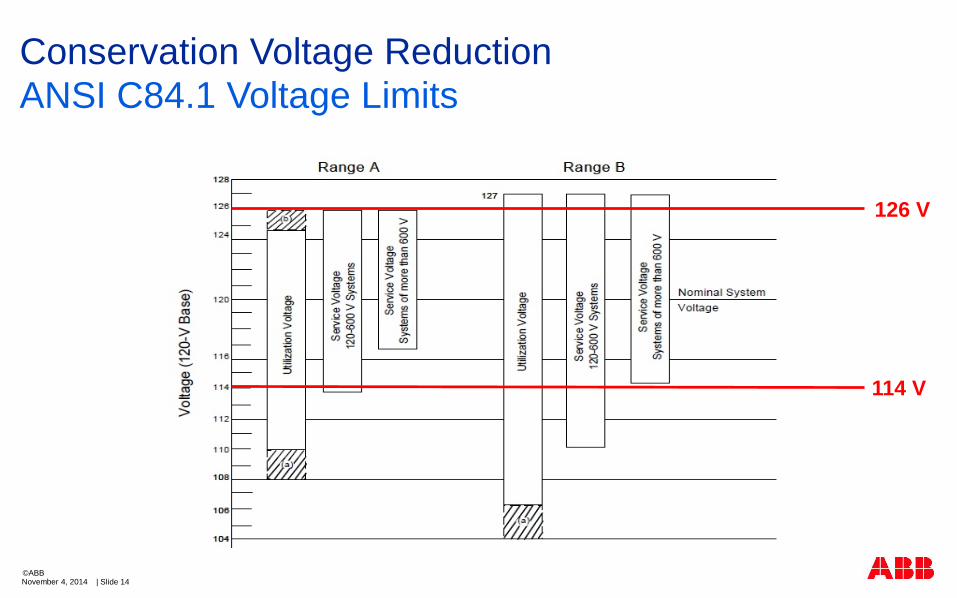
Conservation Voltage Reduction
ANSI C84.1 Voltage Limits
November 4, 2014 | Slide 14©ABB
126 V
114 V
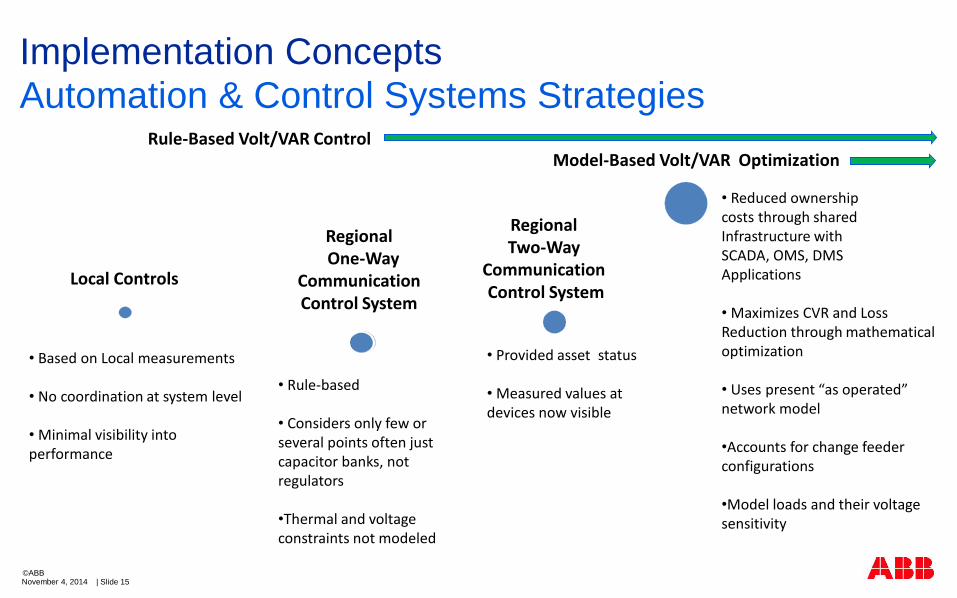
Implementation Concepts
Automation & Control Systems Strategies
November 4, 2014 | Slide 15©ABB
Local Controls
RegionalOne-Way
CommunicationControl System
Model-Based Volt/VAR Optimization
RegionalTwo-Way
CommunicationControl System
Rule-Based Volt/VAR Control
• Reduced ownership costs through sharedInfrastructure withSCADA, OMS, DMSApplications
• Maximizes CVR and Loss Reduction through mathematical optimization
• Uses present “as operated” network model
•Accounts for change feeder configurations
•Model loads and their voltage sensitivity
• Provided asset status
• Measured values at devices now visible
• Based on Local measurements
• No coordination at system level
• Minimal visibility into performance
• Rule-based
• Considers only few or several points often just capacitor banks, not regulators
•Thermal and voltage constraints not modeled
Implementation Concepts
Technical Considerations
November 4, 2014 | Slide 16©ABB
Traditional power factor correction solutions are able to solve simple power factor problems at local levels
How do you know the capacitor bank is online and functioning properly?
How do you know the overall power factor is being optimally corrected?
Traditional CVR correction techniques involve lowering LTC/regulator tap positions at feeder/bus heads to implement demand response
How do you know the utilization/service voltages are within acceptable ANSI C84.1 limits?
How do you know the voltage level has been optimized without closed loop voltage monitoring on the system?
Centralized VVO automation applications can help solve all of these challenges, while providing better optimization at a system wide level.
Implementation Concepts
VVO Control Objectives
November 4, 2014 | Slide 17©ABB
The control objectives of VVO are :
MW loss reduction via feeder power and/or substation PFC
Demand reduction via CVR
Voltage violation correction
Implementation Concepts
VVO Control Problem
November 4, 2014 | Slide 18©ABB
The control problem of VVO is to determine :
if a capacitor’s switching status should be changed
If the tap setting of a voltage regulator should be raised or lowered
If the reactive power of controllable Distributed Generation should be
changed and by how much
Implementation Concepts
VVO Technical Challenges
November 4, 2014 | Slide 19©ABB
A few properties of the VVO make it a technically difficult problem :
The discrete nature of the controls
Limitation on switching operations
Implementation Concepts
System Components
November 4, 2014 | Slide 20©ABB
• Automation application
• Software (eg ABB MicroSCADA Pro)
• Hardware : hardened computer or a traditional server
• Distribution circuit components
• Equipment (cap banks, reg banks, LTCs, reclosers, EOL sensors, etc.)
• Intelligent electronic devices (IEDs)
• Telecommunications equipment
• Typically wireless radios for telemetry to distribution circuit devices
• Fiber can also be integrated where feasible, such as station backhaul
Implementation Concepts
Project Steps
November 4, 2014 | Slide 21©ABB
Planning
Model circuits to determine optimum equipment layout and investment requirements based upon project budget
Identify EOL monitoring locations to ensure ANSI C84.1 compliance
Telecommunications site survey for any wireless infrastructure
Engineering/Procurement
Circuit engineering for new equipment (no different than “traditional” engineering)
System engineering for automation application (VVO)
Telecommunications engineering for wired/wireless infrastructure
Integration (may be associated with factory acceptance testing)
Ensure all distribution/telecommunications/automation applications function together as one congenial system!
Testing/Commissioning (typically associated with site acceptance testing)
Implementation Concepts
Example Feeder Scenario - Base Case
November 4, 2014 | Slide 22©ABB
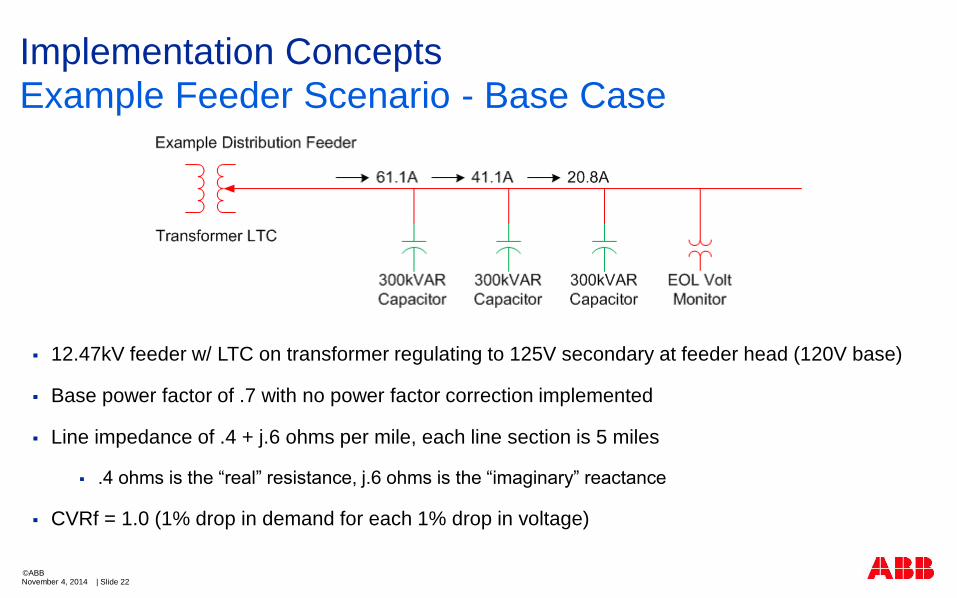
12.47kV feeder w/ LTC on transformer regulating to 125V secondary at feeder head (120V base)
Base power factor of .7 with no power factor correction implemented
Line impedance of .4 + j.6 ohms per mile, each line section is 5 miles
.4 ohms is the “real” resistance, j.6 ohms is the “imaginary” reactance
CVRf = 1.0 (1% drop in demand for each 1% drop in voltage)
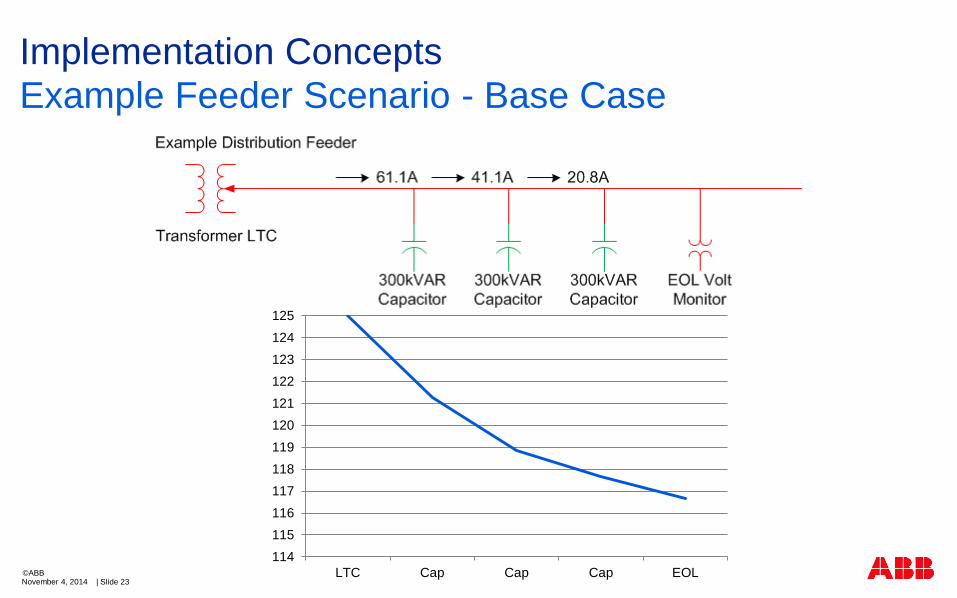
Implementation Concepts
Example Feeder Scenario - Base Case
November 4, 2014 | Slide 23©ABB
114
115
116
117
118
119
120
121
122
123
124
125
LTC Cap Cap Cap EOL
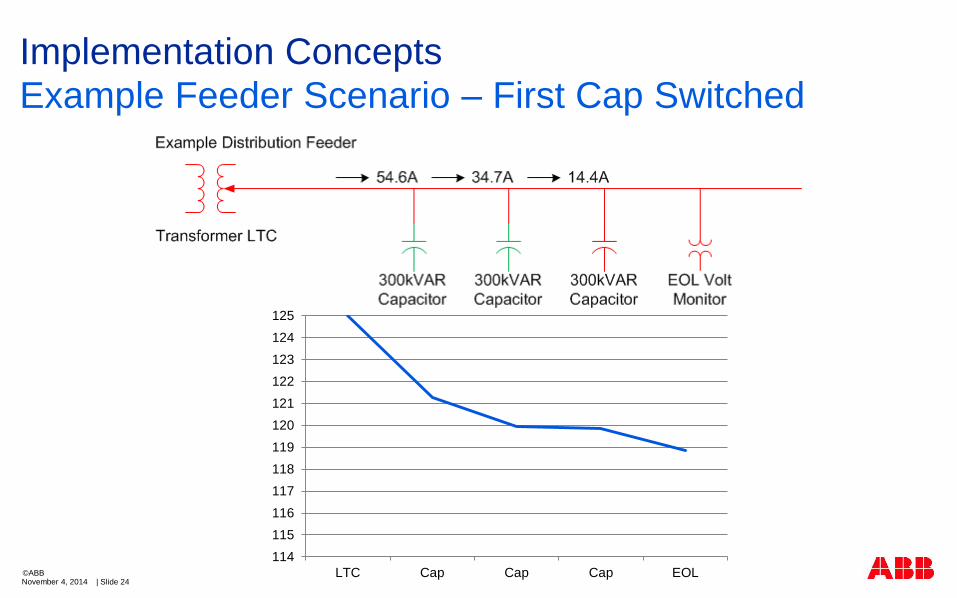
Implementation Concepts
Example Feeder Scenario – First Cap Switched
November 4, 2014 | Slide 24©ABB
114
115
116
117
118
119
120
121
122
123
124
125
LTC Cap Cap Cap EOL
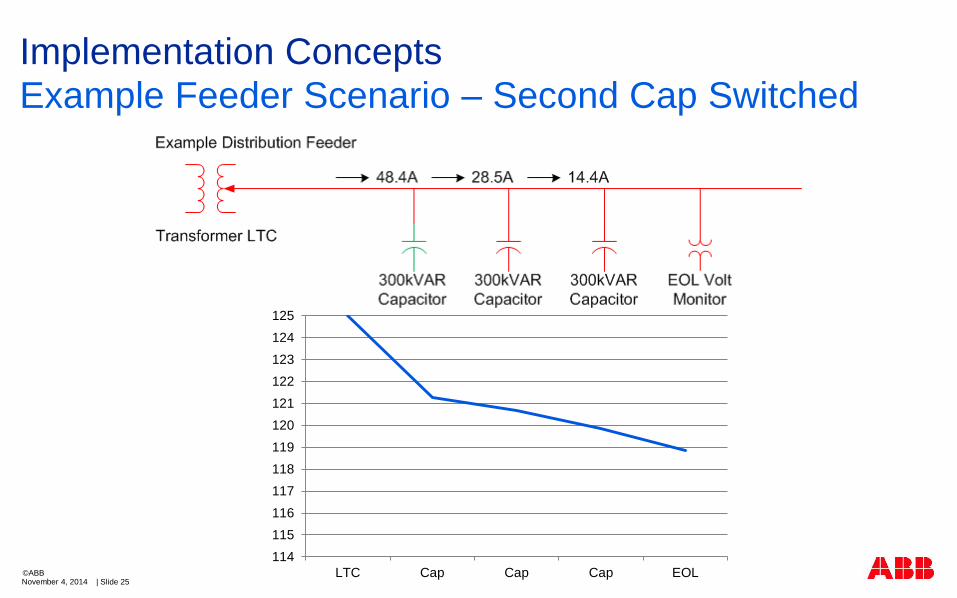
Implementation Concepts
Example Feeder Scenario – Second Cap Switched
November 4, 2014 | Slide 25©ABB
114
115
116
117
118
119
120
121
122
123
124
125
LTC Cap Cap Cap EOL
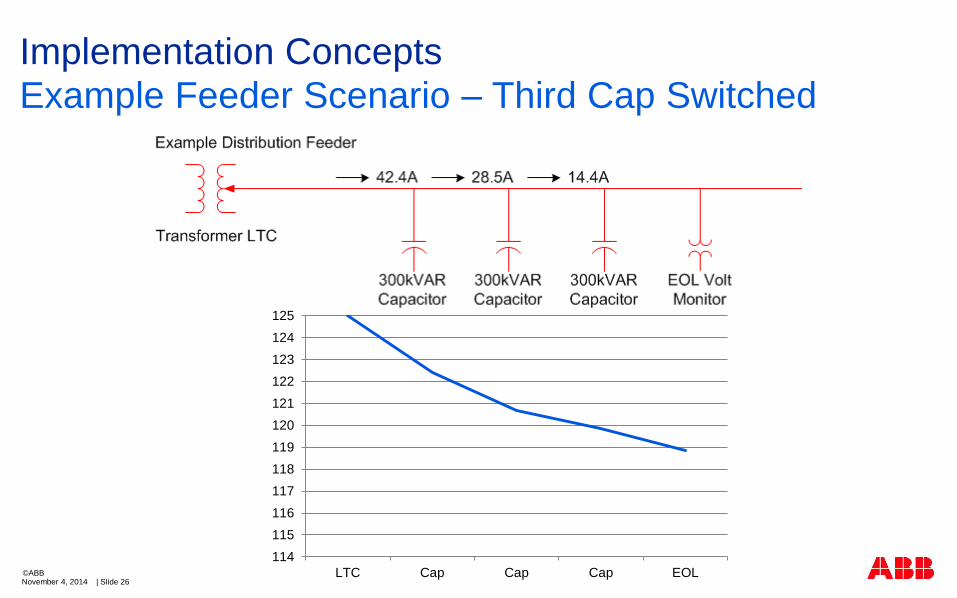
Implementation Concepts
Example Feeder Scenario – Third Cap Switched
November 4, 2014 | Slide 26©ABB
114
115
116
117
118
119
120
121
122
123
124
125
LTC Cap Cap Cap EOL
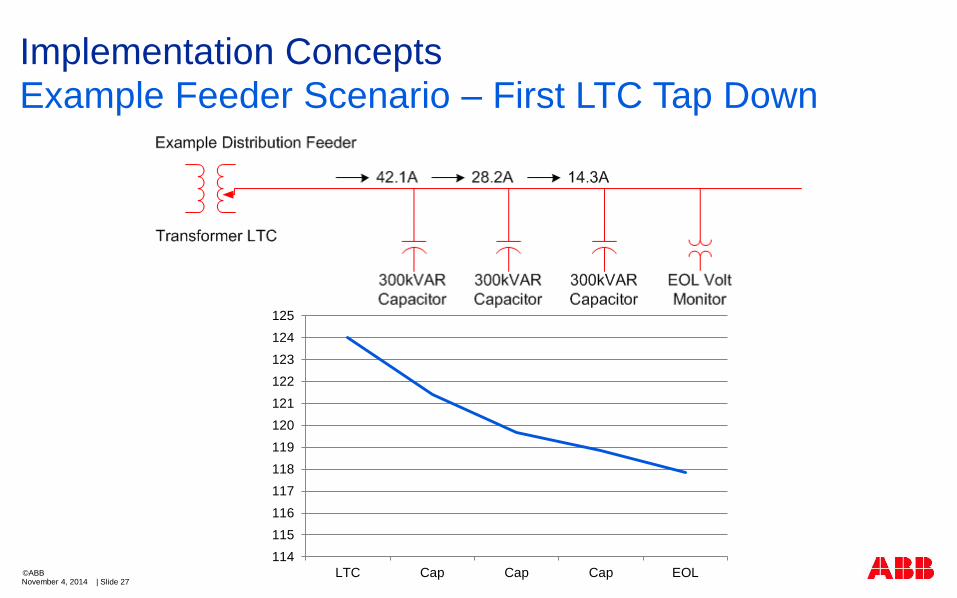
Implementation Concepts
Example Feeder Scenario – First LTC Tap Down
November 4, 2014 | Slide 27©ABB
114
115
116
117
118
119
120
121
122
123
124
125
LTC Cap Cap Cap EOL
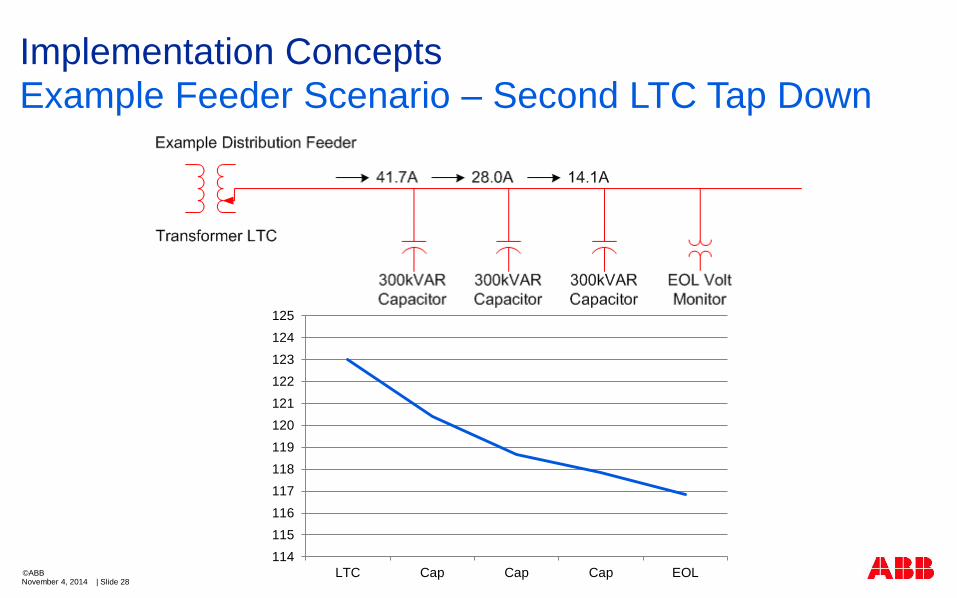
Implementation Concepts
Example Feeder Scenario – Second LTC Tap Down
November 4, 2014 | Slide 28©ABB
114
115
116
117
118
119
120
121
122
123
124
125
LTC Cap Cap Cap EOL
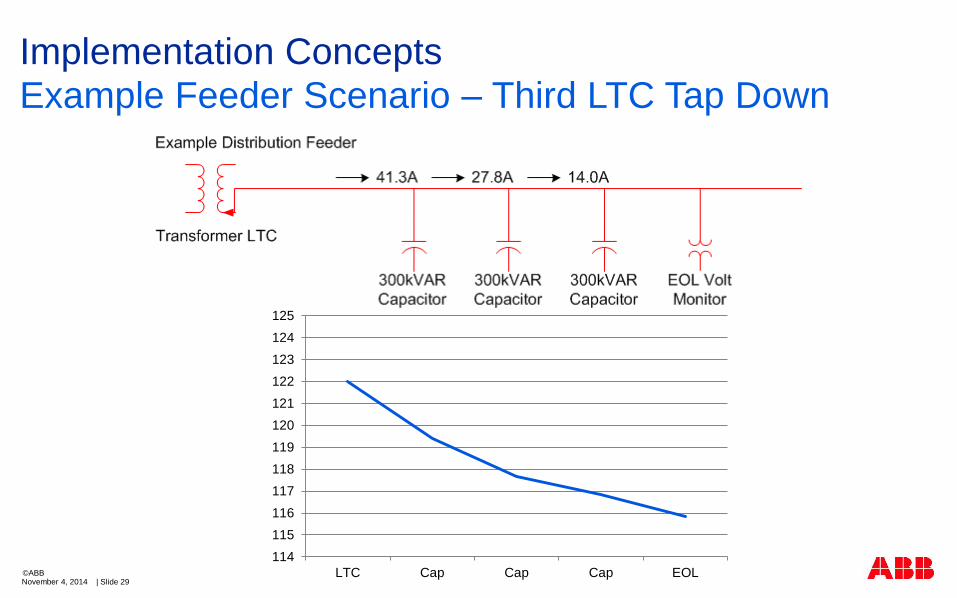
Implementation Concepts
Example Feeder Scenario – Third LTC Tap Down
November 4, 2014 | Slide 29©ABB
114
115
116
117
118
119
120
121
122
123
124
125
LTC Cap Cap Cap EOL
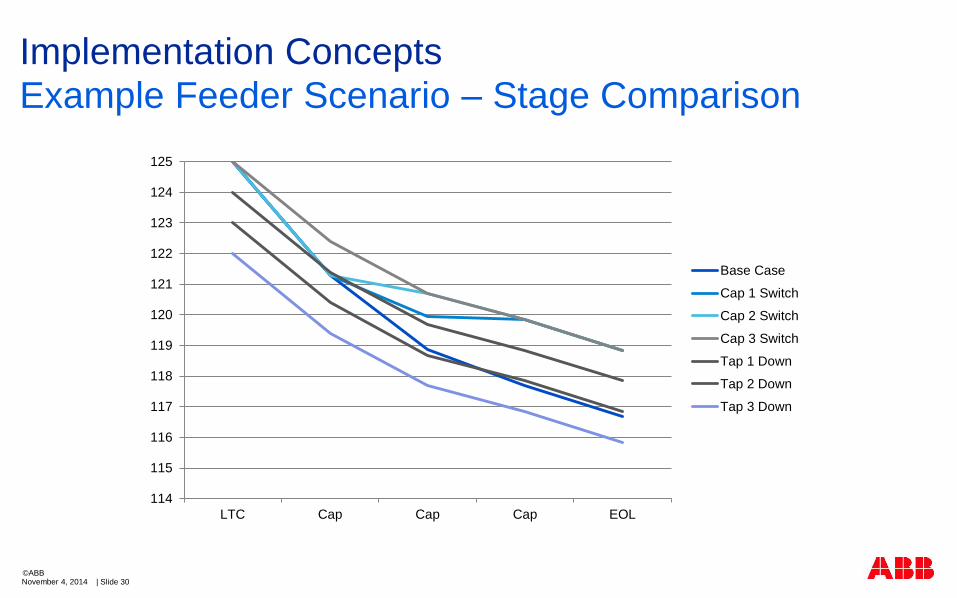
Implementation Concepts
Example Feeder Scenario – Stage Comparison
November 4, 2014 | Slide 30©ABB
114
115
116
117
118
119
120
121
122
123
124
125
LTC Cap Cap Cap EOL
Base Case
Cap 1 Switch
Cap 2 Switch
Cap 3 Switch
Tap 1 Down
Tap 2 Down
Tap 3 Down
Implementation Concepts
Example Results
November 4, 2014 | Slide 31©ABB
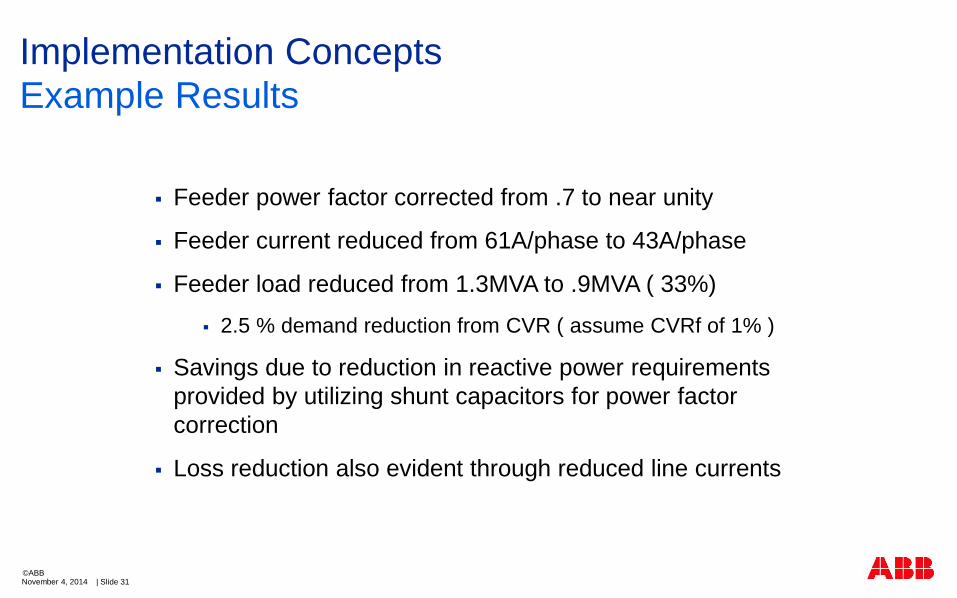
Feeder power factor corrected from .7 to near unity
Feeder current reduced from 61A/phase to 43A/phase
Feeder load reduced from 1.3MVA to .9MVA ( 33%)
2.5 % demand reduction from CVR ( assume CVRf of 1% )
Savings due to reduction in reactive power requirements
provided by utilizing shunt capacitors for power factor
correction
Loss reduction also evident through reduced line currents
Implementation Concepts
Example Takeaways
November 4, 2014 | Slide 32©ABB
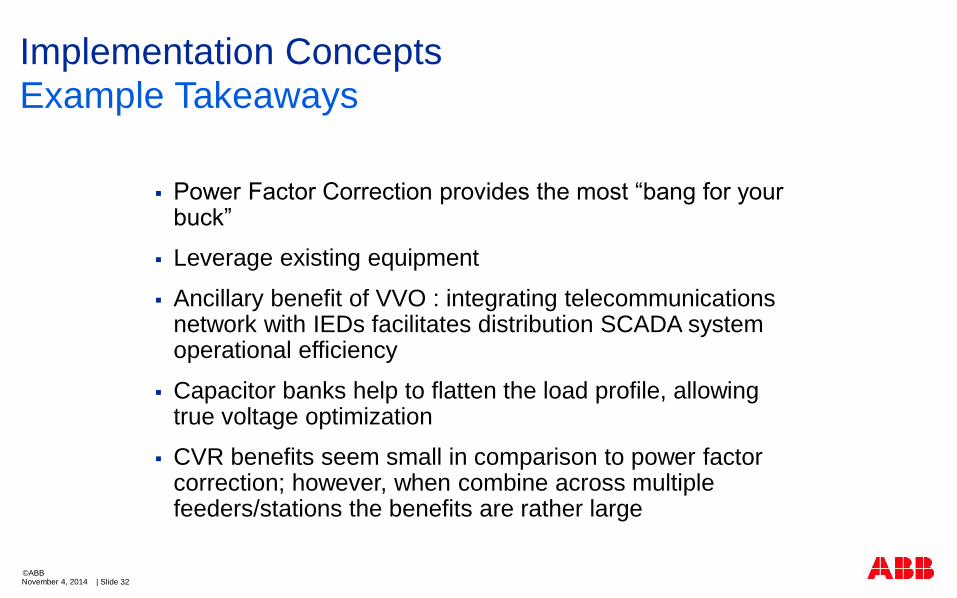
Power Factor Correction provides the most “bang for your buck”
Leverage existing equipment
Ancillary benefit of VVO : integrating telecommunications network with IEDs facilitates distribution SCADA system operational efficiency
Capacitor banks help to flatten the load profile, allowing true voltage optimization
CVR benefits seem small in comparison to power factor correction; however, when combine across multiple feeders/stations the benefits are rather large
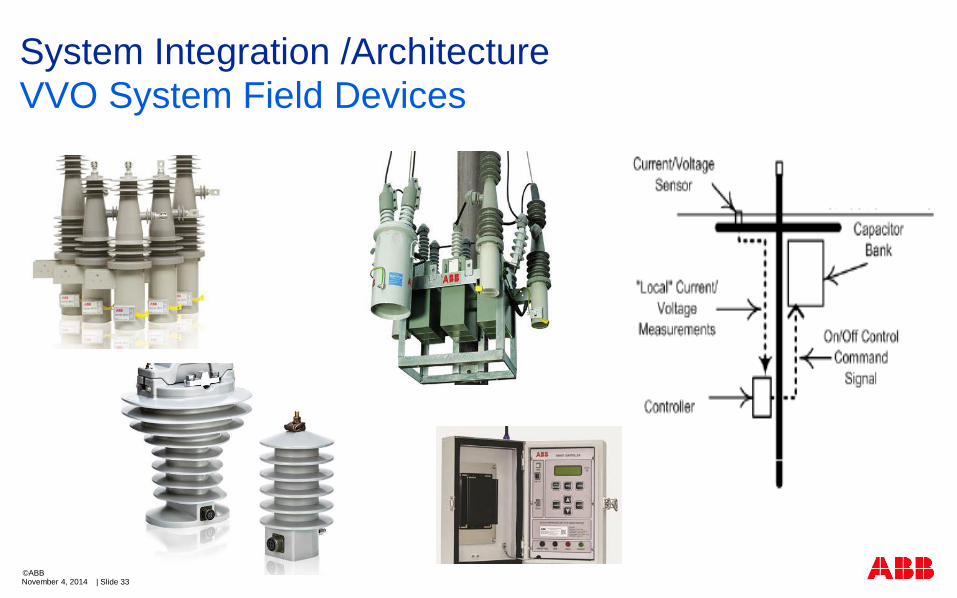
System Integration /Architecture
VVO System Field Devices
November 4, 2014 | Slide 33©ABB
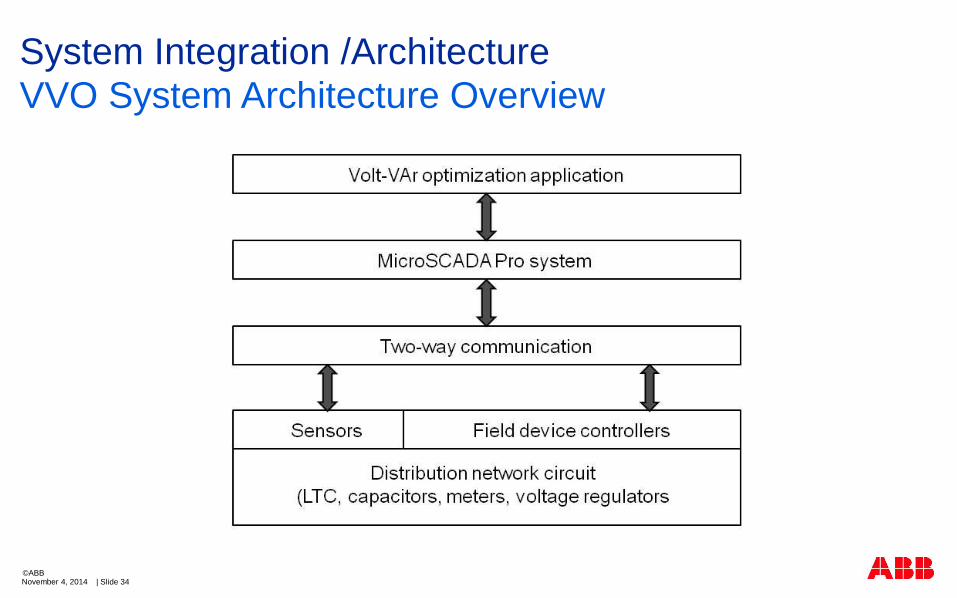
System Integration /Architecture
VVO System Architecture Overview
November 4, 2014 | Slide 34©ABB
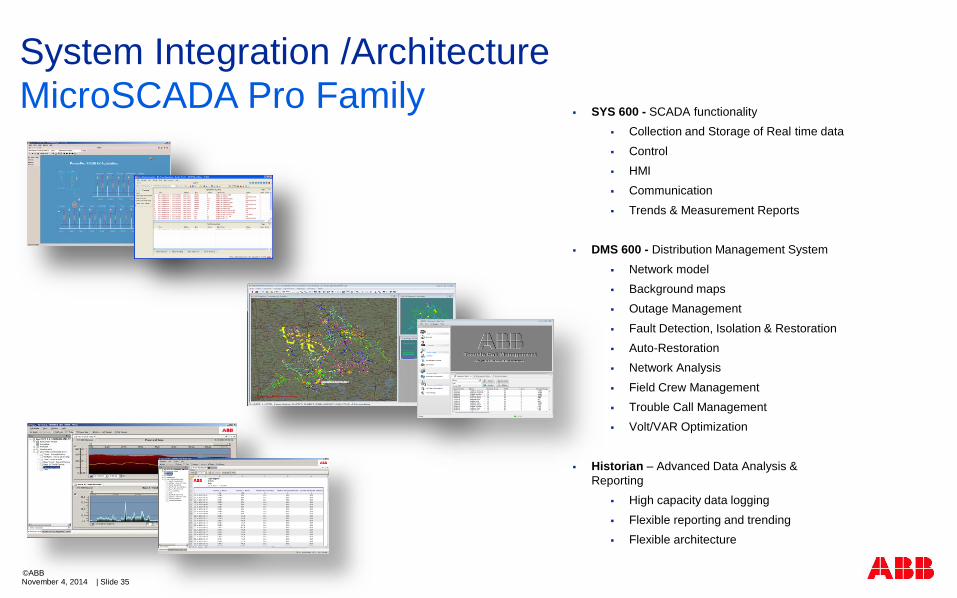
System Integration /Architecture
MicroSCADA Pro Family
November 4, 2014 | Slide 35©ABB
SYS 600 - SCADA functionality
Collection and Storage of Real time data
Control
HMI
Communication
Trends & Measurement Reports
DMS 600 - Distribution Management System
Network model
Background maps
Outage Management
Fault Detection, Isolation & Restoration
Auto-Restoration
Network Analysis
Field Crew Management
Trouble Call Management
Volt/VAR Optimization
Historian – Advanced Data Analysis &
Reporting
High capacity data logging
Flexible reporting and trending
Flexible architecture
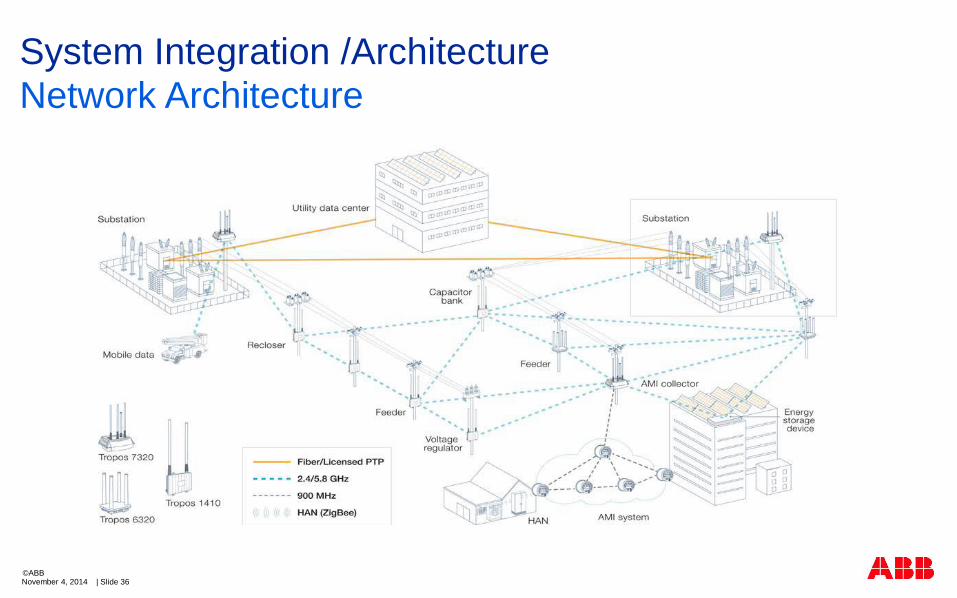
System Integration /Architecture
Network Architecture
November 4, 2014 | Slide 36©ABB
November 4, 2014 | Slide 37©ABB
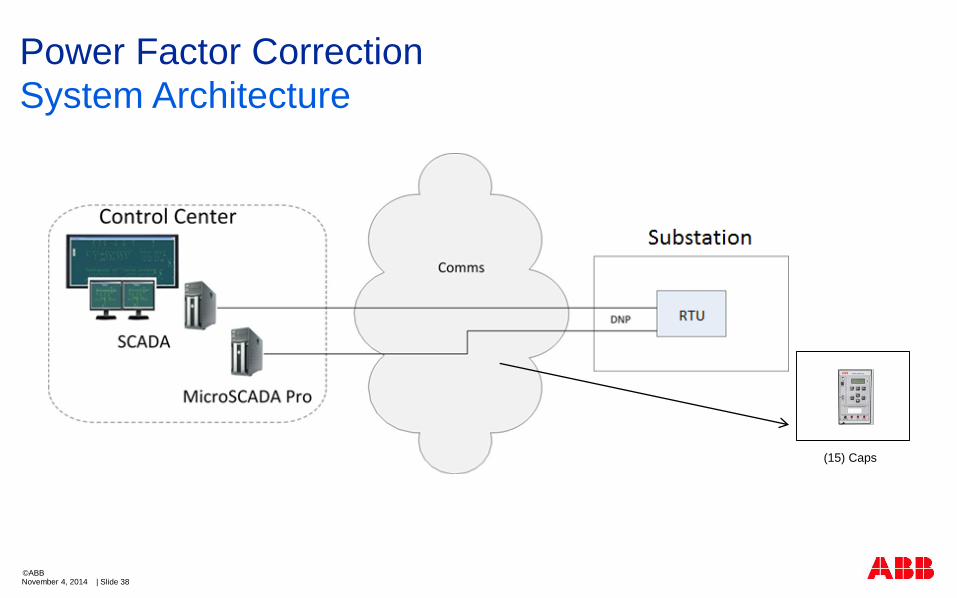
Power Factor Correction
System Objectives
Real-time monitoring and control of distribution capacitors through
integration with their corresponding controllers.
Real-time monitoring of substation feeder metrology through integration
with SCADA system.
Advanced analytic and control software that directs the switching of
distribution line capacitors to achieve the desired levels of regulation.
Real time status displays of the entire feeder network from the
substation down to end of the feeder lines.
November 4, 2014 | Slide 38©ABB
(15) Caps
Power Factor Correction
System Architecture
November 4, 2014 | Slide 39©ABB
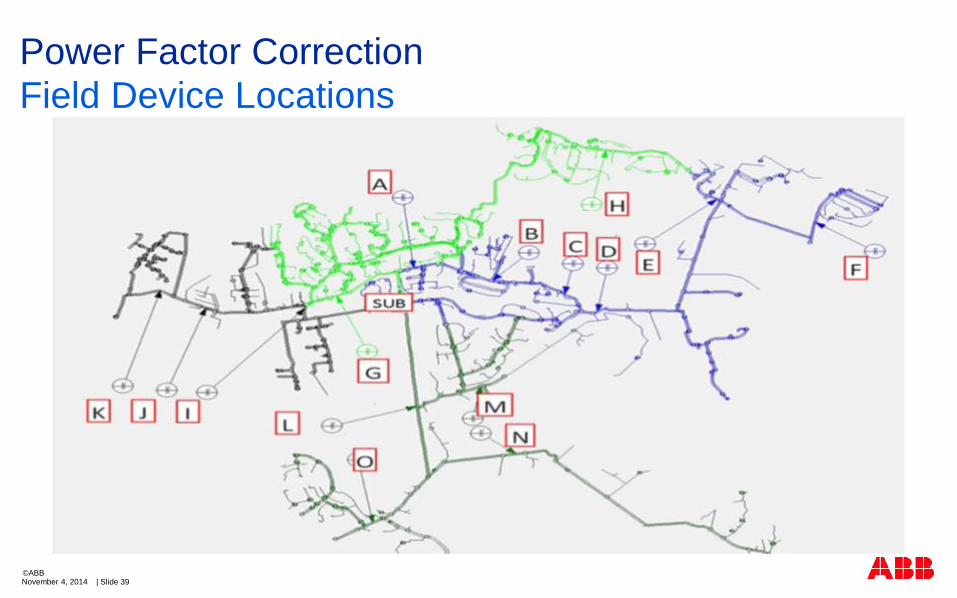
Power Factor Correction
Field Device Locations
November 4, 2014 | Slide 40©ABB
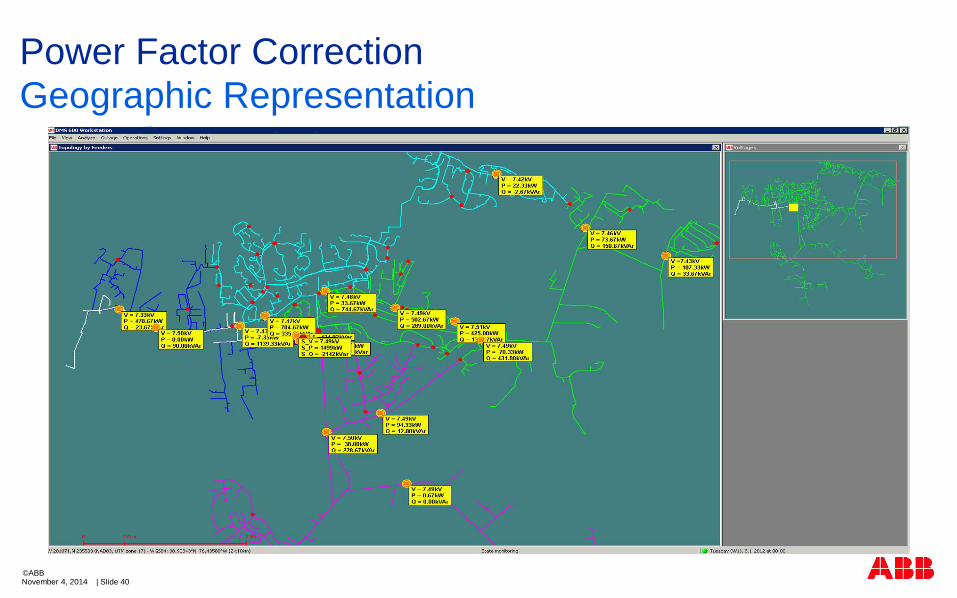
Power Factor Correction
Geographic Representation
November 4, 2014 | Slide 41©ABB
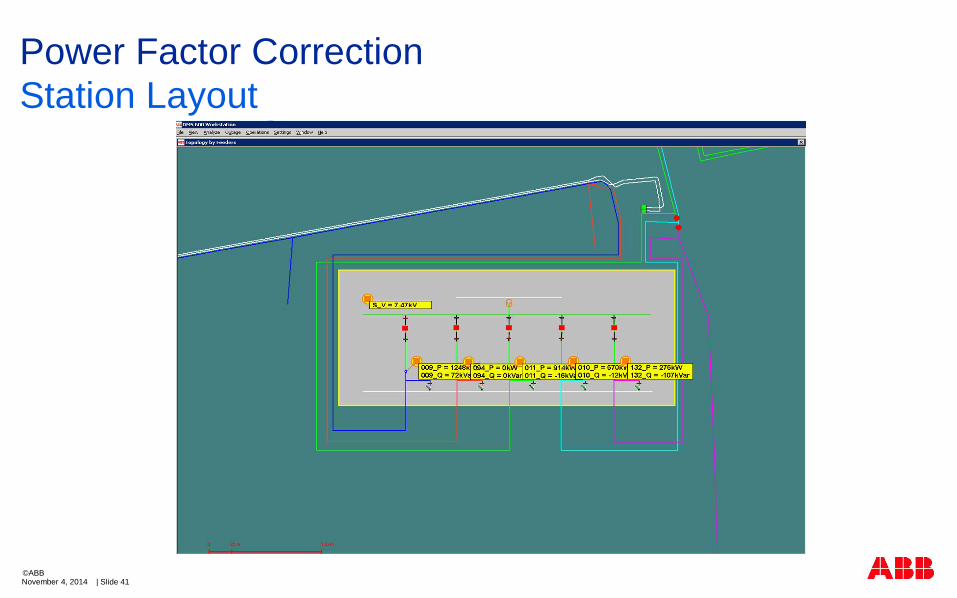
Power Factor Correction
Station Layout
November 4, 2014 | Slide 42©ABB
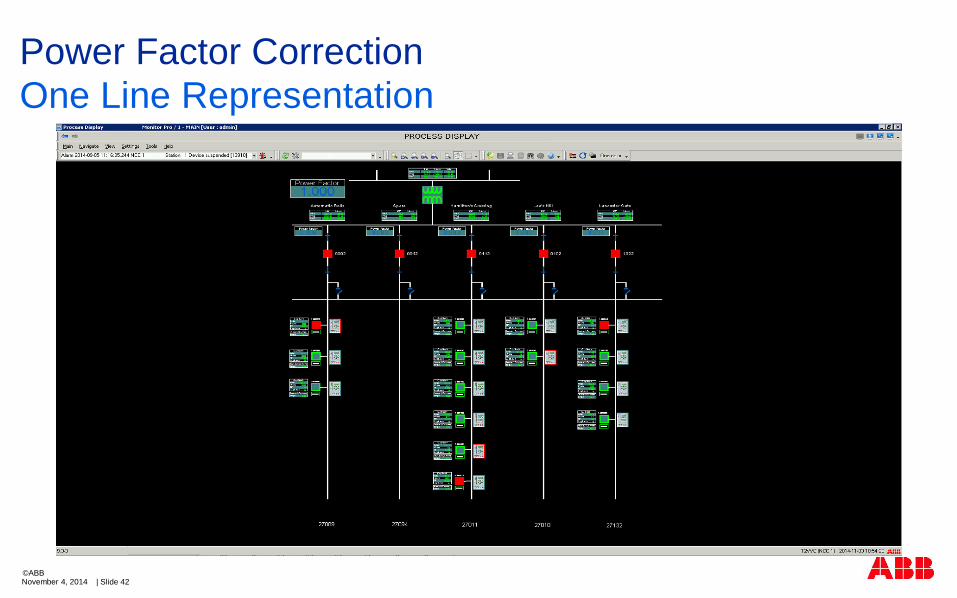
Power Factor Correction
One Line Representation
November 4, 2014 | Slide 43©ABB
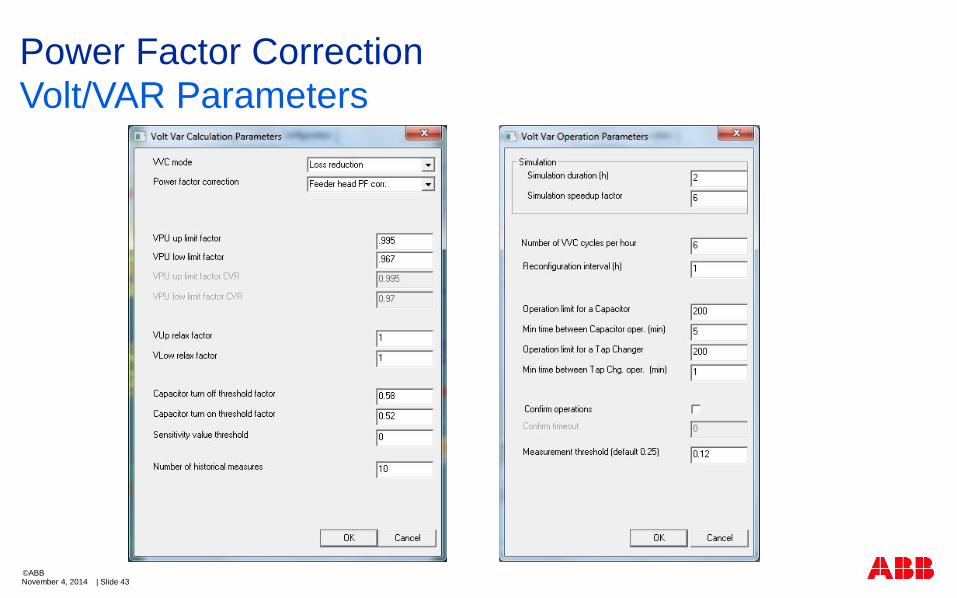
Power Factor Correction
Volt/VAR Parameters
November 4, 2014 | Slide 44©ABB
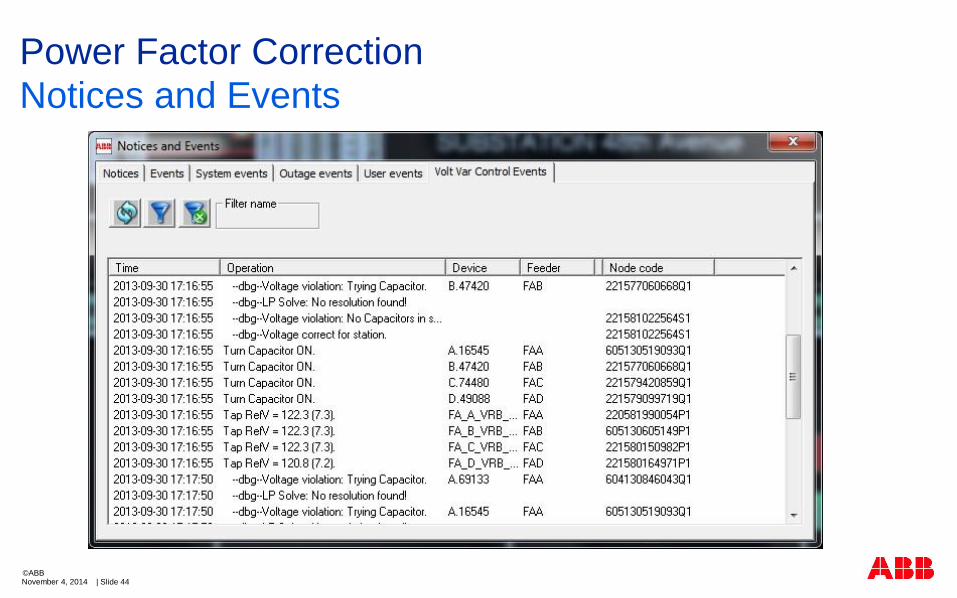
Power Factor Correction
Notices and Events
November 4, 2014 | Slide 45©ABB
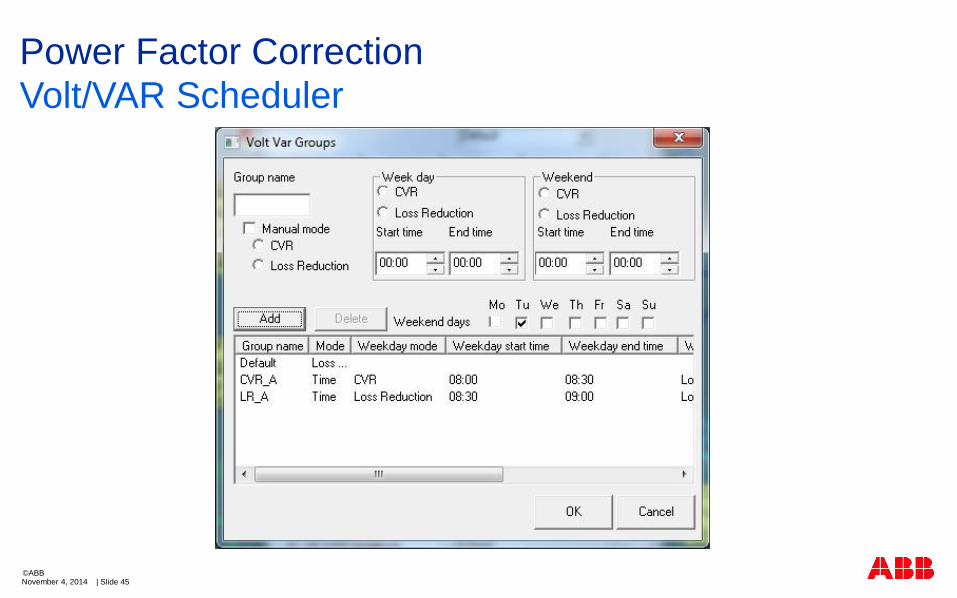
Power Factor Correction
Volt/VAR Scheduler
November 4, 2014 | Slide 46©ABB
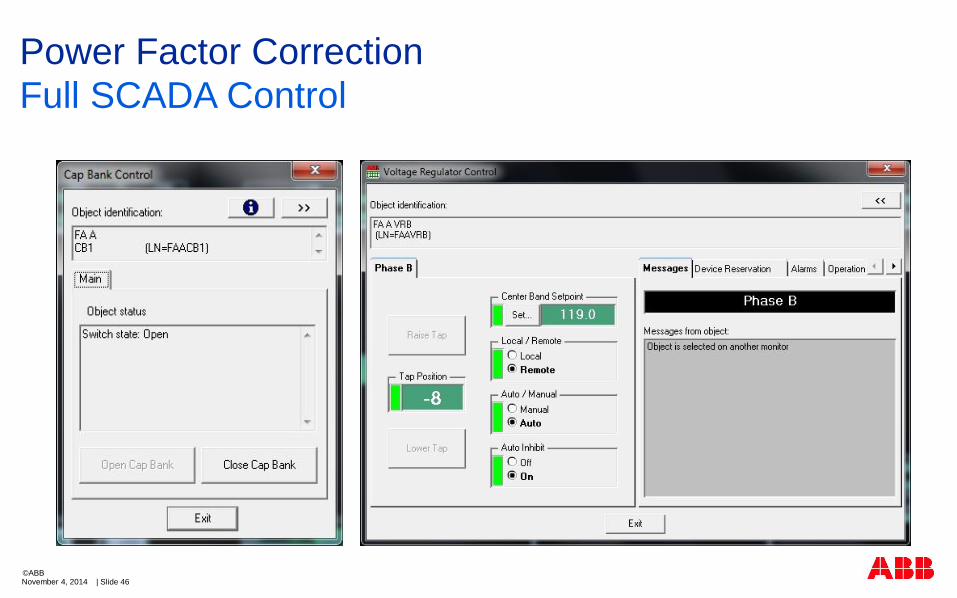
Power Factor Correction
Full SCADA Control
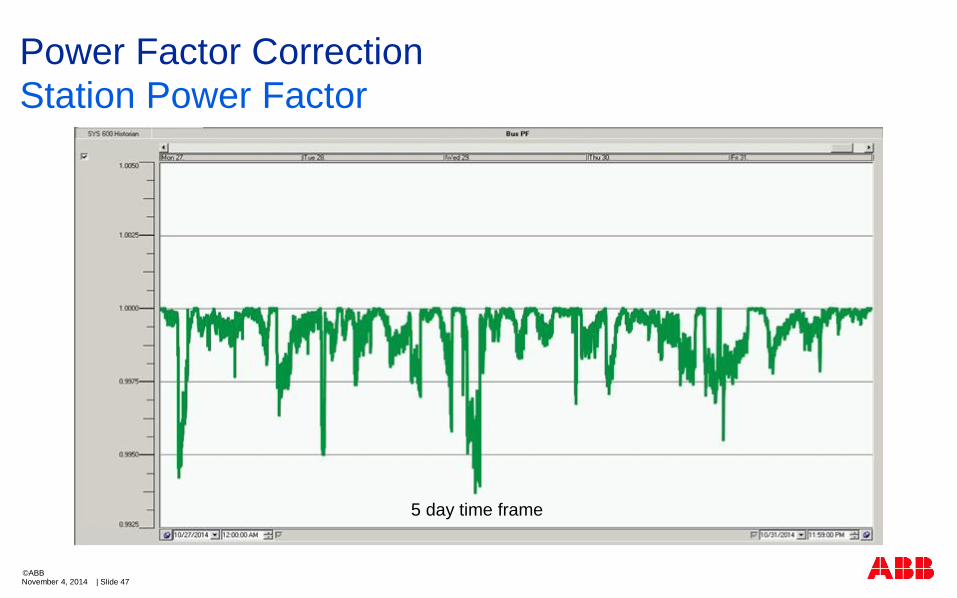
November 4, 2014 | Slide 47©ABB
Power Factor Correction
Station Power Factor
5 day time frame
November 4, 2014 | Slide 48©ABB
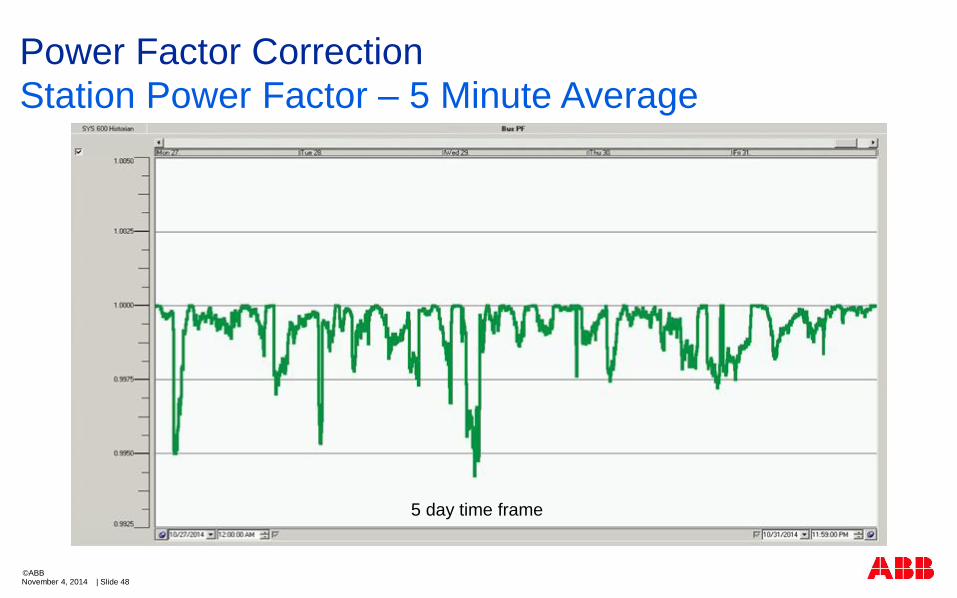
Power Factor Correction
Station Power Factor – 5 Minute Average
5 day time frame
November 4, 2014 | Slide 49©ABB
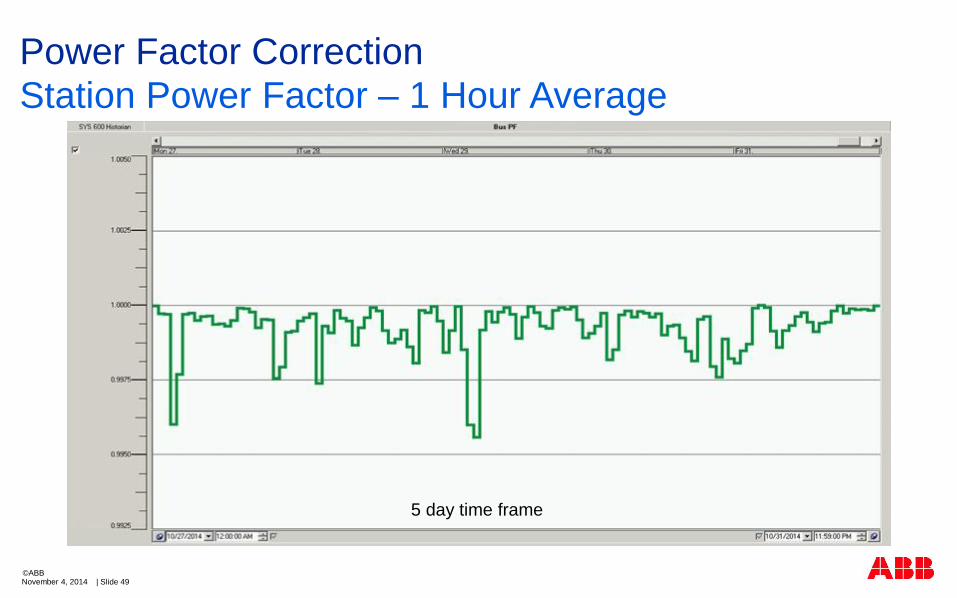
Power Factor Correction
Station Power Factor – 1 Hour Average
5 day time frame
November 4, 2014 | Slide 50©ABB
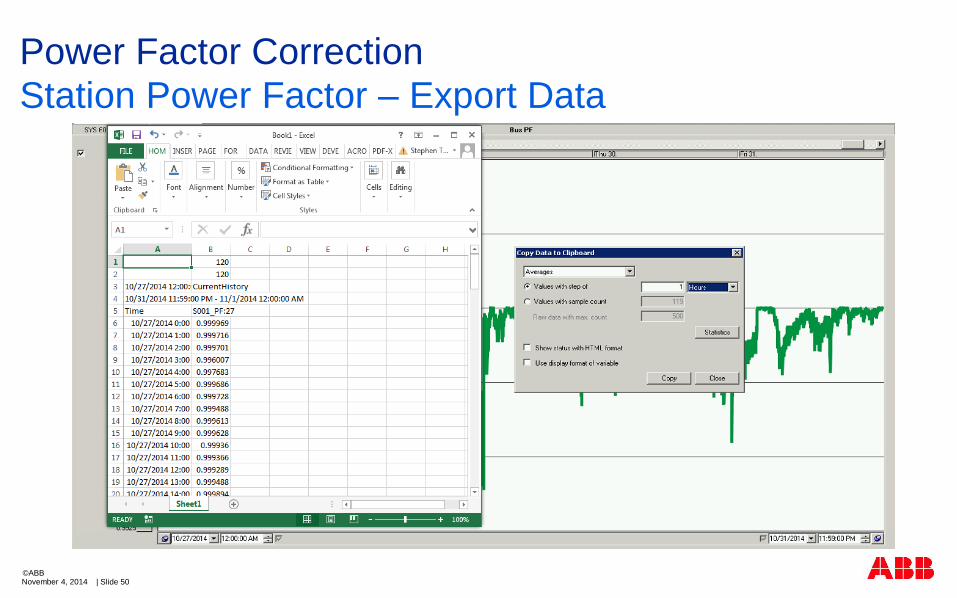
Power Factor Correction
Station Power Factor – Export Data
November 4, 2014 | Slide 51©ABB
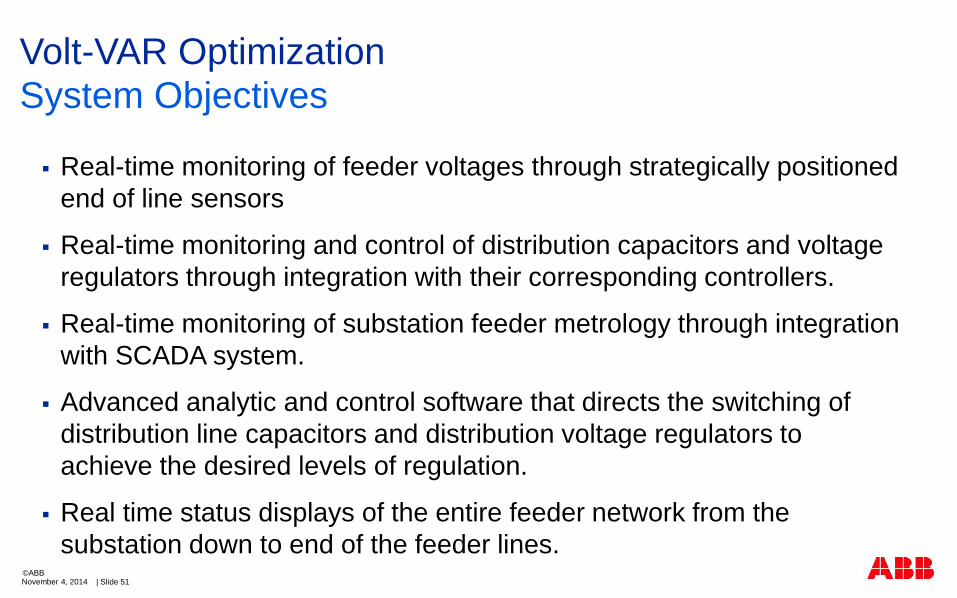
Volt-VAR Optimization
System Objectives
Real-time monitoring of feeder voltages through strategically positioned
end of line sensors
Real-time monitoring and control of distribution capacitors and voltage
regulators through integration with their corresponding controllers.
Real-time monitoring of substation feeder metrology through integration
with SCADA system.
Advanced analytic and control software that directs the switching of
distribution line capacitors and distribution voltage regulators to
achieve the desired levels of regulation.
Real time status displays of the entire feeder network from the
substation down to end of the feeder lines.
November 4, 2014 | Slide 52©ABB
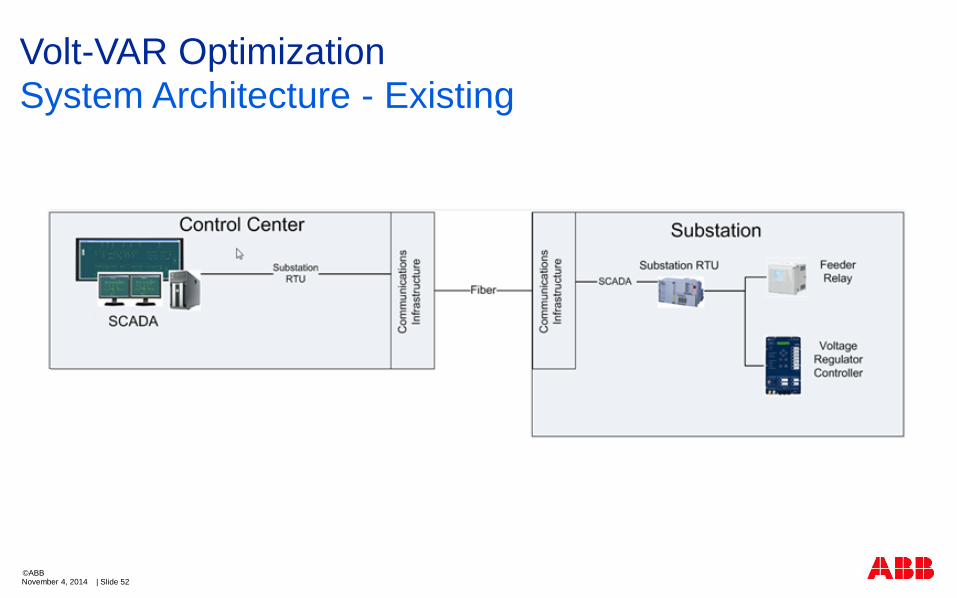
Volt-VAR Optimization
System Architecture - Existing
November 4, 2014 | Slide 53©ABB
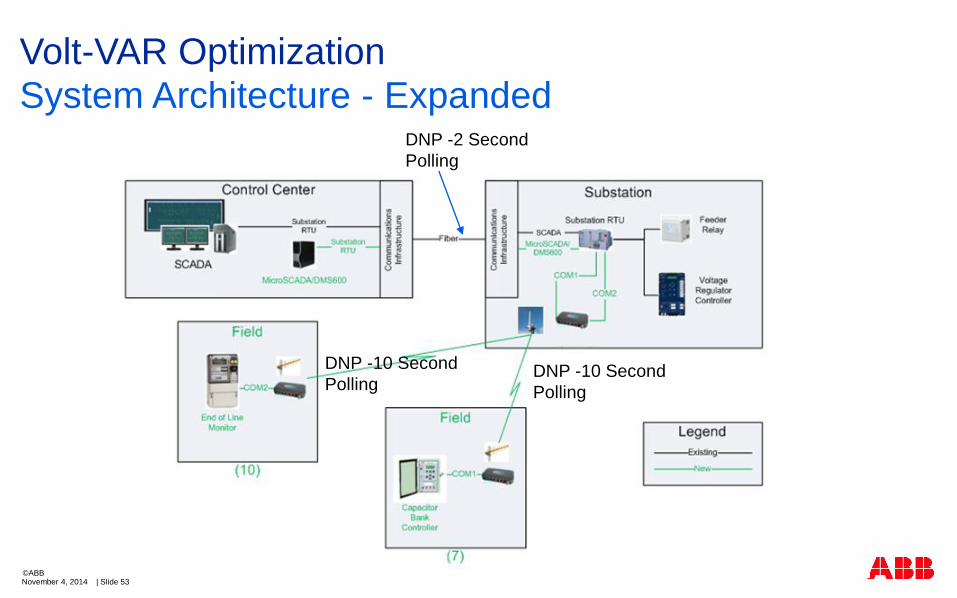
Volt-VAR Optimization
System Architecture - Expanded
DNP -10 Second
Polling
DNP -10 Second
Polling
DNP -2 Second
Polling
November 4, 2014 | Slide 54©ABB
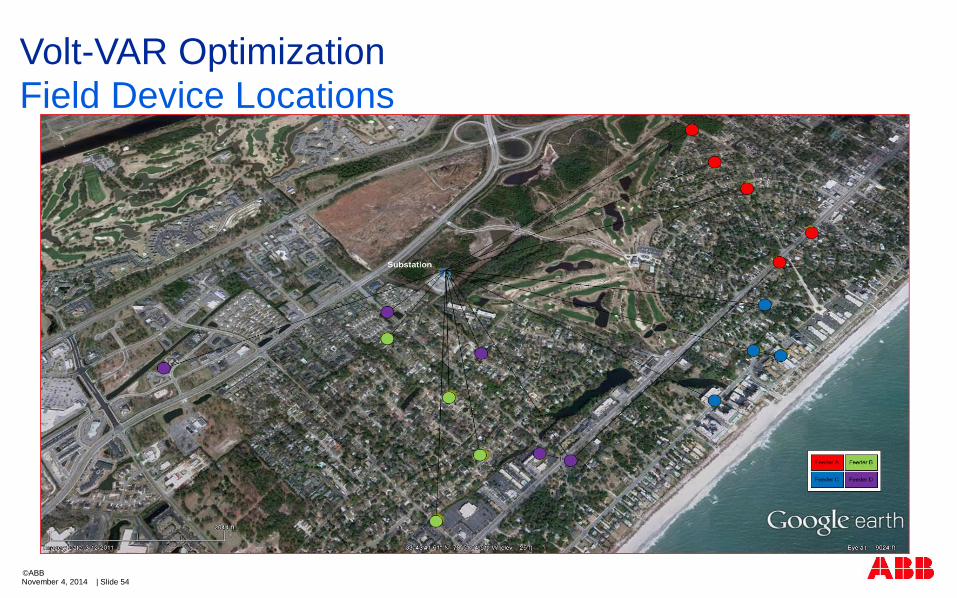
Volt-VAR Optimization
Field Device Locations
November 4, 2014 | Slide 55©ABB
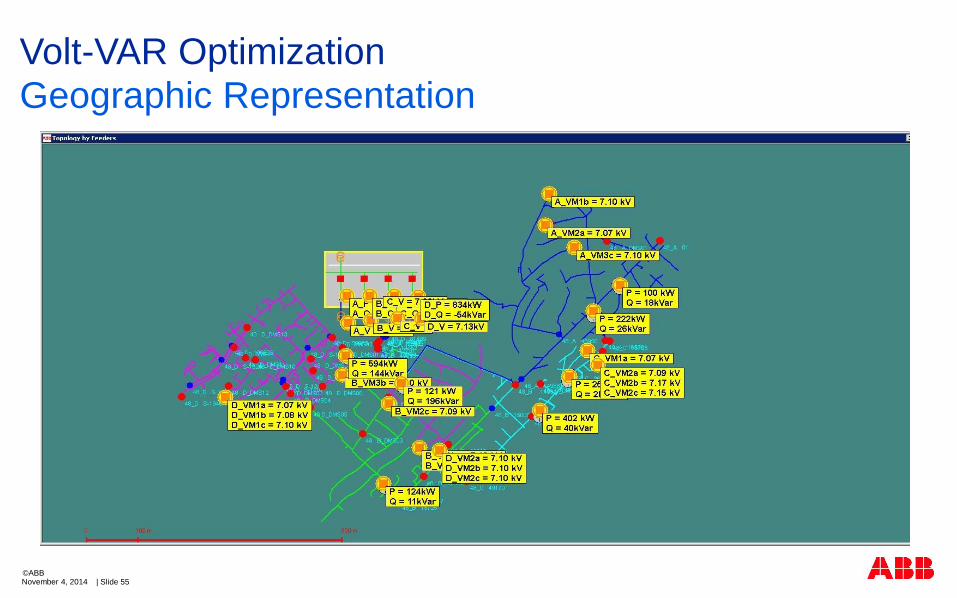
Volt-VAR Optimization
Geographic Representation
November 4, 2014 | Slide 56©ABB
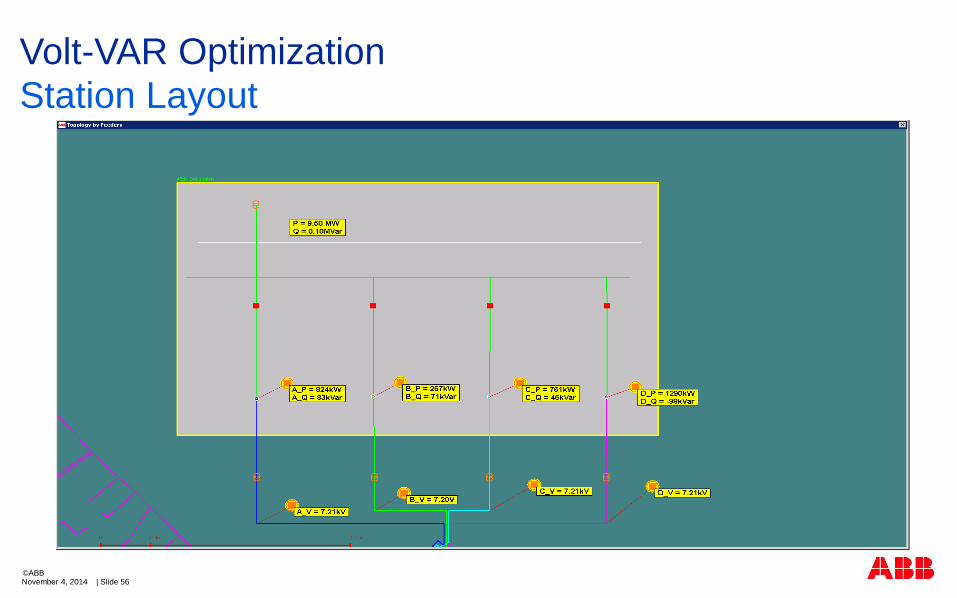
Volt-VAR Optimization
Station Layout
November 4, 2014 | Slide 57©ABB
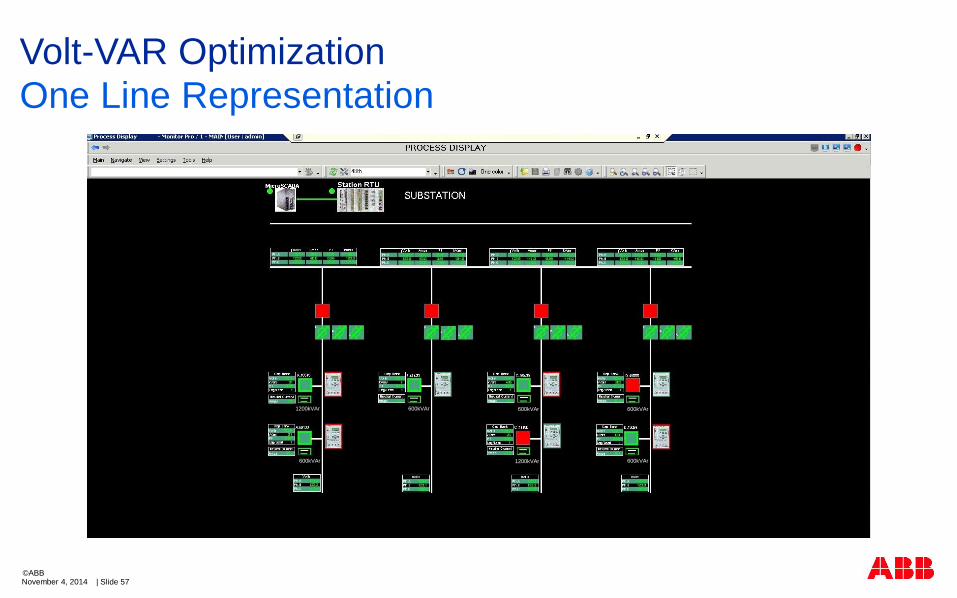
Volt-VAR Optimization
One Line Representation
1200kVAr
600kVAr
600kVAr 600kVAr
1200kVAr
600kVAr
600kVAr
November 4, 2014 | Slide 58©ABB
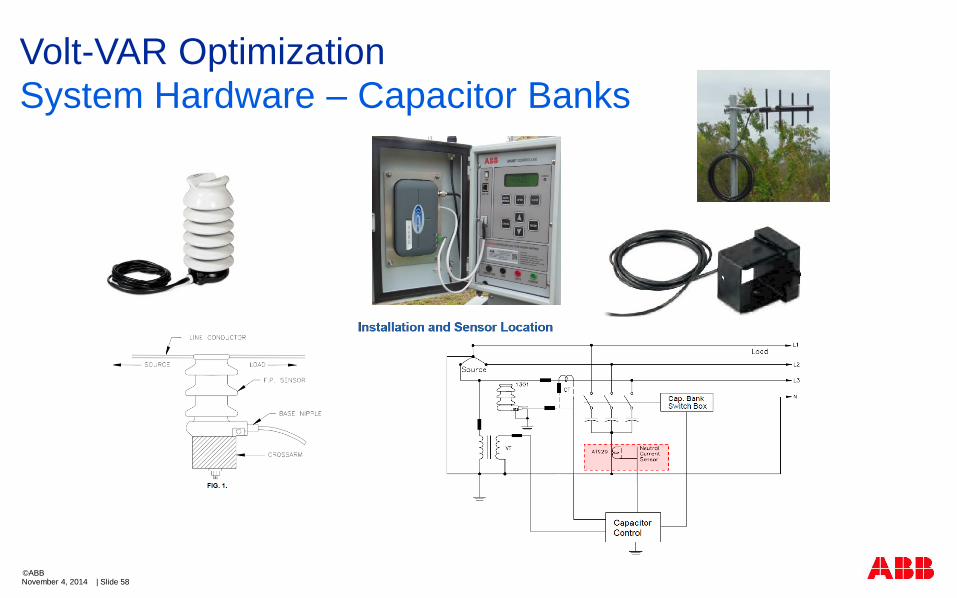
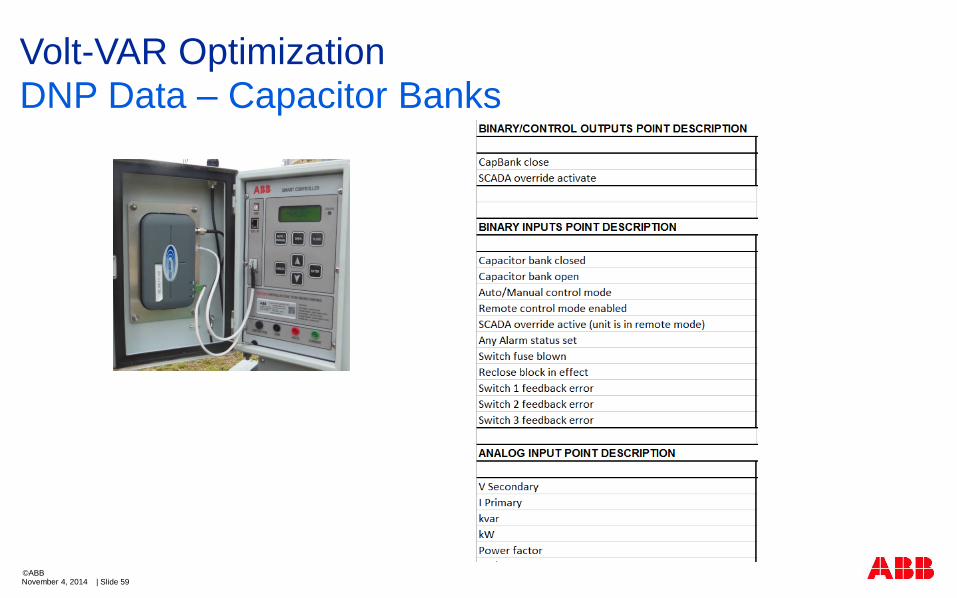
Volt-VAR Optimization
System Hardware – Capacitor Banks
November 4, 2014 | Slide 59©ABB
Volt-VAR Optimization
DNP Data – Capacitor Banks
November 4, 2014 | Slide 60©ABB
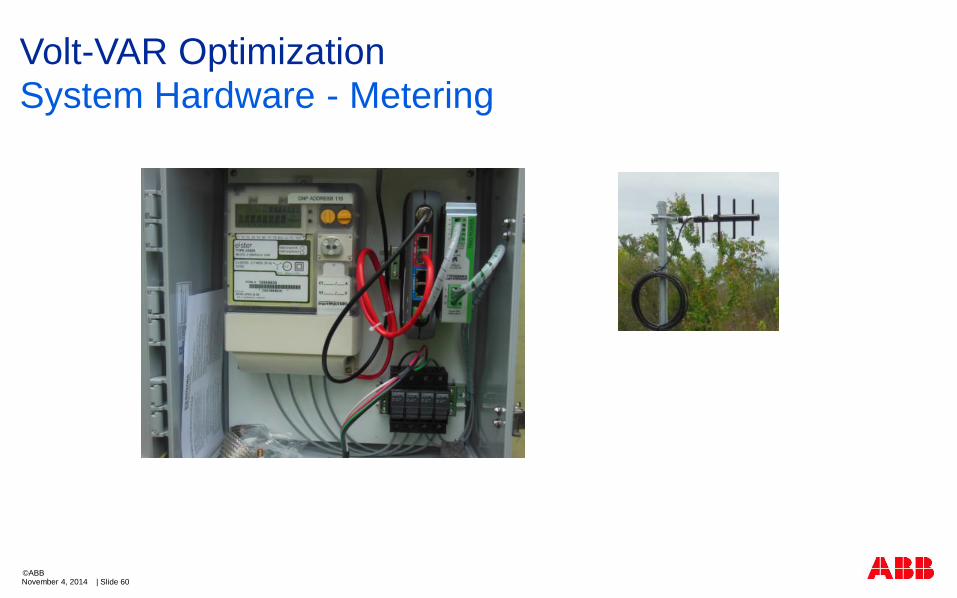
Volt-VAR Optimization
System Hardware - Metering
November 4, 2014 | Slide 61©ABB
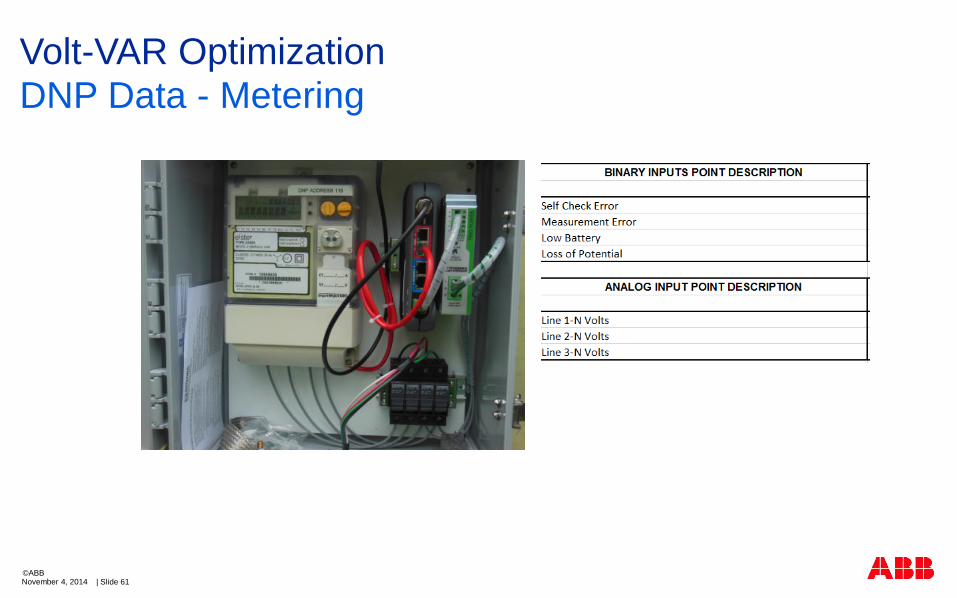
Volt-VAR Optimization
DNP Data - Metering
November 4, 2014 | Slide 62©ABB
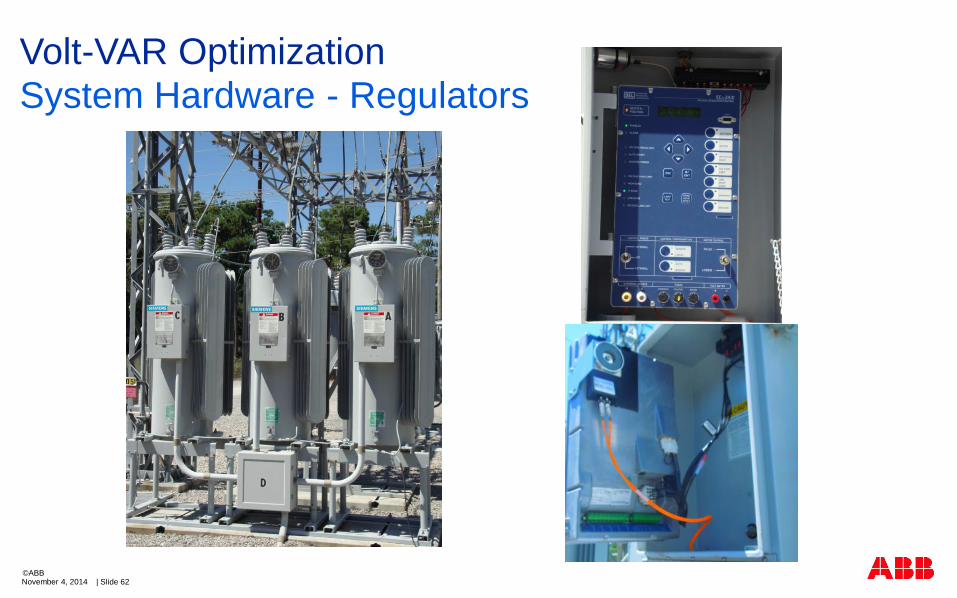
Volt-VAR Optimization
System Hardware - Regulators
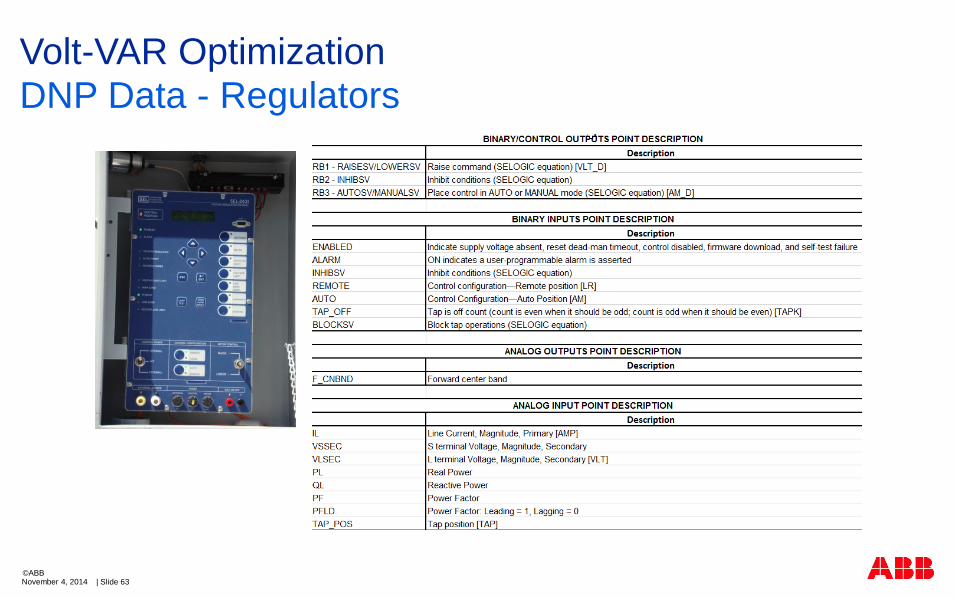
November 4, 2014 | Slide 63©ABB
Volt-VAR Optimization
DNP Data - Regulators
November 4, 2014 | Slide 64©ABB
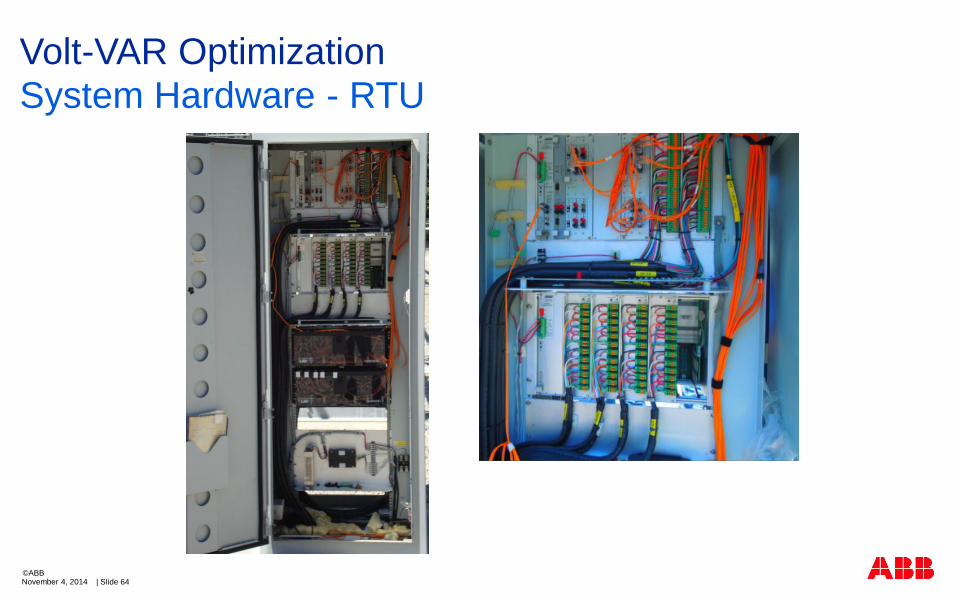
Volt-VAR Optimization
System Hardware - RTU
November 4, 2014 | Slide 65©ABB
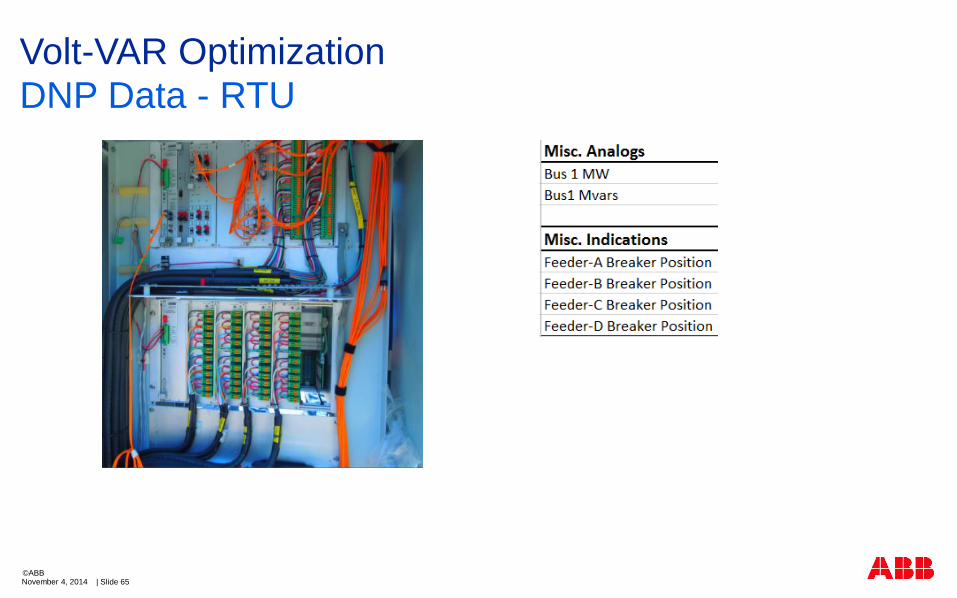
Volt-VAR Optimization
DNP Data - RTU
November 4, 2014 | Slide 66©ABB
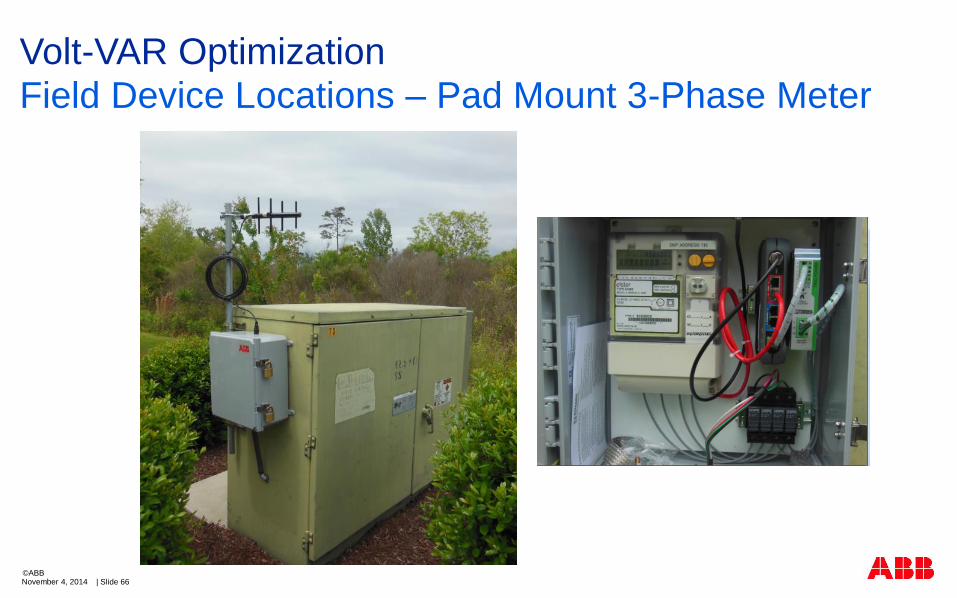
Volt-VAR Optimization
Field Device Locations – Pad Mount 3-Phase Meter
November 4, 2014 | Slide 67©ABB
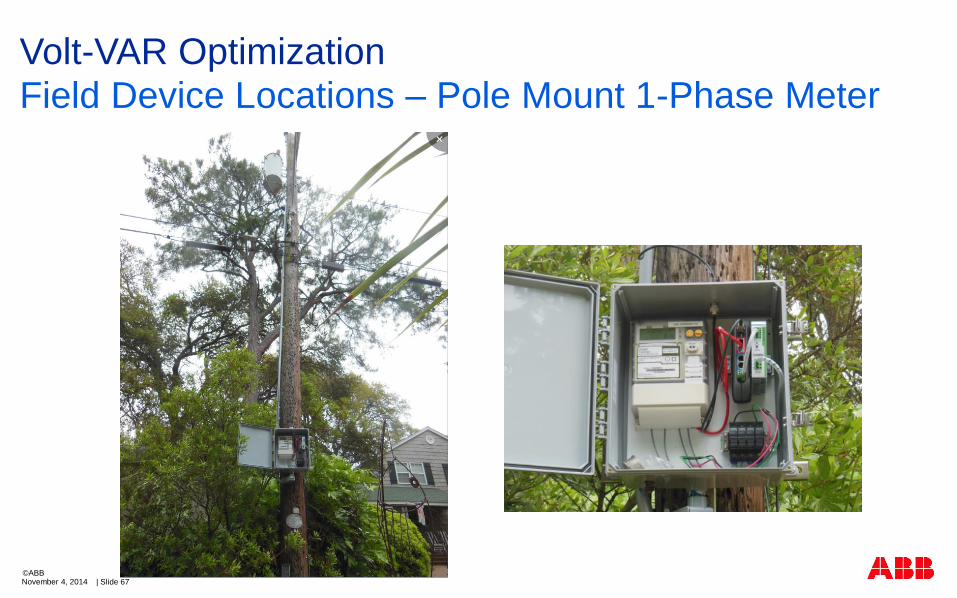
Volt-VAR Optimization
Field Device Locations – Pole Mount 1-Phase Meter
November 4, 2014 | Slide 68©ABB
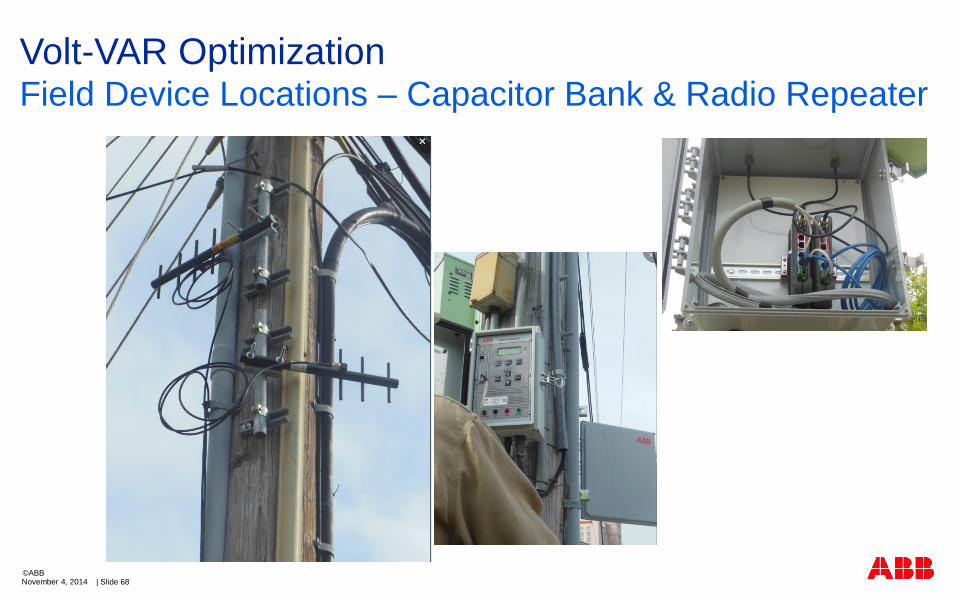
Volt-VAR OptimizationField Device Locations – Capacitor Bank & Radio Repeater
November 4, 2014 | Slide 69©ABB
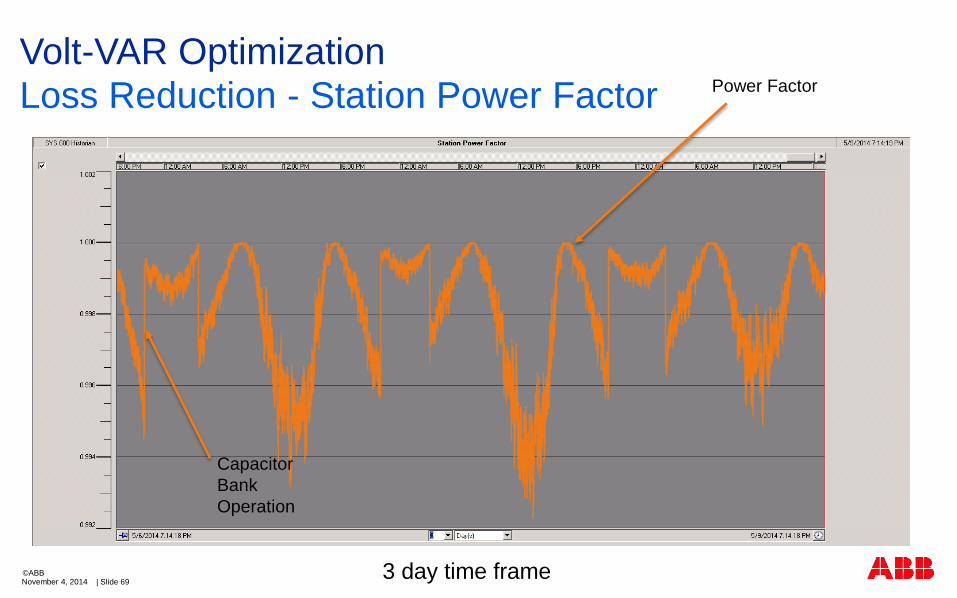
Volt-VAR Optimization
Loss Reduction - Station Power Factor
3 day time frame
Power Factor
Capacitor
Bank
Operation
November 4, 2014 | Slide 70©ABB
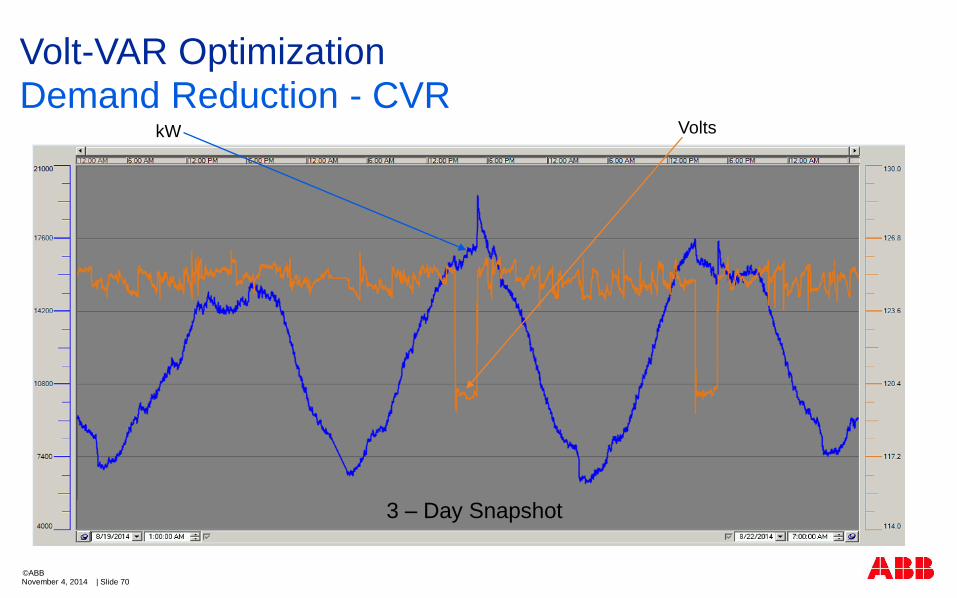
Volt-VAR Optimization
Demand Reduction - CVR
3 – Day Snapshot
kW Volts
November 4, 2014 | Slide 71©ABB
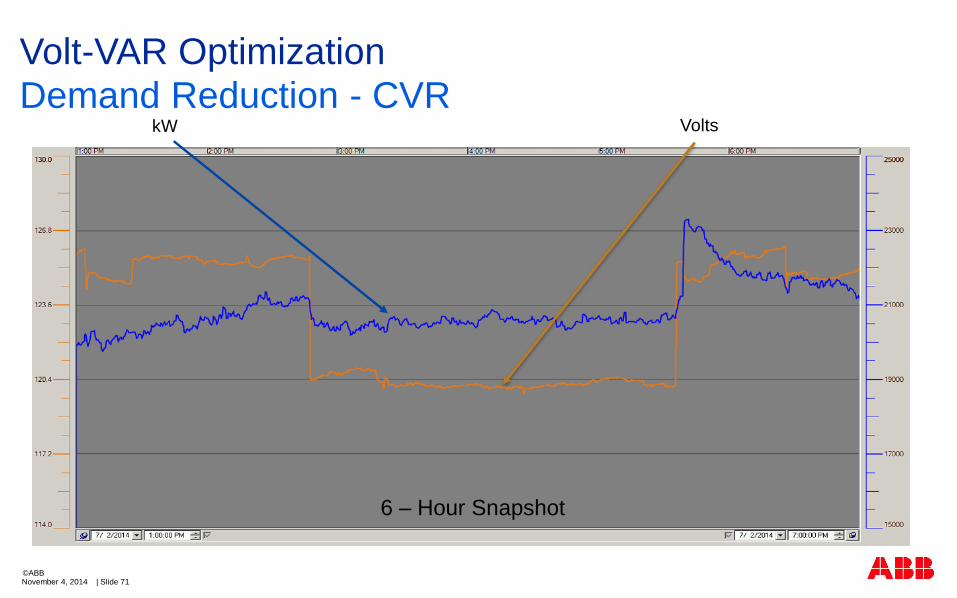
Volt-VAR Optimization
Demand Reduction - CVRkW Volts
6 – Hour Snapshot
November 4, 2014 | Slide 72©ABB
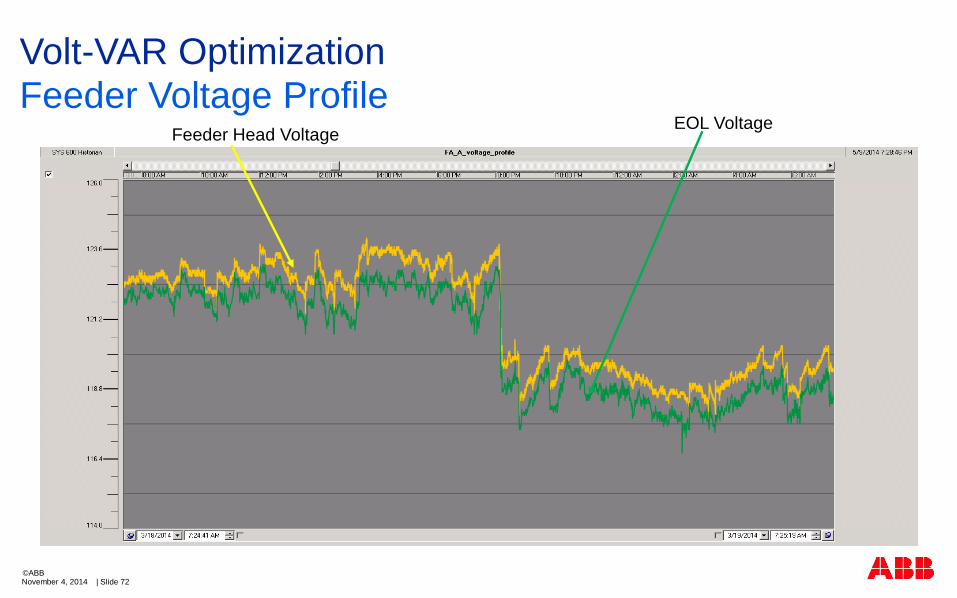
Volt-VAR Optimization
Feeder Voltage ProfileEOL Voltage
Feeder Head Voltage
November 4, 2014 | Slide 73©ABB
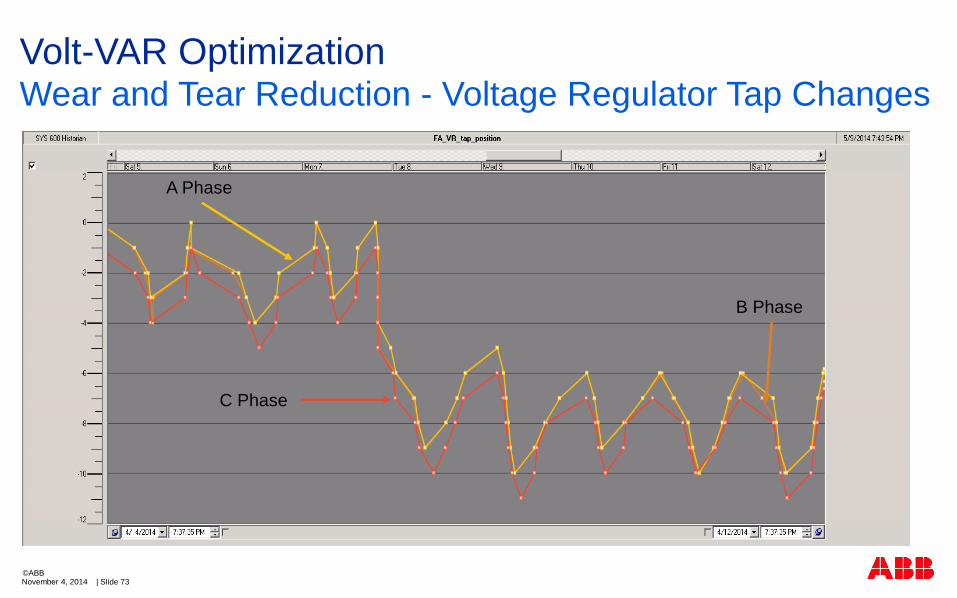
Volt-VAR OptimizationWear and Tear Reduction - Voltage Regulator Tap Changes
A Phase
B Phase
C Phase
November 4, 2014 | Slide 74©ABB
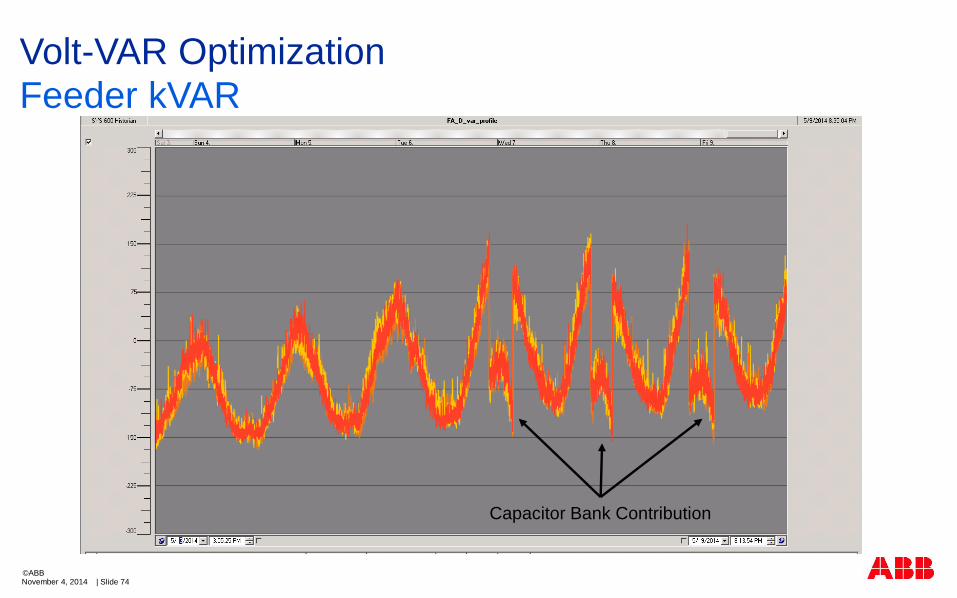
Volt-VAR Optimization
Feeder kVAR
Capacitor Bank Contribution
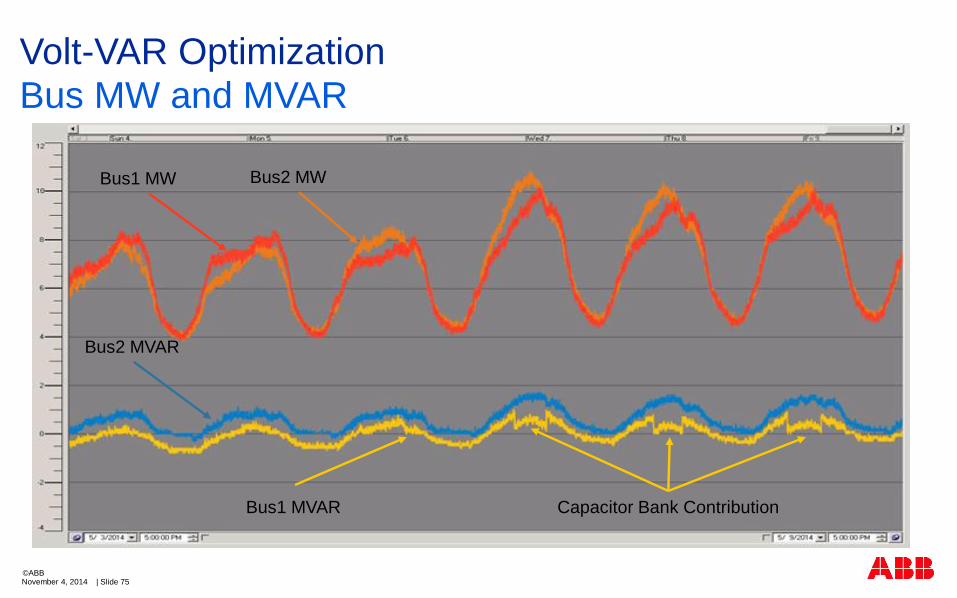
November 4, 2014 | Slide 75©ABB
Volt-VAR Optimization
Bus MW and MVAR
Bus1 MW Bus2 MW
Bus2 MVAR
Bus1 MVAR Capacitor Bank Contribution
November 4, 2014 | Slide 76©ABB
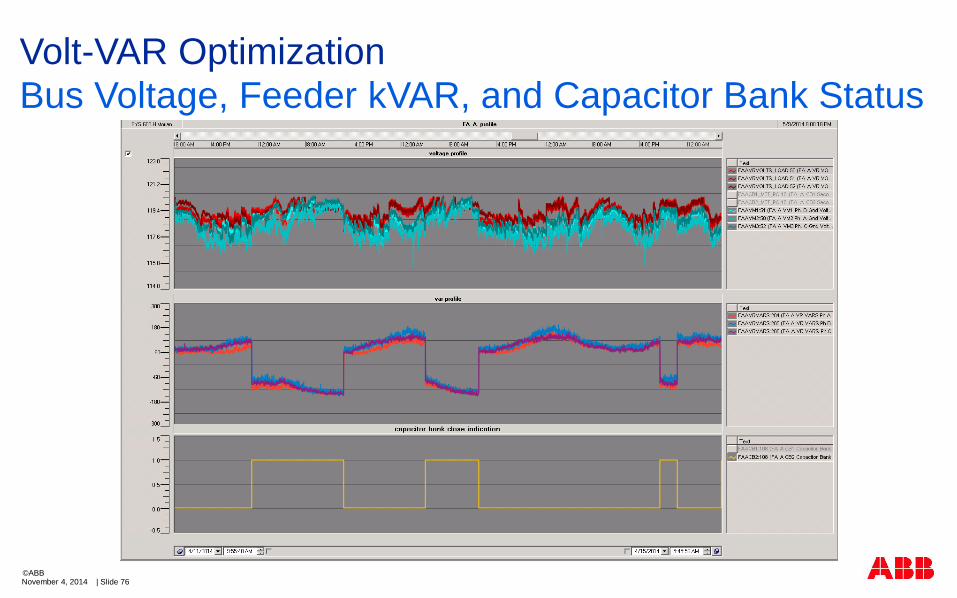
Volt-VAR Optimization
Bus Voltage, Feeder kVAR, and Capacitor Bank Status
November 4, 2014 | Slide 77©ABB
Volt-VAR Optimization
Measurement and Verification
Most used methods for measurement and verification:
Day on Day Off
Bus to Bus Comparison
One Bus always on PF correction
Alternate Buses from PF to CVR and compare
Compare for 9, 15 and 24 hours
November 4, 2014 | Slide 78©ABB
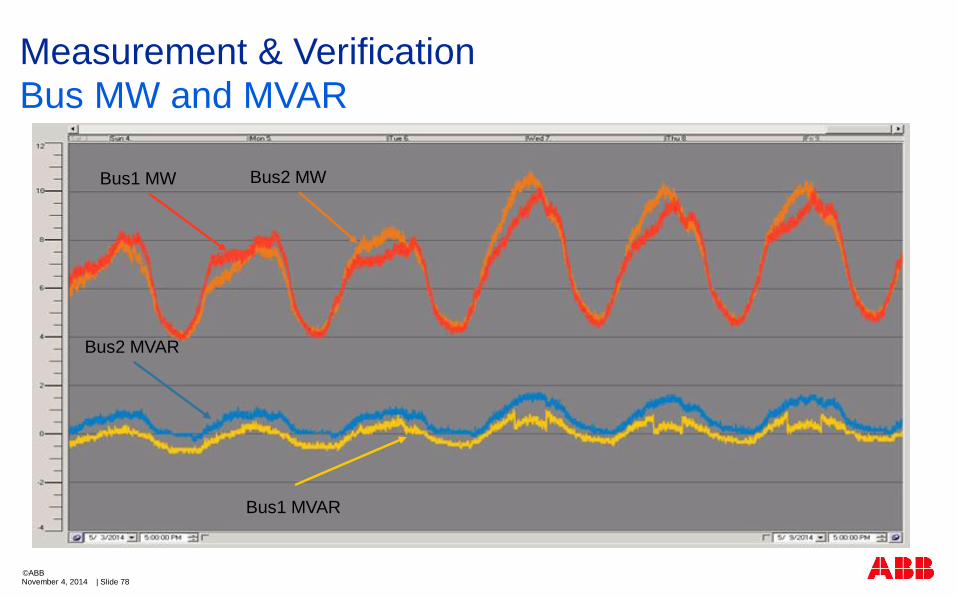
Measurement & Verification
Bus MW and MVAR
Bus1 MW Bus2 MW
Bus2 MVAR
Bus1 MVAR
November 4, 2014 | Slide 79©ABB
Measurement & Verification
Results for 24hr comparison
An Average reduction of 300kwH per 10MVA Load
November 4, 2014 | Slide 80©ABB
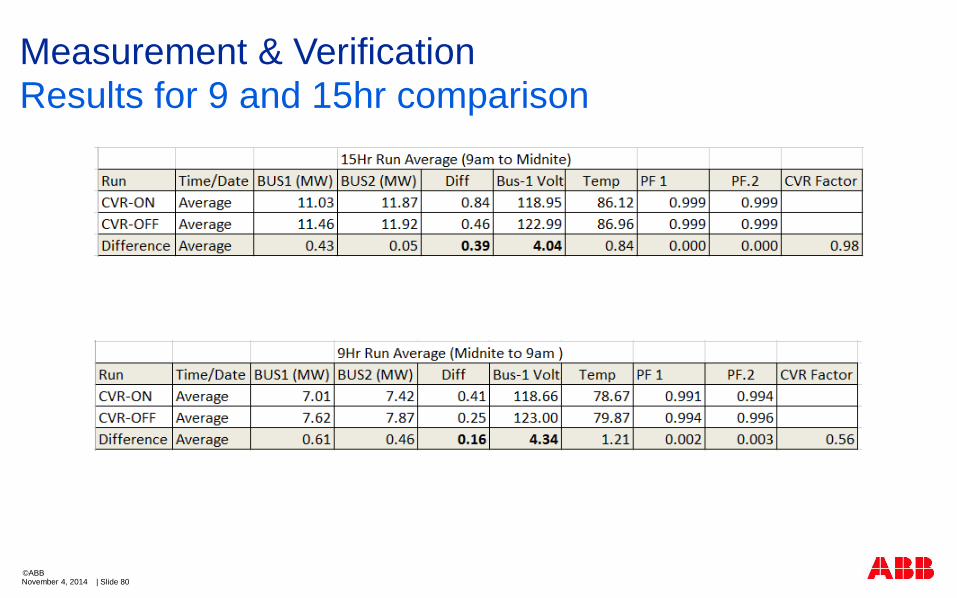
Measurement & Verification
Results for 9 and 15hr comparison
November 4, 2014 | Slide 81©ABB
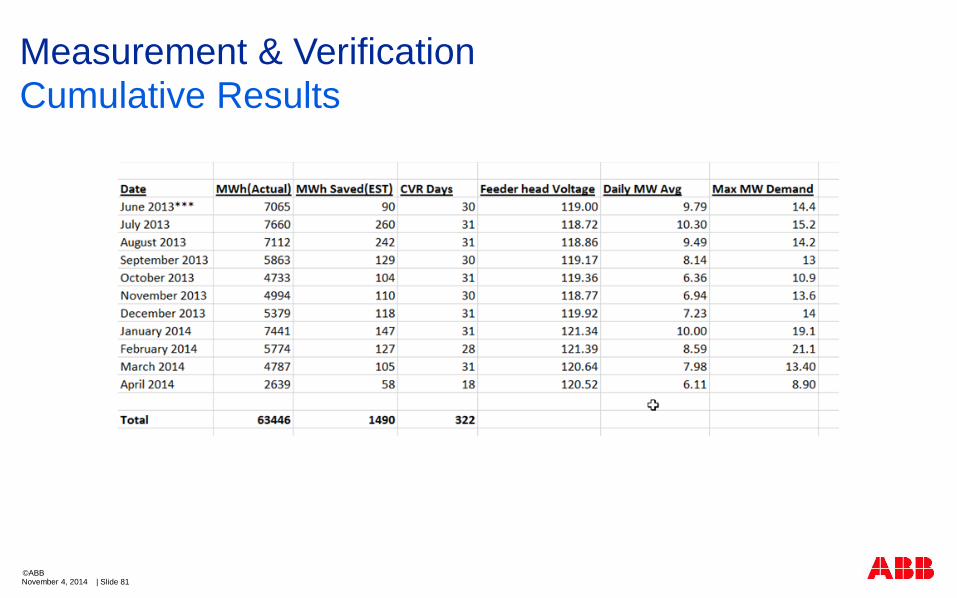
Measurement & Verification
Cumulative Results
Volt-VAR Optimization
Final Takeways
November 4, 2014 | Slide 82©ABB
VVO systems have been proven to provide positive NPV investments
Traditional demand response programs can take advantage of VVO to reduce peak demands on the system.
Centralized automation systems provide system synergies, including:
Distribution (“outside the fence”) SCADA
Distribution Management Systems (DMS)
Outage Management Systems (OMS)
Automatic Reconfiguration (FDIR, FLISR, etc.)
Remote access to distribution devices through wireless infrastructure
VVO is one of the only (if not the only) way to improve energy efficiency without direct customer interface.
Distribution Automation in Action
VVO brochure available on the ABB website
November 4, 2014 | Slide 83©ABB
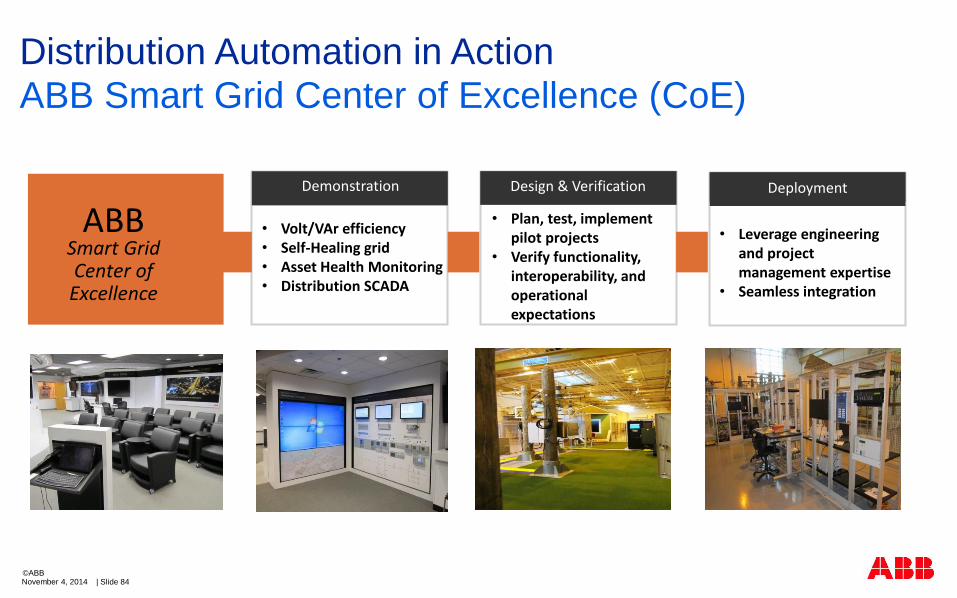
Distribution Automation in Action
ABB Smart Grid Center of Excellence (CoE)
November 4, 2014 | Slide 84©ABB
• Volt/VAr efficiency• Self-Healing grid• Asset Health Monitoring• Distribution SCADA
• Plan, test, implement pilot projects
• Verify functionality, interoperability, and operational expectations
• Leverage engineering and project management expertise
• Seamless integration
Demonstration Design & Verification Deployment
ABBSmart GridCenter of Excellence
• Relion Series Relays – Advanced flexible platform for protection and control
• RTU 500 Series – Proven, powerful and open architecture
• MicroSCADA - Advanced control and applications
• Tropos – Secure, robust, high speed wireless solutions
This webinar brought to you by:ABB Power Systems Automation and Communication
We combine innovative, flexible and open products with
engineering and project services to help our customers
address their challenges.

Thank you for your participation
Shortly, you will receive a link to an archive of this presentation.
To view a schedule of remaining webinars in this series, or for more
information on ABB’s protection and control solutions, visit:
www.abb.com/relion