Embed Size (px)
Citation preview
8/8/2019 EKOS poll - Nov. 25, 2010
http://slidepdf.com/reader/full/ekos-poll-nov-25-2010 1/8
Page 1
www.ekospolit ics.ca
C ONSERVATIVES PULLING AWAY FROM MORIBUND LIBERALS
S OME N OTABLE C HANGES IN B ROADER O UTLOO K
[Ottawa – November 25, 2010] – In a familiar
pattern, the Conservatives are once again
establishing a significant lead over the faltering
Liberal party who now appear to be chronically
rebuffed by the electorate as they try to move
past the Conservatives. Each time the Liberal
Party appears to be moving to parity and
threatening to crack the once humble 30-point
ceiling, they are brought down to the historical
low levels of the last election. The Conservativesare now very close to their moving average over
the past year, which is still well short of their
achievement in the last election.
The one in three voters who support the
Conservatives have a very defined profile. In the
rest of the spectrum, however, there is little
clarity in the demographics and a sense that the
non-Conservative vote is casting around among
the various alternatives trying to find a home for
their fairly significant discontent with the countryand federal direction. In particular, women are a
much more fluid vote and show a much lower
level of certainty or connection with the various
choices out there. This is also true of the voting
groups which follow the boomers in age. Both
the East and West Coasts are showing high
volatility with more settled patterns now evident
from Quebec to Alberta.
HIGHLIGHTS
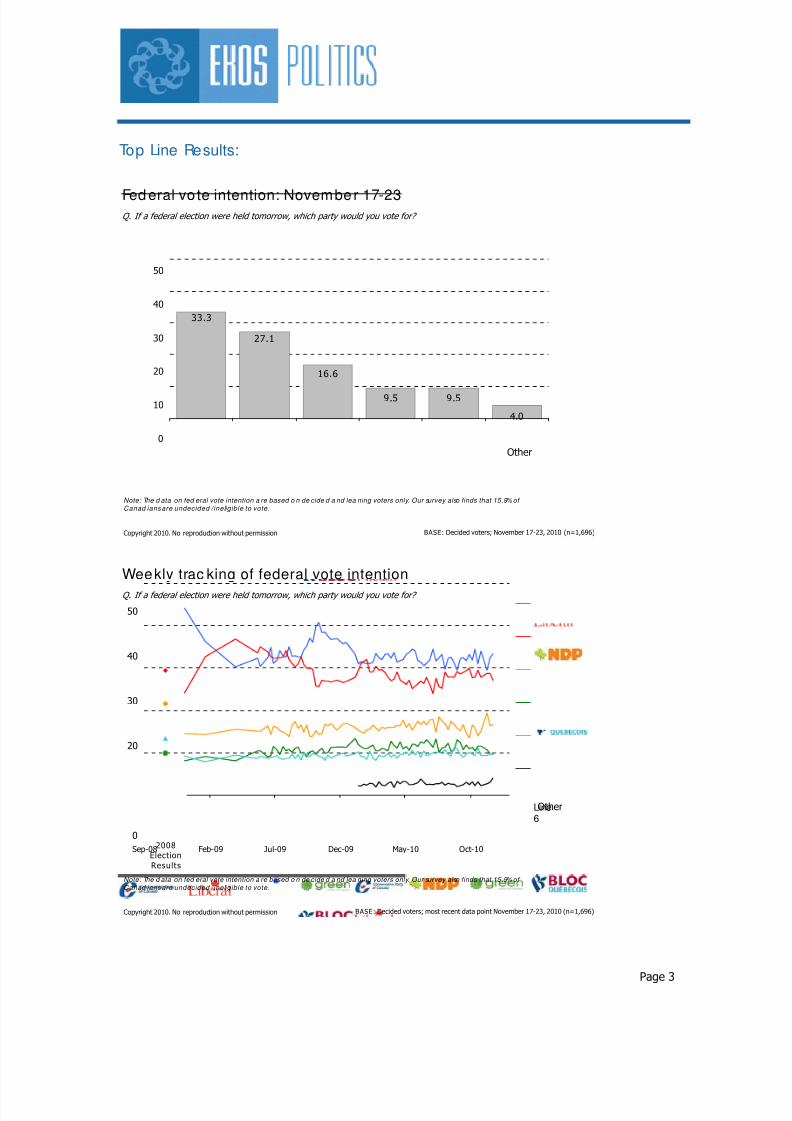
• Nationa l federal vote intention:
¤ 33.3% CPC
¤ 27.1% LPC
¤ 16.6% NDP
¤ 9.5% Green
¤ 9.5% BQ
¤ 4.0% other
• irection of country:D¤ 47.5% right direction
¤ 39.5% wrong direction
¤ 13.0% DK/ NR
• :Direction of government
¤ 40.2% right direction
¤ 47.5% wrong direction
¤ 12.3% DK/ NR
• Ideology:
¤ 32% small “l” l iberal
¤ 28% small “c” conservative
¤ 40% neither
• Trust in government:
¤ 5% almost always
¤ 28% most of the t ime
¤ 44% only some of the time
¤ 24% never
Please note that the e m thodology is provided at the
end of this document.
The Conservatives reveal very strong support among their familiar constituencies: seniors, men,
those born in Canada, and those with middle levels of socioeconomic status. The Conservativesalso have enough support in Alberta to win most of the seats twice. Liberal support, on the other
hand, shows no clear patterns with the exception of the university educated, non-Canadian born,
and Ontario. NDP support is now enormously concentrated in women and residents of BC and
Saskatchewan/Manitoba. The Greens are off somewhat but doing very well among younger voters
and better in BC. The Bloc are doing well in Quebec on the strength of younger voters and draw
virtually all of their support from Francophones. In frustration, perhaps, we have seen a rise in
support for the nebulous "other" category which, along with the casting among non-Conservative
8/8/2019 EKOS poll - Nov. 25, 2010
http://slidepdf.com/reader/full/ekos-poll-nov-25-2010 2/8
Page 2
supporters, may reveal the lack of clarity and direction outside of the Conservative base.
The recent fluctuations in the electorate are interesting but hardly conclusive. Although the
Conservatives are now in a much better position than in our last polling period, they were barely
ahead of the margin of error in the first week of polling. The volatility in some regions (such as
BC) renders the poll to poll comparisons almost meaningless statistically. Far more interesting is
the broader societal and economic outlook underpinning this relatively perpetually gridlocked
political landscape where the Conservatives remain dominant with the rather underwhelming
support of just one in three voters.
Outlook on the country and the federal government remains tepid at best. Slightly less than half
the public are happy with broad national direction and only two fifths are pleased with federal
direction. Notably, Conservative supporters are very happy with both, but there is little cheer
elsewhere. It is notable that the most extreme levels of discontent with direction occur outside of
Liberal support (Green, NDP, Bloc and other supporters). The volatility in BC may reflect
continued unhappiness with national and federal trajectory although the other most critical region
is Quebec which seems to have settled on a fairly stable pattern of support for the Bloc, and a
pretty sound rejection of the Conservatives.
Tracking on political ideology also presents some interesting results. There has been a sharp rise
in the proportion of Canadians who say they are neither liberal nor conservative. Meanwhile, the
proportion of small “l” liberals is down, it is still higher than the proportion of thsoe who consider
themselves small “c” conservatives.
Respondents from Alberta are most likely to identify themselves as conservative, while those
from Ontario are most likely to see themselves as liberal. Residents of BC, Quebec, and Atlantic
Canada, meanwhile, are most likely to see themselves as neither. University graduates are more
likely to be liberal, while the Generation X age group appears to be have rallied around the centre
of the political spectrum, opting to define themselves as neither liberal nor conservative. Men
appear to be more conservative, while women are adverse to either label, further evidence of the
instability within this group.
Lastly, trust in government has fallen to its lowest level since the Conservatives took office,
though it still remains relatively high compared to the 1990s. Responses are split largely along
party lines, with Conservatives expressing the highest levels of trust, while NDP, Green, and Bloc
supporters are the most distrustful. Youth, men, Albertans, and college graduates all expressed a
moderate degree of trust in the government, while women and university graduates show a
relatively stronger sense of scepticism.
8/8/2019 EKOS poll - Nov. 25, 2010
http://slidepdf.com/reader/full/ekos-poll-nov-25-2010 3/8
Page 3
Top Line Results:
Copyright 2010. No reproduction without permission
Fed eral vo te intention: November 17-23
BASE: Decided voters; November 17-23, 2010 (n=1,696)
Q. If a federal election were held tomorrow, which party would you vote for?
33.3
27.1
16.6
9.5 9.5
4.0
0
10
20
30
40
50
CPC LPC NDP GP BQ OtherOther
Note: The d ata on fed eral vote intention a re based o n de cide d a nd lea ning voters only. Our survey also finds that 15.9% of Canad ians are undecided /ineligible to vote.
Copyright 2010. No reproduction without permission
0
10
20
30
40
50
Sep-08 Feb-09 Jul-09 Dec-09 May-10 Oct-10
Line
6
2008
Election
Results
Note: The d ata on fed eral vote intention a re based o n de cide d a nd lea ning voters only. Our survey also finds that 15.9% of Canad ians are undecided /ineligible to vote.
Other
BASE: Decided voters; most recent data point November 17-23, 2010 (n=1,696)
Weekly trac king of federal vote intention
Q. If a federal election were held tomorrow, which party would you vote for?

8/8/2019 EKOS poll - Nov. 25, 2010
http://slidepdf.com/reader/full/ekos-poll-nov-25-2010 4/8
Page 4
Copyright 2010. No reproduction without permission
30
40
50
60
May-09 Jul-09 Sep-09 Nov-09 Jan-10 Mar-10 May-10 Jul-10 Sep-10 Nov-10
Wrong direction Right direction
BASE: Canadians; most recent data point November 17-23, 2010 (n=half sample)
Direc tion of c ountry
Q. All things considered, would you say the country is moving in the right direction or the wrong direction?
Copyright 2010. No reproduction without permission
30
40
50
60
May-09 Jul-09 Sep-09 Nov-09 Jan-10 Mar-10 May-10 Jul-10 Sep-10 Nov-10
Wrong direction Right direction
BASE: Canadians; most recent data point November 17-23, 2010 (n=half sample)
Direc tion of government
Q. All things considered, would you say the Government of Canada is moving in the right direction or the wrong
direction?

8/8/2019 EKOS poll - Nov. 25, 2010
http://slidepdf.com/reader/full/ekos-poll-nov-25-2010 5/8

8/8/2019 EKOS poll - Nov. 25, 2010
http://slidepdf.com/reader/full/ekos-poll-nov-25-2010 6/8
Page 6
Copyright 2010. No reproduction without permission BASE: Canadians; November 17-23, 2010 (n=1,973)
5
28
44
24
0
20
40
60
80
100
Almost always Most of the time Only some of the time Almost never
Trust in government
Q. How much do you trust the government in Ottawa to do what is right?
Higher among:BQ (40%), GP(37%), NDP
(30%), QC (30%)
Higher among:NDP (56%)
Higher among:CPC (50%), Youth
(39%), Alberta(38%)
Higher among: Youth (10%), CPC
(9%)
Copyright 2010. No reproduction without permission
Trust in government
0
10
20
30
40
50
60
68 70 72 74 76 78 80 82 84 86 88 90 92 94 96 98 00 02 04 06 08 10
Q. How much do you trust the government in Ottawa to do what is right?
% who trust governme nt “alm ost alwa ys/m ost of the time” (1968-2010)
BASE: Canadians; most recent data point November 17-23, 2010 (n=1,973)
8/8/2019 EKOS poll - Nov. 25, 2010
http://slidepdf.com/reader/full/ekos-poll-nov-25-2010 7/8
Page 7
Methodology:
EKOS’ weekly tracking polls are conducted using Interactive Voice Recognition (IVR) technology,
which allows respondents to enter their preferences by punching the keypad on their phone,
rather than telling them to an operator.
In an effort to reduce the coverage bias of landline only RDD, we created a dual landline/cell
phone RDD sampling frame for this research. As a result, we are able to reach those with both a
landline and cell phone, as well as cell phone only households and landline only households. This
dual frame yields a near perfect unweighted distribution on age group and gender, something
almost never seen with traditional landline RDD sample or interviewer-administered surveys.
The field dates for this survey are November 17-23, 20101. In total, a random sample of 1,973
Canadians aged 18 and over responded to the survey (including a sub-sample of 1,696 decided
voters). The margin of error associated with the total sample is +/-2.2 percentage points, 19
times out of 20.
Please note that the margin of error increases when the results are sub-divided (i.e., error
margins for sub-groups such as region, sex, age, education). All the data have been statistically
weighted to ensure the samples composition reflects that of the actual population of Canada
according to Census data.
1 Please note that these dates are not inclusive of weekends, as we do not survey on Saturday or Sunday.
8/8/2019 EKOS poll - Nov. 25, 2010
http://slidepdf.com/reader/full/ekos-poll-nov-25-2010 8/8
Page 8
Annex:
Copyright 2010. No reproduction without permission
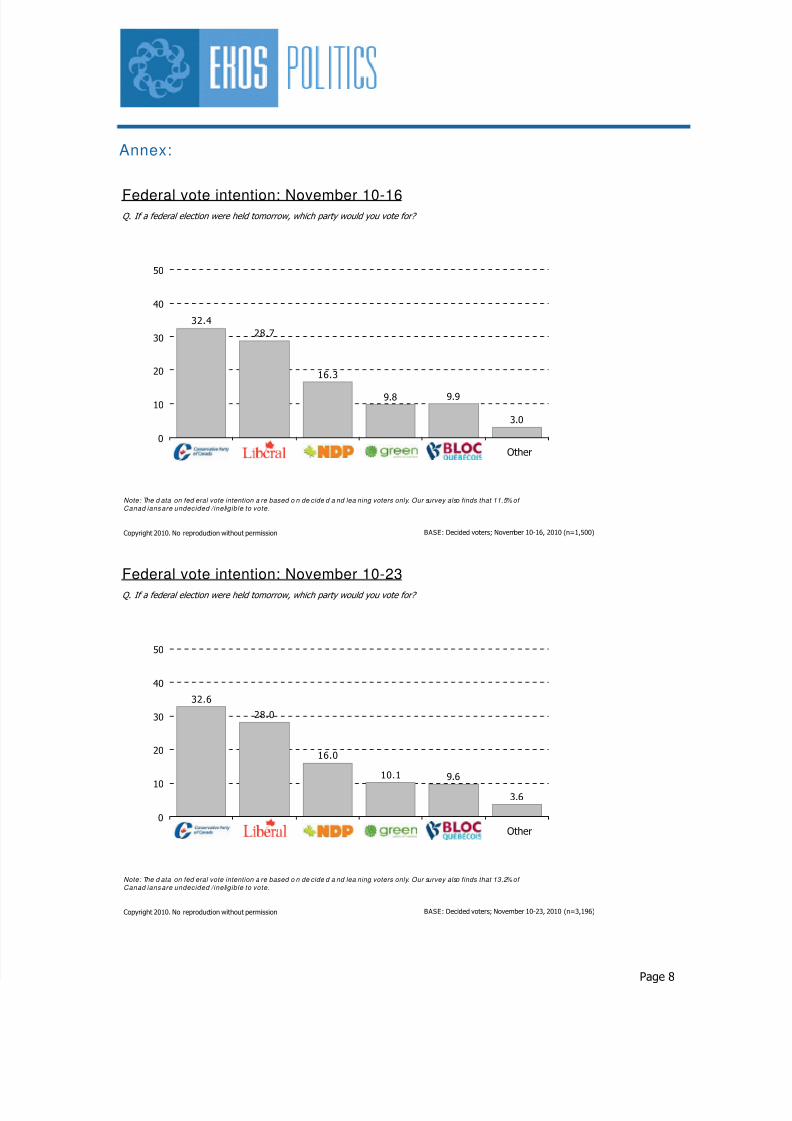
Federal vote intention: November 10-16
BASE: Decided voters; November 10-16, 2010 (n=1,500)
Q. If a federal election were held tomorrow, which party would you vote for?
32.4
28.7
16.3
9.8 9.9
3.0
0
10
20
30
40
50
CPC LPC NDP GP BQ OtherOther
Note: The d ata on fed eral vote intention a re based o n de cide d a nd lea ning voters only. Our survey also finds that 11.5% of Canad ians are undecided /ineligible to vote.
Copyright 2010. No reproduction without permission
Federal vote intention: November 10-23
BASE: Decided voters; November 10-23, 2010 (n=3,196)
Q. If a federal election were held tomorrow, which party would you vote for?
32.6
28.0
16.0
10.1 9.6
3.6
0
10
20
30
40
50
CPC LPC NDP GP BQ OtherOther
Note: The d ata on fed eral vote intention a re based o n de cide d a nd lea ning voters only. Our survey also finds that 13.2% of Canad ians are undecided /ineligible to vote.