Embed Size (px)
Citation preview

Appointing Women to the Board in the UK∗
Ian Gregory-Smith†
Brian G. M. Main‡
Charles A. O’Reilly III§
September 2012
Abstract
This paper uses new UK data to examine issues thrown up by the debateregarding the scarcity of women in boardroom positions. The paper examinesthe appointment process, relative pay and any associated productivity effectsderiving from increased diversity. Using data on the board composition and com-pany performance of each FTSE 350 company between 1996 and 2010, this paperfinds evidence of gender-bias in the appointment of women as non-executive di-rectors and finds mixed evidence of discrimination in wages or fees paid, but nosupport for the argument that gender diverse boards enhance corporate perfor-mance. Proposals in favour of greater board diversity may be best structuredaround the categorical value of diversity, rather than with reference to an expec-tation of improved company performance.
JEL codes: J31; J62; J63
∗Brian Main is grateful for research support under ESRC Grant: RES-062-23-0904.†University of Sheffield‡Address for correspondence: University of Edinburgh Business School, 29 Buccleuch Place, Edin-
burgh, EH8 9JS. Tel +44 (0) 131 6511375. E-mail: [email protected]§University of Stanford
1
Introduction
In response to institutional pressure (Tyson, 2003), the average proportion of the female
directors on a FTSE 350 board has increased from 2.22% to 8.19% between 1996 and
2010. At this rate of change some have predicted it might take 70 years to achieve
gender parity in the boardroom (E&HRC, 2007). In the UK, claiming that the business
case is clear, the BIS (Davies, 2011) has set an aspirational target of 25% to be attained
in FTSE100 companies by 2015. More recently the EU has proposed a 40% female
representation on the boards of all listed companies by 2020 (European Union, 2012).
In 2003, Norway set a similar, initially voluntary, target of 40% to be attained by 2005,
but only by later making compliance mandatory (Teigen, 2010; Nielsen and Huse, 2010)
was this figure finally attained (in 2008). Early evidence from Norway suggests that
market valuations have been negatively affected by such quotas (Ahern and Dittmar,
2012). Some countries such as France, Finland, Iceland, Italy, and Spain have embarked
upon similar policy journeys (Davies, 2011), with others, such as Australia, Austria,
and The Netherlands, adopting a less directive approach.
Current arguments in favour of mandatory quotas for female directors (Terjesen et al.,
2009), as adopted by Norwegian regulators, are generally based on considerations of
equity but are often also located around an expectation of improved corporate perfor-
mance (Adams et al., 2007). This improvement can occur through two channels. First,
high quality female directors, previously excluded from the executive labour market
could replace less able male directors. Second, a more diverse team may improve board
decision making. This raises two research questions. First, just how inequitable is the
experience of women board members? Second, what performance link can be observed
between female representation at boardroom level and company performance?
Using data on the board composition and the company performance of each FTSE 350
company between 1996 and 2010, this paper searches for evidence that sheds light on
these two issues, equity and productivity. In terms of equity, the board appointment
process is examined for evidence of gender bias and the remuneration of executives is
tested for a significant male-female wage gap. In terms of the productivity effects of
diversity, various measures of company performance are tested for a link with board
gender diversity. The article is structured as follows. Section 1 reviews the literature
relating to the presence of women on company boards. Section 2 introduces the data
2

sources utilised and discusses the estimation methods deployed. Section 4 presents the
results, and the paper concludes with a policy discussion in section 5.
1 Women on company boards
1.1 The appointment of women to company boards
The fact that the representation of women on company boards is far lower than their
presence in the labour market would suggest, is not necessarily proof of discrimination.
The outcome may be due to supply-side effects arising from considerations such as fam-
ily formation (Mincer and Polachek, 1974; Bygren and Ghler, 2012). Under this view,
the decisions of women in terms of their choice of labour market activity, human capital
investment and consequent career path result in a relatively limited pool of qualified
female candidates when board positions are filled. This contrasts with the notion of the
‘glass ceiling’ (Powell and Butterfield, 1994) which argues there are discriminatory bar-
riers that inhibit the progression of women up the corporate ladder. Both perspectives
suggest that, when board appointments are made, qualified applicants are predomi-
nantly male.
Empirical testing for discriminatory effects in hiring at this level of the corporate ladder
is made difficult owing to the lack of comprehensive measures of the availability of suit-
ably qualified candidates for any given position. Even studies that deploy exceptionally
rich data sets have their conclusions regarding the operation of a ‘glass ceiling’ under-
mined by lingering concerns regarding unobserved heterogeneity (Smith et al., 2010).
However, Farrell and Hersch (2005) avoid this problem by estimating the probability
of a female boardroom hire as a function of the gender of the director (if any) stepping
down from the board in the prior period. In a gender neutral world, the probability
that the newly appointed director is female should be independent of the gender of any
director who is stepping down from the board. That probability may be low owing to
supply-side or ‘pipeline’ effects (Doldor et al., 2012), but it should be the same whether
a male or female director is leaving the board. Farrell and Hersch (2005) establish
that the chances of appointing a female are significantly higher if a woman has recently
demitted the board. They study a sample of some 300 Fortune 500 level firms over the
3

10-year period that comprised the 1990s, and estimate that the probability of making
a female appointment in any year is around 0.39 if a female has recently departed but
only 0.13 if a male has departed.
The observed effect may be due to ‘tokenism’ (Kanter, 1997; Elstad and Ladegard,
2012) but it certainly qualifies as discriminatory. In terms of the attainment of the
aspirational target of 25% female representation on FTSE100 by 2015 (Davies, 2011), it
also suggests that there is more to overcome than simple demographic inertia (Marschke
et al., 2007). Utilising data for UK board appointments, the approach of Farrell and
Hersch (2005) will be replicated below to test if the phenomenon is also observed in the
UK.
1.2 The payment of women on company boards
A second area of potential discrimination is in the payment made to female directors -
either as executive directors or as non-executive directors. For the latter, remuneration
comprises fees paid for being in office and for attending various board meetings and
board sub-committee meetings. For executive directors, remuneration is generally of
a much higher level and comprises both cash-based and equity-linked pay, as will be
detailed below. Using a very large sample of all employees in Sweden in 1998, Albrecht
et al. (2003) establish a significant glass ceiling effect at the top of the wage distribu-
tion and demonstrate that a similar effect exists for the USA, albeit empirically more
modest. They also argue that while three-quarters of the observed male-female wage
gap at the top of the wage distribution can be explained by personal and occupational
characteristics, these, and particular the observed occupation, are simply manifesta-
tions of the same glass-ceiling effect. One reason to doubt whether such findings are be
replicated in boardroom appointments is the extensive use of remuneration consultants
in setting directors’ pay and the high degree of transparency that attends the award of
directors’ pay (Main et al., 2008).
Research on the male-female director wage gap has focussed on the executive group.
Using data for the USA on the five highest paid executives in each of a sample of compa-
nies from 1992 through 1997, Hallock and Bertrand (2001) find a raw gender pay gap of
4

some 45% (where pay includes the value of executive share options issued in the year).
They find that all but five percentage points of this gap can be explained by company
characteristics (size and performance) and by individual characteristics (age, job-tenure,
and CEO status). Adams et al. (2007) extend the period of analysis through 2004 and
fail to find any significant gender difference in the pay of CEOs (measured as base pay
plus annual bonus), although for other boardroom executives a statistically significant
gap of some 17% remains. Pau and Sahni (2009) study the period 1994 through 2002
and ascribe much of the observed gender difference in remuneration (defined to include
equity related awards) as being due to the riskiness of the industry entered. But they
continue to find a statistically significant five percentage point gender gap in pay.
In fact, the evidence here is mixed. Smith et al. (2010) find that, in a sample of Dan-
ish companies, while controlling for personal and occupational characteristics reduces
the male-female gap, it remains both empirically and statistically significant. Adams
and Ferreira (2009), on the other hand, find that for companies in the USA between
1996 and 2003 there was no statistically significant gender difference in executive di-
rector pay. The lack of significance remains even when the focus is on individual CEO
pay. The existence of a statistically significant gender wage gap among directors of
UK companies will be tested below, with separate analyses for executive directors and
non-executive directors. The latter are paid primarily by fee and, as has been indicated
above, at what is generally a much lower level of reward.
1.3 Women on company boards and company performance
As emphasised above, there is a clear equity-based case for appointing a fair represen-
tation of women to serve on company boards. There are also, however, two further
arguments that are based on considerations of productivity. The first concerns the
direct costs of discrimination and the second relates to the improvement to decision
making, and hence productivity, that arises from working in diverse teams.
In terms of the first argument, any company indulging in discrimination in this area
(Becker, 1957) will fail to realise the full productive potential of women and hence
place themselves at a competitive disadvantage. So, driven by self interest or what
5

Arrow (1972) paraphrased Marshall (1927) as describing as ‘the vast forces of greed
and aggressiveness - not the best but the strongest motives in humanity’, companies
should strive to appoint qualified women to the board. Challenged by clear evidence
of continuing discrimination in the labour market, Arrow (1972) referred to Sherlock
Holmes’ (Doyle, 1892) ‘dog that did not bark in the night’ in highlighting the apparent
impotence of the profit motive to eliminate such discrimination. The Arrow-Marshall
critique has been partly answered by models of human capital acquisition (Mincer and
Polachek, 1974), statistical discrimination in job allocation (Lazear and Rosen, 1990),
dynamic monopsony (Manning, 2003; Ransom and Oaxaca, 2010) whereby employers
exploit the different supply elasticities of males and females, and by more psychological
and sociological models (Booth, 2009) where employers’ and employees’ perspectives
impact on labour market outcomes. In this last context, with executive pay individual
negotiation can be expected to be relatively important and the observed difference in
negotiating styles between men and women, as captured in the Babcock and Laschever
(2003) phrase ‘women don’t ask’ could contribute to any observed pay disparity, as
Blackaby et al. (2005) find among UK academics.
The second productivity-based argument in favour of appointing women to boards cen-
tres around the observation that diverse teams achieve better results than more ho-
mogeneous ones (Milliken and Martins, 1996; Eisenhardt et al., 1997; Goodstein et al.,
1994). Translated to board composition, this leads to the ‘business case for diversity’
(Robinson and Dechant, 1997; van der Walt and Ingley, 2003), which argues that the
addition of women to boards brings with it an uplift in productivity. Empirically, there
is evidence to suggest that in general the precise composition of the board has little
empirical impact on company performance (Larcker et al., 2007) but, compared to men,
women do seem to make different contributions in terms of board activity (Adams and
Ferreira, 2009; Nielsen and Huse, 2010; Zelechowski and Bilimoria, 2004). The evidence
on whether this translates to a significant impact on company performance is less clear
(O’Reilly and Main, 2012).
There are studies that point to consistent productivity effects (Joy et al., 2007; McK-
insey & Co., 2007, 2008, 2010; Rohner and Dougan, 2012; Wilson and Altanlar, 2009),
but others fail to find any significant effect (Adams and Ferreira, 2009). Using as a nat-
ural experiment the imposition of a quota of 40% boardroom representation imposed on
publicly quoted Norwegian companies, Ahern and Dittmar (2012) actually find a nega-
6

tive impact on firm valuations, suggesting negative expected performance implications
of the change. Some studies find a positive effect by focusing on indirect measures of
performance such as innovation (Torchia et al., 2011), with some going on to link such
innovation to higher company performance (Miller and del Carmen Triana, 2009; Dezso
and Gaddis Ross, 2012). The measures of performance used are invariably accounting
based such as return of assets (ROA), return on investment (ROI) or Tobin’s Q (Er-
hardt et al., 2003). And finding a positive connection between women on the board and
firm performance often depends on the specific metric chosen for performance (Erhardt
et al., 2003; Smith et al., 2006). In the analysis below, both a market based measure of
performance (shareholder return) and a range of accounting based measures are used
to test the hypothesis that there is a link in the UK between the prevalence of women
on a board and that company’s performance.
2 Data and Methods
The data used here are obtained from a proprietary source created by Manifest Infor-
mation Services for the purpose of providing proxy voting advice. The data span 1996
through 2010 and cover all companies that have been listed on the FTSE350 during that
period. Even when a company falls out of the index it continues to be followed. The
data provide a particularly rich picture of the comings and goings in the boardroom.
The start and end date of each director’s period of office is recorded as is a variety of
information describing the personal characteristics and the financial reward received in
each year by all directors - whether executive or non-executive. Additional information
concerning company performance in each year is obtained from DataStream.
2.1 Measures
A comprehensive measure of pay is obtained by adding not only cash payments such
as base pay, board fees and annual bonus payments but also the value of long-term
incentive arrangements such as executive share options and performance share plans
(Pepper, 2006). The single source of reward that is not captured arises from pensions.
This is because data on pensions are simply not available in a consistent or continuous
7

form. That said, the pay measures used are as comprehensive as possible. Three pay
measures are calculated. The narrowest is the cash-based short term measure of salary
plus annual cash bonus paid out (plus any other cash payments or cash equivalents paid
in the year, such as re-location allowances and the cash value of perquisites). This is
labelled total cash compensation (TCC). A wider measure that adds to ‘TCC’ an ap-
proximation of the value of awarded share options, performance share plans and other
long-term incentives is total direct compensation awarded (TDCa). In this, we follow
Conyon and Murphy (2000) by approximating the actuarial value of executive share
options by one-third of awarded face value and of performance share plans by 70% of
awarded share value. Owing to the growing complexity of such arrangements due to
the increasing conditionality of these equity-linked rewards that are often dependent
on the attainment of complex and idiosyncratic relative performance conditions (Main,
2006), no measure of the value awarded is going to be anything but an approximate
estimate. For this reason, the third measure has much to commend it. This is total
direct compensation as realised (TDCr) which adds to ‘TCC’ the observed realised
value of long term incentives such as executive share options and performance share
plans. This obviates the need to estimate the expected value of awarded incentives, and
simply records their actual value at vesting when they can be cashed in.
Owing to the richness of the data, it is possible to characterise a company’s board at
the end of each financial year by the percentage of directors who are female (p female),
the percentage who are non-executive (p neds), the percentage who are adjudged by the
proxy advisory firm to be truly independent (p ind), and the total board size (bsize).
The size of the company is measured by the logarithm of that year’s turnover (lnsize)
as recorded in DataStream. Company performance is also gauged on an annual basis
using: total shareholder return (tsr); return on assets (roa); return on equity (roe); and
the logarithm of the price-to-book ratio (lnptob), used here to approximate Tobin’s Q.
Share price volatility (volatility) is measured over the prior 12-month period. Director
pay and company descriptors are all winsorised at the 1% and 99% tails. All financial
data are expressed in £2010.
Apart from gender (female), additional personal detail on individual directors is avail-
able in the form of age in years (age), age-squared (agesq), and the number of years to
date on the board (tenure). It is also possible for executive directors to categorise the
position held on the board - whether Chief Executive Officer (ceo), Chairman (chair),
8

or Financial Director (fd). For non-executive directors, particular attention is paid to
service on the remuneration committee, whether simply as a member (remcoserve) or
as Chair (remcochair). In the analysis of the new board member appointment decision,
use is also made of the descriptor as to whether in the prior period any male director
had exited the board (MExit) or whether any female director had exited the board
(FExit). These measures are also available separately for executive directors and for
non-executive directors.
Table 1 provides a summary of the data in terms of the representation of women on
company boards between 1996 and 2010. As explained above, companies continue to
be followed in the sample even when they fall out of the FTSE350 but, for the sake of
clarity, Table 1 restricts companies to those contemporaneously in the FTSE350 at the
end of their financial year. The improvement in female representation over the period is
evident - more so for non-executives than for executives. Even at the end of the sample
period, however, only around 3.25% of executives are female and 9.81% of non-executive
directors are female. Descriptive statistics on the entire sample are available in Table
2.
2.2 Estimation
The process of adding new board members is modelled as a probit focusing on each new
appointment (this is not the periodic re-election of existing directors but the actual ap-
pointment of a new person to the board). The dependent variable is the gender of the
newly selected person (1 = female). The independent variables comprise the range of
company descriptors described above including the measure of whether any male or
female has stepped down from the board in the prior 12-month period. It is possible to
have four things occur: no-one has stepped down; a male director has stepped down;
a female director has stepped down; both a male and a female director have stepped
down. All the independent variables are lagged one period. The hypothesis is that with
a gender neutral selection process at work then the probability that a new appointment
is female should bear no significant relationship to the gender of those stepping down.
In the wage regressions, all three of our measures of pay are examined: the narrow
‘salary plus annual bonus’ type measure (‘TCC’); the wider measure of total direct
9

compensation that includes an estimate of the expected value of the share options
and performance shares granted in the period (‘TDCa’); and, finally, the total direct
compensation measure that records realised pay and avoids any ambiguity of valua-
tion (‘TDCr’). These three measures are only distinct in the case of executive director
regressions. For non-executive directors, regression analysis is restricted to TCC as
their remuneration is essentially in the form of fees as the use of share options and
other long term incentives is positively discouraged (being perceived to threaten the
independence of the director’s status). The dependent variable is in logs. Independent
variables include lagged values of company characteristics and the personal attributes
of the director concerned. Year dummies are included and estimation is in fixed effects.
The hypothesis being tested here is that once in a job in the boardroom males and
females are treated equally in terms of remuneration.
The performance of companies in relationship to the prevalence of women in board-
room positions is examined in a series of regressions using as dependent variable: total
shareholder return (‘tsr’); return of assets (‘roa’); return of equity (‘roe’); and the log-
arithm of price to book ratio (‘lnptob’). The null hypothesis under test is that there
is a no significant link between a company’s performance and the prevalence of women
on the board of that company. In addition to the lagged percentage of directors who
are women, board size, proportion of directors who are non-executive, proportion who
are judged independent, the size of the company and it’s volatility are all entered with
a lag as control variable. To reflect the dynamic nature of performance, the lagged
value of the dependent variable is also included. This variable is treated as endoge-
nous, being correlated with the error term. In addition, the lagged value ‘p female’ is
also potentially endogenous. High performing companies may attract a greater pool of
female applicants and/or better performing companies may have more flexibility to ap-
point female directors. Likewise, each of the control variables (‘lnsize’, ‘bsize’, p neds’,
‘p ind’ and ‘volatility’) could be regarded as endogenous as a result of choices made by
the board, in view of expected performance. Because of this, estimation is by gener-
alised methods of moments (GMM) (xtabond2 in STATA 12.1) (Arellano and Bond,
1991; Arellano and Bover, 1995; Blundell and Bond, 1998). This exploits lagged values
as instruments for the potentially endogenous variables. The two step version of the
estimator is used, with Windmeijer (2005) corrected standard errors.
10

3 Results
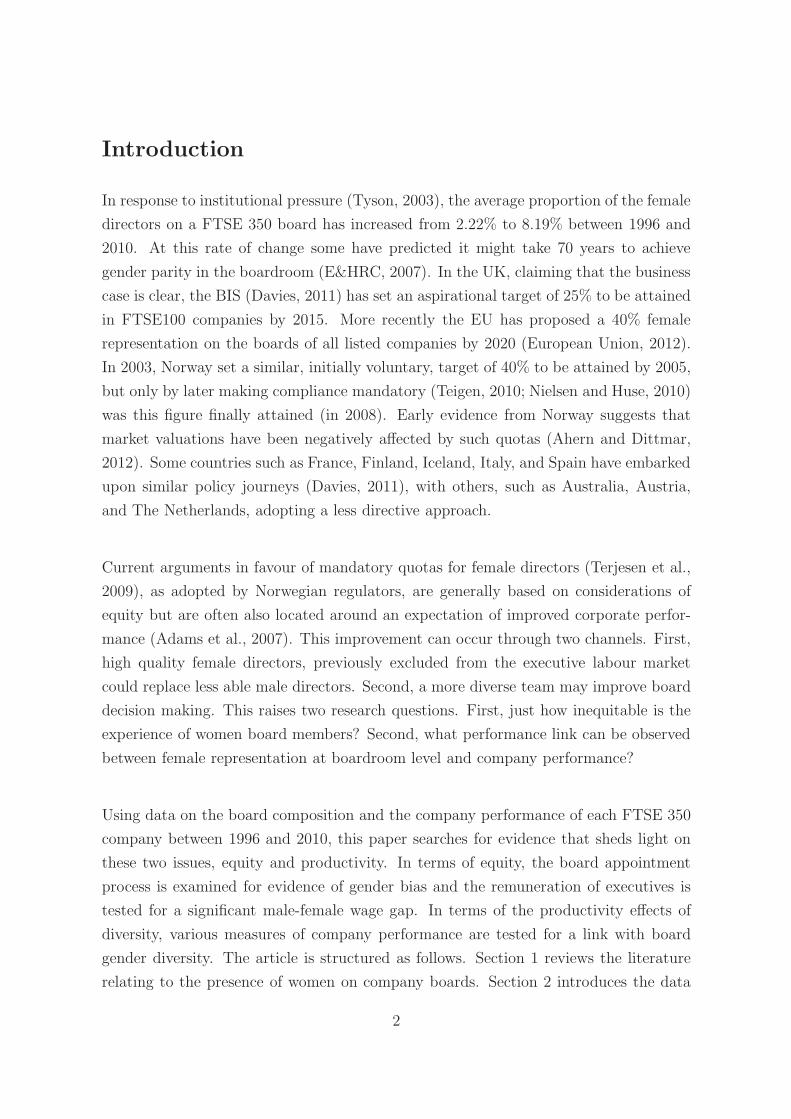
Table 3 reports the Probit estimates of the probability that a board appointment goes
to a woman. The first two columns treat all directorships alike. Even in column (2),
which controls for company characteristics, it can be seen that the fact that a woman
has stepped down in the previous period significantly enhances the probability that the
appointment in question will go to a woman. The reverse is true had a male recently
stepped down. Estimated at the median of the sample characteristics and reported
in Table 4, the probability of a female appointment changes from 0.075 if a man has
stepped down to 0.136 if a woman has stepped down. While these are empirically
modest probabilities (reflecting the prevalence of women directors), the odds against a
female appointment fall by some 52% between the two scenarios.
Separating the analysis into executive directors (columns (3) and (4)) and non-executive
directors (columns (5) and (6)) reveals a markedly lower probability of women achieving
executive appointments as opposed to non-executive appointments. This was already
evident in Table 1 discussed above. The gender bias is statistically significant only in
the case of non-executive directors, where the probabilities of a female appointment
discussed above become 0.095 and 0.190 respectively. This represents a shift in the
odds against a female appointment from just under ten-to-one against to slightly over
four-to-one against. While representing an empirically significant impact on the odds of
appointment, these estimated probabilities are lower than the 0.13 and 0.39 respectively
by Farrell and Hersch (2005) for the USA. However, the conclusion remains the same.
The non-executive appointment process is not gender neutral and there is evidence of
a degree of tokenism whereby boards have an eye to maintaining a representation of
women but do not allow an equal opportunity of appointment to all non-executive po-
sitions.
The results on executive pay are presented in Table 5. The raw male-female wage gap
(the simple regressions reported in columns (1) through (3)) reveals that women are
paid at least 20% less than men in each of the three wage measures. Once company
characteristics, director personal characteristics and company-specific fixed effects are
controlled for, this wage gap becomes statistically insignificant (columns (4) through
(6)). A fixed effects estimator is used as the random effects approach is rejected in
Hausman tests, and unobserved heterogeneity is better addressed through use of fixed
11

effects. Of course, as Albrecht et al. (2003) are careful to point out, such an outcome
does not imply that there is no glass ceiling or that the executive labour market is free
of sex discrimination. There may be significant discrimination that impacts on women
on their career path to these positions but, once in post, the pay arrangements enjoyed
by female executive directors do not seem to be materially different from those enjoyed
by their male colleagues.
When the fees received by non-executive directors are considered in Table 6, a rather
different picture emerges. There is a clear gender difference in the raw levels of remuner-
ation received of just over 4% and this is statistically significant at the 10% confidence
level. But in a company-specific fixed effects regression that controls for company and
personal characteristics, a significant gap of over 8% is revealed, and this at a 1% level
of significance. It seems that the care being expended by remuneration consultants on
bench-marking and other pay design considerations for executive director positions is
not being done as successfully for non-executives.
Finally, in Table 7, the association between gender diversity at board level and company
performance is examined. As explained above, accounting-based performance measures
are serially correlated and for this reason the lag of the dependent variable is included
in these GMM estimates. The focal variable is the fraction of the board that is female
(‘p female’) which is entered with a lag, as are the other variables that capture com-
pany characteristics. It can be seen that for each of shareholder return (‘tsr’), return
on assets (‘roa’), return on equity (‘roe’), and the price to book ratio (‘lnptob’) there
is no significant link between that performance measure and the extent of boardroom
gender diversity (‘p female’). The evidence in Table 7, therefore, fails to support the
hypothesis that there is a productivity enhancing effect brought about by gender diver-
sity in the boardroom.
4 Policy Discussion and Conclusion
Drawing on 15 years of data between 1996 and 2010 describing the boardroom compo-
sition, pay and performance of FTSE350 companies, this paper has addressed several
issues that emerge in the debate regarding the scarcity of women in the boardroom.
12

Two research questions are addressed. The first asks whether boardroom procedures
are gender neutral by examining the process of making boardroom appointments and
by testing for a significant male-female pay gap. The second asks whether a significant
performance link can be observed between female representation at boardroom level
and company performance.
In terms of equity, the board appointment process is found to display a gender bias in
the case of non-executive directors. This is a gender bias in the sense that the probabil-
ity of a boardroom appointment going to a woman is dependent on whether a woman
has stepped down from the board in the recent period. The odds on making a female
appointment at the non-executive level (never high) are significantly enhanced when
a non-executive woman has stepped down in the prior period. The preponderance of
males on UK boards, of course, means that many more men stepping down than women.
The appointment process for non-executives is not gender neutral. No such significant
effect is found for executive positions, although here the probability of a female ap-
pointment is already much lower.
Once appointed, however, executive directors are treated equally in terms of pay, both
in the narrower cash-based measure of ‘salary plus bonus’ and in the wider measures
that allow for equity-linked rewards such as executive share options and performance
shares. Given the extensive industry of remuneration consultants (Conyon, 2011) who
strive to devise appropriate pay arrangements, and given the transparency that char-
acterises disclosure in this area (Conyon et al., 2010), this result is perhaps less than
surprising. But, in the case of non-executive directors (where the median remuneration
is a relatively modest £42,420 as opposed to £411,165 for executives in the same TCC
cash pay terms. there is a significant male-female pay gap that is revealed once account
is taken of the personal and company characteristics. The estimated discriminatory gap
is over 8%. This is surprising and may relate to the tokenism of female non-executive
appointments which is suggested by the earlier result concerning the increased likeli-
hood of a woman being appointed if another woman has just stepped down from the
board.
In terms of the second research question, there seems to be no significant link between
the gender diversity of boards and any of our measures of company performance. Of
13

course, a lack of clear connection with company performance is not to say that boards
with a more diverse make-up do not behave differently, as there is substantial evidence
to suggest they do. But it does mean that there is no clear translation of this into
performance as measured on the bottom line, neither in terms of shareholder return
(‘tsr’), nor in terms of the accounting measures of ‘roa’ and ‘roe’, nor as measured by
our approximation to ‘Tobin’s-Q’. This is reminiscent of the (Demsetz and Lehn, 1985)
regarding ownership structure having no observed linkage with performance. Boards
may already be optimising their gender composition to take full advantage of resource
dependency considerations (Hillman et al., 2000; Luckerath-Rovers, 2009) or concerns
regarding advice and counsel (Westphal, 1999). That said, however, the results pre-
sented in Table 3 suggest the appointment process is not currently gender neutral and
that without external intervention substantially increased gender diversity in the board-
room may be some time coming. But the lack of strong support for the argument that
gender-diverse boards enhance corporate performance suggests that proposals in favour
of greater board diversity may be better structured around the categorical value of di-
versity, rather than with reference to an expectation of improved corporate performance.
5 Tables
14

Table 1: Percentage of women on the board by year in the FTSE350
Year N B Size p female p f execs p f neds
1996 350 9.72 2.22 0.65 3.361997 350 9.75 2.64 1.18 3.381998 350 9.88 3.28 1.39 4.511999 350 9.67 3.42 1.48 4.252000 350 9.71 4.05 1.99 4.982001 350 9.76 4.32 2.04 5.512002 350 9.70 5.06 2.76 6.282003 350 9.85 5.74 2.77 7.272004 350 9.93 6.45 2.79 8.302005 350 9.74 6.90 3.13 8.552006 350 9.70 7.18 3.49 8.712007 350 9.25 7.48 3.09 9.492008 350 8.99 7.33 3.19 8.932009 350 8.82 7.30 3.17 8.682010 350 8.62 8.19 3.25 9.81
1. The FTSE350 is compiled by identifying the 350 companies listed on the London Stock Exchange(LSE) with the highest market capitalisation as at their financial year end. Consequently, thecomposition of FTSE350 varies from year to year.2. Data was not available for every company with years ending 2011, hence this year is omittedfrom the table above.
15

Table 2: Sample Statistics
Variable N Mean Median St. Dev. Min Max
Executive.Years
age 48226 50.37 50.24 7.46 35.75 73.97ceo 48226 0.27 0 0.45 0 1chair 48226 0.10 0 0.3 0 1fd 48226 0.24 0 0.43 0 1lntcc 48226 12.58 12.61 0.89 8.35 14.31lnTDCa 48226 12.78 12.76 1.01 8.37 14.91lnTDCr 48226 12.69 12.67 0.99 8.35 14.83‘remcochair 48226 0.01 0 0.08 0 1remcoserve 48226 0.06 0 0.23 0 1tenure 48226 5.64 3.81 5.63 0.08 27.23
Non-Executive.Years
age 67059 59.13 59.95 7.54 35.75 73.97lntcc 67059 10.41 10.38 0.84 8.35 14.31remcochair 67059 0.22 0 0.41 0 1remcoserve 67059 0.73 1 0.44 0 1tenure 67059 4.93 3.61 4.72 0.08 27.23
Company-Years Descriptives
bsize 13870 8.02 7 2.98 3 17lnptob 13870 0.51 0.44 0.94 -2.41 3.67lnsize 13870 11.5 11.62 2.46 4.66 16.83p female 13870 0.05 0 0.08 0 0.67p ind 13870 0.16 0.13 0.18 0 0.8p neds 13870 0.61 0.57 0.22 0 1roa 13870 0.03 0.05 0.14 -0.79 0.32roe 13870 0.05 0.09 0.4 -2.79 1.2tsr 13870 -0.01 0.07 0.54 -2.34 1.29volatility 13870 0.14 0.12 0.09 0 0.56
1. The sample comprises all executive and non-executive directors serving in companies listed onthe London Stock Exchange (with financial years ending between January 1995 and December 2011.2. All variables are winsorised at the 1% level.
16
Table 3: The impact of gender on director appointmentsAll Appointments Executive Appointments Non-Executive Appointments(1) (2) (3) (4) (5) (6)
l female nedexit 0.39*** 0.34*** 0.23 0.22 0.56*** 0.46***(9.32) (7.80) (1.60) (1.48) (9.05) (6.98)
l male nedexit -0.024** -0.045*** -0.022 -0.019 -0.022 -0.063***(-2.21) (-3.50) (-0.72) (-0.56) (-1.22) (-3.07)
l roa 0.018 0.033 0.059(0.11) (0.12) (0.28)
l tsr 0.063 0.14* 0.016(1.53) (1.93) (0.33)
l lnptob 0.015 -0.054 0.046(0.66) (-1.30) (1.64)
l lnsize 0.018 -0.060*** 0.038***(1.61) (-2.79) (2.88)
l bsize 0.030*** 0.048*** 0.020**(3.56) (3.22) (2.07)
l pneds 0.80*** 0.72*** 0.80***(6.96) (2.73) (5.80)
l pind -0.23* -0.47* -0.22(-1.82) (-1.83) (-1.50)
l volatility 0.28 -0.23 0.46*(1.34) (-0.57) (1.79)
Observations 9,023 8,959 3,563 3,531 5,460 5,428z-statistics in parentheses
*** p¡0.01, ** p¡0.05, * p¡0.1
Probit estimates of the impact of recent female exit and recent male exit, on theprobability that the gender of an appointment is female. Thus in the population ofdirector appointments, female takes the value 1 and male takes the value zero.Female (male) exit variables equal 1 if a female (male) director exited the companywithin the last 12 months from the appointment dateIn the case of executive appointments (columns 3 and 4), the female (male) exitvariables describe the exit of an executive director in the last 12 months. In thecase of non-executive appointments (columns 5 and 6) the exit variables describethe exit of a non-executive director in the last 12 months.
17

Table 4: Probabilities of the appointment being female implied by Table 3
Female Exit?No Yes
All Appointments
No Male Exit 0.082 0.136***Male Exit 0.075** 0.129***
Executive Appointments
No Male Exit 0.048 0.070Male Exit 0.046 0.068
Non-Executive Appointments
No Male Exit 0.106 0.190***Male Exit 0.095*** 0.179***
*** p<0.01, ** p<0.05, * p<0.1
The table describes the probability that a given appointment was female, by whethera recent female and/or male director left the company in the last 12 months.The probability that the appointment is female is derived from the average marginaleffects after the Probit estimates shown in Table 3. The average marginal effectswere calculated for median values of each of the control variable.Stars indicate statistical significance relative to the case of zero female exit and zeromale exit
18

Table 5: The gender pay gap: Executive directors(1) (2) (3) (4) (5) (6)pay1 pay2 pay3 payfe1 payfe2 payfe3
VARIABLES lntcc lnTDCa lnTDCr lntcc lnTDCa lnTDCr
female -0.22*** -0.20*** -0.23*** -0.034 -0.013 -0.030(-4.12) (-3.23) (-3.89) (-1.06) (-0.40) (-0.86)
ceo 0.54*** 0.58*** 0.54***(53.6) (53.8) (50.6)
chair 0.042** 0.0082 -0.0068(2.03) (0.37) (-0.31)
fd 0.030*** 0.059*** 0.030***(3.10) (5.93) (2.90)
age 0.100*** 0.10*** 0.10***(12.6) (13.0) (12.3)
agesq -0.0010*** -0.0010*** -0.0010***(-12.7) (-13.4) (-12.2)
tenure 0.011*** 0.0075*** 0.015***(10.5) (6.67) (12.7)
l w roa 0.064 0.010 0.22***(1.37) (0.18) (4.10)
w tsr 0.072*** 0.071*** 0.072***(7.38) (6.39) (6.54)
w lnptob -0.0042 -0.0047 0.038***(-0.42) (-0.37) (3.08)
l w lnsize 0.15*** 0.21*** 0.19***(12.4) (13.4) (13.4)
l w bsize 0.0030 -0.0025 -0.0032(0.88) (-0.55) (-0.79)
l w p neds 0.43*** 0.81*** 0.65***(7.01) (9.66) (8.43)
l w p ind 0.22*** 0.19*** 0.24***(4.21) (2.89) (3.75)
l w volatility 0.14*** 0.21*** 0.20***(2.81) (3.43) (3.28)
Firm FE No No No Yes Yes YesObservations 48,226 48,226 48,226 48,226 48,226 48,226R-squared 0.002 0.001 0.002 0.572 0.600 0.568
Robust t-statistics in parentheses*** p<0.01, ** p<0.05, * p<0.1
The table above estimates the gender pay gap across three different measures of pay. ‘TCC’ the cash componentsof remuneration received during the year, including salary, bonuses and perks. ‘TDCa’ adds to this measure theexpected value of share options and other equity awards granted during the year. ‘TDCr’ adds to TCC, the ex-postrealised value of share options and other equity awards exercised during the year. Each pay variable is defined in logsand therefore female captures the gender pay gap in percentage terms.Columns 1, 2 and 3 describe the raw difference in pay between female and male executive directors. Columns 4, 5and 6 describe the raw difference in pay fees arising from gender within companies.
19

Table 6: The gender pay gap: Non-executive directors(1) (2)ned1 ned3
VARIABLES lntcc lntcc
female -0.042* -0.084***(-1.93) (-5.75)
chair 0.86***(60.3)
remcochair -0.0044(-0.54)
remcoserve -0.017(-1.01)
age 0.064***(10.8)
agesq -0.00053***(-10.4)
tenure 0.0034***(3.22)
l w roa 0.063(1.46)
l w tsr 0.014*(1.81)
l w lnptob 0.019**(2.43)
l w lnsize 0.054***(7.06)
l w bsize 0.0081***(3.22)
l w p neds 0.20***(4.32)
l w p ind -0.17***(-5.69)
l w volatility 0.035(0.80)
Firm FE NO YESObservations 67,059 64,036R-squared 0.000 0.539Robust t-statistics in parentheses*** p<0.01, ** p<0.05, * p<0.1
Col (1) describes the raw difference in fees between female and male non-executivedirectorsCol (2) describes the difference in fees , within companies and controlling for therole of the non-executive.
20

Table 7: The impact of gender diversity in the boardroom on corporate performance(1) (2) (3) (4)
gmm1 gmm2 gmm3 gmm4VARIABLES w tsr w roa w roe w lnptob
L.w tsr -0.018(-1.04)
L.w roa 0.33***(12.1)
L.w roe 0.27***(10.4)
L.w lnptob 0.67***(28.0)
L.p female -0.053 -0.011 0.097 -0.018(-0.35) (-0.49) (1.15) (-0.096)
l w lnsize 0.013* 0.0073*** 0.020*** 0.031***(1.83) (3.67) (3.46) (3.38)
l w bsize -0.0052 -0.0013 -0.0041 -0.0042(-1.02) (-1.35) (-1.12) (-0.78)
l w p neds 0.25*** 0.027* 0.042 -0.031(2.90) (1.88) (0.87) (-0.36)
l w p ind -0.052 -0.013 -0.046 -0.10*(-0.93) (-1.27) (-1.52) (-1.79)
l w volatility -0.056 -0.013 -0.058 0.0052(-0.56) (-0.80) (-1.14) (0.052)
Observations 11,515 11,515 11,515 11,515Number of companyid 1,983 1,983 1,983 1,983
t-statistics in parentheses*** p<0.01, ** p<0.05, * p<0.1
The table above estimates the impact of the percentage of female directors on theboard, across four measures of corporate performance. Total Shareholder Return(TSR) captures the annual change in the log of the Datastream return index, cap-turing both capital growth in the company’s stock price and dividends. Return ofAssets (ROA) and Return on Equity (ROE) capture annual accounting performance.The natural log of the market to book ratio proxies Tobin’s Q, a forward lookingmeasure that indicates opportunities for future growth in the firm.The equations are estimated with GMM (xtabond2), treating the explanatory vari-ables as endogenous covariates. The two step version of the estimator is used, withWindmeijer (2005) corrected standard errors.Alternative specifications were explored, including estimation by ordinary leastsquares and firm fixed effects (within estimation). The absence of a statisticallysignificant impact of females on corporate performance was robust to these alterna-tive specifications. These estimates are available on request.
21

References
Adams, R. B. and D. Ferreira (2009). Women in the boardroom and their impact ongovernance and performance. The Journal of Financial Economics 94, 291–309.
Adams, S. M., A. Gupta, D. M. Haughton, and J. D. Leeth (2007). Gender differencesin ceo compensation: evidence from the USA. Women in Management Review 22 (3),208–224.
Ahern, K. R. and A. K. Dittmar (2012). The changing of the boards: The impacton firm valuation of mandated female board representation. Quarterly Journal ofEconomics 127 (1), 137–197.
Albrecht, J., A. Bjorklund, and S. Vroman (2003). Is there a glass ceiling in Sweden?The Journal of Labor Economics 21, 145–177.
Arellano, M. and S. Bond (1991). Some tests of specification for panal data: MonteCarlo evidence and an application to employment equations. Review of EconomicStudies 58, 277–298.
Arellano, M. and O. Bover (1995). Another look at the instrumental variable estimationof error-components models. Journal of Econometrics 68 (1), 29–51.
Arrow, K. (1972). Models of Job Discrimination. D. C. Heath.
Babcock, L. and S. Laschever (2003). Princeton N.J.: Princeton University Press.
Becker, G. S. (1957). The Economics of Discrimination. University of Chicago Press.
Blackaby, D., A. L. Booth, and J. Frank (2005). Outside offers and the gender pay gap.Economic Journal 115, 81–107.
Blundell, R. and S. Bond (1998). Initial conditions and moment restrictions in dynamicpanel data models. Journal of Econometrics 87 (1), 115–143.
Booth, A. L. (2009). Gender and competition. Labour Economics 16 (6), 599–606.
Bygren, M. and M. Ghler (2012). Family formation and men’s and women’s attainmentof workplace authority. Social Forces 90 (3), 795–816.
Conyon, M. and K. Murphy (2000). The prince and the pauper? CEO pay in theUnited States and United Kingdom. The Economic Journal 110, 640–671.
Conyon, M. J. (2011). Handbook on International Corporate Governance: CountryAnalyses, Chapter Compensation Committees and CEO Pay, pp. 297–316. EdwardElgar, Massachusetts.
Conyon, M. J., N. Fernandez, M. A. Ferreira, P. Matos, and K. Murphy (2010, May).The executive compensation controversy: A transatlantic analysis. Technical report,Fondazione Rodolfo Benedetti, Italy.
Davies, E. (2011). Women on boards an independent review into women on boards.Technical report, Department for Business Innovation and Skills BIS, London.
22

Demsetz, H. and K. Lehn (1985). The structure of corporate ownership: Causes andconsequences. The Journal of Political Economy 93 (6), 1155–1177.
Dezso, C. L. and D. Gaddis Ross (2012). Does female representation in top man-agement improve firm performance? a panel investigation. Strategic ManagementJournal 33 (12), forthcoming.
Doldor, E., S. Vinnicombe, M. Gaughan, and R. Sealy (2012). Gender diversity onboards: The appointment process and the role of executive search firms. Technicalreport, Equality and Human Rights Commission Research Report Series, Manchester.
Doyle, A. C. (1892, december). The adventure of silver blaze. The Strand Magazine.
E&HRC (2007). Sex and power. Technical report, Equalty and Human Rights Com-mission, Manchester.
Eisenhardt, K. M., J. L. Kahwajy, and L. J. Bourgeouis (1997). Conflict and strategicchoice: How top management teams disagree. California Management Review 39,42–62.
Elstad, B. and G. Ladegard (2012). Women and tokenism on corporate boards: Thecase of Norway. Technical report, Oslo University College, Oslo, Norway.
Erhardt, N. L., J. D. Werbel, and C. B. Shrader (2003). Board of director diversity andfirm financial performance. Corporate Governance 11 (2), 102–111.
European Union (2012). Women in economic decision-making in the EU: Progressreport. a Europe 2020 initiative. Technical report, European Union, CommissionStaff Working Document, Luxembourg: Publications Office of the European Union,2012.
Farrell, K. A. and P. L. Hersch (2005). Additions to corporate boards: the effect ofgender. Journal of Corporate Finance 11, 85–106.
Goodstein, J., K. Gautam, and W. Boeker (1994). The effect of board size and diversityon strategic change. Strategic Management Journal 15, 241–250.
Hallock, K. F. and M. Bertrand (2001). The gender gap in top corporate jobs. Industrialand Labor Relations Review 55 (1), 3–21.
Hillman, A. J., A. A. Cannella, and R. L. Paetzold (2000). The resource dependencerole of corporate directros: Strategic adaption of board composition in response toenvironmnetal change. Journal of Management Studies 37 (2), 235–255.
Joy, L., N. M. Carter, H. M. Wagener, and S. Narayanan (2007). The bottom line:Corporate performance and women’s representation on boards. Report, Catalyst.
Kanter, R. M. (1997). Men and Women of the Corporation. New York: Basic Books.
Larcker, D. F., S. A. Richardson, and A. I. Tuna (2007). Corporate governance, ac-counting outcomes and organizational performance. Accounting Review 82, 963–1008.
23

Lazear, E. P. and S. Rosen (1990). Male-female wage differentials in job ladders. Journalof Labor Economics 8 (1), 106–123.
Luckerath-Rovers, M. (2009). Female directors on corporate boards provide legitimacyto a company: A resource dependency perspective. Working paper, SSRN.
Main, B. G. M. (2006). The ABI guidelines for share-option based incentive schemes.setting the hurdle too high? Accounting and Business Research 36 (3), 191–205.
Main, B. G. M., C. Jackson, J. Pymn, and V. Wright (2008). The remuneration com-mittee and strategic human resource management. Corporate Governance: An In-ternational Review 16, 225–238.
Manning, A. (2003). Monopsony in motion. Princeton, NJ: Princeton University Press.
Marschke, R., S. Laursen, J. M. Nielsen, and P. Rankin (2007). Demographic intertiarevisited: An immodest proposal to achieve equitable gender representation amongfaculty in higher education. Journal of Higher Education 78 (1), 1–26.
Marshall, A. (1927). Industry and Trade. London: Macmillan.
McKinsey & Co. (2007). Women matter. gender diversity, a corporate performancedriver. Technical report, McKinsey & Company.
McKinsey & Co. (2008). Women matter. female leadership, a competitive edge for thefuture. Technical report, McKinsey & Company.
McKinsey & Co. (2010). Women matter. women at the top of corporations, making ithappen. Technical report, McKinsey & Company.
Miller, T. and M. del Carmen Triana (2009). Demographic diversity in the boardroom: Mediators of the board diversity-firm performance relationship. Journal ofManagement Studies 46 (5), 755–786.
Milliken, F. J. and L. L. Martins (1996). Searching for common threads: understandingthe multiple effects of diversity in organizational groups. Academy of ManagementReview 21, 402–433.
Mincer, J. and S. Polachek (1974). Family investment in human capital: Earnings ofwomen. Journal of Political Economy 82 (2), S76–S108.
Nielsen, S. and M. Huse (2010). The contribution of women on boards of directors:Going beyond the surface. Corporate Governance: An International Review 18, 136–148.
O’Reilly, C. A. and B. G. M. Main (2012). Women in the boardroom: Symbols orsubstance? Technical report, Stanford Graduate School of Business, Palo Alto,California.
Pau, S. L. and H. Sahni (2009). Women in top management and job self-selection. Tech-nical report, Paper delivered at Financial Management Association, Reno, Nevada.
24
Pepper, S. (2006). Senior Executive Reward: Key Models and Practices. Gower Pub-lishing Ltd.
Powell, G. N. and D. Butterfield (1994). Investigating the ‘glass ceiling’ phenomenon:An empirical study of actual promotions to top management. Academy of Manage-ment Journal 37, 68–86.
Ransom, M. R. and R. L. Oaxaca (2010, April). New market power models and sexdifferences in pay. Journal of Labor Economics 28 (2), 267–289.
Robinson, G. and K. Dechant (1997). Building the business case for diversity. Academyof Management Executive 11, 21–31.
Rohner, U. and B. Dougan (2012). Gender diversity and corporate performance. Tech-nical report, Credit Suisse Research Institute, Zurich.
Smith, N., V. Smith, and M. Verner (2006). Do women in top management affectfirm performance? a panel study of 2,500 Danish firms. International Journal ofProductivity and Performance Management 55 (7), 569–593.
Smith, N., V. Smith, and M. Verner (2010). Breaking through the glass ceiling? gen-der differences in promotion patterns into ceo and voce-director positions in danishcompanies. Technical report, Department of Economics, Aarhus School of Business,Denmark.
Teigen, A. S. M. (2010). Women on board. the norwegian experience. Technical report,Friedrich-Ebert-Stiftung International Policy Analysis, Berlin, Germany. available atwww.fes.de/ipa.
Terjesen, S., R. Sealy, and V. Singh (2009). Women directors on corporate boards: Areview and research agenda. Corporate Governance: An International Review 17 (3),320–337.
Torchia, M., A. Calabr, and M. Huse (2011). Women directors on corporate boards:From tokenism to critical mass. Journal of Business Ethics 102, 299–317.
Tyson, L. D. (2003, June). The Tyson Report on the recruitment and developmentof non-executive directors. a report commissioned by the Department of Trade &Industry following the publication of the Higgs Review. Technical report, LondonBusiness School.
van der Walt, N. and C. Ingley (2003). Board dynamics and the influence of professionalbackground, gender and ethnic diversity of directors. Corporate Governance 11, 218–234.
Westphal, J. D. (1999). Collaboration in the boardroom: behavioural and performanceconsequences of CEO-board social ties. Academy of Management Journal 42, 7–24.
Wilson, N. and A. R. Altanlar (2009). Director characteristics, gender balance andinsolvency risk: An empirical study. Technical report, Leeds University BusinessSchool.
25

Windmeijer, F. (2005). A finite sample correction for the variance of linear efficienttwo-step gmm estimators. Journal of Econometrics 126 (1), 25–51.
Zelechowski, D. and D. Bilimoria (2004). Characteristics of women and men corporateinside directors in the us. Corporate Governance: An International Review 12, 337–342.
26