Embed Size (px)
Citation preview
8/4/2019 Egypt Economic Report 2010
http://slidepdf.com/reader/full/egypt-economic-report-2010 1/20
8/4/2019 Egypt Economic Report 2010
http://slidepdf.com/reader/full/egypt-economic-report-2010 2/20
E g y p t : A
V a l u e d
I n v e s
t m e n t
2
Case in Brief ............... .................. ................. .................. ................. .................. .................. .... 3
Pillars of Growth ..............................................................................................................4
Imprving Plitical and Legislative Landscape ................................................... 4
Increased Gvernment Spending .............................................................................. 4
Demgraphics ................................................................................................................. . 5
Gegraphical Lcatin .................................................................................................. 6
A Highl Slvent Financial Sstem ............................................................................ 7
Access t Energ ............................................................................................................. . 8
Natural Gas Prductin in Egpt............................................................................... 8
Electricit Generatin in Egpt .................................................................................. 8
Economic Snapshot .......................................................................................................9Growth Industries ......................................................................................................... 11
Telecms ............................................................................................................................ 11
Electrnics, Dmestic Appliances and Fast-Mving Cnsumer Gds.......... 11
Banking and Financial Services ................................................................................ 12
Middle Incme Real Estate .......................................................................................... 13
Auts ................................................................................................................... ................ 13
Agriculture ........................................................................................................................ 14
Infrastructure .................................................................................................................. 15
Lgistics ............................................................................................................................ 16
Building Materials (Cement, Steel, & Paint) .......................................................... 16
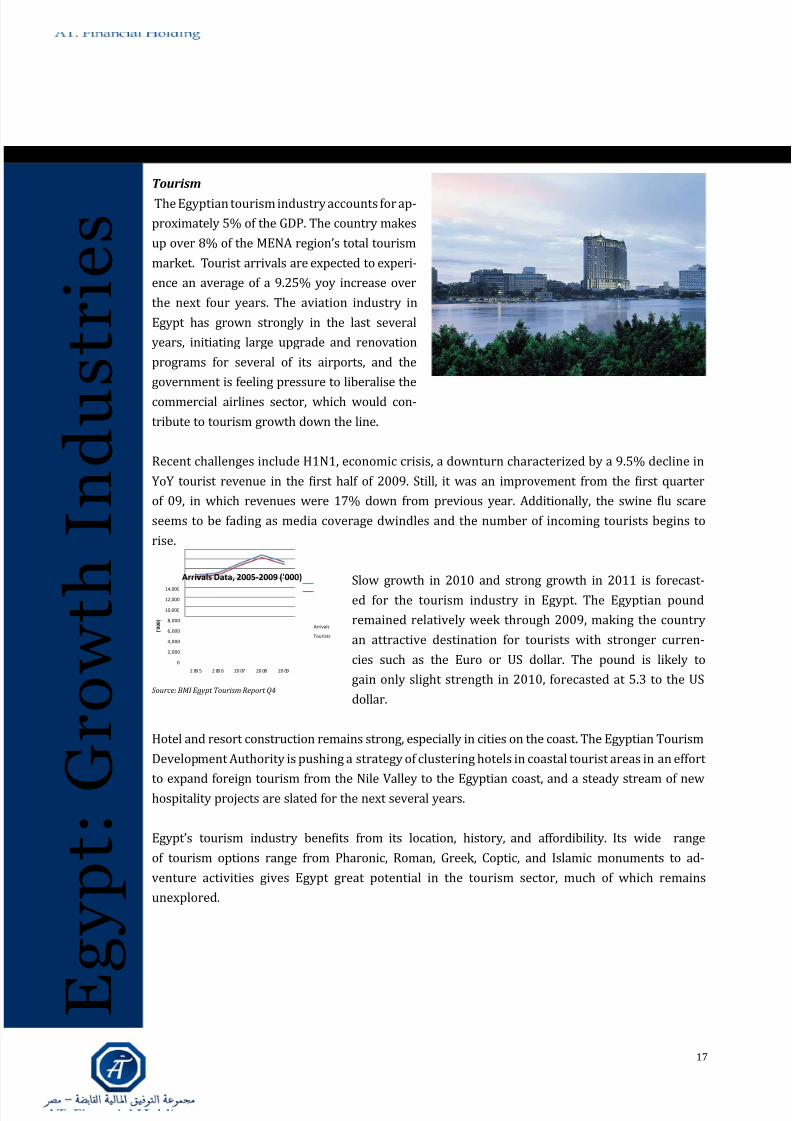
Turism .............................................................................................................................. 17
Egyptian Stock Market Overview ....................................................................... 18
Comparison of World Markets to Egypt ...................................................... 18
Stocks to Watch .................. ................. .................. ................. .................. .................. .......... 19
Contents
8/4/2019 Egypt Economic Report 2010
http://slidepdf.com/reader/full/egypt-economic-report-2010 3/20
E g y p t : A
V a l u e d
I n v e s
t m e n t
3
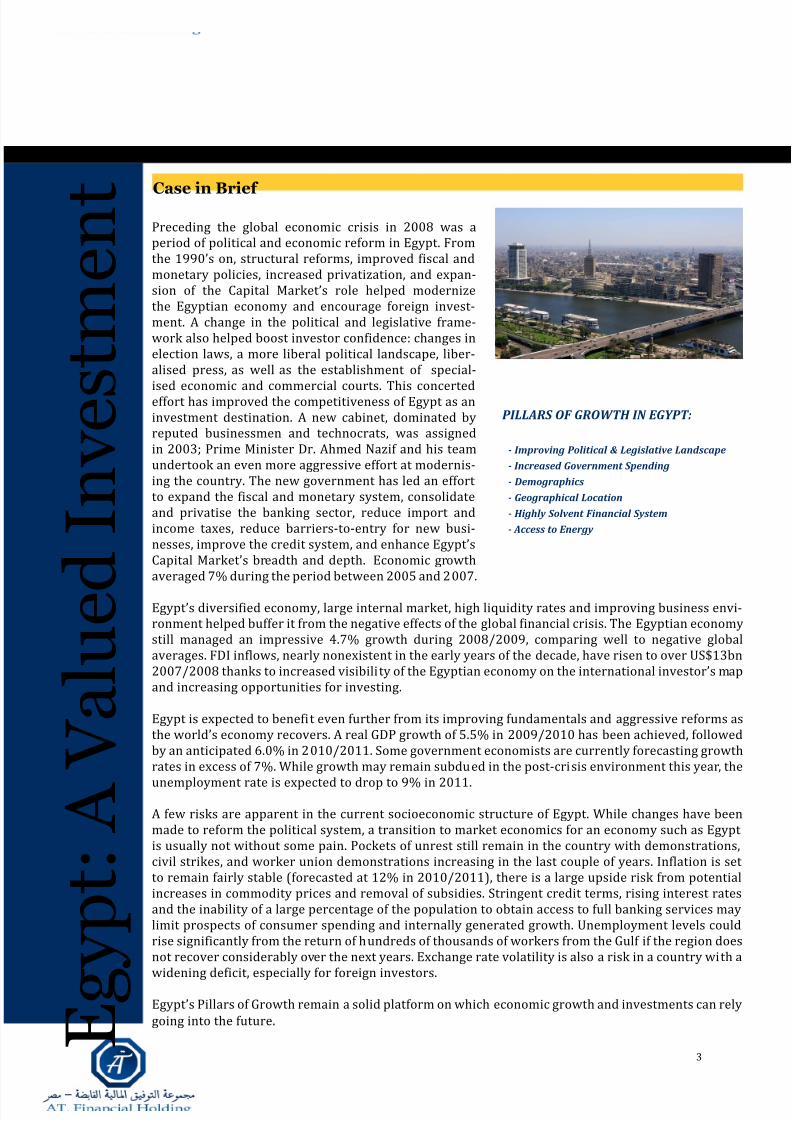
Preceding the global economic crisis in 2008 was aperiod of political and economic reform in Egypt. Fromthe 1990’s on, structural reforms, improved fiscal andmonetary policies, increased privatization, and expan-sion of the Capital Market’s role helped modernizethe Egyptian economy and encourage foreign invest-ment. A change in the political and legislative frame-work also helped boost investor confidence: changes inelection laws, a more liberal political landscape, liber-alised press, as well as the establishment of special-
ised economic and commercial courts. This concertedeffort has improved the competitiveness of Egypt as aninvestment destination. A new cabinet, dominated byreputed businessmen and technocrats, was assignedin 2003; Prime Minister Dr. Ahmed Nazif and his teamundertook an even more aggressive effort at modernis-ing the country. The new government has led an effort to expand the fiscal and monetary system, consolidateand privatise the banking sector, reduce import andincome taxes, reduce barriers-to-entry for new busi-nesses, improve the credit system, and enhance Egypt’sCapital Market’s breadth and depth. Economic growthaveraged 7% during the period between 2005 and 2007.
Egypt’s diversified economy, large internal market, high liquidity rates and improving business envi-ronment helped buffer it from the negative effects of the global financial crisis. The Egyptian economystill managed an impressive 4.7% growth during 2008/2009, comparing well to negative globalaverages. FDI inflows, nearly nonexistent in the early years of the decade, have risen to over US$13bn2007/2008 thanks to increased visibility of the Egyptian economy on the international investor’s mapand increasing opportunities for investing.
Egypt is expected to benefit even further from its improving fundamentals and aggressive reforms asthe world’s economy recovers. A real GDP growth of 5.5% in 2009/2010 has been achieved, followedby an anticipated 6.0% in 2010/2011. Some government economists are currently forecasting growthrates in excess of 7%. While growth may remain subdued in the post-crisis environment this year, the
unemployment rate is expected to drop to 9% in 2011.
A few risks are apparent in the current socioeconomic structure of Egypt. While changes have beenmade to reform the political system, a transition to market economics for an economy such as Egypt is usually not without some pain. Pockets of unrest still remain in the country with demonstrations,civil strikes, and worker union demonstrations increasing in the last couple of years. Inflation is set to remain fairly stable (forecasted at 12% in 2010/2011), there is a large upside risk from potentialincreases in commodity prices and removal of subsidies. Stringent credit terms, rising interest ratesand the inability of a large percentage of the population to obtain access to full banking services maylimit prospects of consumer spending and internally generated growth. Unemployment levels couldrise significantly from the return of hundreds of thousands of workers from the Gulf if the region doesnot recover considerably over the next years. Exchange rate volatility is also a risk in a country with awidening deficit, especially for foreign investors.
Egypt’s Pillars of Growth remain a solid platform on which economic growth and investments can rely
going into the future.
Case in Brief
PILLARS oF GRowTH IN EGyPT:
- Imprving Plitical & Legislative Landscape
- Increased Gvernment Spending
- Demgraphics
- Gegraphical Lcatin
- Highl Slvent Financial Sstem
- Access t Energ
8/4/2019 Egypt Economic Report 2010
http://slidepdf.com/reader/full/egypt-economic-report-2010 4/20
E g y p t : A
V a l u e d
I n v e s
t m e n t
4
Pillars of Growth
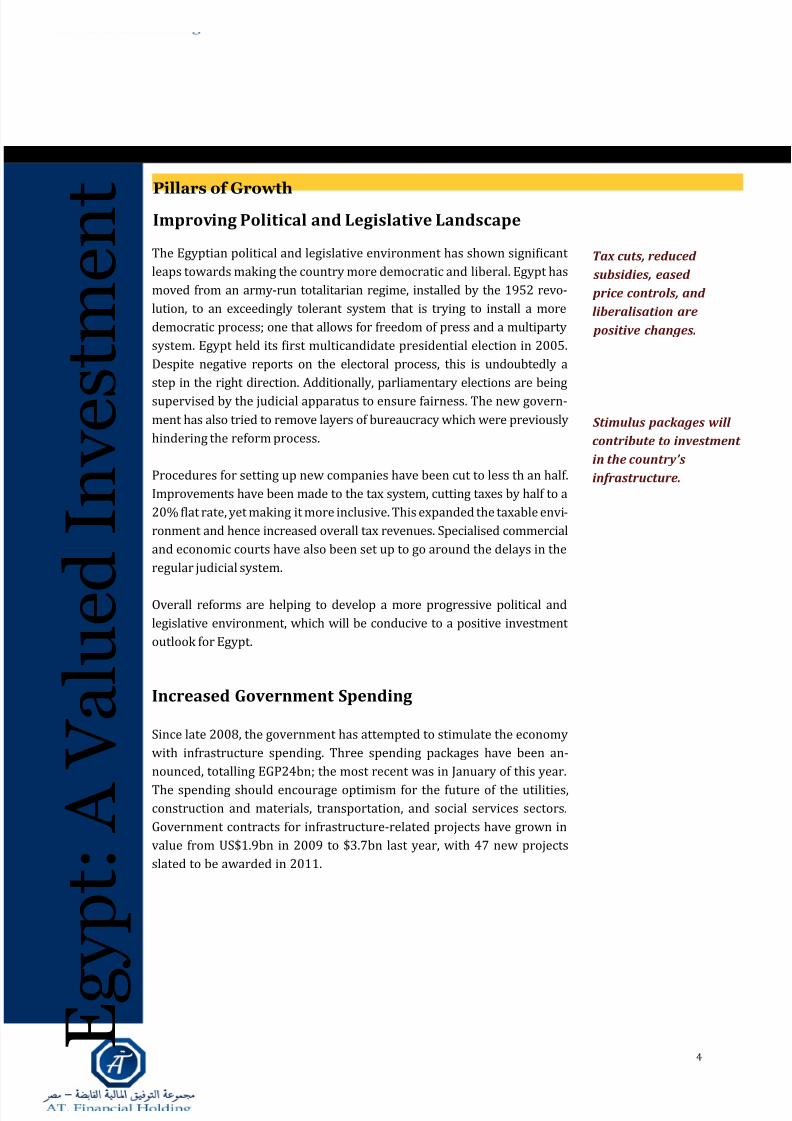
The Egyptian political and legislative environment has shown signiicant
leaps towards making the country more democratic and liberal. Egypt has
moved from an army-run totalitarian regime, installed by the 1952 revo-
lution, to an exceedingly tolerant system that is trying to install a more
democratic process; one that allows for freedom of press and a multiparty
system. Egypt held its irst multicandidate presidential election in 2005.
Despite negative reports on the electoral process, this is undoubtedly a
step in the right direction. Additionally, parliamentary elections are being
supervised by the judicial apparatus to ensure fairness. The new govern-
ment has also tried to remove layers of bureaucracy which were previously
hindering the reform process.
Procedures for setting up new companies have been cut to less th an half.
Improvements have been made to the tax system, cutting taxes by half to a
20% lat rate, yet making it more inclusive. This expanded the taxable envi-
ronment and hence increased overall tax revenues. Specialised commercial
and economic courts have also been set up to go around the delays in the
regular judicial system.
Overall reforms are helping to develop a more progressive political and
legislative environment, which will be conducive to a positive investment
outlook for Egypt.
Increased Government Spending
Since late 2008, the government has attempted to stimulate the economy
with infrastructure spending. Three spending packages have been an-
nounced, totalling EGP24bn; the most recent was in January of this year.
The spending should encourage optimism for the future of the utilities,
construction and materials, transportation, and social services sectors.
Government contracts for infrastructure-related projects have grown in
value from US$1.9bn in 2009 to $3.7bn last year, with 47 new projects
slated to be awarded in 2011.
Improving Political and Legislative Landscape
Tax cuts, reduced
subsidies, eased
price cntrls, and
liberalisatin are
psitive changes.
Stimulus packages ill
cntribute t investment
in the cuntr’s
infrastructure.
8/4/2019 Egypt Economic Report 2010
http://slidepdf.com/reader/full/egypt-economic-report-2010 5/20
E g y p t : A
V a l u e d
I n v e s
t m e n t
5
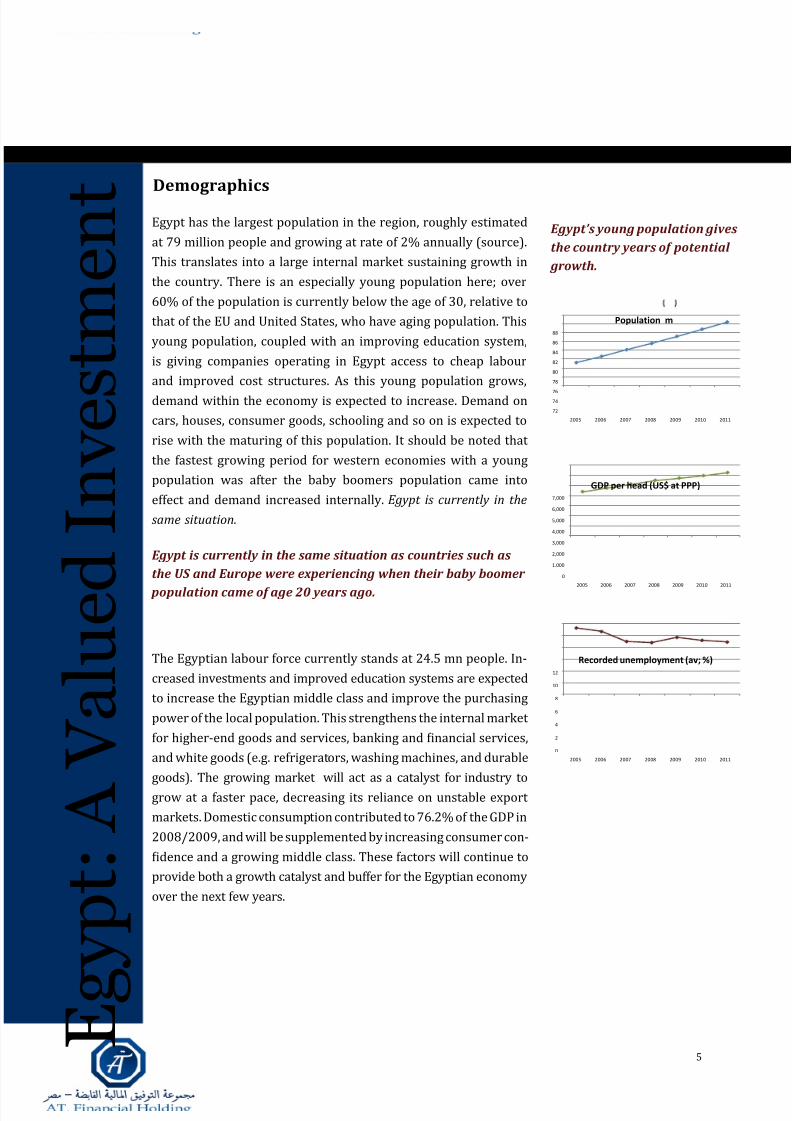
Demographics
Egypt has the largest population in the region, roughly estimated
at 79 million people and growing at rate of 2% annually (source).
This translates into a large internal market sustaining growth in
the country. There is an especially young population here; over
60% of the population is currently below the age of 30, relative to
that of the EU and United States, who have aging population. This
young population, coupled with an improving education system,
is giving companies operating in Egypt access to cheap labour
and improved cost structures. As this young population grows,
demand within the economy is expected to increase. Demand on
cars, houses, consumer goods, schooling and so on is expected to
rise with the maturing of this population. It should be noted that
the fastest growing period for western economies with a young
population was after the baby boomers population came into
effect and demand increased internally. Egypt is currently in the
same situation.
The Egyptian labour force currently stands at 24.5 mn people. In-
creased investments and improved education systems are expected
to increase the Egyptian middle class and improve the purchasing
power of the local population. This strengthens the internal market
for higher-end goods and services, banking and inancial services,
and white goods (e.g. refrigerators, washing machines, and durable
goods). The growing market will act as a catalyst for industry to
grow at a faster pace, decreasing its reliance on unstable export
markets. Domestic consumption contributed to 76.2% of the GDP in
2008/2009, and will be supplemented by increasing consumer con-
idence and a growing middle class. These factors will continue to
provide both a growth catalyst and buffer for the Egyptian economy
over the next few years.
0
2
4
6
8
10
12
2005 2006 2007 2008 2009 2010 2011
Recorded unemployment (av; %)
0
1,000
2,000
3,000
4,000
5,000
6,000
7,000
2005 2006 2007 2008 2009 2010 2011
GDP per head (US$ at PPP)
72
74
76
78
80
82
84
86
88
2005 2006 2007 2008 2009 2010 2011
Population m
Egpt’s ung ppulatin gives
the cuntr ears f ptential
grth.
Egpt is currentl in the same situatin as cuntries such as
the US and Eurpe ere experiencing hen their bab bmer
ppulatin came f age 20 ears ag.
8/4/2019 Egypt Economic Report 2010
http://slidepdf.com/reader/full/egypt-economic-report-2010 6/20
E g y p t : A
V a l u e d
I n v e s
t m e n t
6
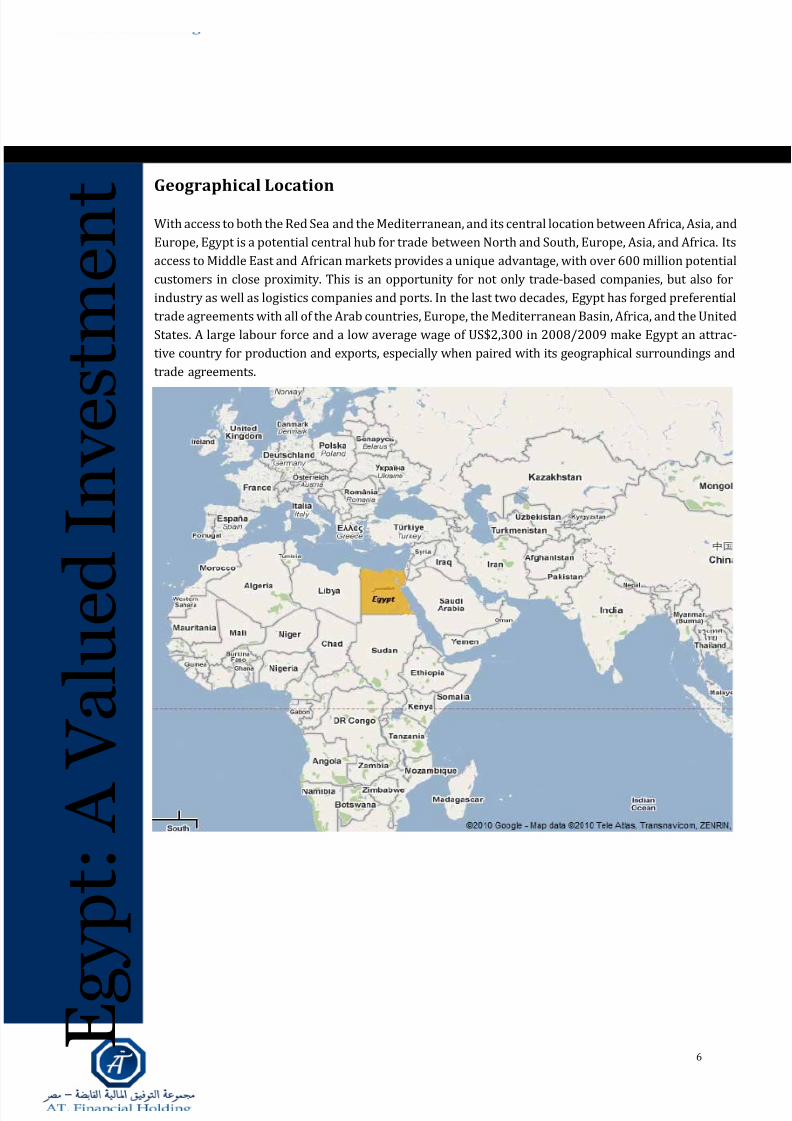
Geographical Location
With access to both the Red Sea and the Mediterranean, and its central location between Africa, Asia, and
Europe, Egypt is a potential central hub for trade between North and South, Europe, Asia, and Africa. Its
access to Middle East and African markets provides a unique advantage, with over 600 million potential
customers in close proximity. This is an opportunity for not only trade-based companies, but also for
industry as well as logistics companies and ports. In the last two decades, Egypt has forged preferential
trade agreements with all of the Arab countries, Europe, the Mediterranean Basin, Africa, and the United
States. A large labour force and a low average wage of US$2,300 in 2008/2009 make Egypt an attrac-
tive country for production and exports, especially when paired with its geographical surroundings and
trade agreements.

8/4/2019 Egypt Economic Report 2010
http://slidepdf.com/reader/full/egypt-economic-report-2010 7/20
E g y p t : A
V a l u e d
I n v e s
t m e n t
7
A Highly Solvent Financial System
After 2003 and the appointment of Prime Minister Ahmed Nazif, a reform process was initiated to mod-
ernize the economy. One of the outcomes of the new policy was the consolidation and privatization of the
banking sector, which reduced the number of banks from 57 to 34 from 2004-2007. The remaining banks
had stronger inancials, and contributed to the low loan-to-deposit ratios and high liquidity. An example of
a successful privatization can be found in the National Bank of Alexandria, which was sold to Italy’s Intesa
San Paolo in 2006. Private banks in Egypt have shown a clear commitment to improving their infrastruc-
ture and focusing efforts on brand development. A number of foreign banks have also bought into Egypt’s
growth story with names such as HSBC, Barclays, Credit Agricole, and Piraeus opening up to the Egyptian
public.
The liquidity in the inancial system will provide the grease for the engine that is the Egyptian
ecnm.
Increased competition amongst banks and the high liquidity in
the system are upping the pressure on banks to soften credit
terms and increase the universe they cover. The increased
money supply should stimulate demand within the economy
and give industry better access to growth inance.
Another area that has shown signiicant improvement is the
insurance sector. Increased competition and forcing insurance
companies to provide better coverage, especially to industry,
has been a positive change for the sector
A more active capital market has also allowed for a larger
presence of complex inancial structures to allow companies
access to better, cheaper sources of funding.
We see the solvent inancial system as an important compo-
nent of a growth economy with cheap access to credit, fuelingboth domestic consumption and industry growth.
0
100000
200000
300000
400000
500000
600000
700000
800000
900000
2004 2005 2006 2007 2008 2009
L E M i l l i o n
Domestic Liquidity
Domestic Liquidity
(1+2)(M2)
0
20000
40000
60000
80000
100000
120000
140000
160000
180000
200000
2004 2005 2006 2007 2008 2009
L E M i l l o n s
Money Supply
Money Supply (1) (M1)
Currency in circulation
outside the banking
system
Demand deposits in
local currency

8/4/2019 Egypt Economic Report 2010
http://slidepdf.com/reader/full/egypt-economic-report-2010 8/20
E g y p t : A
V a l u e d
I n v e s
t m e n t
8
Access to Energy
Egypt is in the fortunate position of being able to produce oil,
natural gas, and hydroelectricity; this allows for providing Egyptian
companies with relatively cheaper energy. This diversiication in
energy sources will contribute to future stability in energy supply
as demand increases.
The Middle East region was the only region last year to see above-
average growth of natural gas consumption. This growth can be
attributed to strong domestic consumption among energy-export-
ing nations and rapidly increasing trade between the Middle East
regions.
As Egyptian oil consumption and production have dropped over the
last decade, natural gas reserves have grown steadily since the end of
the 80’s to reach a market share of 1.2% by 2008. 0.33 (trillion cubic
metres) to 2.17 (‘88-‘ 08).
The High Dam in Aswan is a main source of hydroelectricity. This
dam, which began power generation in 1967, powers twelve gen-
erators each rated at 175 megawatts and produces a hydroelectric
output of 2.1 gigawatts. When the dam irst reached peak output it
produced around half of Egypt’s entire electricity production. Now,
the dam still provides slightly over 12% of energy production after
some of the production needs have covered by new thermal plants
in Egypt.
Egypt’s warm weather also provide opportunities for companies
to take advantage of solar energy and wind generated energy. The
access to two seas has also encouraged some international players to
experiment with producing energy from Algae and other alternative
sources.
The Egyptian government is also embarking on an ambitious plan to
produce 20% of Egyptian energy needs from cheap nuclear technol-
ogy by 2020.
The Egyptian energy sector offers some attractive investment oppor-
tunities. The diversiication of energy sources and access to cheap
energy gives an extra competitive advantage to the Egyptian industry
in general.
Natural gas reserves have
grn steadil since the end
f the 80’s t reach a market
share f 1.2% b 2008.
Cnsumptin f natural gas has increased frm 13.7bn cubic
metres in ’98 t 40.9bn fr a market share f 1.3% .Source: U.S. Energy Information Administration,
Source: U.S. Energy Information Administration
Natural Gas Prductin
Electricit Generatin
8/4/2019 Egypt Economic Report 2010
http://slidepdf.com/reader/full/egypt-economic-report-2010 9/20
E g y p t : G
r o w t h
I n d u s t r i e s
9
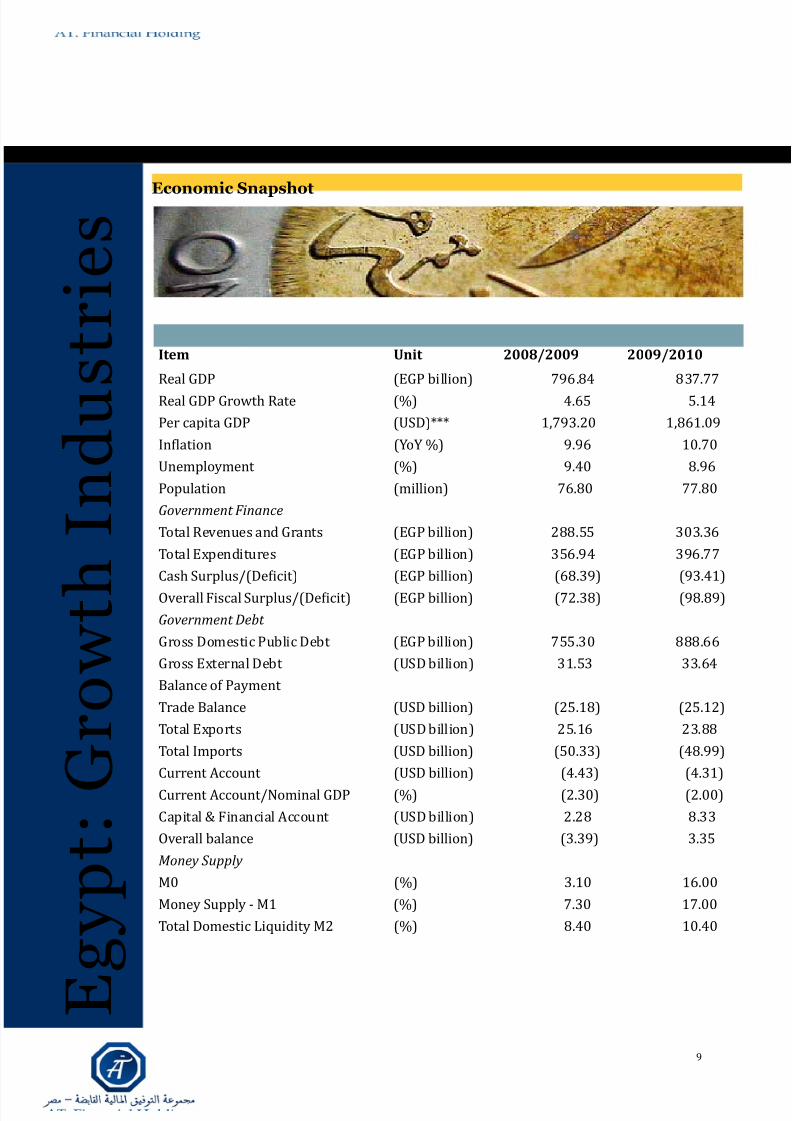
Economic Snapshot
Item Unit 2008/2009 2009/2010
Real GDP (EGP billion) 796.84 837.77
Real GDP Growth Rate (%) 4.65 5.14
Per capita GDP (USD)*** 1,793.20 1,861.09
Inlation (YoY %) 9.96 10.70
Unemployment (%) 9.40 8.96
Population (million) 76.80 77.80
Government Finance
Total Revenues and Grants (EGP billion) 288.55 303.36
Total Expenditures (EGP billion) 356.94 396.77
Cash Surplus/(Deicit) (EGP billion) (68.39) (93.41)
Overall Fiscal Surplus/(Deicit) (EGP billion) (72.38) (98.89)
Government Debt
Gross Domestic Public Debt (EGP billion) 755.30 888.66
Gross External Debt (USD billion) 31.53 33.64
Balance of Payment
Trade Balance (USD billion) (25.18) (25.12)
Total Exports (USD billion) 25.16 23.88
Total Imports (USD billion) (50.33) (48.99)
Current Account (USD billion) (4.43) (4.31)
Current Account/Nominal GDP (%) (2.30) (2.00)
Capital & Financial Account (USD billion) 2.28 8.33
Overall balance (USD billion) (3.39) 3.35
Money Supply
M0 (%) 3.10 16.00
Money Supply - M1 (%) 7.30 17.00
Total Domestic Liquidity M2 (%) 8.40 10.40
8/4/2019 Egypt Economic Report 2010
http://slidepdf.com/reader/full/egypt-economic-report-2010 10/20
E g y p t : G
r o w t h
I n d u s t r i e s
10
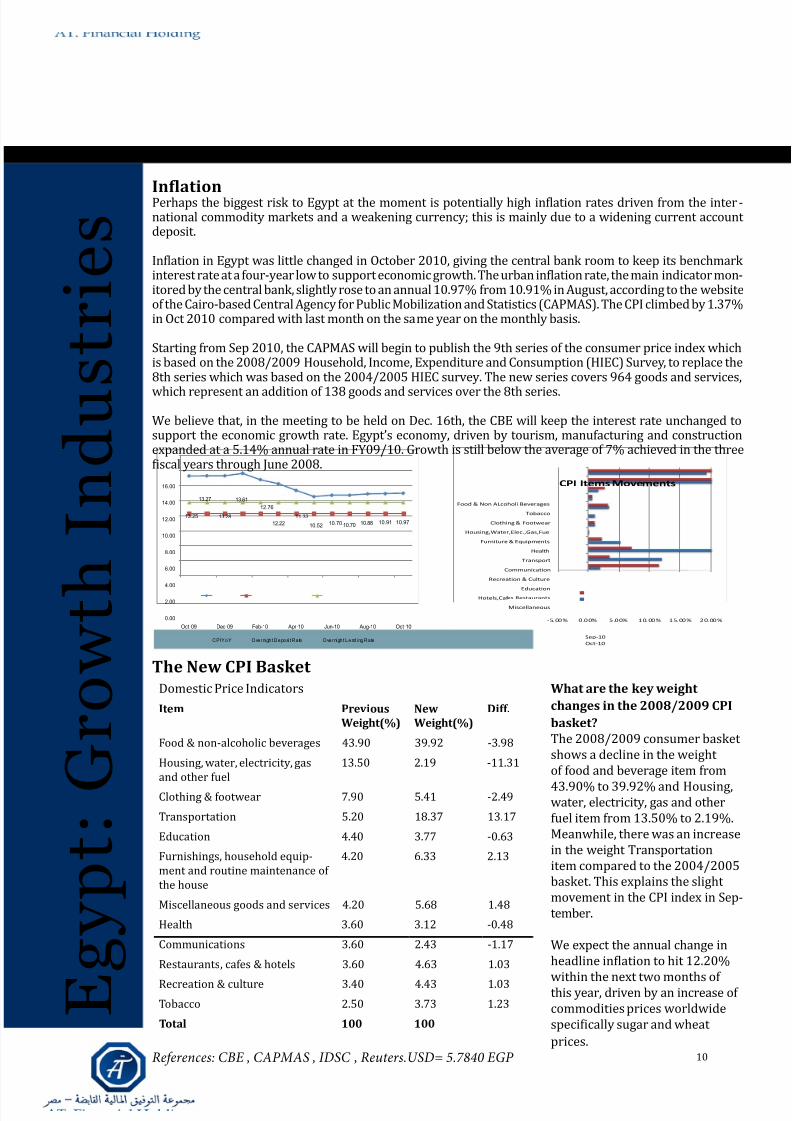
InflationPerhaps the biggest risk to Egypt at the moment is potentially high inlation rates driven from the inter -national commodity markets and a weakening currency; this is mainly due to a widening current account deposit.
Inlation in Egypt was little changed in October 2010, giving the central bank room to keep its benchmark interest rate at a four-year low to support economic growth. The urban inlation rate, the main indicator mon-itored by the central bank, slightly rose to an annual 10.97% from 10.91% in August, according to the websiteof the Cairo-based Central Agency for Public Mobilization and Statistics (CAPMAS). The CPI climbed by 1.37%in Oct 2010 compared with last month on the same year on the monthly basis.
Starting from Sep 2010, the CAPMAS will begin to publish the 9th series of the consumer price index whichis based on the 2008/2009 Household, Income, Expenditure and Consumption (HIEC) Survey, to replace the8th series which was based on the 2004/2005 HIEC survey. The new series covers 964 goods and services,
which represent an addition of 138 goods and services over the 8th series.
We believe that, in the meeting to be held on Dec. 16th, the CBE will keep the interest rate unchanged tosupport the economic growth rate. Egypt’s economy, driven by tourism, manufacturing and constructionexpanded at a 5.14% annual rate in FY09/10. Growth is still below the average of 7% achieved in the threeiscal years through June 2008.
13.25
13.27
13.28
13.61
12.76
12.22
11.33
10.52 10.70 10.70 10.88 10.91 10.97
0.00
2.00
4.00
6.00
8.00
10.00
12.00
14.00
16.00
Oct-09 Dec-09 Feb-10 Apr-10 Jun-10 Aug-10 Oct-10
CPI YoY Overnight Deposi t Rate Overnight Lending Rate
-5.00% 0.00% 5.00% 10.00% 15.00% 20.00%
Miscellaneous
Hotels,Cafes Restaurants
Education
Recreation & Culture
Communication
Transport
Health
Furniture & Equipments
Housing,Water,Elec.,Gas,Fuel
Clothing & Footwear
Tobacco
Food & Non ALcoholi Beverages
CPI Items Movements
Sep-10
Oct-10
What are the key weight
changes in the 2008/2009 CPI
basket?
The 2008/2009 consumer basket shows a decline in the weight of food and beverage item from
43.90% to 39.92% and Housing,water, electricity, gas and otherfuel item from 13.50% to 2.19%.Meanwhile, there was an increasein the weight Transportationitem compared to the 2004/2005basket. This explains the slight movement in the CPI index in Sep-tember.
We expect the annual change inheadline inlation to hit 12.20%
within the next two months of this year, driven by an increase of commodities prices worldwidespeciically sugar and wheat
prices.
The New CPI Basket
Domestic Price Indicators
Item Previous
Weight(%)
New
Weight(%)
Diff.
Food & non-alcoholic beverages 43.90 39.92 -3.98
Housing, water, electricity, gasand other fuel
13.50 2.19 -11.31
Clothing & footwear 7.90 5.41 -2.49
Transportation 5.20 18.37 13.17
Education 4.40 3.77 -0.63
Furnishings, household equip-ment and routine maintenance of the house
4.20 6.33 2.13
Miscellaneous goods and services 4.20 5.68 1.48
Health 3.60 3.12 -0.48
Communications 3.60 2.43 -1.17
Restaurants, cafes & hotels 3.60 4.63 1.03
Recreation & culture 3.40 4.43 1.03
Tobacco 2.50 3.73 1.23
Total 100 100
References: CBE , CAPMAS , IDSC , Reuters.USD= 5.7840 EGP
8/4/2019 Egypt Economic Report 2010
http://slidepdf.com/reader/full/egypt-economic-report-2010 11/20
E g y p t : G
r o w t h
I n d u s t r i e s
11
Telecms
Telecoms in Egypt have been doing particularly over the last decade. Public and private investmentsin improving the technology infrastructure are paying off. The country boasted 5.9 million new mobilesubscribers in the irst half of 2009, with internet subscribers increasing by more than twofold duringthe same period. The country has become a hub for outsourcing and improving telecoms outreach andinternet access in a fast-growing market.
Mobinil and Vodafone are the leading mobile operators in Egypt, both of which held control of the entiremarket until the introduction of Etisalat Misr in 2007. The low level of market penetration rate, especiallyin rural areas, speaks to the opportunity for quite a bit of growth; along with this are increased oppor-tunities in 3rd generation & smart phone services. Internet banking may also be an increased opportu-
nity for the sector. ARPU remains higher than the rest of Africa and comparable to the rest of the MiddleEast.
As for the ixed-line market, Telecom Egypt still dominates as the only land line provider as of today. Un-fortunately, this market lost 1.9 million subscribers in 2009, most likely caused by the growing mobilemarket. As a whole, the ixed-line market is still healthy, but does not allow for competition from alterna -tive operators as of today. Since Telecom Egypt’s initial public offering in 2005, 20% of its shares havebeen free loat. In early March 2010, Communications Minister Tarek Kamel announced a possible sale of new stake in Telecom Egypt within the next two years. It is expected that the government may also issuea second ixed-line license within the next ive years. The government has also allowed bids on limitedlicenses within gated communities as a irst step.
Broadband internet service is a growing sector with a penetration rate of just 1.2%. This is expected tomore than double in the next three years. Telecom Egypt’s services are increasing in market share, usingADSL as the primary form of internet service. In the future, more competition in this market may drivedown prices and fuel growth in the broadband sector. Internet penetration is still lower in rural areas thanin urban areas; government programmes such as a computer for every household may help solve this andincrease the level of penetration.
Overall, the sector provides for relatively stable cash lows, even if with limited growth compared toprevious years.
Electrnics, Dmestic Appliances and Fast-Mving Cnsumer Gds
Consumer electronics is a rising market with major growth potential in Egypt. Because of the youth and
expansion of the population, the demand for electronics will continue to rise. The leading products in theconsumer electronics market include mobile handsets, computers, and AV devices. Worth approximatelyUS$2.65bn in 2008, this market is forecasted to grow to US$4.63bn by 2013.
The same factors apply to the domestic appliance market. As the young Egyptian population matures andmoves into larger homes, they will increase the demand for long-lasting household items such as washingmachines, heating units, and refrigeration equipment. In 2007 the white goods market stood at 5.3 billionwith a 14% CAGR. The industry also gets government subsidies for exports.
The fast-moving consumer goods market also beneits from the rising population number. Complement -ing this factor is a reduction in import taxes, which not only diminishes the burden on manufactures but makes it easier for them to bring new, affordable products to market. Still, a considerable challenge to this
industry lies in Egypt’s inhibitive regulatory environment as well as tariffs that act as a barrier to entry tointernational brands. Still, the future looks promising as food consumption is expected to rise, and plentyof room exists for development in the consumer goods market.
Growth Industries

8/4/2019 Egypt Economic Report 2010
http://slidepdf.com/reader/full/egypt-economic-report-2010 12/20
E g y p t : G
r o w t h
I n d u s t r i e s
12
Banking and Financial Services
Banking in Egypt presents an impressive growth opportunity. While considered a large sector, there
is a largely untapped pool of resources in the middle-class retail community and the small and micro
enterprises.
Egypt’s high liquidity levels helped the country to weather the recent inancial crisis, allowing to fare
rather well compared to its global counterparts.
An effort by the government has resulted in the gradual privatisation of the banking system in Egypt.
These private banks are focusing more heavily on marketing efforts, branding, and improving banking
operations; these changes in the sector are attractive to foreign investors and favourable to new bankingcustomers in Egypt.
Foreign investors have the ability to inject capital into the newly reformed banking sector. As privatisation
increases and improvements continue, foreign investments will increase as well.
Several opportunities exist for the banking sector in Egypt. First, Egyptian banks have one of the lowest
loan-to-deposit ratio, giving fuel to fund the growing economy. Second, banks in Egypt were acting only
as loan and deposit institutions, hence expansion in fee-based value added services is still a big oppor-
tunity. Third, the young population will gradually mature and ind the need for personal banking, loans,
and investment services from Egyptian banks. Third, as smaller banks are consolidated and larger, well-
regulated banks remain, the sector as a whole will continue to improve. Lastly, SME’s, which account forapproximately 80% of the Egyptian private sector, have a need for banking services. As the economy con-
tinues to open up, there will be a demand for more sophisticated services.
Return on Equity is also considered high compared to global and regional peers, currently above 22% on
average.
The Egyptian banking sector seems to hold one of the golden keys to the growth of the economy, with high
potential growth rates, higher than average ROEs, high liquidity, and ample investment opportunities to
fuel its imminent growth.

8/4/2019 Egypt Economic Report 2010
http://slidepdf.com/reader/full/egypt-economic-report-2010 13/20
E g y p t : G
r o w t h
I n d u s t r i e s
13
Middle Incme Real Estate
The relatively expanding young population and middle class is giving rise to more demand on middle
income real estate. More young people means more houses in demand. Currently, there is a large over-
supply of upper-end housing in Egypt, while the low-end housing market is undersupplied by 40,000 units
per year. This gap in middle-class demand and supply is expected to be an opportunity for companies
working on this sector for years to come. By 2025 urban dwellers are expected to reach 83%- 79 million
people. To accommodate this demand, the government plans to increase the number of cities in Egypt from
17 to 59 by the end of 2017.
Right now, home sales are still considered to be volatile in the aftermath of the global crisis. Some de-
velopment companies are seeking alternative investments, such as those in hospitality projects, toinsure a steadier income. However, the long-term potential for the residential housing market is
huge.
In January 2010, the government introduced a new stimulus package, which included EGP 300 million
(US$55 million) for housing projects and EGP 500 million (US$91.65 million) for developing land near
suburban areas.
The current state of the real estate industry holds potential for companies targeting this sector and their
feeding industries.
Auts
In regards to size of industry, Egypt comes in at seventh in the
region, with great growth potential. The government has been
working to reduce the tariff barriers and modernize the market, as
to allow the industry to expand more freely.
With only a handful of local Egyptian auto brands, there are many opportunities for new manufacturers to
enter the market. While further trade liberalisation is needed, Egypt has been moving in the right direc-
tion. In the future, high sales tax and affordability for consumers
will be key obstacles to overcome in the auto industry. However, as
the young population matures, they will be a contributing factor in
the increased demand for automobiles. Furthermore, while salestaxes may be high for local autos, the extra costs of importing a
vehicle can cost nearly twice as much as the price of the product
itself, making Egyptian cars more affordable to the middle class.
After a dificult irst half of 2009 (following the economic crisis),
the Egyptian auto industry is forecasted to perform well over the
next several years, experiencing a steady increase in sales and beneitting from additional changes to the
external trade tariff structure along with an increase in consumer demand.
0
5
10
15
20
25
20 07 2 00 8e 20 09 f 20 10 f 2 011 f 2 012 f 2 01 3f
Total Sales (US$bn)
0.95
1
1.05
1.1
1.15
1.2
1.25
1.3
200 7 200 8e 200 9f 20 10 f 201 1f 20 12 f 201 3f
Contribution to GDP (%)
Source: BMI Egypt Autos Report Q4,
8/4/2019 Egypt Economic Report 2010
http://slidepdf.com/reader/full/egypt-economic-report-2010 14/20
E g y p t : G
r o w t h
I n d u s t r i e s
14
0
500
1000
1500
2000
2500
2003 2004 2005 2006 2007 2008 2009
Sugar
production
Sugar
consumption
0
1000
2000
3000
4000
5000
2005 2006 2007 2008 2009 2010f
Exports
Imports
0
2000
4000
6000
8000
10000
12000
14000
16000
1
2003 2004 2005 2006 2007 2008 2009
Wheat
production
Wheat
consumption
0
2000
4000
6000
8000
10000
12000
2003 2004 2005 2006 2007 2008 2009
Corn
production
Corn
consumption
Agriculture
Agriculture in Egypt faces several challenges. As it regains strength
following the global recession, it will have to face a rapidly growing
population and a shortage of domestic water. Water use per capita
is below the poverty level of 1,000 cubic metres, at 800 cubic
metres. Unfortunately, farming will have to compete with the day-
to-day water needs from households.
In the face of these challenges, the government is working to
improve productivity and increase levels of production in Egyptian
agriculture. One of the government’s strategies has been to sell
state-owned enterprises to private companies. While certain sub-
sidies remain, such as those meant to allow the poor to obtain
grains at lower prices, there has been some progress in privatiza-
tion that has helped to increase FDI lows in recent years. At the
same time, young Egyptian graduates have been increasingly at-
tracted to the farming industry thanks to new low-interest-loans
and free animals as an incentive to begin working in the agricul-
tural sector.
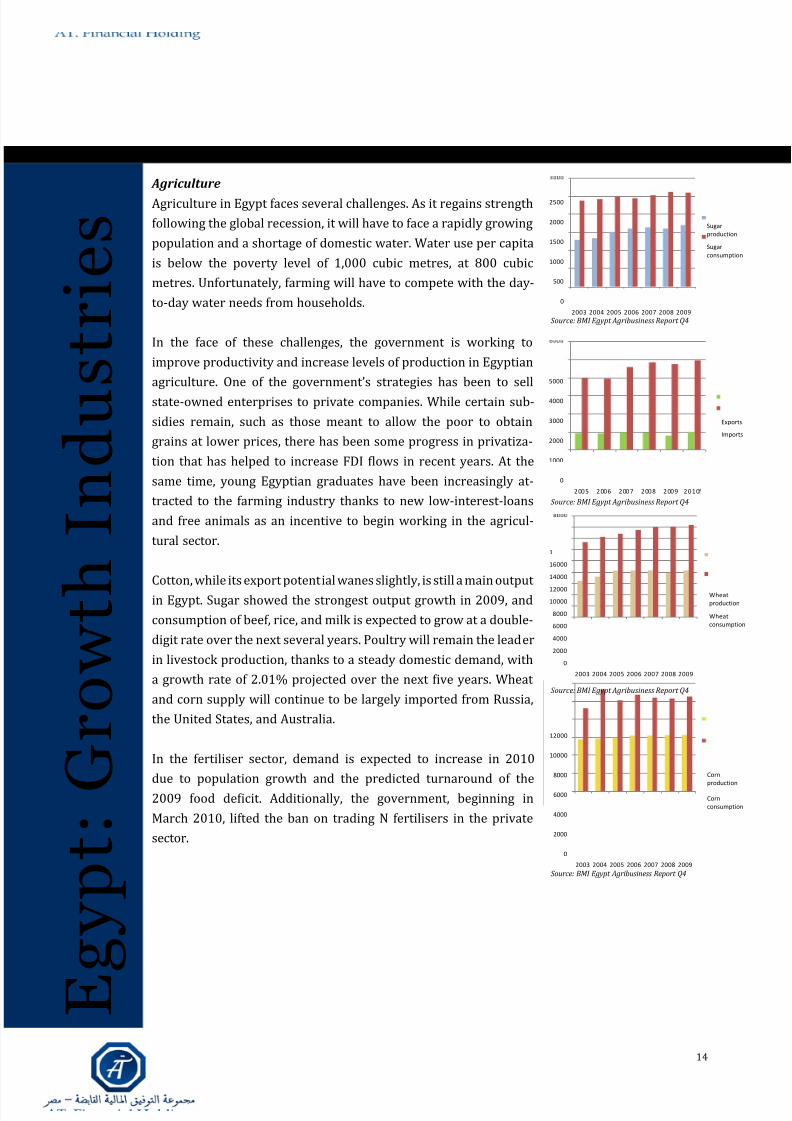
Cotton, while its export potential wanes slightly, is still a main output
in Egypt. Sugar showed the strongest output growth in 2009, and
consumption of beef, rice, and milk is expected to grow at a double-
digit rate over the next several years. Poultry will remain the leader
in livestock production, thanks to a steady domestic demand, with
a growth rate of 2.01% projected over the next ive years. Wheat
and corn supply will continue to be largely imported from Russia,
the United States, and Australia.
In the fertiliser sector, demand is expected to increase in 2010
due to population growth and the predicted turnaround of the
2009 food deicit. Additionally, the government, beginning in
March 2010, lifted the ban on trading N fertilisers in the private
sector.
Source: BMI Egypt Agribusiness Report Q4
Source: BMI Egypt Agribusiness Report Q4
Source: BMI Egypt Agribusiness Report Q4
Source: BMI Egypt Agribusiness Report Q4
8/4/2019 Egypt Economic Report 2010
http://slidepdf.com/reader/full/egypt-economic-report-2010 15/20
E g y p t : G
r o w t h
I n d u s t r i e s
15
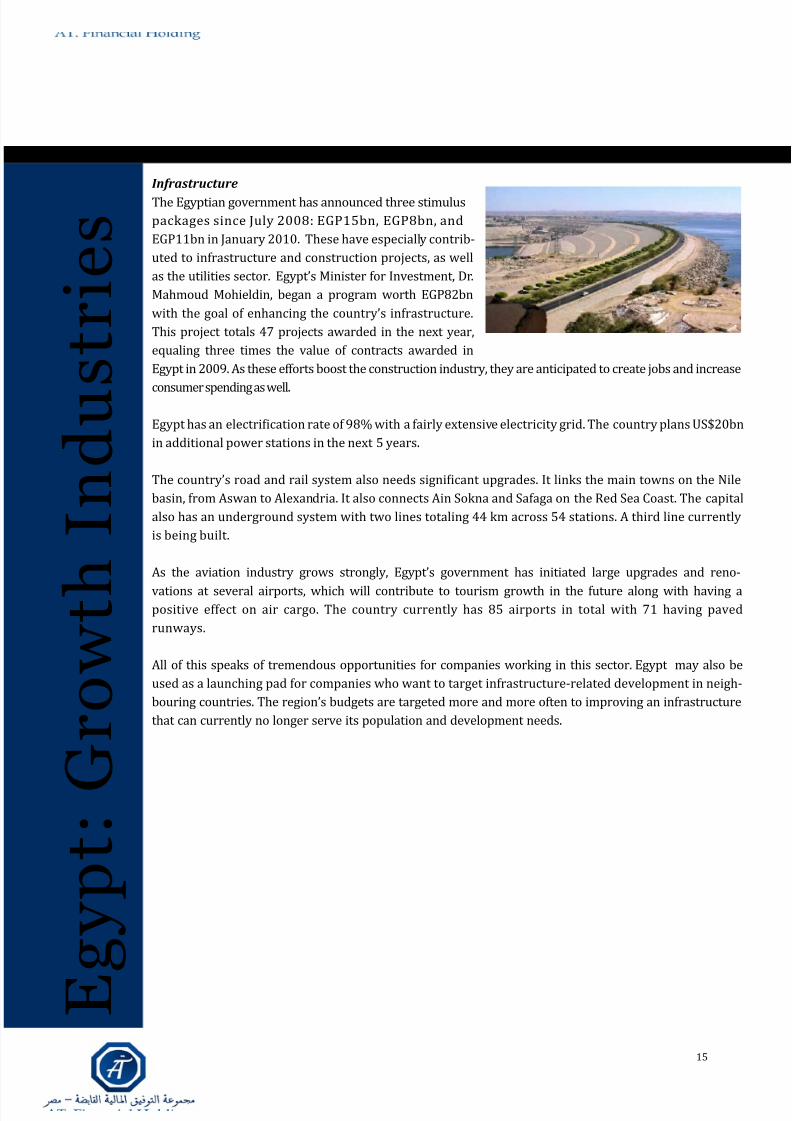
Infrastructure
The Egyptian government has announced three stimulus
packages since July 2008: EGP15bn, EGP8bn, and
EGP11bn in January 2010. These have especially contrib-
uted to infrastructure and construction projects, as well
as the utilities sector. Egypt’s Minister for Investment, Dr.
Mahmoud Mohieldin, began a program worth EGP82bn
with the goal of enhancing the country’s infrastructure.
This project totals 47 projects awarded in the next year,
equaling three times the value of contracts awarded in
Egypt in 2009. As these efforts boost the construction industry, they are anticipated to create jobs and increase
consumer spending as well.
Egypt has an electriication rate of 98% with a fairly extensive electricity grid. The country plans US$20bn
in additional power stations in the next 5 years.
The country’s road and rail system also needs signiicant upgrades. It links the main towns on the Nile
basin, from Aswan to Alexandria. It also connects Ain Sokna and Safaga on the Red Sea Coast. The capital
also has an underground system with two lines totaling 44 km across 54 stations. A third line currently
is being built.
As the aviation industry grows strongly, Egypt’s government has initiated large upgrades and reno-
vations at several airports, which will contribute to tourism growth in the future along with having apositive effect on air cargo. The country currently has 85 airports in total with 71 having paved
runways.
All of this speaks of tremendous opportunities for companies working in this sector. Egypt may also be
used as a launching pad for companies who want to target infrastructure-related development in neigh-
bouring countries. The region’s budgets are targeted more and more often to improving an infrastructure
that can currently no longer serve its population and development needs.
8/4/2019 Egypt Economic Report 2010
http://slidepdf.com/reader/full/egypt-economic-report-2010 16/20
E g y p t : G
r o w t h
I n d u s t r i e s
16
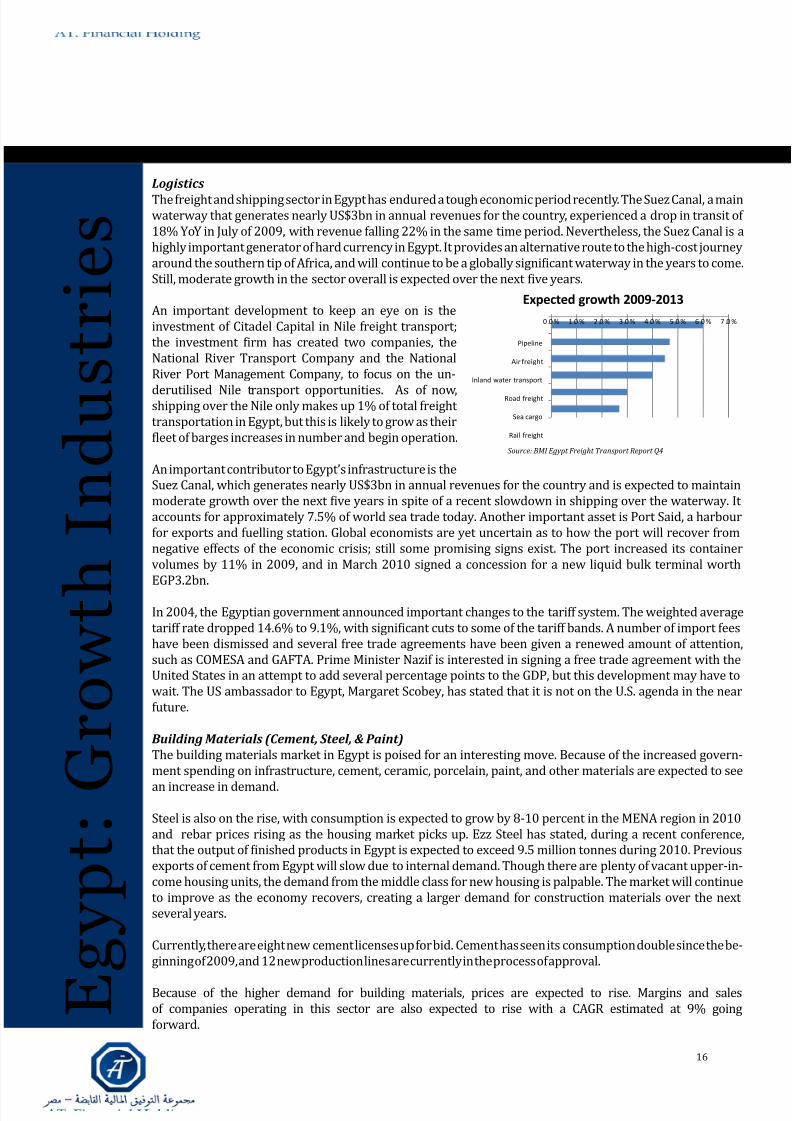
Lgistics
The freight and shipping sector in Egypt has endured a tough economic period recently. The Suez Canal, a mainwaterway that generates nearly US$3bn in annual revenues for the country, experienced a drop in transit of 18% YoY in July of 2009, with revenue falling 22% in the same time period. Nevertheless, the Suez Canal is ahighly important generator of hard currency in Egypt. It provides an alternative route to the high-cost journeyaround the southern tip of Africa, and will continue to be a globally signiicant waterway in the years to come.Still, moderate growth in the sector overall is expected over the next ive years.
An important development to keep an eye on is theinvestment of Citadel Capital in Nile freight transport;the investment irm has created two companies, theNational River Transport Company and the NationalRiver Port Management Company, to focus on the un-
derutilised Nile transport opportunities. As of now,shipping over the Nile only makes up 1% of total freight transportation in Egypt, but this is likely to grow as theirleet of barges increases in number and begin operation.
An important contributor to Egypt’s infrastructure is theSuez Canal, which generates nearly US$3bn in annual revenues for the country and is expected to maintainmoderate growth over the next ive years in spite of a recent slowdown in shipping over the waterway. It accounts for approximately 7.5% of world sea trade today. Another important asset is Port Said, a harbourfor exports and fuelling station. Global economists are yet uncertain as to how the port will recover fromnegative effects of the economic crisis; still some promising signs exist. The port increased its containervolumes by 11% in 2009, and in March 2010 signed a concession for a new liquid bulk terminal worthEGP3.2bn.
In 2004, the Egyptian government announced important changes to the tariff system. The weighted averagetariff rate dropped 14.6% to 9.1%, with signiicant cuts to some of the tariff bands. A number of import feeshave been dismissed and several free trade agreements have been given a renewed amount of attention,such as COMESA and GAFTA. Prime Minister Nazif is interested in signing a free trade agreement with theUnited States in an attempt to add several percentage points to the GDP, but this development may have towait. The US ambassador to Egypt, Margaret Scobey, has stated that it is not on the U.S. agenda in the nearfuture.
Building Materials (Cement, Steel, & Paint)
The building materials market in Egypt is poised for an interesting move. Because of the increased govern-ment spending on infrastructure, cement, ceramic, porcelain, paint, and other materials are expected to see
an increase in demand.
Steel is also on the rise, with consumption is expected to grow by 8-10 percent in the MENA region in 2010and rebar prices rising as the housing market picks up. Ezz Steel has stated, during a recent conference,that the output of inished products in Egypt is expected to exceed 9.5 million tonnes during 2010. Previousexports of cement from Egypt will slow due to internal demand. Though there are plenty of vacant upper-in-come housing units, the demand from the middle class for new housing is palpable. The market will continueto improve as the economy recovers, creating a larger demand for construction materials over the next several years.
Currently, there are eight new cement licenses up for bid. Cement has seen its consumption double since the be-ginning of 2009, and 12 new production lines are currently in the process of approval.
Because of the higher demand for building materials, prices are expected to rise. Margins and salesof companies operating in this sector are also expected to rise with a CAGR estimated at 9% goingforward.
0 .0 % 1 .0 % 2 .0 % 3 .0 % 4 .0 % 5 .0 % 6 .0 % 7 .0 %
Pipeline
Air freight
Inland water transport
Road freight
Sea cargo
Rail freight
Expected growth 2009-2013
Source: BMI Egypt Freight Transport Report Q4
8/4/2019 Egypt Economic Report 2010
http://slidepdf.com/reader/full/egypt-economic-report-2010 17/20
8/4/2019 Egypt Economic Report 2010
http://slidepdf.com/reader/full/egypt-economic-report-2010 18/20
E g y
p t : E m
e r g i n g
O p p o r t
u n i t i e s
18
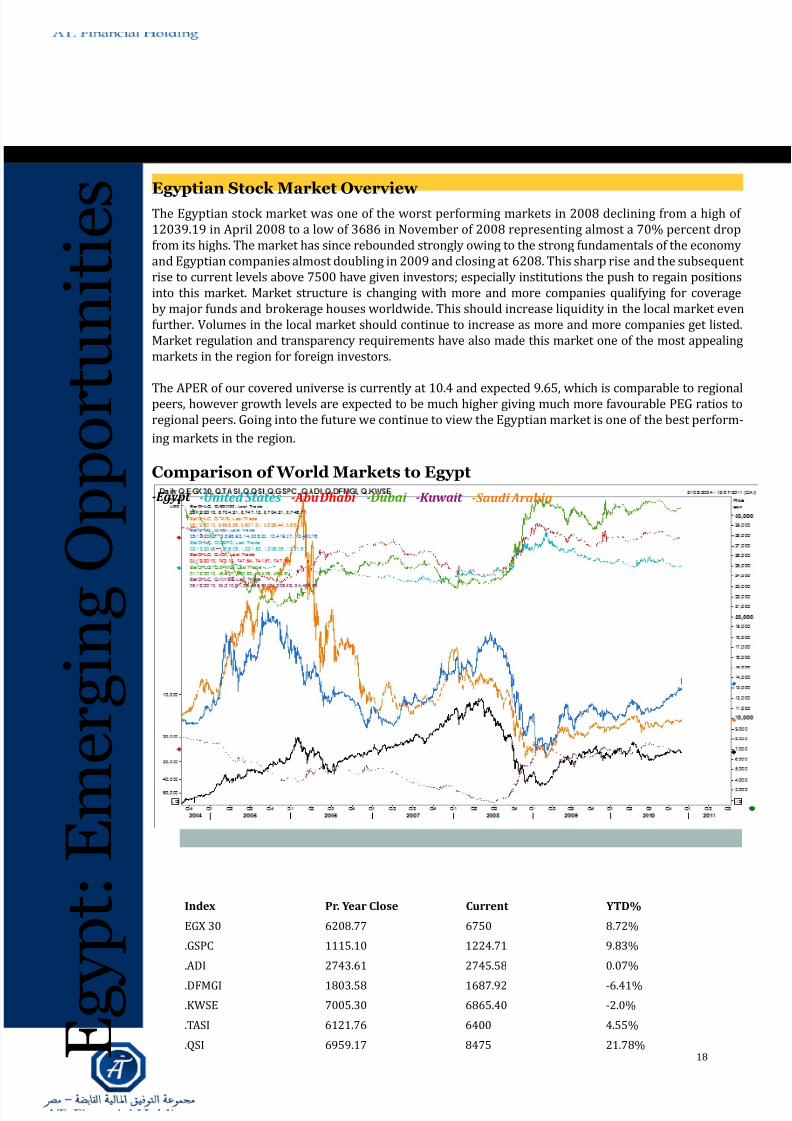
Egyptian Stock Market Overview The Egyptian stock market was one of the worst performing markets in 2008 declining from a high of 12039.19 in April 2008 to a low of 3686 in November of 2008 representing almost a 70% percent dropfrom its highs. The market has since rebounded strongly owing to the strong fundamentals of the economyand Egyptian companies almost doubling in 2009 and closing at 6208. This sharp rise and the subsequent rise to current levels above 7500 have given investors; especially institutions the push to regain positionsinto this market. Market structure is changing with more and more companies qualifying for coverageby major funds and brokerage houses worldwide. This should increase liquidity in the local market evenfurther. Volumes in the local market should continue to increase as more and more companies get listed.Market regulation and transparency requirements have also made this market one of the most appealingmarkets in the region for foreign investors.
The APER of our covered universe is currently at 10.4 and expected 9.65, which is comparable to regionalpeers, however growth levels are expected to be much higher giving much more favourable PEG ratios toregional peers. Going into the future we continue to view the Egyptian market is one of the best perform-
ing markets in the region.
Comparison of World Markets to Egypt
-Egpt -United States -Kuait -Saudi Arabia-Dubai -Abu Dhabi
Index Pr. Year Close Current YTD%
EGX 30 6208.77 6750 8.72%
.GSPC 1115.10 1224.71 9.83%
.ADI 2743.61 2745.58 0.07%
.DFMGI 1803.58 1687.92 -6.41%
.KWSE 7005.30 6865.40 -2.0%
.TASI 6121.76 6400 4.55%
.QSI 6959.17 8475 21.78%
8/4/2019 Egypt Economic Report 2010
http://slidepdf.com/reader/full/egypt-economic-report-2010 19/20
E g y p t : A
V a l u e d
I n v e s
t m e n t
19
Stocks to Watch Arab Cotton Ginning (ACG)
ACG performed greatly better in the irst quarter in 2010/2011 compared to the irst quarter in2009/2010. Revenues increased by 77% and the GP increased by 167%. Net proit reached aroundEGP14 million compared to less than 2 million in the previous quarter. ACG performance has been im-proving in the last years and the trend is expected to continue. Dividend distribution for the last inancialyear has reached EGP0.95 and the company said it will maintain or even increase its distributions in thefuture.
Ismailia Misr Poultry
The company is starting to reap the fruits of its efforts in 2009. During the previous year the company,
under its new management, undertook a total restructuring, including operational and inancial. As aresult the growth in the company performance was outstanding causing revenues to double and GP tomore than quadraple. Net proit increased from EGP1.78 million to EGP27.74 million. And we still believethat the stock may grow more as the real estate activity also start to add to the company and as thepoultry continue its growth as planned.
Nama’a Real Estate Development
Nama’a net proit in the 9M period of 2010 almost tripled reaching EGP21.31 million compared toEGP7.31 million. GP aalso grew by 204% as the top line increased by 157%. Nama’a also has projectsin New Cairo and in other areas with commercial and managerial focus that are expected to give thecompany a huge push upwards in the future.
National Company for Maize Products (NCMP)NCMP revenue and net proit grew by 6% and 7% respectively. Although not impressive as the othercompanies mentioned above, The company announced recently that its new production line will start operation and is expected to yield EGP100 million annually. For more details please check our trade note
about the company.
El Sewedy ElectricEl Sewedy continued its growth, increasing its net proit by 30% from EGP560 million to EGP727 million.
This is also a result of a 35% increase in net revenues which reached around EGP9.21 billions during theirst 9M of 2010. For more details about our view on El Sewdy please check our initiation of coveragereport about the company.
Ezz Steel “ES” & Al-Ezz Al-Dekheila (EZDK)Steel industry was one of the most suffering during the crisis, but this is starting to change. Althoughstill demand has not picked up in 2010 as was expected it is certainly improving compared to 2009 andthe end of 2008. Steel prices has recently reached EGP4,000. All this has been relected on the results of ES and EZDK as both of the companies has witnessed a huge growth in their performance. Consolidatedrevenues increased by 23% and 31% for ES and EZDK respectively, while the net proit increased toEGP242 million and EGP559 million respectively. It is worth mentioning that the comparable periods
results were EGP29 million only for the irst and EGP367 million for the latter. For more details pleasecheck our initiation of coverage reports on ES and EZDK.

8/4/2019 Egypt Economic Report 2010
http://slidepdf.com/reader/full/egypt-economic-report-2010 20/20
94 Tahrir Street - Maghraby Plaza - Dokki, Giza, Egypt
Tel: (202) 37493443 • (202) 37494302 • (202) 37494305
Fax: (202) 37493373 • (202) 37494552
Email: [email protected]
www.at-brokerage.com