Embed Size (px)
Citation preview

Egyp
tGlobal Research
Egypt Economic Review
Economy
December 2008Surviving the World Financial Turmoil ...
Global EgyptTel: 20 (2) 37609526Fax: 20 (2) 37609506
Address: 7 Abdel Hadi Saleh St.,El-Nasr Tower, Giza,
Postal code: 12311Egypt
Global Research
Omar M. El-Quqa, CFAExecutive Vice [email protected] No:(965) 2295 1110
Faisal Hasan, CFAHead of [email protected] No:(965) 2295 1270
Mahmoud SoheimManager-Egypt [email protected] No: (202) 37609526
Ahmed Abu Hussein, CFAFinancial [email protected] No: (202) 37609526
Cherine Fayez Farkouh, CFAFinancial [email protected] No: (202) 37609526
Radwa WeshahyFinancial [email protected] No: (202) 37609526

Global Investment House � Egypt Economic Review - December 2008
Economy ...................................................................................................................................................... 2
The Banking Sector ....................................................................................................................................... 8
Real Estate Sector ....................................................................................................................................... �2
Steel Sector ................................................................................................................................................. 24
Cement Sector ............................................................................................................................................. 28
Fertilizers Sector ......................................................................................................................................... 33
Telecom Sector ........................................................................................................................................... 38
Stock Market ............................................................................................................................................... 44
Table of Contents

Economy

Global Investment House 3 Egypt Economic Review - December 2008
Egypt - Economy
Economic Performance 2002/03 2003/04 2004/05 2005/06 2006/07 2007/08 *Real GDP ^ (LE bn) 390.7 407.0 425.2 454.3 486.5 798.� Real GDP Growth Rate (%) 3.2% 4.�% 4.5% 6.8% 7.�% 7.2%Per capita GDP (US$) �,�6� �,��7 �,247 �,460 �,65� 2,�42Inflation (%) 3.2% �0.3% ��.4% 4.2% ��.0% ��.7%Unemployment (%) ��.0% �0.3% ��.2% �0.6% 8.9% 8.4%Population (mn) 69.2 70.5 7�.9 73.6 77.5 77.5Government FinanceTotal Revenues and Grants (LE mn) 89,�46 �0�,88� ��0,865 �5�,266 �80,2�5 2�8,500Total Expenditures (LE mn) �27,320 �45,987 �6�,6�0 207,8�� 222,029 277,432Cash Surplus/(Deficit) (LE mn) -38,�74 -44,�07 -50,747 -56,545 -4�,8�5 -58,932Overall Fiscal Surplus/(Deficit) (LE mn) -43,559 -45,877 -5�,643 -50,386 -54,698 -59,234Government DebtGross Domestic Public Debt (LE mn) 323,�97 388,377 469,039 470,264 493,879 537,68�Gross External Debt (LE mn) �77,438 �85,385 �67,474 �69,868 �70,865 �77,336Balance of PaymentTrade Balance (US$ mn) -6,6�5 -7,834 -�0,359 -��,986 -�5,8�7 -23,4�5Total Exports (US$ mn) 8,205 �0,453 �3,833 �8,455 22,0�8 29,356Total Imports (US$ mn) -�4,820 -�8,286 -24,�93 -30,44� -37,834 -52,77�Current Account (US$ mn) �,943 3,4�8 2,9�� �,752 2,696 888Current Account/Nominal GDP (US$ mn) 2.4% 4.3% 3.3% �.6% 2.�% 0.5%Capital & Financial Account (US$ mn) -2,734 -5,0�6 3,378 3,5�� �,�34 7,�37Overall balance (US$ mn) 546 -�58 4,478 3,253 5,282 5,420Money Supply Money Supply - M� (LE mn) 67,2�2 77,606 89,685 �09,274 �3�,290 �70,579Quasi Money (LE mn) 3�7,050 357,305 404,�99 45�,082 53�,398 596,085Total Domestic Liquidity (M2) (LE mn) 384,262 434,9�� 493,884 560,356 662,688 766,664^ Using 2001/02 prices for the period 2002/03 to 2006/07 and prices of 2006/07 for 2007/08* Preliminary
Source: Central Bank of Egypt, Ministry of Finance, The Egyptian Exchange (EGX) and Global Research

4 Egypt Economic Review - December 2008Global Investment House
Egypt - Economy
» The Egyptian economy maintained its robust GDP growth during the previous three years, at around 7% annually.
» GDP is expected to grow by 6%, double the world average growth.
» This strong growth enabled Egypt to be an attractive FDI destination, rising by �9.4% in FY 2007/08, reaching US$�3.2bn.
» The challenge facing the Egyptian economy was the rising inflation rate, reaching 2�.5% in September 2008.
» Inflationary pressures generated from surging food and fuel prices worldwide. With the ease of these prices internationally, the inflation is believed to be brought down.
GDP Composition by Economic Activity in FY 2007/08
Natural Gas9.1%
Insurance3.6%
Agriculture,Forstry & Fishing
13.2%
Oil6.9%
Oil & OtherManufacturing
Ind.16.3%
Const. &Building
4.3%
Transport &Warehousing
4.1%Communications3.2%
Suez Canal3.4%
Wholesale &Retail Trade
11.2%
FinancialServices
3.7%
Tourism3.7%
Real Estate2.7%
GeneralGovernment
8.4%
Others6.2%
Real GDP Growth
3.2%
4.1%4.5%
6.8%7.1% 7.2%
-
100
200
300
400
500
600
700
800
900
LE bn
2002/03 2003/04 2004/05 2005/06 2006/07 2007/08
0%
1%
2%
3%
4%
5%
6%
7%
8%
Real GDP (LE bn) Real GDP Growth Rate (%)
Source: Central Bank of Egypt (CBE) and Global Research

Global Investment House 5 Egypt Economic Review - December 2008
Egypt - Economy
Global financial crisis will not affect Egypt financially » The exposure of the Egyptian financial institutions in the world’s financial credit market is minimal. » Local banks have abundant liquidity, with an average loan to deposits ratio of 54% compared to
approximately 80% as an international norm.
What will be the economic threats? » Lower exports proceeds, on the back of expected drop in prices, which is anticipated to be more severely
affected than quantities. Negatively affecting the Balance of Payment.
» Lower return from Suez Canal, due to reduced global trade activity.
» Lower proceeds generated from tourism, due to slower expected economic performance in Europe.
Economic Outlook

6 Egypt Economic Review - December 2008Global Investment House
Egypt - Economy
Could any benefit emerge from this situation?
» Reduction in international oil, food and metal prices will :
• Make imports cheaper, relieving some pressure from the Balance of Payment.
• Save huge expenditures for the government budget, especially on subsidies, which have surged by 56% between 2006/07 and 2007/08.
• Lower the inflation rate, which was 20.2% in October 2008 down from 23.6% in August 2008.
» More attention should be directed to SMEs because 80% of employment in Egypt work in SMEs and their products are directed to the local market , therefore they are protected from global recession.
» Currently, SMEs are targeted by Banks, as they are believed to drive economic growth in the coming period.
Economic Snapshot

Global Investment House 7 Egypt Economic Review - December 2008
How Egypt economy is expected to perform against the world economy?
» IMF projected that Egypt GDP will grow by 6% in 2009, which is double the world expected GDP growth.
» And almost in line with the emerging and developing
countries forecasted average GDP growth. » This should attract more FDIs from around the
world. » Future FDI inflows are expected in more
manufacturing sectors benefiting from low labor cost, abundance of several raw materials, as well as Egypt’s geographical location.
» Transportation, education and health care are
projected to attract FDIs too.
4.5
6.87.1 7.2
6.0 6.0
6.56.8 6.9
4.94.5
5.1 5.0
3.9
3.0
4.2
4.8 4.8 4.7
3.2
4.1
3.6
2
3
4
5
6
7
8
2003 2004 2005 2006 2007 2008 2009 2010 2011 2012 2013
%
Egypt World
3.2
4.14.5
6.87.1
6.0 6.06.5
6.8 6.96.3
7.57.1
7.9 8.0
6.9 6.9 6.97.2
6.9 6.1 6.7
2
3
4
5
6
7
8
9
2003 2004 2005 2006 2007 2008 2009 2010 2011 2012 2013
%
Egypt Emerging & developing countries
Economic Snapshot Egypt - Economy
Source: IMF

The Banking Sector

Global Investment House 9 Egypt Economic Review - December 2008
The Banking Sector
» Significant banking reforms since 2004.
» Attractive sector dynamics led to international and regional acquisitions over Egyptian banks.
» Domestic Liquidity (M2) growing by a CAGR of �4.8% over the 5-year period starting 2002/03 to 2007/08.
» Potential lending opportunities to fund future projects, stemmed by accelerated GDP growth, even with slight deviation than expected, as a result of the current global conditions.
*provisional
Source: Central Bank of Egypt Source: Central Bank of Egypt
Domestic Liquidity Growth
-
100
200
300
400
500
600
700
800
900
2002/03 2003/04 2004/05 2005/06 2006/07 2007/08*
LE bn
M1 Quasi Money
Loans to Deposits Development
70.6%64.2%
59.3% 57.0% 54.4% 53.7%
0
100
200
300
400
500
600
700
800
2002/03 2003/04 2004/05 2005/06 2006/07 2007/08
LEbn
0%
10%
20%
30%
40%
50%
60%
70%
80%
Loans and Discount Balances Deposits Loans to Deposits

�0 Egypt Economic Review - December 2008Global Investment House
The Banking Sector
» Extremely low loans/deposits ratio of around 54%, compared to a rough estimate of 80% worldwide, providing enough room for extending loans.
» Pressure exerted on banks by the CBE to extend loans to SMEs, as prospective stimulant for economic growth.
» Banks with international parent lenders are not likely to be negatively affected by global turmoil due to independent operations.
» Investments by Egyptian banks, not covering risky instruments like derivatives and securitized bonds, have saved them from the world’s financial turmoil.
» Still a lot of unexploited segments in the banking sector, i.e. mortgage and SMEs lending .
» Huge unfulfilled demand from the retail sector, with a low penetration rate of approximately 30%.
» Ample liquidity characterizing the banking sector in contrast to the credit crunch prevailing in USA.

Global Investment House �� Egypt Economic Review - December 2008
Market Players
Sector/ Company RIC FYE # Shares Free Float CMP MC FC PE PBV DY%
000s as of 20/11/08 LE 000s LE 000s Trailing Forward
30/06/08 LE 2007 2008
Banks
Egyptian Gulf Bank ($) EGBE Dec. �50,�92 5�.�3% �.95 292,875 �49,747 22.7� �8.8� 2.�0 7.69%
CIB COMI Dec. 292,500 9�.35% 29.94 8,757,450 7,999,93� 7.68 6.�4 �.64 3.34%
Credit Agricole Bank CIEB Dec. 287,000 20.98% 8.60 2,468,200 5�7,828 4.7� 4.92 �.30 ��.63%
Housing and Development Bank HDBK Dec. 67,000 2�.47% 22.50 �,507,500 323,660 7.99 6.42 �.70 6.67%
NSGB NSGB Dec. 302,94� 22.83% �5.60 4,725,879 �,078,9�8 7.0� 5.6� 0.93 �.60%
Export Development Bank of Egypt EXPA June �00,000 23.29% 8.02 802,000 �86,786 2.58 6.0� 0.63 �2.47%
Sector Average 7.60 6.22 1.54
Source: EGX and Global Research

Real Estate Sector

Global Investment House �3 Egypt Economic Review - December 2008
Real Estate
» Robust economic growth in Egypt reaching 7.2% stimulated the growth in the real estate sector.
» Increasing FDI injected in the real estate sector, reaching US$400mn in 2007/08, compared to US$39mn in the previous year.
» The recent decline in raw materials prices could fuel more growth in the sector.
» The real estate market is characterized by a chronic gap because:
• Over-supply in the high-end residential segment. • Low supply of middle and economic properties, where the majority of demand exists.
3.1%
4.2%4.6%
6.9% 7.1% 7.2%
0.8%
3.9%
3.0%
3.8%4.3%
3.7%
0.0%
1.0%
2.0%
3.0%
4.0%
5.0%
6.0%
7.0%
8.0%
2002/03 2003/04 2004/05 2005/06 2006/07 2007/08
GDP growth Real Estate growth
Source: CBE

�4 Egypt Economic Review - December 2008Global Investment House
Real Estate
Segments Estimated% of population Supply/Demand Outlook
High-End �0% High supply/saturated demand ÚUpper-Middle �5% Good supply/high demand ÒMiddle 35% Moderate supply/very high demand ÒEconomy 40% Low supply/great demand Ò
» Favorable demographic composition with 44% and 36% of population falling in the age-groups of 0-20 and 20-45, respectively.
Residential

Global Investment House �5 Egypt Economic Review - December 2008
Real Estate
» Activation of the mortgage law no.�48, which was issued in 200�, mainly through :
• Establishing the Egyptian Mortgage Refinance Company (EMRC) to be the mortgage market
maker.
• Reduction of property registration fees from �2% to 3% with a cap of LE2,000.
• Slash property tax rate from 46% to �0%.
• Establishing credit bureau to better assess borrowers credit worthiness.
• Establishing “Iskan”, to be the first insurance company concerned with mortgage finance risks.
Residential

�6 Egypt Economic Review - December 2008Global Investment House
Real Estate
Source: Ministry of Investment
» Very low Mortgage lending standing below �% of GDP, compared to 65% in USA, 45% in Europe and �4% in UAE.
14214
355
1,012
2
500
1,014
2,097
16
714
1,369
3,109
-
500
1,000
1,500
2,000
2,500
3,000
3,500
June 2005 June 2006 June 2007 June 2008
Mortgage Co. Banks Total
Residential

Global Investment House �7 Egypt Economic Review - December 2008
Real Estate
» Egypt compares favorable to other countries in the region, in terms of residential sqm prices.
Source: Colliers International
Cairo
Amman
TripoliMuscat
Doha
Riyadh
Khartoum
Dubai
Abu Dhabi
Damascus
-
1,000
2,000
3,000
4,000
5,000
6,000
7,000
0 20,000 40,000 60,000 80,000 100,000 120,000
GDP per Capita US$
Avg
. sqm
pri
ce U
S$
0
50
100
150
200
250
300
350
400
450
500
Cai
ro
Am
man
Trip
oli
Mus
cat
Doh
a
Riy
adh
Dam
ascu
s
Dub
ai
Abu
Dha
bi
Kha
rtou
m
Avg
. sqm
pric
e U
S$
0.0%
2.0%
4.0%
6.0%
8.0%
10.0%
12.0%
14.0%
Annual avg. rent/sqm (US$) Rentail yield
Residential

�8 Egypt Economic Review - December 2008Global Investment House
Real Estate
» Higher GDP per capita, on the back of economic growth, leading to growing upper-middle class.
» Reduction in import duties on various items, reaching an average of 6.9%, leading to lower prices in the local market.
» Entrance of international brand names to Egypt.
» Shortage of supply in class “A” retail spaces.
Source: Colliers International
Annual avg. rent/sqm (US$)
867
486 528440
850
470
765
1,200
950
660
-
200
400
600
800
1,000
1,200
1,400
Cairo
Amman
Tripoli
Mus
cat
Doha
Riyadh
Damas
cus
Dubai
Abu D
habi
Kharto
um
Commercial Segment (Retail)
Global Investment House �9 Egypt Economic Review - December 2008
Real Estate
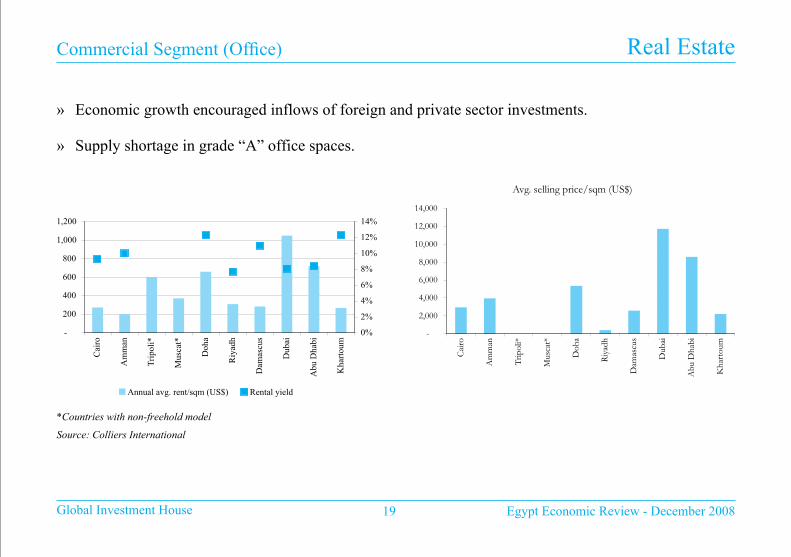
» Economic growth encouraged inflows of foreign and private sector investments. » Supply shortage in grade “A” office spaces.
-
200
400
600
800
1,000
1,200
Cai
ro
Am
man
Tri
poli*
Mus
cat*
Doh
a
Riy
adh
Dam
ascu
s
Dub
ai
Abu
Dha
bi
Kha
rtou
m0%
2%
4%
6%
8%
10%
12%
14%
Annual avg. rent/sqm (US$) Rental yield
Avg. selling price/sqm (US$)
-
2,000
4,000
6,000
8,000
10,000
12,000
14,000
Cai
ro
Am
man
Trip
oli*
Mus
cat*
Doh
a
Riy
adh
Dam
ascu
s
Dub
ai
Abu
Dha
bi
Kha
rtou
m
*Countries with non-freehold model
Source: Colliers International
Commercial Segment (Office)

20 Egypt Economic Review - December 2008Global Investment House
Real Estate
» The tourism sector witnessed a strong growth at a CAGR of �6.6% over the past 6 years.
» No. of tourists arrivals reached ��mn in 2007, compared to 9mn in 2006.
» Investment in hotels reached LE5.5bn, against LE3.8bn in 2006/07, growing by 45%.
» The government targets to increase the no. of tourists arrivals to �4mn by the end of 20�2.
» Airports expansions and renovations to accommodate for the increasing no. of arrivals.
» Diversity of touristic activities (historical, recreational, religious).
» Egypt possesses one third of the world’s ancient monuments.
Tourism
Global Investment House 2� Egypt Economic Review - December 2008
Real Estate
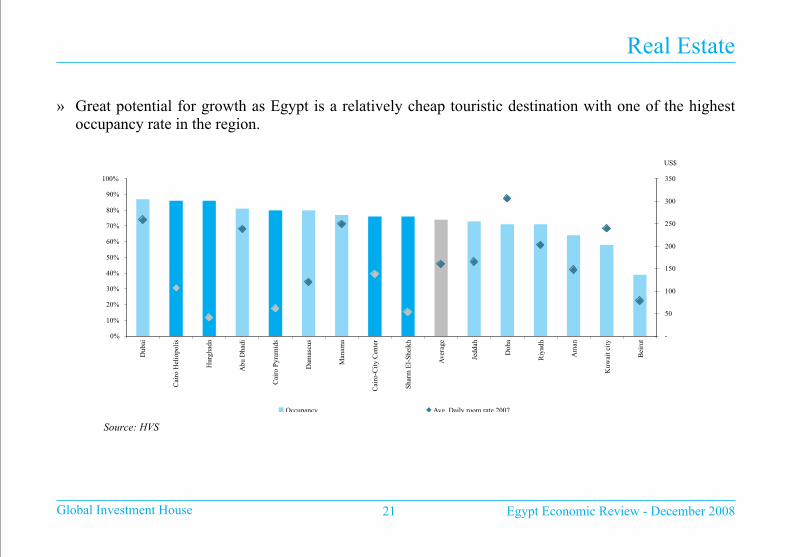
» Great potential for growth as Egypt is a relatively cheap touristic destination with one of the highest occupancy rate in the region.
0%
10%
20%
30%
40%
50%
60%
70%
80%
90%
100%
Dub
ai
Cai
ro H
elio
polis
Hur
ghad
a
Abu
Dha
di
Cai
ro P
yram
ids
Dam
ascu
s
Man
ama
Cai
ro-C
ity C
ente
r
Shar
m E
l-Sh
eikh
Ave
rage
Jedd
ah
Doh
a
Riy
adh
Am
an
Kuw
ait c
ity
Bei
rut -
50
100
150
200
250
300
350
US$
Occupancy Avg. Daily room rate 2007
Source: HVS

22 Egypt Economic Review - December 2008Global Investment House
Real Estate
» Generally, positive outlook but at a lower magnitude because of weak expected global economic growth, resulting from the global financial crisis.
Segment Outlook Explanation
Residential Ò • Good potential for growth, especially in the middle and lower income classes.• Mortgage lending is still in its infancy stage • Expected reduction in inflation will relief upward pressure on interest rates, lowering mortgage
rate
Retail Ò • The existing supply shortage will out-weight reduced activity following the global economic expected slowdown.
Office Ò • Under-served segment• Egypt above average expected economic growth at 6%, compared to the average global
economic growth rate of 3%.
Tourism Ò • Low cost destination to European tourists• Proximity to Europe, reducing travel cost • Expected average annual growth of 5.8%, according to World Travel and Tourism Council
(WTTC).
Outlook

Global Investment House 23 Egypt Economic Review - December 2008
Market Players
Sector/ Company RIC FYE # Shares Free Float CMP MC FC PE PBV DY%
000s as of 20/11/08 LE 000s LE 000s Trailing Forward
30/06/08 LE 2007 2008
Housing & Real Estate
Cairo Housing ELKA Dec. 93,750 95.08% 4.50 42�,875 40�,��9 67.32 55.94 0.86 4.44%
Egyptian Resorts Company EGTS Dec. �,050,000 39.72% �.74 �,827,000 725,684 6.40 6.56 �.72 ��.49%
Nasr City Housing MNHD June �00,000 42.66% 25.84 2,584,000 �,�02,334 29.8� 24.62 9.72 3.�0%
Orascom Hotels & Development ORHD Dec. 22�,962 2.00% 20.00 4,439,246 88,785 ��.09 48.49 �.49 0.00%
SODIC OCDI Dec. 28,4�3 62.28% 4�.�0 �,�67,79� 727,300 3.52 7.75 0.67 0.00%
United Housing UNIT Dec. 42,207 64.�2% 5.�6 2�7,789 �39,647 �4.32 �2.59 4.46 0.00%
Heliopolis Housing HELI June 74,�7� 22.29% 24.00 �,780,��4 396,787 �5.79 �3.36 5.09 5.2�%
Development & Engineering Consultants DAPH Dec. 8,57� 46.82% �3.40 ��4,857 53,776 2.28 5.25 0.83 0.00%
Remco for Touristic Villages Construction RTVC Dec. �04,024 26.40% 5.47 569,0�0 �50,2�9 3.99 2.74 0.58 0.00%
Upper Egypt General Contracting UEGC June 50,000 96.69% 2.�7 �08,500 �04,909 50.97 7.43 0.34 0.00%
Egyptians Housing Development &
ReconstructionEHDR Dec. 75,000 48.26% 3.6� 270,750 �30,664 236.82 27.2� �.68 0.00%
Talaat Mostafa Group Holding TMGH Dec. 2,030,204 4�.90% 3.�6 6,4�5,443 2,688,07� 24.2� 4.�� 0.30 0.00%
Sector Average 26.59 13.03 2.50
Source: EGX and Global Research

Steel Sector

Global Investment House 25 Egypt Economic Review - December 2008
Steel Sector
Source: CBE, Global Research
» Construction and building activities in Egypt have been growing at a �9.9% CAGR from 2004/05 to 2007/08.
» Sales by main Egyptian companies have grown at a CAGR of �2.5% between 2004/05 and 2007/08.
Construction and Building Activities
4.0%
4.1%
4.2%
4.6%
-
5
10
15
20
25
30
35
40
2004/05 2005/06 2006/07 2007/08
LE
bn
3.6%
3.7%
3.8%
3.9%
4.0%
4.1%
4.2%
4.3%
4.4%
4.5%
4.6%
Construction and Building Construction and Building % of GDP
Steel Sales Volume By Main Egyptian Companies
-
500
1,000
1,500
2,000
2,500
3,000
3,500
2001 2002 2003 2004 2005 2006 2007 Jun-08
000
tons

26 Egypt Economic Review - December 2008Global Investment House
Steel Sector
» Forecasts for world steel production indicate a growth of 5.3% in 2008 and 5.4% in 2009, driven by developing economies.
» Even though steel prices decreased from highs of LE7,000/ton to LE5,000/ton in mid-September, profit margins will remain strong as billet prices declined from LE6,000/ton to LE4,000/ton.
» Sustainable growth in construction and mainly infrastructural spending, especially in Upper Egypt.
Egypt Steel Prices
1,000
2,000
3,000
4,000
5,000
6,000
7,000
Oct-07 Nov-07 Dec-07 Jan-08 Feb-08 Mar-08 Apr-08 May-08 Jun-08 Jul-08 Aug-08 Sep-08
LE
/ton
Scraps Billets Steel RebarsSource: IDA and Global Research

Global Investment House 27 Egypt Economic Review - December 2008
Market Players
Sector/ Company RIC FYE # Shares Free Float CMP MC FC PE PBV DY%
000s as of 20/11/08 LE 000s LE 000s Trailing Forward
30/06/08 LE 2007 2008
Iron & Steel
Ezz Steel ESRS Dec. 543,265 34.75% 9.64 5,237,075 �,8�9,884 4.67 2.80 �.22 �0.37%
Ezz - Dekhila Steel - Alex IRAX Dec. �3,364 7.4�% 723.00 9,662,47� 7�5,603 4.28 2.68 2.55 20.06%
Sector Average 4.56 2.77 1.59
Source: EGX and Global Research

Cement Sector

Global Investment House 29 Egypt Economic Review - December 2008
Cement Sector
» Egypt has a comparative advantage in the production and exportation of cement due to the availability of
raw materials, relatively cheap energy and Egypt’s strategic location enabling it to be a major exporter
in the region.
» These promising features of the industry has always made Egypt an attractive investment destination for
foreign suppliers.
» The majority of cement companies in Egypt are dominated by international companies represented by
Holcim, Ciment Francais, Cemex, Vicat, Cimpor and Lafarge.

30 Egypt Economic Review - December 2008Global Investment House
Cement Sector
» Strong performance in line with GDP growth. » The growth in local construction activities ensures demand on cement.
29,1
04
28,7
63
33,5
65
36,2
15
38,4
69
25,7
04
23,5
50
28,5
27
30,2
25
34,4
623,29
9
4,66
1
5,17
3
5,83
8
4,13
2
3.2%
4.1%
4.5%
6.8% 7.1%
-
5,000
10,000
15,000
20,000
25,000
30,000
35,000
40,000
45,000
2003 2004 2005 2006 2007
000
tons
0%
1%
2%
3%
4%
5%
6%
7%
8%
Supply Demand Exports Egypt GDP Growth Rate
Source: Global Research

Global Investment House 3� Egypt Economic Review - December 2008
Cement Sector
» On November 2007, new cement licenses worth LE�,�38mn were granted to meet the expected demand
from the infrastructure projects, especially in Upper Egypt, where the government announced a mega
project worth LE3,2bn over the period between 2007 to 20�2.
» The new licenses will bring Egypt’s total cement capacities to 55.2mn tons by 20�0, from the current
4�.7mn tons, which reflects the inherent growth in the sector.
» Still the cost per ton is considered low compared to regional and international peers, despite the recent
local increases in energy costs.
» The continuous need for housing in Egypt ensures considerable demand on cement, especially as the
prices will ease, to benefit from low materials costs.

32 Egypt Economic Review - December 2008Global Investment House
Market Players
Sector/ Company RIC FYE # SharesFree Float
CMP MC FC PE PBV DY%
000s as of 20/11/08 LE 000s LE 000s Trailing Forward
30/06/08 LE 2007 2008
Cement
South Valley Cement SVCE Dec. 4�4,055 20.06% 5.�2 2,��9,960 425,264 3.64 3.52 0.90 0.00%
Misr Beni Suef Cement MBSC Dec. 20,000 50.53% 45.60 9�2,000 460,834 4.72 4.59 �.�6 6.58%
Misr Cement - Qena MCQE Dec. 30,000 �2.80% 80.00 2,400,000 307,�52 8.68 7.67 3.0� 6.25%
National Cement Company NCEM June �03,200 �.73% �8.55 �,9�4,360 33,2�2 7.57 �2.�4 2.76 9.97%
Sinai Cement SCEM Dec. 35,000 25.5�% 3�.40 �,099,000 280,345 3.22 3.02 0.82 3.98%
Suez Cement SUCE Dec. �8�,857 �4.00% 20.40 3,709,873 5�9,399 3.78 3.�7 0.64 9.80%
Sector Average 4.69 4.38 1.23
Source: EGX and Global Research

Fertilizers Sector
34 Egypt Economic Review - December 2008Global Investment House
Fertilizers Sectors
Fertilizers demand is secured by robust growth in the agriculture sector in Egypt.
» The agriculture sector is considered one of the significant sectors in Egypt, where it has accounted for
�4% of the country’s GDP in FY 2007/08.
» The local demand on fertilizers is highly strengthened by the continuous growth in the agriculture sector,
which is supported by the following pillars:
• Rapidly growing population.
• Scarcity of arable land.
• Enhanced irrigation systems.
• Providing subsidized fertilizers.
• Adding around �50,000 acres annually to Egypt’s arable land.
• Government awareness campaigns for using the appropriate types and quantities of fertilizers in
order to raise crop yields.

Global Investment House 35 Egypt Economic Review - December 2008
Fertilizers Sectors
» Though the world’s financial crisis has
significantly forced fertilizers prices
downward, squeezing producers margins,
the low cash cost of the fertilizers production
in Egypt ensures strong and sustainable
profit margins.
» Catering to the availability of relatively
cheap raw materials, natural gas and
phosphate rock, more investments are
injected in the fertilizers sector, where local
producers are raising their capacities, and
new joint ventures between local and foreign
fertilizers producers are being established.
Source: Fertilizerworks and Global Research
Source: PotashCorp and Global Research
Urea Prices Vs. Natural Gas Prices
200
300
400
500
600
700
800
900
Jan-08 Feb-08 Mar-08 Apr-08 May-08 Jun-08 Jul-08 Aug-08 Sep-08 Oct-08 Nov-08
US$
/M.T
on
4
6
8
10
12
14
16
US$/M
MB
tu
Granular Urea Basket Price (RHS) Middle East Granular Urea (RHS)
Natural Gas Henry Hub Spot Price (LHS)
World Natural Gas Cost (2008 Estimates) 13.00
11.009.95
8.25
3.75 3.50
2.30 2.001.00 0.80 0.60
0
2
4
6
8
10
12
14
Wes
t Eur
ope
USA
Can
ada
Ukr
aine
Chi
na
Arg
entin
a
Rus
sia
Indo
nesi
a
Ven
ezue
la
Mid
dle
Eas
t
Nor
th A
fric
a
US$
/MM
Btu

36 Egypt Economic Review - December 2008Global Investment House
Ammonia/Urea Average Cash Cost
Source: PotashCorp, Yara Fertilizers and Global Research
Ammonia
-
100
200
300
400
500
600
700
800
900
Wes
t Eur
ope
USA
Cana
da
Ukra
ine
Chin
a
Arge
ntin
a
Russi
a
Indo
nesia
Egyp
t
Vene
zuela
Midd
le Ea
st
Nor
th A
frica
US$
/mt
Ammonia Cash Cost
Average Ammonia Cash Cost
Ammonia Current Price (October 2008)
Ammonia Peak Price (August 2008)
Urea
-
100
200
300
400
500
600
700
800
Wes
t Eur
ope
USA
Can
ada
Ukr
aine
Chi
na
Arg
entin
a
Rus
sia
Indo
nesi
a
Egy
pt
Ven
ezue
la
Mid
dle
Eas
t
Nor
th A
fric
a
US$
/mt
Urea Cash Cost
Average Urea Cash Cost
Urea Current Price (October 2008)
Urea Peak Price (August 2008)

Global Investment House 37 Egypt Economic Review - December 2008
Market Players
Sector/ Company RIC FYE # SharesFree
FloatCMP MC FC PE PBV DY%
000s as of 20/11/08 LE 000s LE 000sTrailing Forward
30/06/08 LE 2007 2008
Fertilizers
Abu Kir Fertilizers ABUK June 45,886 �3.00% �66.89 7,657,980 995,537 7.73 8.34 4.�3 6.74%
Egyptian Financial & Industrial Co. EFIC Dec. 69,302 5�.47% 24.�7 �,675,020 862,�33 �4.38 5.93 2.66 4.37%
Sector Average 10.82 7.22 3.45
Source: EGX and Global Research

Telecom Sector

Global Investment House 39 Egypt Economic Review - December 2008
Telecom Sector
» The Communications sector achieved a
growth rate of �4.2% in FY2007/08, on the
back of improved economic conditions.
» Egypt’s expected economic growth of 6%
will ensure the growth of the sector.
» The world financial crisis will have no
effect on the Telecom Sector, due to its
unique nature.
» The low penetration rate in the Egyptian
market will act as a catalyst for the growth
in the sector over the coming years.
Communications Sector
9.4%10.3%
14.1% 14.2%
0
5
10
15
20
25
30
LE bn
2004/05 2005/06 2006/07 2007/08
0%
2%
4%
6%
8%
10%
12%
14%
16%
Communications (LEbn) Growth %
Communicatons Sector Contribution to GDP
2.16% 2.23%
3.25%3.46%
0.0%
1.0%
1.5%
2.0%
2.5%
3.0%
3.5%
4.0%
4.5%
2004/05 2005/06 2006/07 2007/08
Source: CBE and Global Research

40 Egypt Economic Review - December 2008Global Investment House
Telecom Sector
Fixed Line
» Telecom Egypt is currently the sole fixed line provider in Egypt.
» Fixed line subscribers grew at a CAGR of 7.7% over the past five years, reaching ��.23mn in 2007.
» Fixed line penetration rate stood at �5.0% in 2007 and �5.�% by the end of September 2008.
» The ARPU of Telecom Egypt reached LE5�.� in September 2008.
» The government postponed a second fixed line license auction to 2009, due to unfavorable market conditions.
11.4%
Fixed Line Subscribers and Penetration Rate
12.6%13.5%
14.5% 14.7% 15.0% 15.1%
-
2
4
6
8
10
12
14Mn
2002 2003 2004 2005 2006 2007 Sep-086%
8%
10%
12%
14%
16%
18%
Fixed Line Subscribers (mn) Fixed Line Penetration %
Teleocm Egypt ARPU
53.5 52.7 55.358.9
54.2 51.1
-
10
20
30
40
50
60
70
2003 2004 2005 2006 2007 Sep-08
LE
Source: Telecom Egypt and Global Research

Global Investment House 4� Egypt Economic Review - December 2008
Telecom Sector
Mobile
» Total mobile subscribers reached 38mn in September 2008, up by 40% compared to September 2007.
» The mobile market has been gradually de-regulated, but NTRA continues to have a major role in controlling competition.
3.4%8.3% 10.8%
19.1%24.8%
40.7%
50.7%
-
5
10
15
20
25
30
35
40Mn
2002 2003 2004 2005 2006 2007 Sep-08
0%
10%
20%
30%
40%
50%
60%
Mobile Subscribers (mn) Mobile Penetration %
Mobile Subscribers and Penetration Rate
Mobinil49.6%
Vodafone43.0%
EtisalatMisr7.5%
Mobile Operators Market Share(September 2008)
Source: Mobinil, Vodafone and Global Research Source: NTRA and Global Research

42 Egypt Economic Review - December 2008Global Investment House
Telecom Sector
Mobile
» The increased competition among the current 3 mobile operators is expected to squeeze their profit margin.
» The pre-paid market is the prominent one, with over 97% of mobile subscribers preferring pre-payment plans.
Mobile Cellular subscribers per 100 inhabitants
176.5150.4
148.3114.7
97.396.3
81.480.5
75.973.1
64.2
31.330.7
21.313.8
39.8
0 20 40 60 80 100 120 140 160 180 200
United Arab EmiratesQatar
BahrainSaudi Arabia
KuwaitOman
AlgeriaJordan
TunisiaLibya
MoroccoEgypt
SyriaLebanon
SudanYemen
Source: ITU

Global Investment House 43 Egypt Economic Review - December 2008
Market Players
Sector/ Company RIC FYE # Shares Free Float CMP Market Free PE PBV DY%
000s as of 20/11/08 Cap Cap Trailing Forward
30/06/08 LE LE 000s LE 000s 2007 2008
Communication
Mobinil EMOB Dec. �00,000 28.58% ��7.00 ��,700,000 3,343,860 6.42 6.�9 5.30 �4.26%
Orascom Telecom Holding ORTE Dec. �,028,�00 37.46% 2�.05 2�,64�,505 8,�06,908 3.22 8.28 2.97 4.75%
Telecom Egypt ETEL Dec. �,707,072 �8.27% �3.20 22,533,345 4,��6,842 8.89 7.70 0.90 7.58%
RAYA RAYA Dec. 56,985 68.76% 4.80 273,527 �88,077 6.75 4.99 0.60 25.63%
Sector Average 5.42 7.64 2.90
Source: EGX and Global Research

Stock Market

Global Investment House 45 Egypt Economic Review - December 2008
Stock Market
» CASE 30 Index still has a positive trend on the long run even after its recent significant losses.
3,000
4,000
5,000
6,000
7,000
8,000
9,000
10,000
11,000
12,000
Trend line
2-Ja
n-06
2-Fe
b-06
2-M
ar-0
6
2-A
pr-0
6
2-M
ay-0
6
2-Ju
n-06
2-Ju
l-06
2-A
ug-0
6
2-Se
p-06
2-O
ct-0
6
2-N
ov-0
6
2-D
ec-0
6
2-Ja
n-07
2-Fe
b-07
2-M
ar-0
7
2-A
pr-0
7
2-M
ay-0
7
2-Ju
n-07
2-Ju
l-07
2-A
ug-0
7
2-Se
p-07
2-O
ct-0
7
2-N
ov-0
7
2-D
ec-0
7
2-Ja
n-08
2-Fe
b-08
2-M
ar-0
8
2-A
pr-0
8
2-M
ay-0
8
2-Ju
n-08
2-Ju
l-08
2-A
ug-0
8
2-Se
p-08
2-O
ct-0
8
2-N
ov-0
8
Source: EGX and Global Research

46 Egypt Economic Review - December 2008Global Investment House
Stock Market Indicators
Indicators 2003 2004 2005 2006 2007 2008(Jan -Oct)
Volume of listed securities �,20�.6 �,786.3 4,�98.9 7,757.� ��,377.6 �8,686.5 Volume of unlisted securities 220.7 648.4 �,���.6 �,323.4 3,7�2.5 2,52�.8 Total volume (million) 1,422.3 2,434.7 5,310.4 9,080.5 15,090.0 21,208.3 Value traded (listed securities) 23,000.0 36,�4�.7 �50,924.0 27�,�07.8 32�,524.5 447,�54.2 Value traded (unlisted securities) 4,764.0 6,232.6 9,7�0.7 �5,63�.9 4�,�95.9 46,775.9 Total value traded (LE million) 27,764.0 42,374.3 160,634.7 286,739.7 362,720.4 493,930.1 Average monthly value traded (listed securities) �,9�7.0 3,0��.8 �2,577.0 22,592.3 26,793.7 44,7�5.4 Average monthly value traded (unlisted securities) 397.0 5�9.4 809.2 �,302.7 3,433.0 4,677.6 Total (LE million) 2,314.0 3,531.2 13,386.2 23,895.0 30,226.7 49,393.0 Number of transactions (Listed securities) �,205,775 �,675,277 3,922,30� 6,590,�96 8,7�2,584 �0,936,543 Number of transactions (unlisted securities) 23,602 68,287 2�7,79� 23�,244 30�,282 593,376 Total number of transactions 1,229,377 1,743,564 4,210,092 6,821,440 9,013,866 11,529,919 Number of listed companies 978 795 744 595 435 377 Number of traded companies 540 503 44� 407 337 306 Average monthly traded companies 206 200 �86 �83 �99 2�2 Market capitalization end of year (LE bn) �7�.9 233.9 456.3 534.0 768.3 475.4 Turnover Ratio (%) ��.5 �4.2 3�.� 48.7 38.7 90.� Price Earning (P/E) Ratio * 8.8 �5.6 22.0 2�.0 �9.� �2.3 Price to Book (P/B) Ratio * 2.� 4.4 9.� 5.9 8.6 4.8
Securities include stocks, bonds and mutual funds * P/E and P/B ratios are based on the most active companies only (Liquid Market) Source: EGX

Global Investment House 47 Egypt Economic Review - December 2008
Stock Market
Source: EGX
» Market cap. vs. number of listed and traded companies
-
200
400
600
800
1,000
2003 2004 2005 2006 2007 2008 (Jan to Oct 2008)
Com
pani
es
-
200
400
600
800
1,000
LE
Bn
Market capitalization end of year (LE bn) Number of listed companies
Number of traded companies

48 Egypt Economic Review - December 2008Global Investment House
Stock Market
» Total volume vs. value traded development
-
5
10
15
20
25
2003 2004 2005 2006 2007 2008 (Jan to Oct 2008)
Bill
ion
Shar
es
-
100
200
300
400
500
600
LE
Bn
Total value traded (LE Bn) Total volume (Bn)
Source: EGX

Global Investment House 49 Egypt Economic Review - December 2008
Stock Currently Traded Below Par Value
Company RIC Par ValueCMP
As of 20/11/08Traded at a
discount to par
Talaat Mostafa Group Holding TMGH �0.00 3.�6 -68%
Media Production City MPRC �0.00 3.85 -62%
NAEEM Holding ($) NAHO �.00 0.42 -58%
Arab Polvara Spining & Weaving APSW 5.00 2.67 -47%
Remco for Touristic Villages Construction RTVC �0.00 5.47 -45%
Arab Cotton Ginning ACGC 5.00 3.23 -35%
SPINALEX SPIN 2.00 �.39 -3�%
Export Development Bank of Egypt EXPA �0.00 8.02 -20%
El Ezz Porcelain (Gemma) ECAP 5.00 4.24 -�5%
Cairo Housing ELKA 5.00 4.50 -�0%
Development & Engineering Consultants DAPH �4.00 �3.40 -4%
RAYA RAYA 5.00 4.80 -4%
Source: EGX and Global Research

50 Egypt Economic Review - December 2008Global Investment House
Stocks Currently Traded Below Book Value
Sector/ Company RIC BV/shareCMP
As of 20/11/08
Traded at a
discount to BVTalaat Mostafa Group Holding TMGH �0.60 3.�6 -70%Upper Egypt General Contracting UEGC 6.35 2.�7 -66%Arab Polvara Spining & Weaving APSW 7.65 2.67 -65%Media Production City MPRC �0.97 3.85 -65%NAEEM Holding ($) NAHO �.�9 0.42 -65%Arab Cotton Ginning ACGC 8.02 3.23 -60%EFG-Hermes Holding HRHO 23.89 �3.56 -43%Remco for Touristic Villages Construction RTVC 9.35 5.47 -42%RAYA RAYA 8.03 4.80 -40%Oriental Weavers Carpets ORWE 33.�3 �9.90 -40%Export Development Bank of Egypt EXPA �2.75 8.02 -37%Suez Cement SUCE 3�.69 20.40 -36%SPINALEX SPIN 2.�� �.39 -34%El Ezz Porcelain (Gemma) ECAP 6.37 4.24 -33%SODIC OCDI 6�.09 4�.�0 -33%East Delta Flour Mills EDFM 30.�4 2�.0� -30%KABO KABO �.53 �.20 -2�%Sinai Cement SCEM 38.20 3�.40 -�8%Alexandria Flour Mills AFMC �4.�6 ��.66 -�8%Development & Engineering Consultants DAPH �6.09 �3.40 -�7%Cairo Housing ELKA 5.23 4.50 -�4%Telecom Egypt ETEL �4.69 �3.20 -�0%South Valley Cement SVCE 5.69 5.�2 -�0%NSGB NSGB �6.82 �5.60 -7%Source: EGX and Global Research
Global Investment House 5� Egypt Economic Review - December 2008
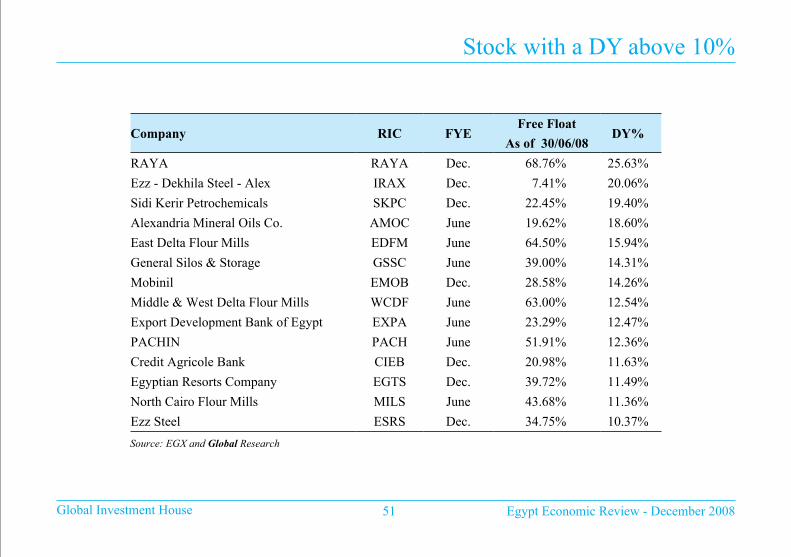
Stock with a DY above �0%
Company RIC FYEFree Float
DY%As of 30/06/08
RAYA RAYA Dec. 68.76% 25.63%
Ezz - Dekhila Steel - Alex IRAX Dec. 7.4�% 20.06%
Sidi Kerir Petrochemicals SKPC Dec. 22.45% �9.40%
Alexandria Mineral Oils Co. AMOC June �9.62% �8.60%
East Delta Flour Mills EDFM June 64.50% �5.94%
General Silos & Storage GSSC June 39.00% �4.3�%
Mobinil EMOB Dec. 28.58% �4.26%
Middle & West Delta Flour Mills WCDF June 63.00% �2.54%
Export Development Bank of Egypt EXPA June 23.29% �2.47%
PACHIN PACH June 5�.9�% �2.36%
Credit Agricole Bank CIEB Dec. 20.98% ��.63%
Egyptian Resorts Company EGTS Dec. 39.72% ��.49%
North Cairo Flour Mills MILS June 43.68% ��.36%
Ezz Steel ESRS Dec. 34.75% �0.37%
Source: EGX and Global Research

52 Egypt Economic Review - December 2008Global Investment House
To Sum Up
» Egypt is a safe investment destination in the coming period.
» The buoyant expected GDP growth of 6% in 2009 ensures considerable FDI inflows to Egypt mostly in
manufacturing sectors, as well as transportation, education and health care.
» Drops in International food and energy prices will save the country’s budget a considerable amount of
the subsidy bill, as well as push inflation rate downward.
» Being mostly on the low cash cost of production per ton of various industries will guarantee relatively
high profit margins for the companies on the Egyptian stock market.
» The strong fundamentals of many traded stocks on the Egyptian stock market and the current low price
levels will be the catalyst for these stocks to rebound to their historical average prices, once the 2009 Q�
results are announced.

This material was produced by Global Investment House KSCC (‘Global’),a firm regulated by the Central Bank of Kuwait. This document is not to be used or consideredas an offer to sell or a solicitation of an offer to buy any securities. Global may, from time to time,to the extent permitted by law, participate or invest in otherfinancing transactions with the issuers of the securities (‘securities’), perform services for or solicit business from such issuer, and/or have a position or effect transactionsin the securities or options thereof. Global may, to the extent permitted by applicable Kuwaiti law or other applicable laws or regulations, effect transactions in thesecurities before this material is published to recipients.Information and opinions contained herein have been compiled or arrived by Global from sources believed to be reliable, but Global has not independently verifiedthe contents of this document. Accordingly, no representation or warranty, express or implied, is made as to and no reliance should be placed on the fairness,accuracy, completeness or correctness of the information and opinions contained in this document. Global accepts no liability for any loss arising from the use ofthis document or its contents or otherwise arising in connection therewith. This document is not to be relied upon or used in substitution for the exercise of independentjudgement. Global shall have no responsibility or liability whatsoever in respect of any inac curacy in or ommission from this or any other document prepared byGlobal for, or sent by Global to any person and any such person shall be responsible for conducting his own investigation and analysis of the information containedor referred to in this document and of evaluating the merits and risks involved in the securities forming the subject matter of this or other such document.Opinions and estimates constitute our judgment and are subject to change without prior notice.Past performance is not indicative of future results. This documentdoes not constitute an offer or invitation to subscribe for or purchase any securities, and neither this document nor anything contained herein shall form the basisof any contract or commitment what so ever. It is being furnished to you solely for your information and may not be reproduced or redistributed to any other person.Neither this report nor any copy hereof may be distributed in any jurisdiction outside Kuwait where its distribution may be restricted by law. Persons who receivethis report should make themselves aware of and adhere to any such restrictions. By accepting this report you agree to be bound by the foregoing limitations.

Global Investment HouseTel: (965) 2295 1000 - Fax: (965) 2295 1299
Global Research