Embed Size (px)
Citation preview

Deepening Egypt-US Trade Integration: Economic Implications of Alternative Options*
Bernard Hoekman World Bank; Groupe d’Economie Mondiale, Instutut d’Etudes Politiques; and CEPR
Denise Eby Konan
University of Hawaii
January 18, 2005 JEL Classification: F13 Keywords: Free trade agreements, Egypt, U.S. trade policy, Arab League
* We thank Hans Lofgren and Jeff Nugent for constructive comments on an earlier draft. This paper was presented at the Middle East Economic Association session of the Allied Social Sciences Association 2005 Annual Meeting in Philadelphia. The views expressed are personal and should not be attributed to the World Bank.

1. Introduction
The history of trade performance of countries in the Middle East and North Africa
(MENA)—in particular trade in manufactures—has not been bright relative to that of
other regions of the world. The poor merchandise trade performance is usually attributed
to the fact that many MENA countries are large oil producers and/or pursued import
substitution policies, including nationalization of industry and high protection, resulting
in a large and inefficient public sector. Intra-regional integration was an important part of
the trade policy of many Arab countries, reflecting a desire to exploit scale economies on
a larger Arab market, but was unsuccessful and often not implemented. Starting in the
1980s, greater efforts were made to open up economies to international trade.
In the case of Egypt, unilateral reforms were pursued to remove quantitative
restrictions and lower tariffs. Efforts were also made to deepen regional integration
agreements (RIAs). Largely limited to bilateral agreements with Arab countries, in the
late 1990s these were complemented by more far-reaching agreements. These include
membership in the Greater Arab Free Trade Area agreement (GAFTA), negotiated in
1997 under Arab League auspices—under which all tariffs on goods of Arab origin are to
be removed, with full free trade to be achieved in 2005; an Association Agreement with
the EU that will remove all barriers to non-agricultural merchandise trade over a 12-year
period (signed in 2002); participation in the Agadir Declaration, establishing an FTA
between Jordan, Morocco, Tunisia and Egypt, with rules of origin that are similar to
those used in the bilateral Euro-Med agreements (signed in 2004);1 and membership of
the Common Market for East and Southern Africa (COMESA) in 2001. Once these
1 Although free trade between these countries will be achieved through GAFTA, the Agadir Declaration aims to facilitate trade and reduce hub-and-spoke trade/investment diversion incentives through the adoption of common rules of origin allowing full cumulation.
1

agreements are fully implemented, trade with the EU/MENA region will have been
substantially liberalized relative to trade with other regions in the world, most notably
Asia and the US.
Efforts to negotiate a FTA with the US were launched in the late 1990s to no
effect—agreement could only be reached on a so-called Trade and Investment
Framework Agreement (TIFA), concluded in 1999. More recently, trade agreements with
Arab countries have become a higher priority for the US (World Bank, 2003), as reflected
in the 2003 Middle East Free Trade Area Initiative. This encompasses TIFAs—aimed to
help develop the institutions and rules to integrate more fully into the global economy,
Bilateral Investment Treaties and comprehensive free trade agreements. The U.S. has
concluded FTAs with Israel, Jordan, Morocco, and Bahrain (the latter awaiting
Congressional ratification), and is planning to launch talks with Oman and the UAE in
2005. The objective is that bilateral FTAs will be expanded into sub-regional FTAs by
“bringing in willing countries that demonstrate a commitment to economic openness and
reform” (USTR website) with these sub-regional FTAs eventually being amalgated into a
Middle East Free Trade Area
Thus, regional integration is a major plank in the strategies of both MENA
countries and their major trading partners, the EU and the US. Analysis of the likely
implications of alternative types of agreements and their interaction (consistency,
sequencing, etc.) is therefore important. To date the RIAs that have been concluded have
had limited effects in terms of improved economic performance and growth. In part this
reflects the fact that agreements are of recent vintage, with the EU agreement not yet
having started to bite. But it is also the case that trade policy in general has remained
2

relatively protectionist, as is reflected in the position that has been taken by Egypt in
terms of implementing its GAFTA commitments: the government has indicated that it
will not adhere to the 2005 timetable because it is concerned that the rules of origin that
were negotiated are too liberal and are not being implemented by Arab partner countries.
Much also remains to be done in terms of transforming inefficient public enterprises and
reducing the size of the public sector.2 Related to this are governance challenges,
including a lack of transparency and high transactions costs. Many complementary,
“behind the border” reforms that affect economic performance directly and that will
determine the payoffs to (regional) trade reform have yet to be carried out. These reforms
include the liberalization of services sectors and measures to facilitate trade and
investment. As has been argued in the recent literature, absent action on this front,
regional integration initiatives may have limited benefits for Egypt and give rise to
high(er) adjustment costs (Hoekman and Konan, 2000; Konan and Maskus, 2004).
This paper analyzes the potential impacts of alternative types of FTAs between
Egypt and the US, taking into account the fact that Egypt is committed to implementing
bilateral free trade with the EU and achieve free trade with GAFTA members (in
merchandise) in the near future. Although progress on liberalizing trade between Egypt
and the US has been slow in the past, in December 2004, Egypt, Israel and the US signed
a Trade Partnership agreement that extends the benefits of the 1985 US-Israel FTA to
exports from three Qualified Industrial Zones (QIZs) in Egypt (covering parts of
Alexandria, Greater Cairo and Port Said). The QIZs offer duty free access to the US
2 As of March 2004, 197 profitable/viable public enterprises had been privatized, including through flotation of stock on the capital market, leaving 117 in public ownership, mostly loss-making. Privatization of these entities is being pursued in the context of a new strategy that includes incentives such as transferring outstanding debt and other liabilities to a holding company as well as tax holidays (ERF, 2004).
3

market for qualifying goods, including textiles and clothing, as long as they satisfy a 35
percent minimum local content requirement, one-third of which (11.7 percent) must
originate in Israel, one-third in the US and one-third in Egypt. QIZs were first established
in Jordan in 1997, largely motivated by a desire to foster greater trade between Israel,
Jordan and the West Bank/Gaza.3 The extension of the QIZ scheme to Egypt implies that
qualifying Egyptian firms have already been granted “close to FTA status” in the US
market. However, extending such access to all Egyptian firms would clearly be more
efficient and beneficial.
The plan of the paper is as follows. Section 2 discusses the benchmark data base
used in the analysis. Section 3 summarizes the structure of the model—with a somewhat
more technical description provided in the Appendix. In Section 4 we summarize the
alternative FTA options that are simulated. Results are discussed in Section 5. Section 6
concludes.
2. Egypt’s Economy and Benchmark Data
Egypt is one of the most populated of the MENA nations, with a population of 67.6
million. Classified as a middle-income country, Egypt had a per capita income of US
$1,390 and gross domestic product of US $ 93.9 billion in 2003. Annex Table 1 provides
the share of output, imports, exports, and household consumption in Egypt for 1997.4
3 Thirteen QIZs have been set up in Jordan, including one single-factory zone, of which 10 are privately-owned. The government of Jordan subsidizes the cost of utilities, communications facilities, and transport infrastructure and exempts firms located in QIZs from income and social security taxes. Exports from QIZs have boomed, and were projected to reach some US$ 800 million in 2004. Most of this comprises garments and constitute “new” exports—i.e., goods that were not exported prior to the creation of the QIZs. In the case of Jordan, the local content requirement is also set at 35% of the value of the imports. Originally the same ratio of 11.7 percent from Israel, Jordan and US and/or Jordan/Israel/West Bank/Gaza was required, but the Israeli content was reduced in 1999 to 8 percent (7% for high-tech products) following arguments that Israeli goods were too costly (Kardoosh and Al Khouri, 2004). 4 The base year used in the model is 1997, as this is the year for which we have a detailed social accounting matrix. Trade and tax and other policy variables are therefore also based in 1997 data. While this is clearly
4

Agricultural production is primarily in crops (10.9 percent) and animal (4.4 percent), with
cotton produced largely for export. Services account for over 46 percent of total output.
Important services sectors include trade finance and insurance (18.4 percent), transport
and communications (8.3 percent), and construction (7.9 percent). Nearly 46 percent of
household consumption is devoted to services, with trade, finance, and insurance
comprising 22.7 percent of total consumption. Food industries (13 percent) and crops (11
percent) also make up a significant share of household consumption.
Egypt’s imports are heavily focused on manufacturing products including
machinery (23.1 percent), transport devises (9.5 percent), processed food (9.2 percent),
and chemicals (8.2 percent). Services exports comprise 57 percent of total exports. The
importance of the Suez Canal explains the preeminence of transportation and
communications exports (25.8 percent). Trade, finance, and insurance exports account
for 17.5 percent of exports. Tourism is also an important component of trade with hotel
and restaurant exports comprising 12 percent of total exports. While petroleum exports
are significant, 14 percent of total, Egypt is far less reliant on natural resources trade than
other MENA countries such as the United Arab Emirates, Kuwait, Bahrain, and Saudi
Arabia. About 25 percent of exports are manufactured goods, of which 8.6 are in
clothing and textiles industries.
Annex Table 2 provides a decomposition of Egyptian imports and exports by
primary trading partners. Egypt’s trading patterns are relatively diverse, with no one
country or region comprising a majority share of overall trade. Of the key regions, EU
not desirable, there has been little change in the structure or pattern of trade since the late 1990s (ERF, 2004). However, there have been policy reforms, especially in terms of trade policy. These imply that the results obtained for unilateral trade liberalization discussed below will already to some extent be realized in coming years.
5

trade comprises the dominant share, with 36% of the country’s exports originated in the
EU and 35% of its exports went to the EU. Egypt relies heavily on the EU for imports of
livestock (83 percent of total animal products), glass (63 percent), chemicals (63 percent),
and minerals (62 percent). The EU is an important export destination for cotton spinning
(72 percent), base metals (68 percent), petroleum refining (59 percent), and mining (57
percent).
Egyptian trade links within the region are primarily in terms of exports to other
MENA countries. Exports to MENA comprise about 20 percent of all Egyptian exports.
Many light manufacturing goods are exported to MENA. Egypt is relatively less reliant
on imports from the region. With the exception of beverages, petroleum and refining,
imports from the region make up less than 20 percent of imports in any one sector. US
goods account for 17 percent of imports, primarily in agriculture (48 percent of imported
crops are from the US). While only seven percent of Egyptian exports go to the US, 49
percent of clothing exports are shipped to the US. Other non-reported trading partners
(countries in Asia, Africa, etc) are significant in certain areas such as exports of
petroleum and imports of transport equipment.
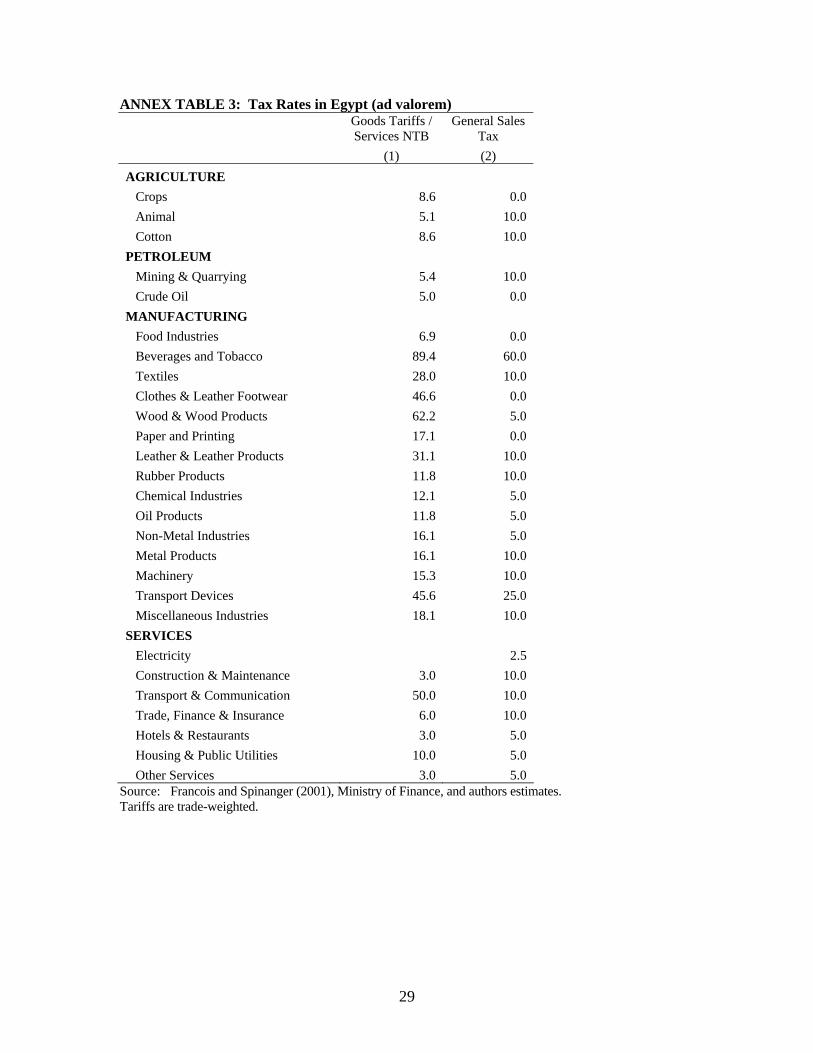
The major components of Egypt’s tax structure are given in Annex Table 3.
While Egypt has taken significant steps to reduce trade barriers, nominal rates remain
significantly above those in most developing countries. Tariffs on beverages (89
percent), wood products (62 percent), clothing (47 percent), transport devices (46
percent), and leather (31 percent) act as significant import barriers. Effective rates of
protection are quite high as intermediate goods tariffs tend to be lower than those placed
on final consumer goods (Refaat, 2000). In 2004 a tariff reform was implemented that
6

reduced the number of tariff bands to 6 (from 27) and removed import fees and
surcharges. Reports by the government indicated that the reforms would lower the
(weighted) average import tariff to 9 percent, and imply a reduction in tariff collections
of some LE 3 billion (American Chamber of Commerce, Business Monthly, October
2004). ERF (2004) argues that the net effect of these reforms was in part offset by a
revaluation of the exchange rate used for customs valuation purposes. However, the
recent reforms imply that the benchmark level of tariff protection used in the model is too
high, and that to some extent the simulated effects of unilateral reforms discussed below
will be realized in the coming years.5
The 2004 tariff reforms followed the decision in 2003 to allowed the pound to
float, following a cumulative devaluation of over 40 percent between 2001 and 2003
(ERF, 2004; IMF, 2004). These developments helped move the current account into
surplus, as in the 2001-2004 period exports expanded by 25 percent while imports
showed little change (in nominal terms).
An important source of revenue for the government is collections from the general
sales tax (GST) (Annex Table 3, Column 2). While tobacco and alcoholic beverages are
highly taxed for social reasons, most taxes are set at 5 and 10 percent (the GST was
extended to wholesale and retail trade in 2001). Transportation equipment (automobiles)
and certain durables such as TVs, cameras, VCRs, air conditioners, freezers and
refrigerators are exceptions, with GST rates of 25 percent. Food crops, processed foods,
clothing, and printing sales are not taxed.
5 The import-weighted average tariff in 2004 (before the reforms announced in September of that year) was 15.4 percent; the simple average tariff 20.5 percent (ERF, 2004). As discussed further below, the weighted average tariff used in the benchmark is 19.8 percent. While this is somewhat higher than the prevailing nominal tariffs in 2003-04, it is unlikely to be much of an overestimate given surcharges of up to 4 percent on imports.
7

3. Model Structure
The model used in this analysis of various trade liberalization scenarios is a static,
competitive applied general equilibrium model of the Egypt economy. Earlier versions
of this model have been used to analyze the EU—Egypt partnership agreement
(Hoekman and Konan 2001a, 2001b), Egypt tax policy liberalization (Konan and Maskus
2000), shallow and deep unilateral trade liberalization (Hoekman and Konan 2000), Arab
economic integration (Konan 2003), and services trade liberalization (Konan and Kim
2004). Thus, the model represents an established and well understood representation of
Egypt’s economic policy landscape.
The model provides static analysis of a range of policy changes including
alternative configurations of an Egypt—US trade agreement. The primary data sets are a
32 sector input output table and import matrix obtained from the Ministry of Planning of
the Government of Egypt. As described in the appendix, production involves domestic
and imported intermediates, labor, and capital. Imports and exports are distinguished by
region of origin and destination, respectively. A representative household maximizes
utility, given an income from primary factors, net government transfers, and a constant
real current account deficit.
As given in Annex Table 2, Egypt’s trade flows are broken down across four
major regions of the world (United States, European Union, and MENA) with all other
trade flows collected into a residual “rest of the world (ROW).” Statutory MFN tariffs,
scaled for consistency with reported tariff revenues, are assumed to apply to imports from
each of these regions in the benchmark case, Annex Table 3, column 1. These tariffs are
weighed across sub-sectors by global import shares. Sales of domestic commerce are
8

subject to the general sales tax (GST), Annex Table 3, column 2. The GST is assumed to
adjust endogenously by a constant proportion to maintain a revenue-neutral government
budget in the counterfactual scenarios.
As a relatively small economy, Egypt is assumed to be a price taker on world
markets. However, U.S. market access may be liberalized under certain bilateral
negotiations. Thus, several scenarios consider an improvement of Egypt’s export terms of
trade relative to the US. Annex Table 4 provides estimated benchmark rates of protection
maintained by the U.S. on imports of Egyptian commodities, drawn from Galal and
Lawrence (2003). From Egypt’s export perspective the most important sectors by far are
textiles and apparel—also the two sectors where barriers are highest in the US, 7.5 and 12
percent respectively (according to OECD 2004 the ad valorem equivalent of trade
restrictions on clothing in the US is 15 percent). The implementation of the WTO
Agreement on Textiles and Clothing on January 1 2005 will greatly change the structure
of the global market by abolishing all remaining quotas on exports of the most
competitive suppliers—most notably China. While this will reduce the potential rents
associated with duty free access to the US market, such access nonetheless will remain
valuable to preferred suppliers by providing a price advantage. Especially for countries
such as Egypt that are not among the lowest cost producers, a 12-15 percent price
advantage could be an important instrument to safeguard and expand market share in the
US.6
6 Whether and to what extent there will be continued export supply restrictions on China, whether “voluntary” or formal (safeguards, antidumping) remains to be seen. However, retailers have already indicated that they will be continuing to source from a wide variety of suppliers, in part to reduce supply uncertainty.
9

4. Trade Liberalization: Simulations and Results
There are several possible options for a preferential trade agreement between the U.S.
and Egypt. Egypt may focus narrowly on the liberalization of manufacturing tariffs.
Egypt may also use the agreement to remove or streamline non-tariff barriers, and reform
domestic taxes and regulations. The U.S. may or may not provide enhanced market
access for Egypt’s exports, especially in “sensitive” sectors such as apparel (although the
recent QIZ agreement suggests that this may well be feasible to include in an FTA).
Egypt may partner the U.S. agreement with other regional liberalization efforts, or pursue
‘across the board’, nondiscriminatory trade reforms in parallel with the implementation of
its RIAs.
Recognizing the range of policy choices, several trade liberalization scenarios are
analyzed with the model. These are summarized in Table 1. The scenarios begin by
setting forth the policy context in which trade liberalization is being contemplated.
Scenario 1 evaluates the recently signed EU – Egypt Partnership Agreement which will
be implemented in the coming decade. The EU agreement scenario is assumed to involve
elimination of Egyptian tariffs on EU goods and services, as well as an improvement in
Egypt’s export price on EU destined manufactured products of 1% for agriculture
products and 2% for clothing products. In scenario 2, the forthcoming implementation of
GAFTA is modeled whereby Egypt eliminates tariff barriers on MENA imports and, in
return, has barriers on MENA exports lowered by 3% on goods trade. Both the EU and
GAFTA agreements reflect piecemeal liberalization of tariff barriers as the US and other
trading partners are excluded. We consider the role that the US agreement might play in
unwinding the resulting distortionary preferential trading environment in Egypt in
10

scenario 3 by combining the EU and GAFTA agreements with a unilateral elimination of
tariffs on US imports. Scenario 4 expands the analysis to include multilateral and non-
discriminatory elimination of tariff barriers with all trading partners.
Scenario 5 is an asymmetric free trade agreement between the U.S. and Egypt
under which it is assumed that Egypt eliminates all tariffs on U.S. goods, without
reciprocal benefits in terms of access to U.S. markets. More realistic is a ‘shallow’
bilateral FTA. A potentially important aspect of a preferential agreement with the U.S. is
the improvement in market access that Egypt might gain. Significant U.S. tariffs and
quotas remain on many Egyptian products. The U.S. International Trade Commission
reports that of the top 100 products imported from Egypt (94% of total imports) only 16
products enter the U.S. duty-free. Of the remaining products, 22 face tariffs less than 5
percent, 29 face tariffs ranging from 5 to 15 percent, and 26 products face tariffs
exceeding 15 percent. As reported earlier, Galal and Lawrence provide tariff estimates
by industrial classification in Annex Table 4. Thus, scenarios six and seven involve
Egypt eliminating all tariffs on imports from the U.S., and the U.S. granting Egypt duty-
free and quota-free access to its markets. We assume that Egypt’s export price in U.S.
markets increases by the rates given in Annex Table 4. Recognizing the political
sensitivity of the clothing and textile markets, scenario six excludes free access in these
sectors while scenario seven allows it.7
Scenario eight scenario attempts to evaluate the effects of going beyond ‘shallow’
integration by eliminating not only tariffs but also the restrictive non-tariff barriers
(NTBs) that apply to both goods and service sectors in Egypt. The U.S. has been
7 As mentioned inn the Introduction, the fact that the 2004 QIZ agreement included apparel suggests that free access for this sector under a FTA should be feasible.
11

particularly insistent on such ‘deep’ liberalization in other preferential negotiations such
as that of NAFTA, the recent Central American FTA (CAFTA) and the agreement with
Jordan. It is assumed further that the elimination of NTBs is applied on a
nondiscriminatory basis. That is, all traders benefit from the associated cost reductions.
The survey study by Zarrouk (2003) estimates NTBs of around 5% in goods (15% for
MENA countries) and from 3% to 50% in services.8 We implement the removal of these
barriers in addition to Egypt and U.S. tariffs.
Tariffs revenues provide a significant share of the government budget in Egypt,
over 15 percent of tax revenues. Their reduction or elimination generates pressures to
increase other tax rates to maintain a level of government services. In all scenarios, it is
assumed that Egypt’s GST is adjusted proportionately to obtain a revenue-neutral policy
reform. However, the GST itself is a highly distortionary tax instrument (see Annex
Table 3). Certain types of capital equipment and consumer durables tend to be heavily
taxed, while crops and clothing enjoy GST exemptions. In scenario nine, we assume that
the deep US – Egypt agreement is expanded to include a domestic reform whereby GST
rates are set uniformly and then are proportionately scaled endogenously to ensure
revenue neutrality. It is important to note that this tax reform does not represent a
welfare-optimal policy. Significantly more analysis would be required to fully treat
domestic tax reform issues, see Konan and Maskus (2002) for more discussion.9
8 NTBs are assumed to be resource-using in nature. Following Konan (2001), services barriers are as follows: 3% in construction; 6% in trade, finance and insurance; 50% in transportation and communications; and 3% in other services. NTBs on goods trade have fallen substantially since the 1980s. The major remaining policy based NTB is due to “quality control” measures that affect 1,351 tariff lines (ERF, 2004). Transaction costs are also increased as a result on transport-related inefficiencies, high port charges, etc. 9 For example, as the GST is a sales tax rather than a value added tax instrument, pyramiding of the tax (taxing production both at the intermediate and final goods stages) will remain of concern. A uniform tax does not attempt to tax according to supply and demand elasticities.
12

Table 1: Summary of Trade and Tax Liberalization Scenarios Scenario 1 EU Agreement Baseline EU agreement. Egypt eliminates all tariffs
with the EU. The EU export price increases by 2% in clothing and agriculture, and 1% in other goods.
Scenario 2 GAFTA Greater Arab Free Trade Agreement. Egypt eliminates all tariffs with MENA trading partners. The export price to MENA countries increases by 3% in goods.
Scenario 3 US, EU, and GA Agreements Egypt implements the EU agreement and GAFTA, and additionally eliminates all tariffs with the US.
Scenario 4 Nondiscriminatory Tariff liberalization
Egypt implements the EU agreement and GAFTA, and additionally eliminates all tariffs with US and ROW.
Scenario 5 US FTA Egypt eliminates all tariffs with the US. Scenario 6 US FTA with improved TOT, excl.
clothing Egypt eliminates all tariffs with US. Additionally US grants improved market access in all sectors except clothing and textiles, with export prices to the US rising by levels given in Table 4.
Scenario 7 US FTA with improved TOT, incl. clothing
Scenario 6, plus US market access given in agriculture and clothing.
Scenario 8 Deep US FTA Scenario 7, plus Egypt eliminates NTBs Scenario 9 Deep US FTA with tax reform Scenario 8, plus Egypt sets uniform general sales
tax. Scenario 10 Deep US FTA with EU and GA
Agreements Scenarios 3 plus 8.
Scenario 11 Deep US FTA, EU FTA, and tax reform
Scenarios 3 plus 9.
Finally, the culmination of existing agreements and the potential agreements are
considered. Scenario ten involves combining a deep US trade agreement in which non-
tariff barriers are removed with the impending implementation of the EU and GAFTA
agreements. Scenario eleven extends deep trade liberalization to include reform of the
domestic tax structure, whereby the GST is set at a uniform revenue-neutral rate, but no
further changes are made to tariff.
Before discussing the simulation results, it is instructive to review the classic
argument by Viner (1950). Preferential tariff reductions implied by an FTA will have
two effects. First, members would import more products from firms located in the
relatively expensive partner country, rather than from cheaper, non-member suppliers –
13

trade diversion. This trade diversion is experienced as a loss in tariff revenue on imports
from non-member trading partners. Second, high-cost domestic production would be
replaced with purchases from relatively lower cost producers in member countries. Thus,
an FTA may raise or lower national welfare. There are other determinants of welfare in
preferential free trade agreement, such as the role of scale economies, investment, and
dynamics. However, the possibility that trade diversion may lower welfare in a FTA
remains informative—there is no presumption that a FTA will be beneficial.10
TABLE 2: Evaluation of Baseline Trade Reforms in Egypt
EU PartnershipScenario 1
GAFTA Scenario 2
US, EU, Arab
Scenario 3 MFN
Scenario 4 Macroeconomic Indicators (% change) Household welfare (EV) -0.24 -0.07 0.14 0.61 Real GDP 1.09 0.05 1.77 2.56 Consumer price index 0.24 0.07 -0.14 -0.60 Real Exchange Rate 1.93 0.17 2.63 3.56 Returns to capital -0.66 -0.10 -0.44 -0.13 Returns to labor 1.26 0.07 1.98 2.80 Tax rates (ad valorem) Weighted average tariff Bench: 19.8% 3.51 17.19 1.70 0.00 Weighted average GST Benchmark: 7.7 % 8.61 7.76 8.87 9.08
The simulation results in Table 2 provide an evaluation of the recently signed, but
not as yet implemented, EU Partnership Agreement and the Greater Arab Free Trade
Agreement. The EU agreement is limited in scope and focuses largely on tariff
reductions by Egypt on imports of manufactures (agriculture and services are excluded).
Table 2, Scenario 1, simulates the impact of the EU agreement whereby Egypt eliminates
10 See Schiff and Winters (2003) for a recent review of the theory and the empirical evidence.
14

tariffs on imports from the EU, and the EU reciprocates with enhanced market access. As
reported in previous work (Hoekman and Konan 2001a, 2001b), the limited EU
agreement is likely to be welfare reducing owing to its trade diversionary impacts. The
most comprehensive measure of standard of living is that of ‘household welfare,’ or the
real expenditures of Egypt residents, which we compute as the Hicksian equivalent
variation (EV) in the household expenditure function. In scenario 1, welfare (EV) falls
by 0.24 percent, real GDP increases by a modest 1.09 percent. Owing to trade diversion,
the importation of more expensive EU imports (relative to that of non-member trading
partners), raises the consumer price index slightly, by 0.24%. The EU agreement also
influences the ‘real exchange rate’, defined as the change in the home price index
sufficient to maintain a constant current-account deficit, taking world prices as given.
Thus, a rise in the real exchange rate is consistent with a depreciation of the Egyptian
pound, in that the per-pound price of foreign exchange rises. In the case of the EU
agreement, the real exchange rate increases by 1.93%. The EU agreement benefits
Egypt’s abundant factor, labor, as average wages increase by 1.26 %, at the expense of
the owners of relatively scarce capital, whose returns fall by 0.66%.
The other RIA to which Egypt is already committed is the GAFTA. Owing to the
rather small volume of trade between Egypt and other MENA countries the GAFTA has
limited economic impacts, as shown in Table 2, Scenario 2. Welfare and real GDP are
nearly unchanged with the former falling slightly as the latter increases.
It is against the backdrop of these two agreements that the addition of US trade
liberalization must be considered. Table 2, Scenario 3, captures the interaction of the EU
and GAFTA agreements with a simple agreement whereby Egypt eliminates tariff
15

barriers with the US. While the EU agreement (scenario 1) and the GAFTA (scenario 2)
are estimated to decrease welfare if conducted in isolation, when combined with a US
agreement, they have a slightly positive effect of increasing welfare by 0.14% and real
GDP by 1.77%. The expansion of US membership in the free trade arrangements
diminishes the trade diversionary aspects of the existing preferential agreements. Thus,
extension of free trade to the US is desirable by offsetting some of the detrimental trade
diversion introduced by the EU and GAFTA arrangements.
Of course, the same result can be achieved through a multilateral approach to
trade liberalization that is consistent with the most-favored nation (MFN) principle of the
World Trade Organization. Economic theory suggests that this should be superior to a set
of FTAs as it will eliminate trade diversion, although it does not generate the terms of
trade benefits that can be captured through FTAs (by improving access to partner country
markets). In Scenario 4, Egypt’s tariffs are eliminated multilaterally and non-
discriminately. MFN elimination of tariffs generates welfare gains of 0.61% and real
GDP increases of 2.56%. These are rather substantial gains in the context of static applied
general equilibrium models, and provide higher benefits then any of the bilateral
agreements or their combination. Thus, a set of FTAs spanning the EU, GAFTA and the
US, if limited to tariffs on merchandise, is inferior in welfare and efficiency terms to a
unilateral strategy of removing tariffs.
Table 3 reports the results of the Egypt – US Free Trade Agreement scenarios.
Five alternative scenarios are analyzed in Table 1. The first (column 1, scenario 5) is a
shallow integration agreement, limited to the unilateral elimination of Egypt’s tariffs on
U.S. products. Welfare is estimated to fall slightly, by 0.19 percent over benchmark
16

levels, which indicates that trade diversion losses are significant enough to outweigh
other sources of gain. Egypt’s real gross domestic product (GDP) or value added
increases modestly, by 0.69 percent. The consumer price index increases by 0.19%, and
the price of foreign currency (the real exchange rate) increases by 1.17%. The US
agreement favors labor (wages increase by 0.79 %), the relatively abundant factor of
production. Returns to capital fall modestly, by 0.43 %.
TABLE 3: Impact of Alternative Egypt – U.S. Free Trade Agreement Scenarios
US FTA
Scenario 5
US FTA w/ TOT, exc Cloth Scenario 6
US FTA w/ TOT,
incl ClothScenario 7
Deep US FTA
Scenario 8
Deep US FTA w/ Tax
Reform Scenario 9
Macroeconomic Indicators (% change) Household welfare (EV) -0.19 -0.19 -0.17 1.27 1.80 Real GDP 0.69 0.69 0.71 1.68 1.51 Consumer price index 0.19 0.19 0.17 -1.25 -1.77 Real exchange rate 1.17 1.17 1.16 1.68 1.42 Returns to capital -0.43 -0.43 -0.41 0.84 0.72 Returns to labor 0.79 0.79 0.81 1.75 1.53Tax rates (ad valorem) Weighted average tariff Bench: 19.8% 7.50 7.50 7.50 7.34 7.08 Weighted average GST Benchmark: 7.7% 8.30 8.30 8.30 8.15 8.04
While the macroeconomic changes of the shallow agreement are rather limited,
the impact on tariff collections is more substantial. The trade-weighted average tariff
falls from an initial rate of 19.8% to the post-reform rate of 7.5%. As the GST is a broad-
based tax, recovery of lost tariff revenues requires an increase in the weighted average
rate from 7.7% to 8.3%. Note that because the GST varies across sectors with some
sectors exempt from taxation and the endogenous adjustment in the tax is applied on a
proportionate basis, the GST increase is approximately equivalent to a seven percent
17

increase in marginal rates. In terms of macroeconomic effects, the EU partnership
agreement and the US FTA, if enacted in isolation, yield comparable results.
Figure 1: Egypt Imports, Trade Creation and Diversion by Region (US $mil)
0 2,000 4,000 6,000 8,000 10,000 12,000
Agriculture - US
Agriculture - EU
Agriculture - MENA
Agriculture - ROW
Manufacturing - US
Manufacturing - EU
Manufacturing - MENA
Manufacturing - ROW
Services - US
Services - EU
Services - MENA
Services - ROW
BMKUSS
Figure 1 plots the impacts on Egypt’s imports by major partner region under the
benchmark scenario and Scenario 5, the shallow free trade agreement with the US.
Relative to the benchmark, the value of imports from the US are nearly doubled in
agriculture (from US $ 797 to US $ 1,225 million) and tripled in manufacturing (from US
$ 3,145 to US $ 10,682 million). Services imports decline somewhat as they are not
subject to tariffs in either scenario. However, the expansion of US imports comes at the
expense of imports from other regions. Purchases from the EU, MENA, and ROW
decline sharply. Hence, it appears that the US free trade agreement provides a scope for
18

trade diversion, and thus diminishing welfare, if implemented in isolation and not
coupled with other reform measures.
Part of the attraction of a preferential agreement is the promise of enhanced
access to U.S. markets. Scenarios 6 and 7 of Table 3 consider two possibilities under
which the U.S. grants improved access, without and with inclusion of clothing/textiles,
respectively. The provision of U.S. market access improves the benefits of the FTA
somewhat, in terms of both household welfare and real GDP, but only slightly. It is
striking that there appears to be very little macroeconomic difference between an
agreement that improves access to the U.S. apparel market (modeled as an increase in the
export price of clothing by 12%) (scenario 7) and one that excludes apparel (scenario 6).
Egyptian real GDP expands very modestly more (0.71% rather than 0.69%) when
clothing is included in the agreement. This may seem small. However, it is important to
note that Egypt’s exports of clothing to the U.S. more than double in Scenario 3, from
benchmark levels of $432.3 million to $926.9 million. Nonetheless, in aggregate terms
this impact is small in the context of an $11.2 billion economy. The limited ability of
Egypt to respond to the enhanced terms of trade with the US appears to be attributable to
domestic conditions and capacity constraints. Prior to 2005, U.S. clothing quotas on
Egyptian exports were often not filled (ERF, 2004; Kheir El Din and El Sayed, 1997;
Kheir El Din, 2000), and a substantial supply expansion may be unlikely without
complementary reforms within the domestic economy.
While not included in the simulation results, there is likely to be substantial scope
for inward foreign investment insofar as preferential access to American markets is
viewed as particularly advantageous by investors relative to other global options. The
19
potential for such investment and an associated expansion of exports of apparel is
illustrated by the experience of Jordan, where as noted previously, exports of garments to
the US grew from negligible levels to almost $800 million in the six year period
following the implementation of the QIZ arrangement. The simulated export supply
response obtained with the model may therefore be an underestimate of what may arise
once allowance is made for additional inward investment into textiles and clothing
production for the US market. That said, it is obviously also important to take into
consideration that there will be greater competition from rest of the world suppliers in the
US market as well, due to the removal of remaining quotas in 2005.
It is unlikely that a FTA with the United States would be limited to a shallow
arrangement. Recent US trade agreements have included measures related to national
treatment for investment, services, and government procurement. The US will likely also
insist on disciplines that extend to domestic regulatory procedures. Scenario 8, a “deep”
FTA, simulates the elimination of non-tariff barriers on trade in goods and services, in
addition to a reciprocal removal of Egypt and US tariffs. It is assumed that NTBs are
eliminated with all trading partners, rather than primarily with the US, as internal
regulatory procedures converge with global practices. This deeper FTA has a positive
impact on welfare, and household EV (welfare) increases 1.27 percent. Output also
increases, by 1.68 percent in value added or real GDP. The consumer price index falls by
1.25 percent as the cost of imports and regulatory costs decline and the real exchange rate
20

increases by 1.68 percent. The FTA combined with regulatory reform benefits both
capital owners and labor.11
Rounding out the US Egypt FTA scenarios is the possibility of linking the trade
liberalization to a reform of the domestic tax structure. Scenario 9 assumes that a deep
US FTA is combined with the establishment of a uniform general sales tax which is
applied to both domestic and foreign sales. Coupling trade and tax reform is highly
beneficial, with household welfare increasing by 1.8 percent and real GDP by 1.51
percent. Consumer prices fall by 1.77 percent as production costs are lowered.
TABLE 4: Non-Discriminatory Trade Liberalization Scenarios
MFN
Scenario 5
MFN and Deep US FTA Scenario 10
Macroeconomic Indicators (% change) Household welfare (EV) 0.6 2.1 Real GDP 2.6 3.6 Consumer price index -0.6 -2.1 Real exchange rate 3.6 4.2 Returns to capital -0.13 1.2 Returns to labor 2.8 3.95Tax rates (ad valorem rate) Weighted average tariff Bench: 19.8% 0.0 0.0 Weighted average GST Benchmark: 7.7 % 9.1 8.95
Table 4 reports the results of trade liberalization scenarios conducted on a
multilateral basis. To set a base of comparison, the result of a shallow non-
discriminatory (most-favored nation, MFN) removal of tariff barriers, scenario 5, is
repeated in Table 4. In Scenario 10, Table 4, MFN tariff liberalization is extended to
11 Note that this ‘deep’ integration scenario is limited to the abolition of NTBs and does not extend to domestic regulatory reforms that improve the efficiency of domestic service markets. Previous work by the authors suggests that the latter will generate much larger gains.
21
include the elimination of non-tariff barriers, as might be negotiated in an FTA with the
US. Relative to the small welfare gain of ‘shallow’ MFN removal of tariffs, the
elimination of NTBs serves to substantially improve welfare, which rises by 2.1%. Real
GDP rises by 3.6% and consumer prices fall by 2.1%. Both factors of production gain in
real terms, with returns to capital increasing by 1.2% and to workers by 3.8%. Because
of the expansion in economic production, the increase in the GST tax rate required to
make up the elimination of tariff revenues is rather modest, with rate increasing from a
weighted average of 7.7% to 8.9% under the reform.
As mentioned, the deep integration scenarios ignore the potential effects of using
an FTA with the US as a commitment mechanism to pursue domestic regulatory reforms
in the services sectors. Hoekman and Konan (2000) and Konan (2003) show that
domestic reforms that reduce the ‘costs of doing business’ (lower input costs) could have
a far greater beneficial impact on Egypt than discriminatory trade liberalization. This
suggests consideration should be given to identifying reforms that can be committed to
(‘locked in’) through a trade agreement with the US. Of great importance in this
connection is that insofar as such reforms involve allowing foreign firms free access to
the Egyptian market they should be implemented on a nondiscriminatory basis. Providing
better access only to preferred partners, be they US or of other origin (EU, Arab) will
lower the gains from reform by reducing the extent of competition on the market.12
12 Because services often cannot be traded, increasing access to domestic service markets is likely to require the entry of foreign competitors through FDI. This will have two effects: a reduction in what Konan and Maskus (2003) call the cartel effect—the markup of price over marginal cost that incumbents are able to charge due to restricted entry; and an attenuation of what they call the cost inefficiency effect—the fact that in an environment with limited competition marginal costs of incumbents are likely to be higher than if entry were allowed. Pro-competitive reforms can then have major impacts on economic performance as many services are critical inputs into production.
22

5. Concluding remarks
A free trade agreement with the US will have positive effects on the Egyptian economy,
but these are not likely to be large unless complementary domestic reforms are pursued.
An FTA of whatever stripe, shallow of deeper, would be beneficial because it leads to
unwinding of some of the trade diversion that is created by the EU and GAFTA
agreements. But benefits are limited by the fact that the FTAs jointly will continue to
generate trade diversion. Noteworthy is the finding that the overall export supply
responses to better access to the US market will be limited. In some cases, e.g., clothing,
the model may underestimate the potential gains export and employment gains, although
no account has been taken of the impact of the abolition of the global quota regime as of
2005. Even abstracting from this, however, the simulations may well be realistic in terms
of orders of magnitude given that there are supply capacity constraints, associated in part
with high operating and input costs for firms located in Egypt. There will also continue to
be significant anti-export bias as a result of relatively high external protection and
effective rates of protection. A good illustration of these constraints is the limited
response that occurred in the 2001-2004 period, during which the Pound/US$ exchange
rate depreciated by over 70 percent in nominal terms but exports expanded by only 25
percent.
Much depends of course on the specifics of any FTA, including not only the
extent of coverage of sectors such as services and agriculture, but also matters such as the
rules of origin included in an agreement. As noted, actions to undertake reforms to
improve the efficiency of services sectors and reduce input costs are likely to generate
benefits that are a multiple of those that will result from merchandise trade liberalization
23

alone, especially if limited to partial, preferential liberalization. Rules of origin have
proven to be an important determinant of the value of preferential access to markets—
recent research has demonstrated that restrictive rules of origin can imply a continued
‘tariff equivalent’ in the 3-5 percent range (Brenton and Imagawa, 2003).
Nondiscriminatory liberalization of trade is needed to remove prevailing anti-
export biases. As illustrated by the results of the unilateral trade liberalization scenario,
this would have a greater positive effect on aggregate real GDP (output) than any of the
FTA scenarios. If unilateral reforms extend to abolition of NTBs in Egypt the positive
impacts on welfare would rise substantially relative to removal of tariffs, given that the
former are resource using. As mentioned, the government launched further unilateral
trade reforms in September 2004. Our analysis suggests that this strategy is both
important and appropriate. While further regional integration, including a FTA with the
US, can help in enhancing access to markets abroad, continued lowering of import
barriers on a nondiscriminatory basis offers the greatest potential in terms of economic
payoffs for Egypt.
24

REFERENCES
Brenton, Paul and Hiroshi Imagawa (2003) ‘Rules of Origin, Trade, and Customs’ in de Wulf, Luc and Jose Sokol (eds) (2004) Customs Modernization Handbook, Washington, DC: World Bank. Economic Research Forum (ERF). 2004. The Road Ahead for Egypt. Egypt Country Profile, December. Cairo: ERF.
Galal, Ahmed and Robert Lawrence, 2003, Egypt—US and Morocco—US Free Trade Agreements, Egyptian Center for Economic Studies, working paper number 87.
Hoekman, Bernard and Denise Eby Konan, 2001a, Deep Integration, Nondiscrimination and Euro-Mediterranean Free Trade, in J. von Hagen and M. Widgren, editors, Regionalism in Europe: Geometries and Strategies After 2000, Boston/Dordrecht/London: Kluwer Academic Publisher.
Hoekman, Bernard and Denise Eby Konan, 2001b, Overlapping Free Trade Agreements and the Middle East and North Africa: Economic Incentives and Effects on Egypt, Julia Devlin, Sebastien Dessus, and Raed Safadi, editors, Towards Arab and Euro-Mediterranean Regional Integration Paris: OECD.
Hoekman, Bernard and Denise Eby Konan, 2000, Rents, Red Tape and Regionalism: Economic Effects of Deeper Integration, in B. Hoekman and J. Zarrouk, editors, Catching Up with the Competition: Trade Policy Challenges and Options for the Middle East and North Africa, Ann Arbor: University of Michigan Press.
Hoekman, Bernard, Denise Eby Konan, and Keith Maskus, 1998, “An Egypt-U.S. Free Trade Agreement: Economic Incentives and Effects,” in Ahmed Galal and Robert Lawrence, editors, Building Bridges: An Egypt-US Free Trade Agreement, Washington D.C.: Brookings Institution Press.
Khardoosh, Marwan and Riad Al Khouri. 2004. “Qualifying Industrial Zones and Sustainable Development in Jordan,” mimeo. Kheir-El-Din, Hanaa and Hoda El-Sayed . 1997 Potential Impact of a Free Trade Agreement with the EU on Egypt’s Textile Industry, in A. Galal and B. Hoekman, editors, Regional Partners in Global Markets: Limits and Possibilities of the Euro-Med Agreements. London: CEPR.
Kheir El Din, H. 2000. Egypt’s exports under liberalization: Performance, prospects and constraints (1980-1998). In H. Nassar & A. Aziz, eds. Egyptian exports and challenges of the 21st century. Cairo, Center for Economic and Financial Research and Studies, Cairo University.
Kheir-El-Din, Hanaa, 2000, Enforcement of Product Standards as Barriers to Trade: The Case of Egypt, in B. Hoekman and H. Kheir-El-Din, editors, Trade Policy Developments in the Middle East and North Africa, Washington D.C.: World Bank.
25

Konan, Denise Eby, 2003, Alternative Paths to Prosperity: Trade Liberalization in Egypt and Tunisia, in A. Galal and B. Hoekman, editor, Arab Economic Integration: Between Hope and Reality, Center for Economic Policy Research in Europe (CEPR) and Brookings Institution.
Konan, Denise Eby and Keith E. Maskus, 2003a, Quantifying the Impact of Services Liberalization in a Developing Country, World Bank Working Paper.
Konan, Denise Eby and Keith E. Maskus, 2003b, Bilateral Trade Patterns and Welfare: An Egypt-EU Preferential Trade Agreement, manuscript.
Konan, Denise Eby and Keith E. Maskus, 2000, Joint Trade Liberalization and Tax Reform in a Small Open Economy: The Case of Egypt, Journal of Development Economics 61(2).
Konan, Denise Eby and Keith E. Maskus, 1997, A Computable General Equilibrium Analysis of Egyptian Trade Liberalization Scenarios, in: Regional Partners, Global Markets: Limits and Possibilities of the Euro-Mediterranean Agreements, Ahmad Galal and Bernard Hoekman, editors, London, Center for Economic Policy Research in Europe (CEPR) and Brookings Institute.
Maskus, Keith E. and Denise Eby Konan, 1997, Egyptian Trade Liberalization, Review of Development Economics, 1(3).
Refaat, Amal, 2000, Egypt: An Assessment of Recent Trade Policy Developments, in B. Hoekman and Hanaa Kheir-El-Din, editors, Trade Policy Developments in the Middle East and North Africa, Washington D.C.: The World Bank.
Rutherford, Thomas F., E. Elisabet Rutström, and David Tarr, 1997, Morocco’s free trade agreement with the EU: A quantitative assessment, Economic Modeling (14) 237-269.
Schiff, Maurice and L. Alan Winters. 2003. Regionalism and Development. Washington DC: World Bank.
Shoven, John B. and John Whalley, 1992, Applying General Equilibrium, Cambridge Surveys of Economic Literature, New York: Cambridge University Press.
Viner, Jacob, 1950, The Customs Union Issue. New York: Carnegie Foundation for International Peace.
World Bank, 2001, Egypt Social and Structural Review, Social and Economic Development Group, Middle East and North Africa Region, Report No 22397-EGT.
Zarrouk, Jamel, 2003, A Survey of Barriers to Trade and Investment in Arab Countries, in A. Galal and B. Hoekman, editor, Arab Economic Integration: Between Hope and Reality, Center for Economic Policy Research in Europe (CEPR) and Brookings Institution.
26

ANNEX TABLE 1: Structure of Economy in Egypt
Output Imports Exports Household
Consumption (1) (2) (3) (4) TOTAL (US $ Million) 112,523 20,778 15,235 55,640 AGRICULTURE Crops 10.88% 8.45% 1.24% 10.59% Animal 4.43% 0.25% 0.09% 6.41% Cotton 1.15% 0.07% 1.31% 0.13% PETROLEUM Mining & Quarrying 0.18% 0.00% 0.14% 0.06% Crude Oil 4.09% 1.41% 14.68% 0.04% MANUFACTURING Food Industries 8.32% 9.23% 2.75% 12.94% Beverages and Tobacco 1.58% 0.48% 0.31% 2.93% Textiles 4.33% 2.19% 5.31% 3.66% Clothes & Leather Footwear 4.54% 1.74% 3.37% 7.59% Wood & Wood Products 0.98% 2.78% 0.37% 1.40% Paper and Printing 1.22% 2.17% 0.22% 1.24% Leather & Leather Products 0.32% 0.37% 0.15% 0.17% Rubber Products 0.15% 1.26% 0.04% 0.13% Chemical Industries 2.46% 8.23% 3.03% 1.48% Oil Products 3.19% 0.94% 8.35% 1.12% Non-Metal Industries 2.28% 1.82% 0.25% 1.24% Metal Products 0.01% 6.55% 0.06% 0.02% Machinery 1.15% 23.14% 0.20% 1.06% Transport Devices 1.37% 9.50% 0.05% 1.64% Miscellaneous Industries 0.62% 0.83% 0.66% 0.23% SERVICES Electricity 1.83% 0.07% ---* 0.89% Construction & Maintenance 7.86% 0.03% ---* 0.00% Transport & Communication 8.26% 3.48% 25.85% 6.90% Trade & Finance & Insurance 18.41% 1.58% 17.47% 22.68% Hotels & Restaurants 1.98% ---* 11.92% 0.68% Housing & Public Utilities 1.52% ---* ---* 3.05% Other Services 6.91% 13.40% 2.17% 11.73% TOTAL 100.00% 100.00% 100.00% 100.00%
Source: 1997 Input-Output Table, Ministry of Planning, Government of Egypt, Comtrade data 1997. Notes: * Not traded
27

ANNEX TABLE 2: Trade Shares in Egypt US Trade Share MENA! Trade Share EU@ Trade Share Imports Exports Imports Exports Imports Exports
AGRICULTURE Crops Animal Cotton
47.9
0.0 16.5
1.5 2.3
13.4
2.2 9.6 1.2
63.5 53.0 14.1
11.7 82.7 36.9
27.0 35.2 49.3
PETROLEUM Mining & Quarrying Petroleum
14.8
7.0
9.2 4.6
3.5
24.4
21.4 1.0
17.7 52.0
56.8 30.6
MANUFACTURING Food processing Beverages Tobacco Cotton spinning Clothing Leather Shoes Wood Furniture Paper Chemicals Petroleum refining Rubber, plastics Porcelain Glass Mineral Base metals Machinery Transportation Other
10.6 16.3 27.4
7.1 0.9 0.9 2.9 1.4
34.7 17.1 12.2
6.2 20.4
7.8 5.3 3.8
11.8 17.4 12.1 11.2
4.5 0.0 0.7
10.9 49.1 1.5 1.9 0.1
10.6 0.8 3.5 0.6 0.7 1.5 5.5 2.0 1.9 3.9 0.3 3.2
2.3
28.5 2.5 3.7
19.1 13.8 12.0
0.4 1.4 2.9 7.9
28.9 9.8
11.5 3.6 2.2 9.0 2.4 0.7 3.5
49.3 87.6 45.3 6.1 8.6
30.9 60.5 86.1 58.5 91.7 39.4 7.2
45.3 32.4 62.1 80.9 24.3 58.0 89.8 62.5
40.3 41.7 27.0 33.4 12.4 25.7 16.0 39.8 57.0 46.8 62.6 48.4 42.8 47.4 63.3 61.6 35.5 59.4 33.8 47.6
20.1 1.2 0.4
72.4 34.7 48.8 20.5 1.5
14.9 1.6
31.3 58.5 41.3 42.2 9.3 4.8
68.3 9.5 3.6
25.4 Notes: @Including Turkey; ! Excluding Israel. Source: Maskus and Konan 1997.
28
ANNEX TABLE 3: Tax Rates in Egypt (ad valorem)
Goods Tariffs / Services NTB
General Sales Tax
(1) (2) AGRICULTURE Crops 8.6 0.0 Animal 5.1 10.0 Cotton 8.6 10.0 PETROLEUM Mining & Quarrying 5.4 10.0 Crude Oil 5.0 0.0 MANUFACTURING Food Industries 6.9 0.0 Beverages and Tobacco 89.4 60.0 Textiles 28.0 10.0 Clothes & Leather Footwear 46.6 0.0 Wood & Wood Products 62.2 5.0 Paper and Printing 17.1 0.0 Leather & Leather Products 31.1 10.0 Rubber Products 11.8 10.0 Chemical Industries 12.1 5.0 Oil Products 11.8 5.0 Non-Metal Industries 16.1 5.0 Metal Products 16.1 10.0 Machinery 15.3 10.0 Transport Devices 45.6 25.0 Miscellaneous Industries 18.1 10.0 SERVICES Electricity 2.5 Construction & Maintenance 3.0 10.0 Transport & Communication 50.0 10.0 Trade, Finance & Insurance 6.0 10.0 Hotels & Restaurants 3.0 5.0 Housing & Public Utilities 10.0 5.0 Other Services 3.0 5.0
Source: Francois and Spinanger (2001), Ministry of Finance, and authors estimates. Tariffs are trade-weighted.
29

ANNEX TABLE 4: U.S. Ad Valorem Rates of Protection on Commodity Imports from Egypt
US Ad Valorem Protection Rate
on Egypt Imports Crops 3.9% Animal 3.9% Cotton 3.9% Mining & Quarrying 0.5% Crude Oil 0.5% Food Industries 7.0% Beverages and Tobacco 1.0% Textiles 7.5% Clothes & Leather Footwear 12.0% Wood & Wood Products 1.9% Paper and Printing 0.0% Leather & Leather Products 1.0% Rubber Products 1.0% Chemical Industries 2.9% Oil Products 1.0% Non-Metal Industries 1.0% Metal Products 1.2% Machinery 1.0% Transport Devices 1.0% Miscellaneous Industries 1.0%
Galal and Lawrence, 2003.
30

Appendix: The CGE Model The CGE model is extended, with updated data, from that used in the study by Konan (2003), which considers alternative goods and services trade liberalization scenarios for Egypt and Tunisia including the possibility of enhanced cooperation among Arab League countries. The present paper examines sectoral level impacts, which are not otherwise available, and extends the comparative analysis. The Egyptian Input-Output and trade data have also been updated. This paper builds upon a growing literature on trade liberalization among MENA countries including Konan and Maskus (2003a, 2003b, 2000, 1997), Hoekman and Konan (2001a, 2001b, 2000), Hoekman, Konan, and Maskus (1998), and Maskus and Konan (1997), Rutherford, Ruström, and Tarr (1997) . Previous research concerns regional integration, domestic and international taxation, bilateral trade patterns, services liberalization, and the role of regulatory and other non-tariff barriers. In the present study, the economy of Egypt is modeled as a system of nonlinear equations which explain industry-level production, factor employment, and intermediate and final demand. The countries assumed to be small price-taking economies, engaged in trade with the EU and the rest of the world (ROW). That is, domestic policy changes are deemed not to significantly alter their terms of trade with various trading partners. Among the special features of the model are the specific treatment of barriers to trade and investment in services sectors and the endogenous treatment of instruments of taxation with revenue-neutral government budgeting. The model is implemented in GAMS (Brooke et all 1988). Final output in sector i, Yi, is produced according to a nested Leontief – CES (constant elasticity of substitution) production function of intermediate inputs, zji for sectors j= 1, . . ., n, and real value added Vi. (1) Yi = min [z1i/a1i, . . . ,zni/ani,Vi/aVA] Value added, Vi, is comprised of labor, Li, and other primary factors, Ki. In the case of Egypt, labor is further decomposed into a CES nest of production and non-production labor, not shown. (2) Vi = [aLiLi
(σi-1)/σi + aKiKi(σi-1)/σi]σi/(σi-1)
In export sectors, the production for the domestic market Di is distinguished between that for export Xi according to a two-tier nested constant elasticity of transformation (CET) frontier. (4) Yi = [αDiDi
(εi-1)/εi + αXiXi(εi-1)/εi] εi/(εi-1)
The second-tier CET-nest aggregates total exports, Xi, from exports by destination, xri, indexed by r (EU, MENA, US, and ROW). (5) Xi = [Σrβrixri
(ei-1)/ei]ei/(ei-1)
Intermediate, zji, and final demand, cj, in sector j is differentiated by country of origin. Domestic output, dji, DjC, region r imports, mrj, and total imports Mj are aggregated in the following nested Armington CES functions: (3) zji = [γdjdji
(ηj-1)/ ηj + γmjMj(ηj-1)/ ηj] ηj/(ηj-1)
31

cj = [φDjDjC(ψi-1)/ ψi + φMjMj
(ψi-1)/ ψi] ψi/ψi-i
where composite intermediate and final imports, respectively, Mj
i and MjC, are given by the
following: (4) Mj = [Σrδrjmrji
(ηi-1)/ ηi] ηi/(ηi-1)
Mj
C = [Σrδrjmrj
C (ηi-1)/ ηi] ηi/(ηi-1)
With constant returns to scale production firms behave competitively in goods markets, implying that price, pi, equals marginal cost, ci, for output within sector i. The domestic policy environment is reflected by taxes and barriers which influence firm decisions including: government revenue producing tariffs on sector j imports from region r, trj; resource-using barrier on imports in sector j, uj, (uj = 0 for non-service sectors); a resource-using barrier on services output due to inefficiencies λi (λi = 0 for non-service sectors); an economic rent, vj, or markup generated from imperfectly competitive services markets (vj = 0 for non-services sectors); and a tax on primary input value added,τVi. (5) (1 + λi)ciYi = Σj(1 + vj)pjdji + ΣjΣr(1 + uj + trj)prj
mmrji + (1 + τVi)(wKKi + wLLi) In the models, private household expenditures are determined by a representative agent with a multi-nested CES utility function. This allows the agent to make separable multi-staged budget decsions. In the top-tier budgeting decision the income elasticity is assumed to be unity with a Cobb-Douglas nested utility function (U = ΠiCi
bi ; Σibi = 1) and a constant share of income is spent on the composite commodity. The second budgeting stage involves the consumer deciding how much to spend on domestic versus imported commodities, equation 3. Finally, the share of imports from each region is determined by equation 4. Private households receive income generated by returns to endowments of labor, EL, and other value added, EK. Households receive rent transfers from their ownership of imperfectly competitive services sectors, viYi. Households support a government budget deficit, D, and engage in savings through exogenously fixed investment instruments, Ii. (6) Σi ~pi
C Ci = wKEK+ wLEL + - ΣipiIi - D + Σi viYi
The model simplifies the treatment of government and intertemporal decisions. The government is assumed to spend based on a fixed real income, with preferences reflecting those of households. A lump-sum tax adjusts endogenously in response to policy shocks to maintain a revenue-neutral government budget. Similarly, real private investment in each sector, Ii, is exogenously fixed at the benchmark level. As noted above, import and export prices are exogenous following the small-economy assumption. The real current account balance, B, is exogenously given at international prices are assumed to be exogenous. That is, the volume of trade adjusts endogenously to ensure a constant real current account. (7) B = ΣiΣr pri
x xri – ΣiΣj Σr pri
m mrij - Σi Σr pri
m mriC
It is important to note that key identities hold as the optimizing behavior of agents assures that income will equal expenditures. Markets clearance is achieved for all commodities and factors. Household and government budgets are balanced given exogenous real benchmark transfers. The
32

value of imports equals the value of exports, net of real capital flows. In this Arrow-Debreu type model, Walras law is satisfied and, given a numeraire, a unique set of real prices is determined in each scenario. These identities are fully documented in Konan (2003).
33