Embed Size (px)
Citation preview

1
Efficiency and Its Influencing Factors Analysis of E-commerce
based on DEA and Tobit Model
Hongmei Shana* Xueyuan Xiaoa Jing Shib*
a Department of E-commerce & Logistic Management, College of Posts and Logistics, Xi’an
University of Posts and Telecommunications, Xi’an, Shaan xi 710121, China
b Department of Mechanical and Materials Engineering, College of Engineering & Applied Science,
University of Cincinnati, Cincinnati, OH 45221, USA
*Corresponding author: [email protected](H.Shan).
[email protected](J.Shi)
Abstract
The study analyzes the efficiency of electronic commerce and discusses the influence factors that
affect the efficiency of electronic commerce, further puts forward some suggestions to improve the
efficiency. The paper uses DEA model to evaluate the technical efficiency, scale efficiency and pure
technical efficiency of 60 e-commerce enterprises listed in China in 2013-2016. Furthermore, the
influencing factors of the efficiency of e-commerce are analyzed by using panel data based on Tobit
regression model. The results of DEA model show that the e-commerce efficiency is lower and the
resource allocation of e-commerce is not optimal. The trend of efficiency value is shaped “S”, there are
two obvious inflection points in trend lines. Moreover, the efficiency of Business to Business (B2B) is
almost completely close to the average of e-commerce industry in China. The efficiency of Business to

2
Customer (B2C) and cross border e-commerce (CBEC) are relatively higher than the average of
e-commerce industry, but Online to Offline (O2O) is lower than the average. The results of Tobit
regression model show that the firm size, asset turnover, shareholding ratio of maximum shareholder,
industry scale and the market concentration ratio have a statistically positive relation with e-commerce
efficiency. Besides, different influencing factors have different impact on different type of e-commerce.
This paper indicates the direction for government to focus on the development of Business to Customer
and cross-border e-commerce enterprise attribute to their efficiency is higher than the industry average.
On the other hand, we provide suggestions for the managers of e-commerce enterprise to improve
efficiency. Such as expending firm scale by purchasing and merger, improving service quantity to
increase sales and increasing corporate governance efficiency and performance by improving the
shareholding proportion of the largest shareholder.
Keywords
E-commerce; Technical efficiency ; DEA model; Tobit model
1. Introduction
The new round of scientific and technological revolution is leading to major transformation in
economic structure, deeply changes the way of production and life of human, and greatly promotes the
birth of new technologies, new products, new industries, new formats and new models. Recently, the
rapid development of electronic commerce (EC) in China has drawn the attention of practitioners and
researchers. The global influence of China’s EC has been growing, and China has become the largest
online retail market – the transaction volume in China now accounts for 39.2% of the global scale.
Among the various EC models, such as Business to Business (B2B), Business to Customer (B2C),
Customers to Customer (C2C), Online to Offline (O2O) and Cross-border e-commerce (CBEC), B2B

3
and B2C are the dominant forms in China’s EC market, accounting for more than 90% of transaction
volume.
On the other hand, with intensive competition, EC firms encounter more thorny problems, such as
huge investment, excessive expansion, and low financial benefits, which result in lower efficiency
(Yang, Shi, 2016). Li (2010) and C-T Bruce Ho (2011) applied Analytical Hierarchy Process and Grey
Relational Analysis methods, respectively, to study the efficiency of EC, and discovered that the
efficiency of EC enterprises is low. Therefore, research needs to be conducted to investigate these
following issues related to China’s EC: (1) why are the EC firms inefficient in booming markets such
as China? (2) What internal and external factors affect the EC efficiency? (3) Are the findings on EC
efficiency consistent in various modes of EC?
To answer the above questions, this paper develops empirical analyses based on the DEA-Tobit
two stage model to explore the effects of internal and external factors on the EC efficiency for Chinese
EC market. DEA-Tobit two stage method is an efficient integration method for analyzing efficiency
and its influencing factors of enterprises or organizations (Emilyn, 2018; Chen, 2017; Liang, 2016). In
the first stage of this paper, we use the DEA approach to make an empirical study on the efficiency of
60 listed EC enterprises in China, which are divided into four categories of B2B, B2C, O2O and CBEC.
The technical efficiency (TE), pure technical efficiency (PTE) and scale efficiency (SE) of all
companies are measured. In the next stage, by using Tobit model with the panel data, this paper further
analyzes the main factors that affect the efficiency of EC enterprises to provide strong theoretical
guidance for the development of EC enterprises in China. Therefore, the main contributions of this
article are as follows: firstly, we provide an insight into the causes of inefficiency for EC, which
significantly helps managers to further make effective strategic measures. Secondly, the study goes a
4
further step that shows the applicability of the DEA-Tobit model in an empirical study and discusses
the managerial implications in EC firms. Thirdly, we take into consideration to calculate the efficiency
of EC at the firm level from various types including B2B, B2C, O2O and CBEC, and reveal the
efficiency difference and its impacts of EC.
The reminder of this paper is arranged as follows. Section 2 provides literature review regarding
efficiency evaluation. Section 3 illustrates the methodology of two-stage DEA and Tobit regression,
and discusses variable selection and data collection. Section 4 describes the results of the DEA and
Tobit regression respectively, and provides insightful discussion. Finally, the conclusions and
suggestions are shown in Section 5.
2. Literature Review
2.1 Efficiency evaluation
Efficiency simply refers to the relationship between input and output. Efficiency evaluation was
first put forward by vilfredo Pareto (1906). The so-called high efficiency means that the combination of
production factors makes the output maximum when the input is unvarying or the input minimum when
the output is fixed (Pakmer S, 1999). Production function is developed from western countries and it is
a critical component of western economic theoretical system, which emphasizes the quantitative
relationship between input and output and is used to measure efficiency. Efficiency measurement is
generally divided into non-frontier methods and frontier methods. Non-frontier methods include
non-parametric statistical method, group comparison method, ratio analysis method and linear
programming technique. Frontier method is divided into parametric method and non-parametric
method. DEA is a deputy of the non-parametric method, can measure the relative phase ratio.
The efficiency of a organization is a complicated phenomenon that usually requires at least one

5
single standard to describe. For policymakers, it is important to learn how the specific industry or firm
can boost its multiple outputs and reduce its inputs levels by increasing efficiency. In EC industry, the
website is the most important platform that helps companies to serve customers directly and beyond
their competitors. Performance standard for EC need to include popularity or customer attraction, as
well as other financial factors for business formats (Liu and Arnett, 2000; Liu, 2001; Phan and Stata,
2002). Although it is difficult to compare multiple criteria decision making models and tools, the
comparative analysis of DEA method has been widely used as a discrete alternative decision-making
tool (Saris, 2000).
2.2 Evaluation of E-commerce efficiency based on DEA Model
DEA was first proposed by Farrel in 1957 and developed as the concept of relative efficiency by
A. Charnes, W.W.Cooper and E. Rhode in 1978 (Charnes A, et al., 1978). In previous literatures, there
are a fraction of researches on measuring and evaluating the efficiency of EC by DEA method. For
example, Wen and Billy (2003) first proposed the DEA mode to evaluate EC efficiency, and index
selection is from financial and operational measures and EC specific measures, and proved that DEA
model can effectively evaluate the relative efficiency of EC enterprises by empirical analysis. Kong Li
(2001) pointed out that EC can improve the efficiency and effectiveness of the material procurement
process in construction industry. Beck and T. wigandan (2005) collected data and compared the
differences of EC efficiency between small and medium-sized manufacturing enterprises in four
countries by DEA method. It was found that the EC efficiency of American and Danish enterprises is
generally higher than Germany and France.
In terms of evaluation object of the EC area, most researchers pay close attention to the efficiency
of website and finance. For example, some scholars mainly focus on the evaluation of the efficiency of

6
EC website itself and others focused on consumer satisfaction. Marsico and Levialdi (2004) establish a
user-based website evaluation index system, which is a three-dimensional spatial model composed of
individual, society and network. They want to evaluate EC website by this model. Chen M.M et.al
(2005) and others use the information system success model to evaluate whether the information
system is successful or not. Denise (2002) focused on the study of young consumers and predicted the
evaluation of online consumer decisions from their personal preferences, ability and other aspects.
When David M (2000) analyzing EC websites, He found that the introduction of products and services,
the design of website pages and the safety of payment directly affect the consumers' desire to buy. The
research on website efficiency is mainly focused on the efficiency of web site, information content and
so on.
On the other hand, for financial performance, scholars usually combine with other methods to
study. Wen et al. (2003) used DEA model that combined financial, operational and internet specific
measures to evaluate EC performance, however, since these measures are not specific enough to
represent other operational and quality-related measures of performance. Li et al. (2010) evaluated the
efficiency of 6 pure EC listed firms by using the financial index, the analytic hierarchy process and the
DEA model, which is a new quantitative method to evaluate and compare the performance of listed EC
firms. However, the sample size is too small to be convincing. DEA model needs that the number of
samples is more than twice that of the indicators. C-T Bruce Ho (2010) cited an innovative efficiency
evaluation method, combining the DEA method and gray correlation Analysis to measure the relative
efficiency of 69 American Internet companies, a total of 40 indicators are initially selected for the
efficiency evaluation. Finally, 8 representative indicators selected by GRA are subsequently employed
as the input and output indicators in the evaluation of DEA efficiency. To some extent, C-T Bruce Ho

7
can make up for the shortage of Li et al. These researches get the same conclusion that EC efficiency is
low. However, they do not further research the influencing factors of EC efficiency. On the basis of
previous studies, the research aims to explore the springhead of inefficiency for EC enterprise by
DEA-Tobit model.
2.3 DEA and Tobit model applications
The DEA-Tobit two-stage model has been widely proved to explore the efficiency and its
influence, such as in national public service industry, medical industry etc. Luoma K et al. (1996)
evaluated the production efficiency and environmental factors of Finnish hospitals by combining DEA
and Tobit. Eeva and Miika (2004) investigated cost efficiency of Finland’s Public Dental Hospital is an
exploratory comparison of recent trends in hospital efficiency in Ukraine, using the DEA-Tobit model
to verify whether the eastern and western regions have an impact on the efficiency of Ukrainian
hospitals. Li and Huan (2010) used model to analyze the railway efficiency of China. The data of these
studies are usually from the statistical annual reports of each country or province.
Analysis on efficiency and influencing factors with the combination of DEA and Tobit is also
employed in finance, insurance, banking and so on. A number of researches have attempted to explore
the relationship between financial performance and firm’s efficiency. Chen and Li (2017) selected the
asset turnover and the maximum shareholding ratio as the main factors in the study of the efficiency of
listed real estate companies. Ioannis Dokas et al. (2014) investigated the efficiency of the food and
beverage listed firms by using DEA-Tobit model for the period 2006-2009. And they provided direct
evidence that financial factors, operating cost, firm size and return on equity of total assets have
significant influence on the efficiency, it gives us some inspiration. Laureti (2011) also studied that
firm size has a positive influence efficiency of EC enterprise. However, another studies have obtained

8
different conclusions and considered that firm size do not affect the efficiency of companies. These
subversive beliefs are common in the literatures on EC, which imply the importance of further
verification to the EC research community. Therefore, scholars find factors such like firm size,
financial performance and profitability efficiency etc. have an important influence on companies’
efficiency.
As mentioned before, many studies about EC efficiency draw conclusions that the efficiency of
EC is generally low. However, practically the determinant factors of inefficiency for EC companies are
still unknown. In the meanwhile, another limitation is a lack of consideration of differences in the
development patterns of EC when evaluating efficiency.
3. Methodology
A theoretical framework of the paper is shown in Figure 1.

9
Figure 1: Two-stage frame diagram
Stage 1
Stage 2
No
No
No
Yes
Ye
s
No
Conduct Tobit regression
analysis Reselect
variables
Is model
feasible?
Stop Calculate pseudo R2 and
draw conclusions
Exclude indexes from
model
Conduct DEA
analysis
Select independent
variables for Tobit
regression
Perform unit root
test
Pass unit
root test?
Gather data Select the initial
inputs and outputs
for DEA
Strong
correlation?
Use EWM to calculate
index weight
Index
weight
< AVG?
Perform isotonicity
tests
Yes
Yes

10
3.1 Sample and Data Collection
The paper aims to analyze relative efficiency of EC and its influencing factors. As China’s EC is
experiencing remarkable development in the world, which has powerful attractions for scholars and
investors both in theoretical and practical circles. There are about 1300 EC enterprise included in
100ec.cn, of which there are no more than 300 listed enterprise. Considering that EC is an emerging
industry and our research focusing on the Chinese area, we removed the enterprises with incomplete
data during the period of 2013-2016, and 150 listed EC enterprises are as a potential sample from 2013
to 2016 in China. In these potential samples, firstly we deleted the enterprises whose main business
income comes from the manufacturing, new media and other industries, and then deleted the
companies without their own trading website, finally 60 sample enterprises which are identified pure
online wholesalers, retailers, or distributors. According to the classification of listed EC enterprises
included by China Electronic Commerce Research Center (CECRC) which is a professional,
authoritative and comprehensive EC research institutions in China. These sample companies including
48% B2B, 13.3% B2C, 16.7% O2O and 22% CBEC enterprises can basically represent the
development of each market segments of EC in China.
To ensure the accuracy of empirical analysis, we collect sufficient samples and pay more attention
to the availability of data. The data reflected the operation status of corporate website comes from
Alexa, a website with the largest number of unified resource locator (URL). The data reflected firms’
financial statements are collected from the Straight Flush Database (SFD) which is a leading
comprehensive financial data, information and software services provider, and the NetEase Finance.
And industry data obtained from CECRC.

11
3.2 Efficiency Evaluation based on DEA model
3.2.1 DEA model selection
DEA is firstly proposed by Farrel in 1957, and developed as a concept of relative efficiency by
Charnes, Cooper and Rhodes in 1978 (Charnes A, et al., 1978). The method can give a full
consideration to the optimal combination of multi-inputs and multi-outputs for decision-making units
(DMU), so it could better reflect the characteristics of the evaluation object.
DEA included input-oriented and output-oriented models. They are the linear programming
problems, and the former minimized the investments under the certain outputs, the latter maximized
outputs under the fixed inputs. The importance of exploring the EC efficiency is how to promote the
increase of output value and optimal firm’s efficiency with the fixed financial investment. Hence the
paper adopts the output-oriented model to measure EC efficiency, which has unique advantages.
We use CCR and BCC model to decompose TE into PTE and SE. The CCR model assumes that
constant returns to scale (CRS), the output oriented CCR model as follows:
njqrmi
yy
xxts
rkrj
n
jj
ik
n
jijj
,...,2,1;,...,2,1;...,2,1
,0
..
)1(max
1
1
===
≥
≥
≤
∑
∑
=
=
λ
ϕλ
λ
ϕ
ϕ represents the optimal TE score. ix and ry are the known m inputs and q outputs for a
specified DMUj , and λ≥0 are the variable weights to be determined in this problem. The sum of the
λj value is used to identify the status of RTS. Namely, 11
=∑=
n
jjλ indicates the CRS; 1
1>∑
=
n
jjλ indicates

12
the decreasing return to scale; 11
<∑=
n
jjλ indicates the increasing return to scale.
But in actual production, many production units are not on the optimal scale. Banker et al. (1984)
extended the CCR model as the following variable returns to scale (VRS) model, and TE of the CCR
model contains the components of scale efficiency.
njqrmi
yy
xxts
n
jj
rkrj
n
jj
ik
n
jijj
,...,2,1;,...2,1;,...,2,10
1
..
)2(min
1
1
1
===
≥
=
≥
≤
∑
∑
∑
=
=
=
λ
λ
ϕλ
λ
ϕ
ϕ is the optimal TE score. The SE can be calculated by the ratio of TE scores in Eq.(1) to PTE
scores in Eq.(2) (Färe R et al, 1985).
3.2.2 DEA indicators selection
In order to achieve the scientific evaluation conclusions and obtain some useful decision-making
information, we follow the some principles to screen the DEA input and output indexes (Li, 2014).
Firstly, the inputs and outputs should be able to reflect the evaluation objectives and content; Secondly,
there should be a strong linear correlation between inputs and outputs. So a correlation analysis must be
carried out to ensure a positive relationship between inputs and outputs before efficiency calculations.
Thirdly, diversity and availability should be taken into account when selecting indexes. Under the
premise of fully reflecting the evaluation objectives, this paper selects measurements for the sake of
availability and parsimoniousness of data with the consideration of previous researches on DEA index
selection. Table 1 makes a summary of indicators selection in previous studies.

13
Table1 Summary of DEA input-output indicators selection
Author (s) Methodology Indicators
Input Output
Wen et al. (2003) DEA Web technology investment; Corporate
operating cost; Number of e-commerce
staff
Profitability; Capital utilization;
Capacities; Utilization;
E-commerce site quality
Li, Chen (2010) AHP-DEA Total assets; Total indebtedness; Cash
and cash equivalents; Running
expenses; Asset-liability ratio; Revenue
from margin operation
Operating profit; Earning per
share; Net profit; Capital reserve
per share; Return on equity;
Total profit
C-T Bruce Ho
(2011)
GRA and DEA Total assets; Stockholder’s equity; Total
operating expenses; No. of employees
Revenue of scales; Profit
Margin; Return on assets; Return
on equity
Dimitris Balios et al.
(2015)
DEA Equity; Liabilities; Operating costs Sales; Operating profit
Yang, Shi (2016) DEA Total assets; Total operating cost;
Employee
Operating revenue; Market share
In generally, the labor, material and finance resources are the basic inputs for enterprises to obtain
economic benefits, while the total number of employees can reflect the enterprise human resources;
Material resources for EC, can be represented by the total operating expenses in the financial
statements, including the enterprise's main business expenses and other business expenses; The
enterprise's financial resources can choose the total assets of enterprise. Based on the above
considerations and the previous studies, the paper selects three items of total assets (TA) ( Li et al,
2010; C-T Bruce Ho, 2011; Yang et al., 2016; ), the total operating expenditure (TOE) (Banker et al.,
2002; Wen et al., 2003; C-T Bruce Ho, 2011; Dimitris Balios et al., 2015; Yang et al. 2016) and total
employee number (TEN) (Wen et al.; C-T Bruce Ho, 2011; Yang et al. 2016 ) as input indicators.
On the other hand, the output indexes selected in this paper are total operating income (TOI)

14
(Chen et al., 2004; Ho and Oh, 2008; C-T Bruce Ho, 2011; Dimitris Balios et al. 2015; Yang et al.
2016), net profit (NP) (Wen et al., 2003; Chen et al., 2006; Li et al. 2010) and market share (MS)
(Yang et al. 2016). The operating income is earnings before interest and taxes. The NP is the real profit,
and includes the operational expenses that are excluded from gross profit. These two indicators could
reflect the financial efficiency of enterprises. MS is the percentage of capture market accounted for by
a specific entity (Zhang et al., 2010), and it can be calculated by the ratio of the revenue of a single
enterprise to the whole market in the paper.
Table2 Descriptive statistics of input and output indexes of DEA
Indexes Min Max Mean SD
Outputs
TOI 254.27 64919369.38 1.9675E6 8.71310E6
NP -461203.09 1973196.28 68655.0143 3.19594E5
MS 0.00 0.55 0.0167 0.07428
Inputs
TA 764.41 39265866.03 2.0029E6 6.90625E6
TOE 657.00 49384117.96 1.6660E6 6.82170E6
TEN 20.00 341400.00 11879.4833 46947.08439
In a word, we construct a DEA model with 3 input and 3 output indicators. Table 2 shows the
basic statistics for these indicators, which shows a distinct difference between the EC enterprises.
Therefore, the indexes should be screened by Isotonicity theory before the assessment of efficiency.
(1) Isotonicity analysis
A basic requirement for DEA model is the relationship between inputs and outputs should be
stable. That is, increasing the value of any input under the constant of other elements should lead to an
increase in the value of one output (S. H. Chung, 2008). That is called the isotonicity property of DEA.
Then the correlation analysis will be conducted to ensure positive relations between inputs and outputs.
If there is a negative correlation, the DEA parameters can be appropriately transformed, and one or
15
more parameters need to be removed from the model (Luis Daniel Otero, 2012).
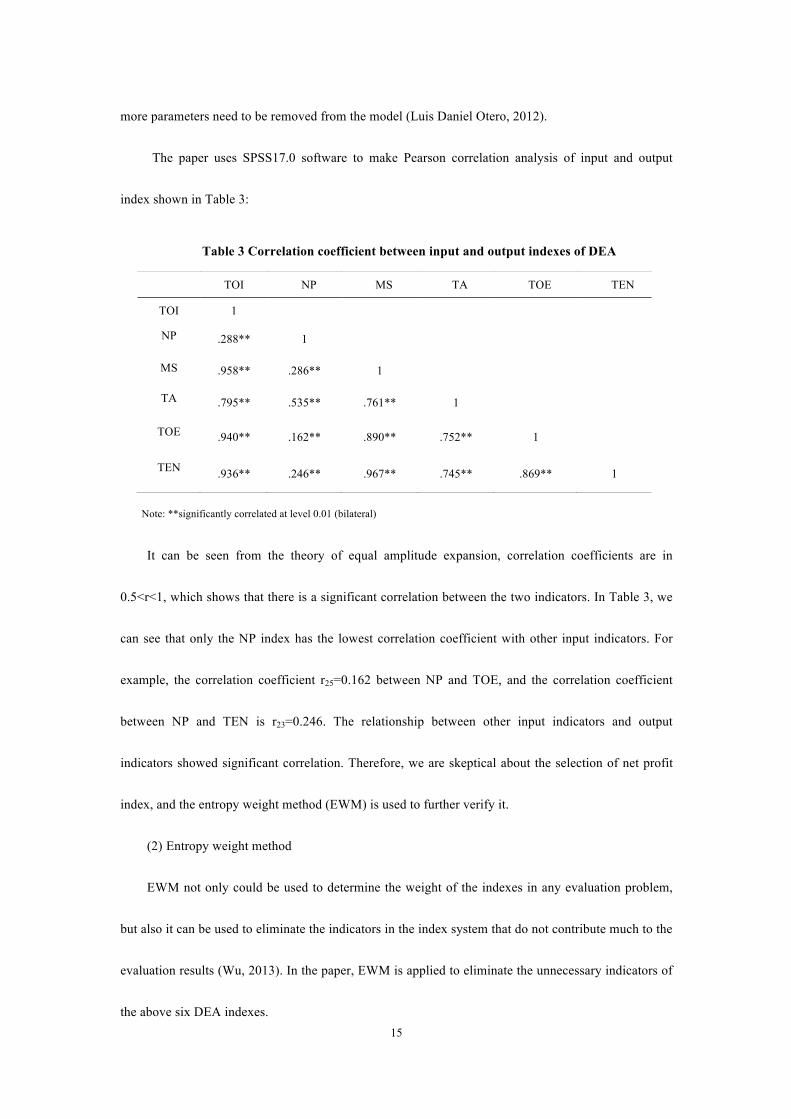
The paper uses SPSS17.0 software to make Pearson correlation analysis of input and output
index shown in Table 3:
Table 3 Correlation coefficient between input and output indexes of DEA
TOI NP MS TA TOE TEN
TOI 1
NP .288** 1
MS .958** .286** 1
TA .795** .535** .761** 1
TOE .940** .162** .890** .752** 1
TEN .936** .246** .967** .745** .869** 1
Note: **significantly correlated at level 0.01 (bilateral)
It can be seen from the theory of equal amplitude expansion, correlation coefficients are in
0.5<r<1, which shows that there is a significant correlation between the two indicators. In Table 3, we
can see that only the NP index has the lowest correlation coefficient with other input indicators. For
example, the correlation coefficient r25=0.162 between NP and TOE, and the correlation coefficient
between NP and TEN is r23=0.246. The relationship between other input indicators and output
indicators showed significant correlation. Therefore, we are skeptical about the selection of net profit
index, and the entropy weight method (EWM) is used to further verify it.
(2) Entropy weight method
EWM not only could be used to determine the weight of the indexes in any evaluation problem,
but also it can be used to eliminate the indicators in the index system that do not contribute much to the
evaluation results (Wu, 2013). In the paper, EWM is applied to eliminate the unnecessary indicators of
the above six DEA indexes.

16
The calculation steps of entropy weight method are as follows:
① Get m evaluating indicator of X-n samples in initial matrix by samples data (Xij is i evaluation
object values of j index) .
Normalization: )min()max(
)min(
jj
jijij xx
xxV
−
−= ; (3)
② Calculate the characteristic specific gravity Pij of index j correspond to the evaluation object i
is:
∑=
= m
iij
ijij
V
VP
1
; (4)
③ Calculate the information entropy Hj of index j:
ij
m
iijj PP
mH ln**
)ln(1
1∑=
−= ; (5)
④ Calculate the coefficient of variation of index j. The greater dj, the greater the amount of
information provided, the greater the weight of the index:
jj Hd −=1 ; (6)
⑤ Finally obtain the weight of index j:
∑=
= n
jj
jj
d
dW
1
. (7)
Through the above steps, EWM between DEA inputs and outputs is obtained: The weight of TOI
is 0.20763851, NP is 0.01016406, MS is 0.209722537, TA is 0.188393, TOE is 0.19857855, and t TEN
is 0.185503379. The weight of NP is significantly less than other indexes, so we removed a net profit
from the output index. Finally, the input indicators of DEA are TOE, TA and TEN; the output
indicators are TR and MS.
3.3 Tobit regression model
Previously efficiency evaluation of EC, the influencing factors of efficiency are further explored

17
in the next stage. The Tobit regression model first proposed by James Tobin (1958), is known as
sample selection and review (censor) model, and restricted dependent variable model. When the
explanatory variable satisfies some constraint condition, the model contains two types of equations, one
is discrete data model, the other is the restricted continuous variable model. In addition, the values of
DEA efficiency are between 0-1 and have obvious characteristics of being truncated. If the ordinary
least squares (OLS) method is used directly in regression analysis, the parameter estimation is
inconsistent (Greene, 2003). At the same time, DEA is relative efficiency index rather than absolute
index, so the correlation between efficiency values also makes OLS regression ineffective (Atkinson et
al., 1995). Due to above consideration, in this study, a restricted dependent variable model, Tobit
regression model is adopted as following:
niXY iii ,!,2,1,21* =++= εαα (8)
,*ii YY = 0* >iYIf
,0=iY 0* ≤iYIf
In the above equation (8), Yi* is a potential dependent variable, if Yi*>0, it will be observed and
the value is Yi*; if Yi*≤0, it will truncated at 0. Xi is an independent variable vector. α is the coefficient
vector, the error term εi is independent and the error term εi is dependent on normal distribution:
),0(~ 2σNui 。
3.2.1 Empirical hypothesis of influence factors
Loannis Dokasco (2014) found that operational factors such as financial leverage, operating costs,
firm size and return on equity have significant effects on corporate efficiency. Chen and Li (2017)
selects asset turnover and shareholding proportion of the largest shareholder as the influencing factors
when studying the operating efficiency of the listed real estate companies. To sum up, this paper selects

18
seven factors from EC enterprise interior as independent variables, including firm size (FS),
establishment time (ET), website popularity (WP), per capita output value (PCOV), operating cost
(OC), asset turnover (AT), shareholding proportion of the largest shareholder (SPLS). In addition, the
external influences on the enterprise efficiency have been taken into consideration as control variables,
such as market concentration (MC), Gross Merchandise Volume (GMV). MC is an important
quantitative index of market structure in the whole industry. It reflects the competition and monopoly
degree of the market, and measures difference of the number and relative scale of enterprises. GMV
refers to the output scale or operation scale of an industry, which can be expressed as gross product or
output. Finally, we propose 9 empirical hypotheses of influence factors on EC efficiency:
Hypothesis 1: There is a positive correlation between firm size and EC efficiency.
Hypothesis 2: There is a positive correlation between the establishment time and EC efficiency.
Hypothesis 3: There is a positive correlation between the website popularity and EC efficiency.
Hypothesis 4: There is a positive correlation between the per capita output value and EC
efficiency.
Hypothesis 5: There is a negative correlation between operating cost and EC efficiency.
Hypothesis 6: There is a positive correlation between the asset turnover and the EC efficiency.
Hypothesis 7: There is a positive correlation between the shareholding proportion of the largest
shareholder and EC efficiency.
Hypothesis 8: There is a positive correlation between gross merchandise volume and EC
efficiency.
Hypothesis 9: There is a positive correlation between market concentration and EC efficiency.
3.2.2 The specific Tobit regression model and variable construction

19
On the basis of the above hypothesis, this paper selects the influence factors as independent
variables and the TE of enterprises as dependent variables, the specific Tobit model for testing the
influencing factors is constructed as follows:
ititititititititititit GMVMCSPLSATOCPCOVWPETFSCTE εααααααααα ++++++++++= 987654321
Where, the dependent variable TE represents the comprehensive technical efficiency of EC listed
enterprises. The independent variable FS is expressed by logarithm of the total assets; ET is time since
establishment of the enterprise; WP is expressed by the reciprocal of rank of the website; PCOV is the
logarithm of the per capita output value of an enterprise; OC is the logarithmic of operating cost, which
is the sum of sales expenses, management fees and financial expenses; AT is the asset turnover rate;
SPLS is the shareholding proportion of the largest shareholder; MC is expressed by the
Herfindahl-Hirschman Index; GMV is logarithm of the size of the EC industry. C is a constant term,
and 987654321 ,,,,,,,, ∂∂∂∂∂∂∂∂∂ are regression coefficients of each variable. εit is error term, i
represents number of companies (i=1, 2, ..., 60), t is period (2013, 2014, 2015, 2016).
The hypothetical variables and their explanatory notes are shown in Table 4:
Table 4 Variable meaning and explanation
Variable Symbol Measure Prediction direction
Firm Size FS The logarithmic of total assets of firm +
Establishment Time ET The period from establishment to 2018 +
Website Popularity WP The reciprocal of global ranking of firm
websites +
Per Capita Output Value PCOV The ratio of main business income to total
number of employees. +
Operating Cost OC
The logarithmic of sum of sales expenses,
management expenses and financial expenses
of enterprises
-
Asset Turnover AT Asset Turnover +
Shareholding Proportion of
the Largest Shareholder SPLS
The shareholding ratio of maximum
shareholder +
Market Concentration MC The quadratic sum of the total income or the +

20
percentage of total assets of each market
competition in an industry
Gross Merchandise
Volume GMV
The logarithmic of annual transactions of EC
industry +
4. Empirical results
4.1 Efficiency evaluation
Under the assumptions of VRS, the output-oriented BCC model is processed with data of inputs
and outputs by using Deap2.1 software. The calculations (mean, max, min, standard deviation) of TE,
PTE, SE for each category of EC enterprises from 2013 to 2016 are shown in Table 5. Figure 2 reflects
the trend of TE, PTE and SE of EC in China in 2013-2016 years.
Table 5: The statistics of TE, PTE, SE of B2B, B2C, O2O and CBEC from 2013 to 2016
2013 2014 2015 2016
TE PTE SE TE PTE SE TE PTE SE TE PTE SE
B2B
companies
be listed
Mean 0.484 0.569 0.894 0.771 0.822 0.946 0.504 0.671 0.764 0.563 0.722 0.813
Max 1.000 1.000 1.000 1.000 1.000 1.000 1.000 1.000 1.000 1.000 1.000 1.000
Min 0.018 0.201 0.018 0.105 0.105 0.397 0.101 0.102 0.124 0.080 0.134 0.080
Sd. 0.227 0.250 0.201 0.213 0.209 0.123 0.275 0.270 0.235 0.285 0.287 0.246
B2C
companies
be listed
Mean 0.628 0.744 0.877 0.814 0.908 0.903 0.521 0.837 0.663 0.583 0.822 0.725
Max 1.000 1.000 1.000 0.999 1.000 0.999 0.688 1.000 0.960 0.853 1.000 0.961
Min 0.262 0.274 0.639 0.578 0.582 0.785 0.207 0.439 0.207 0.115 0.422 0.153
Sd. 0.210 0.254 0.119 0.110 0.137 0.075 0.153 0.205 0.224 0.243 0.186 0.282
O2O
companies
be listed
Mean 0.551 0.582 0.959 0.772 0.809 0.946 0.317 0.548 0.653 0.454 0.582 0.832
Max 1.000 1.000 1.000 1.000 1.000 1.000 0.629 1.000 0.969 1.000 1.000 1.000
Min 0.147 0.147 0.826 0.411 0.441 0.669 0.084 0.278 0.130 0.214 0.228 0.473
Sd. 0.256 0.279 0.061 0.206 0.179 0.096 0.148 0.263 0.278 0.220 0.297 0.183
CBEC
companies
be listed
Mean 0.520 0.673 0.821 0.811 0.836 0.971 0.604 0.740 0.842 0.562 0.655 0.886
Max 0.922 1.000 1.000 1.000 1.000 1.000 0.815 1.000 0.997 0.987 1.000 0.999
Min 0.109 0.235 0.109 0.476 0.517 0.791 0.358 0.464 0.358 0.132 0.271 0.132
Sd. 0.264 0.260 0.296 0.148 0.149 0.056 0.130 0.147 0.191 0.241 0.223 0.228
Industry Mean 0.522 0.616 0.887 0.786 0.835 0.945 0.497 0.688 0.749 0.547 0.698 0.82

21
TE reflects the comprehensive utilization efficiency of enterprise resources, and PTE is mainly to
measure the technology and management level of enterprise, and SE reflects whether the current
resource inputs reaches the best scale or not (Li, 2014). TE =PTE * SE. From table 5, we can see that
max value of TE, PTE, SE in every category are approaching 1, it reflects there are some completely
efficient firms in each category. On the other hand, the average comprehensive efficiency values of 60
listed EC enterprises in 2013-2016 are 0.522, 0.786, 0.497 and 0.547 respectively, which shows that
the EC efficiency is lower and the resource allocation of EC enterprises is not optimal. The conclusion
is consistent with Wen (2003), Li (2010) and C-T Bruce Ho et al. (2011).
Figure2: The technical efficiency trend of e-commerce in China
Figure 2 shows the trend of TE, PTE and SE efficiency shaped “S”. There are two obvious
inflection points in trend lines, one of maximum TE value is nearly 0.8 in 2014, the other of minimum
TE value is lower than 0.5 in 2015. It can be seen that the efficiency of EC increased rapidly from 2013
to 2014, however, the efficiency values of EC declined quickly from 2014 to 2015, and then increased
slowly. Meanwhile, we can see the lower TE of EC visibly attribute to lower PTE and SE, and PTE is
slightly lower than SE, implying that EC companies need to improve their management level and
technological innovation capabilities.

22
Figure 3 TE of four major types of e-commerce enterprises
The TE of B2B, B2C, O2O and CBEC from 2013 to 2016 is shown in Fig 3. We can see that the
overall trend of TE for different modes is roughly same, but the B2B efficiency is almost completely
close to the average efficiency of EC, because BTB dominates the EC industry in China, accounts for
about 75% of the industry according to the data of 100EC.CN. The efficiency of B2C and CBEC are
significantly higher than average, and O2O is lower than the EC industry average. According to the
China EC report, the total value of EC transactions in 2016 amounted to 26.1 trillion yuan, while the
O2O transaction is only 0.7 trillion yuan, the proportion is less than 3%. Overall, the efficiency of B2C
and CBEC is high. B2C plays an important role in EC market. Alibaba, which holds half of the market
share of the proprietary B2B market in 2014, and JingDong, which occupies 60% of the B2B market,
went public successively. Therefore, nine of the top 10 enterprises in the domestic B2C field were
already listed companies. In addition, an emerging field, CEBC, is also developing rapidly. The CEBC
transaction is 6.7 trillion yuan in 2016, which occupies 25.7% of the whole EC market.
4.2 Influencing factors analysis
The Tobit regression analysis is conducted to capture the factors of efficiency by Eviews5.0
software. The efficiency value of sample enterprise obtained from the above is taken as the dependent

23
variable, while the FS, ET, WP, PCOV, OC, AT and SPLS are as the independent variable, and MC,
GMV are as the control variables. Table 6 shows the descriptive statistics of variables in Tobit
regression analysis.
Table 6 Descriptive statistical analysis of variables in Tobit model
Variables N Minimum Maximum Mean SD
Dependent variable
TE 240 0.02 1 0.588 0.26173
Independent variable
FS 240 75.59 57386136.42 2.0029E6 7.35491E6
ET 240 2 47 11.3333 7.67688
WP 240 10 69870467 9.1764E6 1.75059E7
PCOV 240 0.03 4612.35 215.3335 530.62633
OC 240 31.37 28931893.59 525299.8967 2.69771E6
AT 240 0.04 31.98 2.0918 3.69774
SPLS 240 0.02 0.91 0.3907 0.22432
Control variable
MC 240 0.30 0.35 0.3299 0.02010
GMV 240 1.02E9 2.30E10 6.7900E9 9.36551E9
In order to further ensure the stability of the panel data, unit root of Tobit regression data is
examined by Eviews5.1 software. In table 7, two methods of PP-Fisher Chi-square and Hadri Z-stat
shows that the data has no unit root, which proves the stability of the panel data.
Table 7 Results of Unit root test
Method Statistic Prob Cross-sections Obs
Null: Unit root (assumes individual unit root process)
PP - Fisher Chi-square 308.431 0.0000** 59 177
Null: No unit root (assumes common unit root process)
Hadri Z-stat 8.40713 0.0000** 60 240
** Probabilities for Fisher tests are computed using an asympotic Chi
-square distribution. All other tests assume asymptotic normality.

24
Table 8 presents the estimation results. It can be seen that R-squared is about 0.31, and Log
likelihood is about 25.81, which has certain credibility and the regression result is more accurate.
Moreover, in order to further reveal whether there are differences in the influencing factors of
efficiency under the different modes of EC, we also process the Tobit regression according to the four
modes of B2B, B2C, O2O and CBEC. Table 9 shows the results under the different models. The
R-squared and Log likelihood are also acceptable.
Table 8. Tobit regression results of all sample enterprises
Variables coefficient Std. Error Z-statistic Prob.
FS 0.045756 0.023796 1.922861 0.0545*
ET -0.001623 0.002284 -0.710479 0.4774
WP -0.511206 0.936208 -0.546039 0.5850
PCOV 0.001807 0.007611 0.237454 0.8123
OC 0.017428 0.026352 0.661349 0.5084
AT 0.028982 0.003942 7.351229 0.0000***
SPLS 0.232740 0.081273 2.863676 0.0042***
MC 6.660560 1.497915 4.446555 0.0000***
GMV 0.154045 0.055168 2.792281 0.0052***
Constant -3.471330 0.995325 -3.487636 0.0005
R-squared 0.306974 Mean dependent var 0.587992
Adjusted R-squared 0.276711 S.D. dependent var 0.261730
S.E. of regression 0.222592 Akaike info criterion -0.123408
Sum squared resid 11.34629 Schwarz criterion 0.036121
Log likelihood 25.80901 Hannan-Quinn criter. -0.059130
Avg. log likelihood 0.107538
Note: *** Significant at the 0.01 level; ** Significant at the 0.05 level; * Significant at the 0.1 level.
The results show that FS, AT, MSSR, MCR and ECIS have significantly significant impacts on
TE of EC enterprises. The coefficients for the impacts of them are all positive, which is consistent with
the hypothesis 1, 6, 7, 8, 9. However, the variables of ET, PEW, PCOV and OC are insignificant,
which does not conform to the hypothesis 2, 3, 4, 5, and the details are as follows:

25
(1) The variable of FS has a statistically significant and the coefficient is about 0.046, which
shows that the larger FS, the more efficiency it will be in the current market situation. It is consistent
with hypothesis 1, so expanding the scale of enterprises is one of the effective ways to improve the EC
efficiency.
(2) The coefficient of AT is about 0.029, which is positively correlated with the EC efficiency,
and that is consistent with hypothesis 6. The larger AT, the management quality and utilization
efficiency of all assets is higher. Therefore, the EC enterprise can improve the efficiency by increasing
sales revenue or decreasing total assets.
(3) The coefficient of SPLS is about 0.233, which has a significant positive correlation with EC
efficiency, and that is consistent with hypothesis 7. The larger SPLS, the more centralized the
decision-making is, the higher efficiency is achieved. Therefore, EC enterprises can choose the linear
structure management mode, which is helpful to improve efficiency.
(4) The coefficient of MC is about 6.661, the higher the MC, the stronger the market dominance
of large enterprises. At present, the leading EC market players, such as Amazon, Alibaba, JingDong,
and other large enterprises occupy a very large market share of EC, and their TE is also very high,
which is consistent with hypothesis 8.
(5) The coefficient of GMV is about 0.154, which has a significant positive correlation with the
EC efficiency. With the expansion of EC market scale, the market demand continues to increase, and
the efficiency of EC enterprises increases gradually. That is consistent with hypothesis 9.
Table 9. Tobit regression results of four different modes of EC
Variable B2B B2C O2O CBEC
FS 0.104303
(0.0083)***
-0.098936
(0.3374)
-0.504684
(0.0000)***
0.097553
(0.2213)

26
ET -0.002335
(0.4507)
-0.013585
(0.2458)
0.036892
(0.0000)***
0.000628
(0.9110)
WP 137.5673
(0.2003)
2.193370
(0.2808)
413.3300
(0.0002)***
-2918.488
(0.0126)**
PCOV -0.003017
(0.6993)
0.193461
(0.1228)
0.824638
(0.0000)***
0.073250
(0.1085)
OC -0.070977
(0.2708)
0.107114
(0.4043)
0.360399
(0.0000)***
-0.008550
(0.9128)
AT 0.026489
(0.0000)***
0.028047
(0.5024)
-0.097007
(0.0607)*
0.108795
(0.0000)***
SPLS 0.271290
(0.0209)**
-0.403537
(0.2585)
0.015071
(0.9228)
0.447509
(0.0402)**
MC 0.148662
(0.0552)*
0.221088
(0.0599)*
0.229538
(0.0183)**
0.044071
(0.6245)
GMV 5.532484
(0.0089)***
9.409972
(0.0051)***
18.67089
(0.0000)***
4.070938
(0.1130)
Constant -2.998427
(0.0328)**
-4.832387
(0.0328)**
-8.564596
(0.0000)***
-1.947842
(0.2432)
R-squared 0.411417 0.465922 0.694734 0.536783
Log likelihood 15.39241 13.70070 19.09555 22.01631
Note: *** Significant at the 0.01 level; ** Significant at the 0.05 level; * Significant at the 0.1 level.
On the other hand, Table 9 provides some interesting facts that 9 explanatory variables have
different effects on the efficiency of four different EC modes, including B2B, B2C, O2O and CBEC.
B2B is an important area in EC, it’s influencing factors of efficiency are completely consistent
with EC, and hypothesis 1, 6, 7, 8, 9 are supported in B2B. For B2C, only external factors do influence
the efficiency, and internal factors still to be further explored. For O2O, the variables of ET, WP,
PCOV, OC, MC, GMV have positive correlated with efficiency and FS, AT have negative correlated
with efficiency, SPLS is insignificant. FS, OC and AT have statistical significance with efficiency of
O2O enterprise, but they do not in line with our hypothesis. Therefore hypothesis 2, 3, 4, 8, 9 are
supported. We guess one of the reasons for the results is the expansion of FS plays a limited role in
improving efficiency in O2O market, and the other reason is the OC has a positive effect on the

27
efficiency within a certain range. For CBEC, hypothesis 6, 7 are supported, WP has negatively
correlated with efficiency, it’s consistent with the original hypothesis 3.
5. Conclusions and recommendations
Firstly, this paper estimates the efficiency of four different EC modes by using DEA-BCC model
during the period of 2013 to 2016. The results show that TE of EC industry is obviously lower and
waver, the trend of TE, PTE and SE efficiency is shaped “S”, and efficiency values reached maximum
in 2014 and decreased to minimum in 2015. In addition, the TE value of B2B is closest to EC industry
average, B2C and CBEC are higher than average, O2O is less than average.
Secondly, the Tobit regression model is constructed to determine the underlying influencing
factors of EC efficiency. The findings indicate that firm size, asset turnover, shareholding proportion of
the largest shareholder, market concentration and gross merchandise volume have statistically
significantly impacts on TE for total EC industry, and hypothesis 1, 6, 7, 8, 9 are supported. At the
same time, different types of EC have significant difference on influencing factors of EC efficiency:
firm size, asset turnover, shareholding proportion of the largest shareholder, market concentration and
gross merchandise volume have positive effect on B2B efficiency; market concentration and gross
merchandise volume have positive effect on B2C efficiency; establishment time, website popularity,
per capita output value, operating cost, market concentration and gross merchandise volume have
positive effect on O2O efficiency, and firm size, asset turnover have negative effect on O2O efficiency;
asset turnover and shareholding proportion of the largest shareholder have positive effect on CBEC
efficiency, website popularity has a significant negative effect on CBEC efficiency.
In view of these conclusions, the paper gives the following management implications:
On the one hand, from the perspective of EC industry, the government should focus more on the

28
development of B2C and CBEC, because their TE value is higher than average efficiency value of EC
industry.
On the other hand, combined with Tobit regression results, our policy recommendations from the
perspective of enterprise interior are as follows:
(1) B2B enterprises can promote their efficiency by means of acquisition, merger and so on.
Strengthening internal management, speeding up the circulation of funds and preventing unreasonable
capital from occupying pressure are effective measures for enterprise to improve asset turnover.
Increasing corporate governance efficiency and performance by improving the shareholding proportion
of the largest shareholder.
(2) O2O enterprises should not rely on burning money to attract consumers’ attention, but
innovate product by optimizing the platform service so as to ensure sound development and lengthen
establishment time, and avoid bankruptcy crises. They also can focus on improving website popularity,
such as increasing technology investment, improving product quality and connecting accurately
information between business and customers. Other measures such as increasing overhead expenditure
to strengthening internal management and taping their potential, actively generating income to improve
per capita output value. What the important point for O2O is to prevent the scale expansion of
malicious competition.
(3) CBEC enterprises should not only pay attention to improve asset turnover and shareholding
proportion of the largest shareholder, but also seek the third party trading platform to increase sales
channels. For example, the Suning not only has it’s own trading website (Suning.com), it also has
official flagship store in TMALL.com.

29
6. Limitation and further research
Compared with the previous studies on EC efficiency, the study discusses the efficiency of
EC and its influencing factors based on DEA-Tobit two stage model, which makes up for the
deficiencies of the existing research, but also provide theoretical reference for EC enterprises of
different modes. In particular, the results of this study are not only of interest to individual EC
enterprises, but also to policy makers for formulating industrial guidelines in China, and it is of
great significance to the development of EC in the word.
At the same time, there are still limitations worth further study. Firstly, although the sample
can meet the basic requirements of DEA efficiency evaluation in this study, the data is limited in
China, a comparative study with other countries such as America, Japan and Korea will be
considered in the next research. Secondly, although the article prudently chooses DEA evaluation
index system and puts forward the empirical hypotheses of influencing factors based on previous
studies and the characteristics of e-commerce, there are still some potential factors existed, such as
research expenses, websites visitors, and public praise etc. Thirdly, the paper provides an insight
on impact on EC efficiency, but it is still lack of in-depth analysis of direct and indirect impacts,
this will be another key point of the further study.
Acknowledgement
The authors gratefully acknowledge the support of China Scholarship Council research fund
under granted No.201408615022, as well as Social Science Foundation of Shaan Xi (Grant
No.2017KRM076).

30
Author introduction
Shan hongmei (1970 -), female, xi 'an, shaanxi province, professor, master of economics,
Beijing university of posts and telecommunications, majoring in logistics management and
strategic planning. She graduated from shaanxi normal university with a bachelor of science
degree in July 1994. Graduated from Beijing university of posts and telecommunications in July
2002 with a master's degree in economics. She has been engaged in teaching and scientific
research in xi 'an university of posts and telecommunications since July 1994 and was promoted to
associate professor in 2005 and to professor in 2010. She has published 30 papers on important
academic journals at home and abroad, including 3 CSSCI journals, 23 core journals, 1 excerpt
from xinhua digest, and 2 textbooks including logistics and transportation management, and won
the third prize of xi 'an science and technology.
References
A. Charnes, W.W. Cooper, L. Seiford. Extremal principles and optimization dualities for
khinchin-kullback-leibler estimation[J]. Optimization, 1978,9 (1).
Ali Hal c , Deniz Umut Erhan. Structuring Strategic Management with Ratio Analysis Method: A
Case Study in the Transition to SME TFRS Process[J]. Procedia - Social and Behavioral Sciences,
2013, 99.
Atkinson, S. E., & Wilson, P. W. (1995). Comparing mean efficiency and productivity scores from
small samples: A bootstrap methodology. The Journal of Productivity Analysis, 6, 137–152.
Cheng, Li. Analysis on Financial Support Efficiency of Strategic Emerging Industries Based on
DEA—Tobit Model [J]. Applied Mechanics & Materials, 2014, 608-609 (3): 145-150.
Chen M.M, TANG B.Y, Cheng S. An Index System for Quality Synthesis Evaluation of B to C

31
Business Website [A]. Processing of 7th International Conference on E-commerce, 2005, 8:
15-17.
Chi Kong Li, Rita Y. T. Sung, Ka Li Kwok, Ting Fan Leung, Matthew Ming Kong Shing, Ki Wai Chik,
Chung Wah Yu, Man Ching Yam, Patrick M. P. Yuen. A Longitudinal study of cardiac function
in children with cancer over 40 months[J]. Pediatric Hematology-Oncology, 2000, 17 (1).
C-T Bruce Ho. Measuring dot com efficiency using a combined DEA and GRA approach [J]. Journal
of the Operational Research Society, 2011, 62 (4).
Denise E.A. A Model of Young People’ s Decision-making in Using the Web [J]. Library
&Information Science Research, 2002, (24): 12-18.
DM Nyariki. Farm Size, Modern Technology Adoption, and Efficiency of Small Holdings in
Developing Countries: Evidence from Kenya[J]. Journal of Developing Areas, 2011, 45 (1) :
35-52.
Emilyn Cabanda, Mary Kay Copeland. Efficiency Analysis of the U.S. Publicly Held Insurance
Industry: A Two-Stage Efficiency Model[J]. International Journal of Information Systems in the
Service Sector (IJISSS), 2018, 10(1).
Greene, W.H. Econometric Analysis, 5th ed.; Prentice Hall: Upper Saddle River, NJ, USA, 2003.
H. Joseph Wen, Billy Lim, H. Lisa Huang. Measuring e-commerce efficiency: a data envelopment
analysis (DEA) approach[J]. Industrial Management & Data Systems, 2003, 103(9).
Hu, Liang. Operating Efficiency of International Tourist Hotels in Taiwan by Taking Into Account
Congestion[J]. International Journal of Hospitality & Tourism Administration, 2016, 17 (3).
Ioannis Dokas, Dimitris Giokas, Anastasios Tsamis. Liquidity Efficiency in the Greek Listed Firms: A
Financial Ratio Based on Data Envelopment Analysis[J]. International Journal of Corporate

32
Finance and Accounting (IJCFA), 2014,1 (1).
Ioannis E. Tsolas. Modelling profitability and effectiveness of Greek-listed construction firms: an
integrated DEA and ratio analysis[J]. Construction Management and Economics,2011,29(8).
Jie Zhang, Paul W. Farris, John W. Irvin, Tarun Kushwaha,Thomas J. Steenburgh, Barton A. Weitz.
Crafting Integrated Multichannel Retailing Strategies[J]. Journal of Interactive Marketing, 2010,
24 (2).
Jonathan W.P. Web site wusability design and performance metrics[J]. Information Systems Research,
2002, 13 (2): 151-167.
Lan-Bing Li, Jin-Li Hu. Ecological total-factor energy efficiency of regions in China[J]. Energy Policy,
2012, 46.
LD Otero, G Centeno, CE Otero,K Reeves. A DEA–Tobit Analysis to Understand the Role of
Experience and Task Factors in the Efficiency of Software Engineers[J]. IEEE Transactions on
Engineering Management Em, 2012 , 59 (3): 391-400.
Luis Daniel Otero, Carlos E. Otero. A fuzzy expert system architecture for capability assessments in
skill-based environments[J]. Expert Systems with Applications, 2012, 39 (1) :654-662.
Luoma K, Järviö M L, Suoniemi I, Hjerppe R T. Financial incentives and productive efficiency in
Finnish health centres[J]. Health economics, 1996, 5 (5).
Mehdi Safari Geraily,Mohammad Amoonejad. Ownership Concentration, Family Control, and Auditor
Choice: Evidence From Iranian Companies[J]. International Journal of Asian Business and
Information Management (IJABIM), 2018, 9 (2).
M Kundi,S Sharma. Efficiency Analysis and Flexibility: A Case Study of Cement Firms in India[J].
Global Journal of Flexible Systems Management, 2015, 16 (3) : 221-234.

33
Muyilea, Steve, et al. The conceptualization and Empirical validation of website user satisfaction[J].
Informanon & Manaagement, 2004, 41: 543-560.
Niwattisaiwong S, Kmsan Suriya. Impact of Mobile Broadband on Non-life Insurance Industry in
Thailand and Singapore[J]. Econometrics of Risk, 2015, 583: 457-470.
Pilyavsky Anatoly I, Aaronson William E, Bernet Patrick M, Rosko Michael D, Valdmanis Vivian G,
Golubchikov Mikhail V. East-west: does it make a difference to hospital efficiencies in
Ukraine?[J]. Health Economics, 2006,15 (11).
Omar Farooq,Ilham Zarouali. Financial centers and ownership concentration: When is ownership
concentration value relevant? Evidence from an emerging market[J]. Research in International
Business and Finance, 2016, 38.
Pakmer S, Torgerson D. Definitions of efficiency[J]. British Medical Journal, 1999.318 (7191):1136.
Q Chen,F Li. Empirical Analysis on Efficiency of Listed Real Estate Companies in China by DEA[J].
Ibusiness, 2017, 9 (3) :49-59
Qiting Chen, Fengdan Li. Empirical Analysis on Efficiency of Listed Real Estate Companies in China
by DEA[J]. iBusiness, 2017,09 (03).
Roman Beck, Rolf T.Wigand, Wolfgang Konig. The Diffusion and Efficient Use of Electronic
Commerce among Small and Medium-sized Enterprises: An International Three-Industry
Survey[J]. Electronic Markets, 2005,15 (1).
Schuber P. EWAM: Evaluation of Electronic Commerce Applications from the Customer’ s
Viewpoint[J]. International Journal of Electronic Commerce, 2002.7 (2): 51-80.
Szymanski, David M. T. E-Satisfaction: An Initial Examination[J]. Journal of Retailing, 2000, 76 (3):
309-322.

34
Tiziana Laureti,Alessandro Viviani. Competitiveness and productivity: a case study of Italian firms[J].
Applied Economics, 2011, 43 (20).
T. Li, L, Chen. Efficiency Evaluation of Pure e-commerce Companies Listed in Stock Market in China
Based on AHP-DEA[J]. Fourth International Conference on Management of E-commerce &
E-government, 2010: 176-179.
Widström Eeva, Linna Miika,Niskanen Tapani. Productive efficiency and its determinants in the
Finnish Public Dental Service[J]. Community Dentistry and Oral Epidemiology (Print),2004,
32(1).
Zhibin Liu, Wenwen Cao,Shengliang Yuan. Modeling and Simulation of SCSA Performance under
E-Commerce Environment[J]. Journal of Software, 2009, 4 (5).
Zhuofan Yang, Yong Shi, Hong Yan. Scale, congestion, efficiency and effectiveness in e-commerce
firms[J]. Electronic Commerce Research and Applications, 2016, 20.
Zhuofan Yang,Yong Shi, Hong Yan. Analysis on pure e-commerce congestion effect, productivity
effect and profitability in China[J]. Socio-Economic Planning Sciences, 2016.

35


![Factors influencing[1]](https://img.pdfslide.us/doc/110x75/54be1c8d4a795948378b4597/factors-influencing1.jpg)