Embed Size (px)
Citation preview
European Journal of Logistics Purchasing and Supply Chain Management
Vol.2, No.3, pp. 39-78, December 2014
Published by European Centre for Research Training and Development UK (www.eajournals.org)
39 ISSN 2054-0930 (Print), ISSN 2054-0949 (Online)
FACTORS INFLUENCING CONTAINER TERMINALS EFFICIENCY: A CASE
STUDY OF MOMBASA ENTRY PORT
Samuel Monday Nyema
Department of Procurement in the School of Entrepreneurship, Procurement and
Management Jomo Kenyatta University of Agriculture and Technology.
ABSTRACT: Previous studies carryout revealed that many factors influence container
terminal efficiency. This study revealed that factors such as inadequate quay/gantry crane
equipment, reducing berth times and delays of container ships, dwell time, container cargo and
truck turnaround time, custom clearance, limited storage capacity, poor multi-modal
connections to hinterland and infrastructure directly influencing container terminal efficiency.
The research document thoroughly explored these factors and discussed the extent to which
they influence container terminal efficiency within the port industry. The primary objective of
this study was to assess factors influencing Container Terminals Efficiency with a case study
of the Mombasa Entry Port. The target population of the study was approximately 500 people
which included Kenya Port Authority, Conventional Cargo Operations, and Container
Terminal Operations. Questionnaire was the major instrument used to obtain primary data
from the respondents; while the secondary data were obtained from existing empirical
literature relevant to the study. The study employed an exploratory approach using a
descriptive survey design. The questionnaire be designed using Likert scale type. A sample of
50 respondents was obtained through a stratified sampling technique of which 30 of the
respondents participated in the survey. Data were analyzed using the Statistical Package for
Social Sciences (SPSS) and Microsoft Excel 2013. The findings revealed 86.7% of the
respondents believe that by improving the infrastructures at the port of Mombasa will minimize
the congestion problems that sometime occur. Findings from the survey revealed that 83.3%
of the respondents agree that the lack of Integrated IT system poses substantial delays in
custom clearance procedures. The study also recommended that Kenya Port Authority (KPA)
continuously invest in modern quay and gantry cranes to supplement the current ones in order
to continuously enhance productivity of port operations and that the Government of Kenya
invest in expanding the physical infrastructure such as adequate berthing facilities, wharves,
yard capacity, quayside, railway, as well as hinterland connections expansion.
KEYWORDS: Container Terminals, Efficiency, Mombasa Entry
INTRODUCTION
Background
Containerization of ship cargo was first introduced in 1956 (Levinson, 2006), aiming to cut
down the costs of maritime transport by reducing cargo handling costs. Instead of
loading/unloading each piece of transport item to or from a ship in a labor-intensive manner,
containerization increases the efficiency and speed of transport by reducing the packing
requirements and handling processes at all transfer points. That is between port, rail and road.
At the end of 2005, the world container fleet was expected to have increased to 21.6 million
TEUs (Twenty-foot equivalent units) (UNCTAD, 2006). Thus, countries without adequate
unitized transport facilities will be disadvantage in their international trade (Castro, 1999).
European Journal of Logistics Purchasing and Supply Chain Management
Vol.2, No.3, pp. 39-78, December 2014
Published by European Centre for Research Training and Development UK (www.eajournals.org)
40 ISSN 2054-0930 (Print), ISSN 2054-0949 (Online)
In order to achieve economies of scales, new ships are built with much greater capacity. To
date, the largest container vessel can carry 11,000 TEUs. However, the deployment of larger
ships demands huge investment in providing greater depth alongside the berth of the calling
ports as well as more powerful quay cranes with long outreach and lift height. For efficient
operation, ports also require a large storage yard and a better road and rail infrastructure. To
satisfy the growing demand of container berths, ESCAP (2005) estimates that US27 billion is
needed from 2002 to 2015 for 569 new container berth in the Asia and pacific region (ESCAP,
2005). With regards to the growing international sea traffic and changing technology in the
maritime transport industry, seaports are coping with mounting pressures to upgrade and
provide cutting-edge technology. They are also being forced to improved container terminals
efficiency to provide comparative advantages that will attract more traffic. Some of the key
challenging factors terminal operators are surmounting to is to secure traffic flows and prevent
diversion to nearby ports including handling containers and cargos more rapidly, providing
more adequate and performing equipment, reducing berth times and delays, enabling large
storage capacity and ensuring multi-model connections to hinterland (Castro, 1999).
However, container terminals efficiency is often associated with productivity and performance;
also additional factors that are associated with the more organizational side of production such
as how efficiently ports use inputs to produce current output levels and whether the
technologies adopted by container terminal operators are most efficient, that are critical to
determining container terminals efficiency(Chin and Tongzon, 1998). Efficiency often means
speed and reliability of container terminal services. In a survey conducted by UNCTAD (2011),
‘on-time delivery’ was cited to be a major concern by most shippers (UNCTAD, 2006). In fast-
paced industries where products must be moved to the markets on time, terminal operators are
vital nodes in logistics chain and as such must be in a position to guarantee shipping lines very
reliable service levels. These include on-time berthing of vessels, guarantee turnaround time
for vessels and guaranteed connection of containers. That is the total turnaround time it takes
to wait for pilot to berth, terminal time, un-berthing and final departure from port area (Tongzon
and Ganesalingam, 2009).
Terminal efficiency can be reflected in the freight rates charged by shipping companies,
turnaround time of ships and cargo dwelling time. The larger a ship stays at berth, the higher
is the cost that a ship will have to pay. This can be passed on to shippers in terms of higher
freight charges and longer cargo dwelling time, thus reducing the attractiveness for them to
hub at a port. Tongeon and Ganesalingam (2009) identified several indicators of terminal
efficiency and categorized them into two broad groups, namely: operational efficiency
measures and customer-oriented measures. The first set of measure deals with capital and labor
productivity as well as asset utilization rates. The second set includes direct charges, ship’s
waiting time, minimization of delays in inland transport and reliability (Tongzon and
Ganesalingam, 2009).
A Survey conducted by the East African Logistics Performance reveals significant
improvement in port and corridor efficiency. Ongoing reforms and infrastructure
improvements at the port of Mombasa have yielded significant results as cargo dwell time has
dropped from an average 6.5 days in 2011 to 5 days in 2012. Despite these improvements, the
efficiency at the port of Mombasa is still below the internationally acceptable standards of a
maximum 3 days dwell time (East African Logistics Performance Survey, 2012). Compare to
2011, corridor efficiency has slightly improved resulting from concerted efforts by EAC
governments to upgrade regional road infrastructure and eliminate non-tariff barriers. Despite
European Journal of Logistics Purchasing and Supply Chain Management
Vol.2, No.3, pp. 39-78, December 2014
Published by European Centre for Research Training and Development UK (www.eajournals.org)
41 ISSN 2054-0930 (Print), ISSN 2054-0949 (Online)
these initiatives, truck turnaround times remain low as an average truck records less the
5,000KMs per month against an industry practice of 9,000 to 12,000KMs per months (East
African Logistics Performance Survey, 2012). The efficiency of container terminal is still
affected by the high regulatory burden of the road transport sector with numerous checkpoints
(weight bridges, customs and police checks) along the transport corridor. This situation is
compounded by congestion in urban areas along the transport corridor and less than adequate
investment in the rail network to effectively complement the road transport system (East
African Logistics Performance Survey, 2012).
The Port of Mombasa is the largest in East Africa and a vital gateway for imports and exports
to Kenya and its neighboring countries. The imports and exports that pass through the Port of
Mombasa are critical to Kenya’s economic growth, and to the economic well-being of its
neighbors as well. Liquid bulk items, mostly petroleum, oil and lubricants, are the single
greatest import item by weight without these imports, Kenya’s economy (and most other
countries of the EAC) which depend on imports for all of its petroleum needs, would grind to
a half. The next four largest items by weight, maize clinker, wheat, iron and steel are critical in
meeting the country’s food needs and in supporting its vibrant construction industry (KPA,
2010).
Conversely, Mombasa entry port has exceeded its design capacity, yet it is expected to handle
growing imports and exports. The port is already operating at maximum capacity for both
general and containerized cargo, and will suffer progressive declines in operational
effectiveness unless both capacity and terminal efficiency issues are urgently addressed (KPA,
2010). In terms of capacity, container imports at the port have risen on average 10 percent each
year since 2005 (KPA, 2010), despite relatively low GDP growth rates in 2007 to 2008. In term
of efficiency, several key issues need to be addressed for both imports and exports that relate
to movement of goods through the port, and inefficiencies caused by the management of trucks
loading and unloading goods, collection of custom duties, inspection, etc.
The operational capacity for container cargo is particularly acute with the growing demand in
containerized cargo; the Mombasa entry Port is facing serious capacity problems (KPA, 2010).
Short-term immediate impact is an increased in vessel delays, port congestion surcharges, and
slower throughput of the port (when congested) thus causing significant cargo delays and
higher costs to importers.
Exporters also experience increased costs because of possible unscheduled delays at the port,
disappointing customers who have based their own business decisions on fixed delivery
schedules. The fact of the matter remains that, the capacity issues at the port of Mombasa could
act as a brake on growing trade within the region (KPA, 2010).
Statement of the Problem
With growing international sea traffic and changing technology in the maritime transport
industry, sea ports are coping with mounting pressures to upgrade and provide cutting-edge
technology. They are also being forced to improve terminals efficiency to provide comparative
advantages that will attract more traffic. Some challenging factors include: providing adequate
and performing equipment, reducing berth times and delays, enabling large storage capacity
and ensuring multi-modal connections to hinterland (UNCTAD, 2006); as well as improving
infrastructure (Haralambides 2002).Terminal operations are affected not only by the larger

European Journal of Logistics Purchasing and Supply Chain Management
Vol.2, No.3, pp. 39-78, December 2014
Published by European Centre for Research Training and Development UK (www.eajournals.org)
42 ISSN 2054-0930 (Print), ISSN 2054-0949 (Online)
number of vessel calls but also by the increased variability of call sizes. Vessels of over 15000
TEU are becoming increasingly common (Cullinane and Khanna 1999). This will concentrate
container flows on a few megaports, in turn influencing berth and crane efficiency of the
terminal and adding pressure on hinterland links, often with adverse effects on congestion and
the environment (Yap and Lam 2013).
The Mombasa Entry Port has exceeded its design capacity, (KPA, 2010). It is already operating
at maximum capacity for both general and containerized cargo, and will suffer progressive
declines in operational effectiveness unless both capacity and terminal efficiency issues are
adequately addressed (KPA, 2010).
Container imports at the port have risen on average 10 percent each year since 2005 (KPA,
2010). Some key problems associated to the inefficiency of the port are: dwell time issue,
management of trucks loading and unloading goods, collection of custom duties, inspections,
etc. (KPA, 2010). There are broadly several areas which influence container terminal
efficiency: port’s ability to service ships at the quayside (or at berth); yard capacity (to store
goods before collection) and custom and clearance; infrastructure etc. These issues have
therefore prompted the study to assess factors influencing container terminals efficiency: A
case study of the Mombasa Entry Port.
Objectives
General objective
The main purpose of the study is to assess the factors influencing container terminals efficiency
in the Maritime industry with case study of the Mombasa Entry Port, Republic of Kenya.
Specific objectives
i. To what extent does quay crane affect container terminal efficiency.
ii. To examine the role dwell time plays on container terminal efficiency.
iii. To critically examine the important of infrastructure on terminal efficiency.
iv. To establish the effect clearance procedures has on container terminal efficiency.
Research Questions
1. How does quay crane affect container terminal efficiency?
2. What role does dwell time play on the container terminal efficiency
3. How does infrastructure influence container terminals efficiency?
4. What is the effect of clearance procedures on container terminal efficiency?
Justification [
This study is indeed significant because the Maritime Industry plays a major role toward the
economic growth and development of a country. The Port of Mombasa has a strategic
importance far beyond the borders of Kenya. As the largest port in East Africa, it is the main
gateway for the import and export of goods not only for Kenya but also to countries of the East
African Community (EAC) as well as Central Africa.
Moreover, the study seeks to benefit all stakeholders and players within the maritime industry
especially container terminal operators and policy makers because the findings from the
research will provide an in-depth knowledge on practical implications on factors influencing
container terminal efficiency. The findings will also be a direction for future research and
practical implications as well, especially to those who want to do similar research by assess
factors influencing container terminal efficiency within the maritime industry.
European Journal of Logistics Purchasing and Supply Chain Management
Vol.2, No.3, pp. 39-78, December 2014
Published by European Centre for Research Training and Development UK (www.eajournals.org)
43 ISSN 2054-0930 (Print), ISSN 2054-0949 (Online)
Finally, the research will be of great benefit to the Government of Kenya, it neighboring
countries and other African countries who have similar problems with terminal inefficiencies;
because when the findings and recommendations from the study are well utilized and taken
into consideration by the appropriate authority and stakeholders, then the issues of container
terminal inefficiencies can be adequately addressed thus enhancing the capacity and
productivity of their ports which onward will boost economic growth and development.
Scope of the study
The scope of the study focuses on factors influencing container terminals efficiency with case
study of the Mombasa Entry Port. It also looks at all persons involved in the operations of
container terminal in the port of Mombasa, stakeholders who make use of the facility in port
operation activities as well as freight forwarders/shippers, shipping agents and Kenya Port
Authority (KPA). Furthermore, the target population included Kenya Port Authority,
Conventional Cargo Operations, and Container Terminal Operations. The number of these
officials when put together gave a total of approximately 500 people.
Limitations of the study
It is obvious that every study encounters challenges and difficulties; of which this study is no
exception. Significant portion of the questionnaire was not filled in, this perhaps could be
deduced that most of the respondents were not willingness to participate in the survey. As a
result of this, the expected sample size was not met. Another challenge encountered was
obtaining Research Authorization Letters. The process was very tedious because the researcher
was mandated by the National Commission for Science, Technology and Innovation
(NACOSTI), Republic of Kenya to obtain those letters before embarking on the research. Thus
causing the researcher to travel severally to and fro from Nairobi to Mombasa which was very
hectic especially so with the security system in the country, and the narrow road network
between the two cities.
LITERATURE REVIEW
Introduction
This chapter reviews relevant literature both about the topic of the research with specific focus
on relevant issues on container terminal efficiency. A number of existing papers and studies on
container terminal efficiency were reviewed for this study. The frame of reference of this
research project was guided by the problem and purpose. Hence, it was considered relevant in
this research to review theory related to factors influencing container terminal efficiency. The
review has shown that there are numerous theoretical perspectives and models on container
terminal efficiency which have been developed for container terminal operations. For the
purposes of this research project, the review was concentrate on just two aspects of the theories
on container terminal efficiency: the Data Envelopment Analysis (DEA) and the DEA Window
Analysis. Finally, the study looked at the hypothesized variables, conceptual framework,
empirical review, critique of existing literature, summary and research gap.

European Journal of Logistics Purchasing and Supply Chain Management
Vol.2, No.3, pp. 39-78, December 2014
Published by European Centre for Research Training and Development UK (www.eajournals.org)
44 ISSN 2054-0930 (Print), ISSN 2054-0949 (Online)
CONCEPTUAL/THEORETICAL FRAMEWORK
Data Envelopment Analysis (DEA)
The application of Data Envelopment Analysis (DEA) in seaport industry to measure port
efficiency and performance was first proposed by Roll and Hayuth (1993). They think that
seaports are complex service organizations and there is a long list of outputs and inputs
characterizing the operations of seaports. Due to this complexity of factors affecting seaport
efficiency, it is difficult to determine the efficiency and the extent to which a seaport’s
resources are fully exploited in achieving the goals.
9
According to Roll and Hayuth (1993), DEA is considered as one of the most suitable tools for
measuring seaport efficiency. They mentioned that DEA has some advantages compared with
traditional approaches. For instance, it enables coinstantaneous analysis of multiple output and
multiple inputs and enables the inclusion of environmental and other qualitative factors, which
are highly important to evaluate performance; it can recognize the possibility of different but
equally efficient combinations of outputs and inputs (in different propositions); and it does not
require an explicit priori determination of relationships between outputs and inputs, or the
setting of rigid importance weights for the various factors. However, they demonstrated the
applicability of the DEA technique in seaport industry by constructing a hypothetical numerical
example data with four outputs and three inputs where the performances of 20 ports are
compared. They showed that DEA is a promising and easily adaptable method for obtaining
the relative efficiency ratings of seaport and it is possible for a series of secondary research to
provide a deeper insight into saeport performance and point out potentials for improvement
(Roll and Hayuth, 1993).
Valentine and Gray (2002) compare the efficiency of 31 North America and European ports
for the year 1998 forming outputs such as container a total throughput and the number of
containers and inputs, such as the total length of berth and container berth length. According
to these Authors the DEA method is useful to test the container seaport efficiency. Also, Barros
(2003) analyzed technical and allocative efficiency of five Portuguese ports from 1999 to 2000
using cross-section data. The main objective was to investigate how port regulatory procedures
affect the productivity of the port. He concluded that the incentive regulation for increasing
productive efficiency was not achieving its aims and proposed a policy revision to enforce
efficiency.
10
For inputs he took the number of employees and the book value of assets and for outputs he
took ships, movement of freight, gross tonnage, market share, break-bulk, containers, etc. The
same author with Athenassiou (2004) studied the relative efficiency of Portugues and Greek
ports using the DEA method. The results of the analysis indicated that there were inefficiency
ports which could improve their performance.
Kaisar et al. (2006) analyzed the port productivity using the DEA method. They determined an
efficient frontier or a set of the best practice seaports, which inefficient seaports may want to
emulate and then concentrated on the sources and the extent of inefficiency of ports which
could improve their operations. Assuming that the container port depends on the equipment
and information technology and by the competition among ports, the main objective of their
study was to minimize the use of inputs (the total quay length and the quay gantry cranes) and

European Journal of Logistics Purchasing and Supply Chain Management
Vol.2, No.3, pp. 39-78, December 2014
Published by European Centre for Research Training and Development UK (www.eajournals.org)
45 ISSN 2054-0930 (Print), ISSN 2054-0949 (Online)
to maximize the output (container throughput). The annual panel data from 1998 to 2003 have
been collected for each of the twenty-five ports.
DEA Window Analysis
Cullinane et al. (2004) in their study evaluated the efficiency score of the world’s major
container sea-ports over time with the DEA window analysis using panel data and cross-section
data. They compared the cross-section method and the panel data with the window analysis
concluding that the cross-section method did not yield port performance in detail. Also, Min
and Park (2005) used the DEA window analysis to evaluate the efficiency of 11 container
terminals in a period of four years. The applied DEA window analysis enables observation of
the changes in length, terminal efficiencies over time.
The data included the total quay length, the number of cranes, labor number; size of storage all
belonging to inputs and cargo throughout as the output. Cullinane and Wang (2006) studied
the efficiency of 69 container terminals with an annual throughput over 10,000 TEUs in Europe
using cross-sectional DEA. They pointed to the existence of the significant inefficiency for the
most of the terminals. It has been evidenced that the average efficiency of container terminals
located in different regions differs, either to a large or to a small extent. The inputs were the
terminal length, size of terminal area, equipment (expressed in numerical value), while
container throughput was the output.
Conceptual Framework
The research was guided by a Conceptual Framework that is indicated by the independent and
dependent variables.
Independent Variables Dependent Variable
Figure 2.1 Conceptual Framework
Quay Crane - Loading of truck/vessel
- Unloading of truck
Dwell time - Transactional dwell time
- Discretionary dwell time
- Infrastructure - Physical infrastructure
- Soft infrastructure
Container Terminal Efficiency
- Increase in input (performance)
- Increase in output (throughput of
container
Custom Clearance - Security and custom
practices
- Integrated IT System

European Journal of Logistics Purchasing and Supply Chain Management
Vol.2, No.3, pp. 39-78, December 2014
Published by European Centre for Research Training and Development UK (www.eajournals.org)
46 ISSN 2054-0930 (Print), ISSN 2054-0949 (Online)
Review of Variables
Quay crane
The quay crane operation is one of the important operations for the container terminal logistics,
which carries out loading a container from a truck to a vessel or unloading a container from a
vessel to a truck. Several major container terminal operations influence the efficiency of
container terminal, which include the vessel berthing operation, the crane unloading/loading
operation, the container delivery operation by trucks, the inspection operation, and the
container storage operation. Of those operations, the crane operation is the key factor that
determines the efficiency and effectiveness of a container terminal (Lee, Wang and Miao, 2000;
Rodrigues, Xiao and Zhu, 2002; Kim and Park, 2004). When a container vessel is moored at
berth, several cranes are arranged to load or unload containers for that vessel. Unloaded
containers are transported by trucks and then go through other terminal operations. After
finishing all unloading jobs, cranes will start load containers from land side on to the container
vessel (Lee, Wang and Miao, 2000; Rodrigues, Xiao and Zhu, 2002; Kim and Park, 2004).
These interfaces are the quayside with loading and unloading of vessels, and the landside where
containers are loaded and unloaded on and off trucks and trains. A container yard connects the
quayside and landside, and provides space for container storage. Containers are stored either
in stacks on the yard deck, or on truck chassis. Under a chassis storage system, each container
is individually accessible providing fast transfer to landside movements. Yard cranes are
utilized to access containers and reposition them within the stack. Because of increased demand
and limited storage space in most modern seaports, nowadays stacking on the ground is the
most commonly used storage approach (Steenken et al. 2004).
13
When a vessel arrives in a seaport, it first has to moor for container loading and unloading. For
this purpose, a number of berths are available at container terminals. Berths have very large
construction costs, and therefore the number and length of berths at a container terminal is one
of the most important strategic decisions that must be made at the strategic level. Berthing
decisions initiate the work within a terminal by pushing and pulling containers into and from
the yard storage areas. Obviously, the utilization of berths directly affects the overall utilization
of the terminal, and therefore the operational level decision of allocating berth space to vessels
is crucial. Most container berths in the large ports of the United States and Japan are leased by
ship operators. Under such arrangements, ocean carriers are directly responsible for the
containers. Such berthing systems are called dedicated berth systems, and terminals operating
with dedicated berths are called dedicated terminals Vis & de Koster, 2003)
An alternative system, known as public berths, is used by many major hub ports like Hong
Kong, Singapore, Rotterdam, and Hamburg. Public berth systems are used in multi-user
terminals that process the vessels of different carriers, and generally have longer berths and
higher berth utilization rates than dedicated terminals. When a vessel is moored at a berth, the
unloading and loading of containers begins. Quay cranes are the standard equipment designed
for this task. A quay crane is a special type of gantry crane having a large steel framework,
which is positioned along the wharf (or quay) alongside a berthed vessel. Quay cranes are
generally classified by their lifting capacity, and the size of the container ships they can load
and unload. A Panamax crane can fully load and unload containers from a container vessel
capable of passing through the Panama Canal (vessels 12-13 container rows wide). A Post-
Panamax crane can fully load and unload containers from larger container vessels up to about
18 container rows wide. The largest modern container cranes are classified as Super-Post
Panamax, and are used for vessels up to 22 container rows wide (Steenken et al. 2004).

European Journal of Logistics Purchasing and Supply Chain Management
Vol.2, No.3, pp. 39-78, December 2014
Published by European Centre for Research Training and Development UK (www.eajournals.org)
47 ISSN 2054-0930 (Print), ISSN 2054-0949 (Online)
A modern container crane capable of lifting two 20-ft containers at one time generally has a
lifting capacity of at least 40 tonnes. Some new cranes have now been built with 120 tonne
load capacity enabling them to lift up to four twenty foot or two forty foot long containers. The
speed of quay cranes during unloading and loading movements is also important. Modern quay
cranes have hoisting speeds of 60-80 m/min when carrying a load. Trolley speeds can exceed
140 m/min. Given these parameters, it takes about 90 seconds to load or unload a single 40-ft
container with an experienced crane operator. Post-Panamax cranes weigh approximately 800-
900 tonnes while the newer generation Super-PostPanamax cranes can weigh 1600-2000
tonnes (Vis & de Koster, 2003; Stahlbock, and Voss, 2008).
Dwell Time
Container dwell time is one of the many performance indicators to assess the efficiency of
terminal operation. As compared to standard indicators such as ship turnaround time or
productivity indicators it is however not yet widely used for global benchmarking purposes. It
is therefore challenging to define standard limits above which dwell time would be considered
too long in any given seaport. Maritime industry sector experts tend to agree however on a 3
to 4 days representative mean value (Goardon, 2003). From a national perspective, the issue of
dwell time has been specifically identified as a major hindrance to Kenya economic
development for a long time (KPA, 2009).
The average current dwell time is 5 days depending on where the goods are destined – it does
not compare favorably with international standards which are typically 1 – 3 days. On the other
hand, gateways seaports are not only gateways, they are also a place of integration a number
of players within the supply chain: port operators, public administration and authorities,
brokers or intermediaries and shippers.
15
Each of these players has a specific use of the seaport that conditions its perception of the long
dwell time issue. For the terminal operations at the Mombasa Entry Port – there is a direct
relationship between distribution of dwell times and terminal occupancy. It therefore needs to
precisely evaluate a standard dwell time beyond which the efficiency of the terminal is
negatively affected. This standard is the free time period defined “as the period during which
a container can reside in the container yard without being assessed a demurrage fee” (Huynh,
2006).
According to UNCTAD (1995) it should correspond from a user perspective to the “sufficient
time to allow efficient importers to clear their cargo” (UNCTAD, 1995), but in practice, the
seaport authority and terminal operators define this free time according to capacity constraints,
profit maximization, container traffic patterns or other consideration (for instance
differentiation between transit and domestic goods), and they tend to reduce it for example
when facing high congestion patterns. As for shippers (importers or exporters) dwell time in
seaports can be assimilated to a temporary storage period which is justified either by the time
necessary to complete cargo clearance formalities (transactional dwell time) or by a decision
to leave cargo in the port for a definite number of days superior to that clearance delay
(discretionary dwell time) . For containerized imports, cargo dwell time is defined as the time
between vessel arrival and container exist from the port facilities – exceeds 20 days in average
for most seaport in developing countries which makes them the most time-inefficient seaport
in the world (UNCTAD, 2003).
European Journal of Logistics Purchasing and Supply Chain Management
Vol.2, No.3, pp. 39-78, December 2014
Published by European Centre for Research Training and Development UK (www.eajournals.org)
48 ISSN 2054-0930 (Print), ISSN 2054-0949 (Online)
From a transport service perspective, container terminals are nothing more than intermodal
nodes in global transport chains. Their basic function is then to transfer efficiently utilized
cargo from a maritime transport mode (container ship) to a land transport mode (rail and truck)
and vice-versa. The efficiency of this transfer operation is then assessed against performance
objectives which are in general berth, yard and quay productivity objectives. If we focus
specifically of time performance of entry ports for containerized imports we can however
simply look at the agility at which containers are physically transferred from the containership
to the land transport mode via the container yard. This total time for the physical transfers only
plus the necessary idle time between operations is defined as operational dwell time
(UNCTAD, 2003).
Infrastructure
The critical role that container infrastructure plays in favoring the economic development of a
country or region is well established. Infrastructure is the necessary condition for efficient
cargo handling operations and adequate infrastructure is needed to avoid congestion, foster
trade development as well as securing deep-sea container connectivity for economies heavily
dependent on international trade. Container infrastructure, however, needs to be complemented
by efficient hinterland transport connections if the port is to fully exploit its potential as growth
catalyst and supply chain node (Suykens and van de Voorde 1998). Unfortunately, it is not
uncommon for development projects to focus exclusively on enhancing the infrastructural
capabilities of the port, without adequate consideration of the hinterland connections.
The urgency of looking at port and terminal development in conjunction to their hinterland
connectivity is exacerbated by the pressure on container terminals to increase their efficiency
levels resulting from the rapid growth of containerized cargo traffic flows and their increased
variability (Haralambides 2002).
As port capacity cannot be developed as rapidly as increases in demand (Haralambides 2002),
any overcapacity is eventually exhausted and episodes of congestion ensue even in the most
efficient terminals. This calls for a phased but continuous and well-coordinated effort in
expanding container capacity at terminals. Terminal operations are affected not only by the
larger number of vessel calls but also by the increased variability of call sizes. As Vessels of
over 15000 TEU are becoming increasingly common, despite the fact that they may only be
able to access a few large hubs (Cullinane and Khanna 1999). This will concentrate container
flows on a few megaports, in turn impacting berth and crane productivity of the terminal and
adding pressure on hinterland links, often with adverse effects on congestion and the
environment (Yap and Lam 2013).
The expected increase in transshipment associated with larger vessel size, is likely to influence
the terminals not only forcing them to handle higher volumes in the same period of time, but
also to reduce the variability of their operations (i.e. increase reliability) in order to guarantee
seamless flows of cargo among transshipment ports and/or transshipment port and feeder ports
(Gilman 1999). The increases in productivity and reliability at terminals will require more
tracking, greater container visibility and more emphasis on environmental and regulatory
compliance particularly as terminals now occupy critical positions the supply chain
(Notteboom 2008).
Generally, infrastructure is divided into physical and soft elements. Physical infrastructure
includes not only the operational facilities such as the number of berths, the number of cranes,
European Journal of Logistics Purchasing and Supply Chain Management
Vol.2, No.3, pp. 39-78, December 2014
Published by European Centre for Research Training and Development UK (www.eajournals.org)
49 ISSN 2054-0930 (Print), ISSN 2054-0949 (Online)
yards and tugs and the area of storage space, but also the intermodal transport such as roads
and railways (Tongzon and Heng, 2005). Whereas, the soft infrastructure refers to the
manpower employed. Maximum deployment of both types will assist in reducing vessel
turnaround, thereby increasing the terminal capacity to accommodate more containers. Ships
are continually increasing their carrying capacity and container made for large transport units
in overseas container transport are under consideration. This scale enlargement requires new
and capital-intensive transshipment facilities in gateway ports. Particularly, inter-modality is
essential for the speedy transport of cargoes into and out of a gateway port. Without proper
linkages, the efficiency of container terminal operation may decline due to congestion and
delays (Tongzon and Heng, 2005).
Custom Clearance
The impact on operations of custom clearance procedures at ports and in transportation is well
established (Clark, Dollar and Micco 2004, Haralambides and Londoño-Kent 2004), and one
of the main advantages of dry port is the possibility of concentrating custom inspections outside
of the seaport terminals (Roso 2008, Roso, Woxenius and Lumsden 2009b). One of the first
definitions of dry ports, Inland Clearance Depot, (UNECE 1998) specifically accounted for the
provision of customs clearance services. These facilities are defined as inland intermodal
terminals dedicated to the handling and storage of goods under custom transit. The typology of
operations performed in dry ports differ globally but typically include good clearance for
temporary storage for onward transit, export, warehousing or import.
The provision of custom clearance and quarantine services imposes high security procedures
for accessing the dry port, similarly to seaports, and depending on the country may include
high fencing, cameras and guards (Roso and Lumsden 2010).
The port of Mombasa is vital to Kenya’s domestic economics. Maritime trade accounts for
more than 70% of the port of Mombasa’s total cargo volume, and that volume is growing at
around 12% per year (KPA, 2009). The imports and exports play a fundamental role in
facilitating Kenya’s integration to international trade. However both importers and exporters
face high costs for sea transport and substantial inefficiencies in port clearance procedures.
UNCTAD (2003) reports that the average freight rate for imports for example is 47% higher
than in most developing countries and twice the rate in developed countries, estimated at 5.21%
(UNCTAD, 2003). From a political economy perspective however, entry ports are also the
place where the customs clearance procedures are completed to allow goods to enter
definitively or temporarily into the country. For country like Kenya it is a critical function as
duties and taxes collected at the Mombasa Entry Port are very essential contributor to the state
revenues (KPA, 2009). The efficiency of customs at the Port of Mombasa is then closely
monitored with a focus mostly on revenue collection performance. However, there is a growing
awareness of the significance of customs clearance time efficiency to facilitate international
trade. In theory, the time to perform import clearance formalities starts much before
containership arrival and is not therefore strictly related to cargo dwell time. But in fact the
bulk of formalities are still performed after ship arrival in most developing countries ports
despite trade facilitation initiatives of which Mombasa port is no exception (UNCTAD, 2003).
Customs clearance and cargo dwell time are therefore closely related. Customs take (sometimes
rightly) a large share of the blame for long delays, but they are not alone (UNCTAD, 2003).

European Journal of Logistics Purchasing and Supply Chain Management
Vol.2, No.3, pp. 39-78, December 2014
Published by European Centre for Research Training and Development UK (www.eajournals.org)
50 ISSN 2054-0930 (Print), ISSN 2054-0949 (Online)
For some operations, customs clearance is efficiently managed by shipper and clearing and
forwarding agents, and transactional dwell time is not a major contributor to total dwell time.
For other however the time lost in the clearance process because of missing documents, errors
in the declaration or simply lack of anticipation is so important that it explains an important
proportion of long delays. Moreover, customs administration are just one player among others
players who manage official formalities. Nevertheless, in terms of dwell time, customs
processes still usually “mark” the beginning and the end of most of the processes (UNCTAD,
2003). Security and custom regulation can impose substantial delays in the operation of the
terminal and it is therefore essential that coordination with the agencies responsible for these
activities is negotiated and security practices are embedded in terminal management. Literature
now exists in the area on security for container logistics (Acciaro and Serra, 2013), but major
issues remain with reference to the impact of scanning procedures (Bakshi, Flynn and Gans,
2011) ISPS code (Yang, 2010, Yeo, Pak and Yang, 2013).
Empirical Review
Some scholars (Tongzon, 1995; de Langen, 2003) have researched factors influencing cargo
flow. Other studies (TongzonetHeng, 2005; de Langen, 2007; Wiegmans et al, 2007; Chang et
al, 2008; Tongzon, 2002; 2009) have focused factors influencing the choice of ports. These
studies are interdependent since the cargo flow depends on the port choice of port users. Using
these findings is particularly interesting in order to understand which variables can be included
in the model. Additionally, advantages such as the location of the port and the distance to the
consumer markets play an important role in the volume of port throughput. However, more
factors of ports determine the terminal throughput volumes.
Also, Tongzon (1995) determines that cargo flow is dependent on the following factors: the
first factor is the geographical location of a port. If the port is located on an easily accessible
location by different modalities, more cargo is likely to flow to that specific port. The second
factor is the frequency of ship calls. The higher the frequency of ship calls, the higher the port
throughput. The third factor is the terminal efficiency. This indicator can be measured by
looking at the container mix, the crane efficiency, the size of the vessels and cargo exchange
(economies of scale), average number of container handled per hour. Again, Tongzon states
that port charges could also be included as variable in the model. However their contribution
to the total costs is relatively small (Tongzon, 1995)
Conversely, some scholars (TongzonetHeng, 2005; de Langen, 2007; Wiegmans et al, 2007;
Chang et al, 2008; Tongzon, 2002; 2009) have identified factors influencing the choice of port
users. The studies determine choice factors of different port users. These studies are relevant
for this research since the choice of the port users determine the cargo flows to the ports. The
most discussed factors from these studies are, besides the location, the physical and technical
infrastructure, the port efficiency, the hinterland connections, the port charges and the available
(logistic) services. The physical and technical infrastructure includes port physical
characteristics such as the depth of the water, the type of cranes in the port and the meters of
quay. These variables indicate the limits of the capacity of the port and so the possible port
throughput (Tongzon et Heng, 2005; de Langen, 2007; Wiegmans et al, 2007; Chang et al,
2008; Tongzon, 2002; 2009). On the other hand, port competition has had an impact on the
port choice factors. Containerization has led to standardization in the maritime industry,
implying that ports cannot rely on specialization to maintain their market share and to generate
revenues as much as they used to do (OECD, 2008). By containerization, ports in the same
region became closer substitutes for the port users.
European Journal of Logistics Purchasing and Supply Chain Management
Vol.2, No.3, pp. 39-78, December 2014
Published by European Centre for Research Training and Development UK (www.eajournals.org)
51 ISSN 2054-0930 (Print), ISSN 2054-0949 (Online)
Furthermore, port competition has moved from competition between ports to between transport
chains (de Langen et al, 2010). Hinterland connections are of vital importance for a port,
because container ports are nowadays a link in a logistics chain (de Langen et al, 2010).
Nevertheless, this implies that the quality of the hinterland connections and the diversity of the
modalities available determine the level of container terminal throughput. Additionally, the
costs of hinterland have become relatively important. However, OECD (2008) states that the
cost per kilogram per km on the hinterland is 5 to 30 times as high (this depends on the
hinterland transport mode) as the shipping cost by sea. Also port charges have an influence on
the competitive position of the port; they include taxes, administration costs and shipping
tariffs. Port users prefer the port with the best price/quality ratio. However port charges are not
the most important choice influencer since this indicator is mentioned lower in the list
compared to the other factors in several studies. Also, Tongzon (1995) states that port charges
form an extremely low proportion of the overall costs of international trade. To make a link
between port competition and the psychical and technical infrastructure: when these
infrastructures are strongly congested, their quality decrease and this weakens the ports
competitive position.
Critique of the existing literature relevant to the study
In this critique of existing literature, the researcher had discussed two major theories: Data
Envelopment Analysis (DEA) proposed by Roll and Hayuth, (1993) and the DEA Window
Analysis by Cullinane et al. (2004). The researcher agrees with these authors that both DEA
and DEA Window Analysis are appropriate with evaluating the efficiency of container
terminal.
The theme of this well researched and powerfully argued volume is that seaports service
organizations are very complex and as such there are long list of outputs and inputs
characterizing the operations of ports. Firstly, Roll and Hayuth (1993) argue that due to the
complexity of factors influencing port efficiency, it is difficult to determine the efficiency and
the extent to which a port’s resources are fully exploited in achieving the goals (Roll and
Hayuth, 1993). The authors further argue that DEA is considered as one of the most suitable
tools for measuring port efficiency. They argue that DEA is considered as one of the most
suitable tools for measuring port efficiency. However, Roll and Hayuth (1993) expand on this
idea by mentioning that DEA has some advantages compared with traditional approach. Their
argument was backed by giving example where DEA enables coinstantaneous analysis of
multiple output and inputs which also enable the inclusion of environmental and other
qualitative factors that are highly important to evaluated efficiency. Additionally, the
applicability of DEA technique in port industry was constructed using hypothetical numerical
example data with four outputs and three inputs where the efficiency of 20 ports was compared.
The result from their test shows that DEA can easily be adopted for obtaining the relative
efficiency ratings of port and terminal.
Their contention is supported by a case study conducted by Valentine and Gray (2002) which
compare the efficiency of 31 North America and European ports for the year 1998 forming
outputs such as container a total throughput and the number of container and inputs, such as
the total length of berth and container berth length. Their argument was also in agreement with
Roll and Hayuth (1993) that DEA method is useful to test the efficiency of container terminal.

European Journal of Logistics Purchasing and Supply Chain Management
Vol.2, No.3, pp. 39-78, December 2014
Published by European Centre for Research Training and Development UK (www.eajournals.org)
52 ISSN 2054-0930 (Print), ISSN 2054-0949 (Online)
Furthermore, Barros and Athenassiou (2004) supporting the contention of Roll and Hayuth
(1993) studied the relatively efficiency of Portuguese and Greek ports using the DEA method.
The results of the analysis indicate that there were inefficiency ports which could improve their
performance. On the other hand, Kaisar et al. (2006) analyzed the port productivity using DEA
method. According to the authors, DEA is also best for evaluating the efficiency of container
terminal.
Secondly, Cullinane et al. (2004) evaluated the efficiency score of the world’s major container
seaports over time with DEA Window Analysis using panel data and cross-section data.
Moreover, Cullinane et al. (2004) contention was further supported by Min and Park (2005)
when they used the DEA Window Analysis to evaluate the efficiency of 11 container terminals
in a period of four years. They found out that the DEA Window Analysis enable observation
of the changes in length, terminal efficiencies over time. In additional to the contention of
Cullinane et al. (2004), a case study on 69 container terminals with an annual throughput over
10,000 TEUs in Europe using cross-sectional DEA was conducted by Cullinane and Wang
(2006). The results from their study point to the existence of the significant inefficiency of
container terminals located in different regions differ, either to a large or to a small extent. In
their analysis, the inputs were the terminal length, size of terminal area, equipment (expressed
in numerical value), while container throughput was the output.
Research Gaps In view of the various studies reviewed, there are some new efforts present in the literature,
which relate to niche issues stemming from the current political, economic, technological and
business developments at a global level. The first group of works stems from the current
development in port security aspect. The works of Bichou (2011) and Guan and Yang (2010)
are among the most recent works dealing with container terminal security aspects and the
possible bottlenecks created. The second type of problems, relate to supply chain aspects and
the role of ports and container terminals in the design of modern supply chains. The works of
Ribinson (2002), Panayides (2006) and Parola and Sciomachen (2005) are among the first who
tackled the problem at a port level. The aim of these works is to identify the current trends in
modern supply chains and find ways of integrating port operations at the best level possible.
More focused on container terminals due to the increasing role of container cargo in global
trade are the work of Fan, Wilson, and Tolliver (2009), Panayides and Son (2008), Van Der
Horst and De Langen (2008), Notteboom and Rodrigue (2008) and Rodrigue and Notteboom
(2009). In these works, the reader can find interesting aspects of containerized global supply
chains with comparisons not only of different terminals but of trade routes and cargoes as well.
Summary
This paper has assessed factors influencing container terminal efficiency. The review of the
study has been concentrated on theories and empirical studies that have made an effort towards
establishing factors influencing container terminal efficiency. Some of these factors discussed
were: turnaround time of ships and cargo dwell time, capacity and infrastructure, quay crane,
custom clearance, etc. Also, the review has shown that there are numerous theoretical
perspectives and models on container terminal efficiency which have been developed for
container terminal industry. For the purposes of the research project, the review has
concentrated on two aspects of the theories on container terminal efficiency: the Data
Envelopment Analysis (DEA) first proposed by Roll and Hayuth (1993); while several
researchers (Cullinane et al., 2004; Min and Park, 2005; Cullinane and Wang, 2006) have
European Journal of Logistics Purchasing and Supply Chain Management
Vol.2, No.3, pp. 39-78, December 2014
Published by European Centre for Research Training and Development UK (www.eajournals.org)
53 ISSN 2054-0930 (Print), ISSN 2054-0949 (Online)
conducted studies using the DEA Window Analysis method to measure the efficiency of
container terminal.
On the other hand, the empirical review has presented some scholars (Tongzon, 1995; de
Langen, 2003) who have researched on factors influencing cargo flow. Other studies
(TongzonetHeng, 2005; de Langen, 2007; Wiegmans et al, 2007; Chang et al, 2008; Tongzon,
2002; 2009) have focused on factors influencing the choice of ports.
RESEARCH METHODOLOGY
Research Design
The study employed an exploratory approach using a descriptive survey design to assess factors
influencing container Terminals efficiency; a case study of the Mombasa Entry Port. A
descriptive research design presents and reports the way things are (Mugenda and Mugenda,
2003). Also, descriptive research design is used when data are collected to describe persons,
organizations, settings or phenomena (Creswell, 2003). Kothari (2008) mentions that
descriptive design has enough provision for protection against bias and ensure reliability.
The study adopted a quantitative survey as a major method. Quantitative surveys are designed
to fit a questionnaire schedule. This is most commonly used technique in research (Veal, 2006).
Target Population
Sekaran (2010) refers to population as the entire group of people or things of interest that the
researcher aims to assess. Population as defined by Mugenda and Mugenda (2003) is an entire
group of individual or objects having common observable characteristic. The study therefore
took all person involved in the operations of container terminal in the port of Mombasa as well
as stakeholders who make use of the facility in port operations.
The target population included Kenya Port Authority, Conventional Cargo Operations, and
Container Terminal Operations. The number of these people when put together is
approximately 500. Therefore the study targeted 500 people.
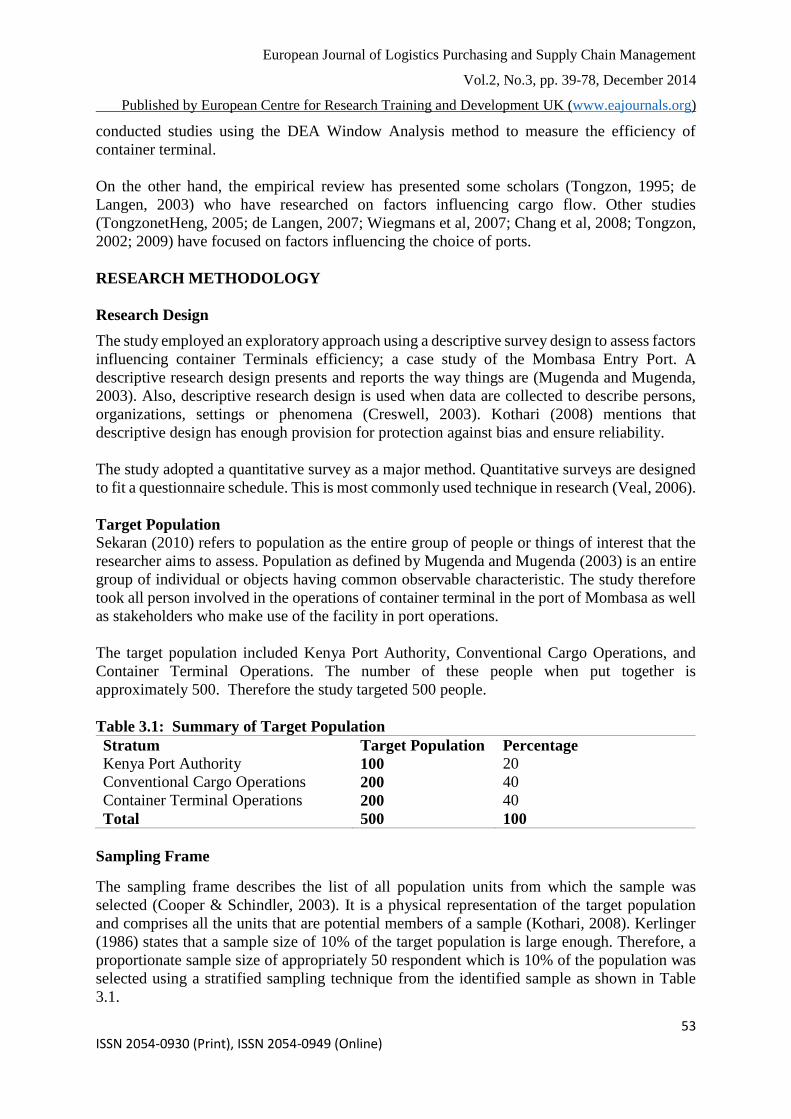
Table 3.1: Summary of Target Population
Stratum
Kenya Port Authority
Conventional Cargo Operations
Container Terminal Operations
Total
Target Population
100
200
200
500
Percentage
20
40
40
100
Sampling Frame
The sampling frame describes the list of all population units from which the sample was
selected (Cooper & Schindler, 2003). It is a physical representation of the target population
and comprises all the units that are potential members of a sample (Kothari, 2008). Kerlinger
(1986) states that a sample size of 10% of the target population is large enough. Therefore, a
proportionate sample size of appropriately 50 respondent which is 10% of the population was
selected using a stratified sampling technique from the identified sample as shown in Table
3.1.

European Journal of Logistics Purchasing and Supply Chain Management
Vol.2, No.3, pp. 39-78, December 2014
Published by European Centre for Research Training and Development UK (www.eajournals.org)
54 ISSN 2054-0930 (Print), ISSN 2054-0949 (Online)
Table 3.2: Sampling Frame
Department-
Section/Unit
Kenya Port Authority
Conventional Cargo Operations
Container Terminal Operations
Total
Target
Population
100
200
200
500
Frequency
10
20
20
50
Percentage
10%
10%
10%
100%
Sampling and Sample size
Keller (2009) indicates that a sample is a set drawn from the entire population. A stratified
sampling technique was employed to stratify three (3) units at the Port of Mombasa: Kenya
Port Authority (KPA) with 100; Conventional Cargo Operations with 200 and Container
terminal Operations with 200. As Kothari (2004) expresses, a sample size between 10% and
20% is considered adequate for in-depth studies. Therefore, the sample size for this study was
10%.
Instruments
The main instrument employed for data collection in this research was questionnaire. A 1 – 3,
1 – 4 and 5-point Likert scale questionnaire was administered to the respondents.
Data Collection Methods
The data collection process was done through a systematic sequence of events. The process
began by first seeking permission from the Principal Human Resources Development Officer
of Kenya Port Authority in order to avoid any possible stop that might have arisen from lack
of permission to conduct the research. 30 This was followed by sample selection based on the
strata as explained in the sampling technique above. However, the researcher made a self-
introduction and requested for consent of the respondents in taking part in the exercise.
Subsequently, questionnaires were them administered to the respondents. On the other hand,
the secondary data were collected from existing literature relating to the study topic.
Reliability and validity
“It is important that all surveys are tested before the actual survey is conducted. This is done
to ensure that the questionnaire is cleared to respondents and can be completed in the way the
researcher wishes” (John Adams et al., 2007). Pilot testing is an activity that helps the study in
determining whether there are errors, limitations, or other weaknesses within the design and
allow the researcher to make necessary adjustments and corrections before embarking on the
survey. A pilot study was undertaken on approximately 10 freight forwarder and shipping lines
agents since they are directly involved with container operations to test the reliability and
validity of the questionnaire.
Data Processing and Analysis
Data for this study was quantitative in nature. Quantitative analysis was done for the numerical
data obtained from the field. This was done using descriptive statistics with the help of
Statistical Package for Social Sciences (SPSS) and Microsoft Excel 2013. The responses in the
questionnaire was coded into common themes to facilitate analysis. Data was presented in

European Journal of Logistics Purchasing and Supply Chain Management
Vol.2, No.3, pp. 39-78, December 2014
Published by European Centre for Research Training and Development UK (www.eajournals.org)
55 ISSN 2054-0930 (Print), ISSN 2054-0949 (Online)
descriptive form supported by tables, frequency distributions and percentages. The researcher
used likert scale as parameter to measure the variables.
RESEARCH FINDINGS AND DISCUSSIONS
Introduction
The chapter represents the empirical findings and results of the research. The data presented
includes response rate, background information of the respondents and the presentation of
research findings against each individual specific objective. Descriptive statistics was also
employed in analyzing the findings.
Response Rate
From the data collected, out of 60 questionnaires administered, 30 were filled and returned
which represents 50% response rate. Such a response rate is considered adequate according to
Mugenda and Mugenda (2003) who mentioned that a 50% response rate is adequate, 60% good
and above, while 70% is rated very good. This also collaborates with Bailey (2000) assertion
that a response rate of 50% is adequate, while a response rate greater than 70% is very good.
This infers that the response rate in this case of 50% was an adequate representation of the
entire targeted population.
Data Presentation and Findings
Background Information
The study sought to establish the background information of the respondents by using the
following parameters: gender, age, level of education, type of organization, name of
department section/unit, position held by the respondents, and number of years respondents
have been working with the department.
Gender Distribution
Table 4.1: Gender of the Respondents
Gender
Male
Female
Total
Frequency
22
8
30
Percentage
73.3%
26.7%
100
The descriptive statistics of the study indicates that 22 (73.3%) of the respondents were male,
while the remaining 8 (26.7%) were female as shown in Table 4.1. This implies that male
respondents participated more in answering the questionnaires.
Age of the Respondents
Table 4.2: Age of the Respondents
Age
Less than 24 years
25 – 29 years
30 – 45 years
46 – 50+ years
Total
Frequency
0
0
21
9
30
Percentage
0%
0%
70%
30%
100
European Journal of Logistics Purchasing and Supply Chain Management
Vol.2, No.3, pp. 39-78, December 2014
Published by European Centre for Research Training and Development UK (www.eajournals.org)
56 ISSN 2054-0930 (Print), ISSN 2054-0949 (Online)
The finding shows that 70% of the respondents are aged between 30 – 45 years, 30% of the
respondents are aged between 46 – 50+ years. This implies that majority of the respondents are
aged between 30 – 45 years.
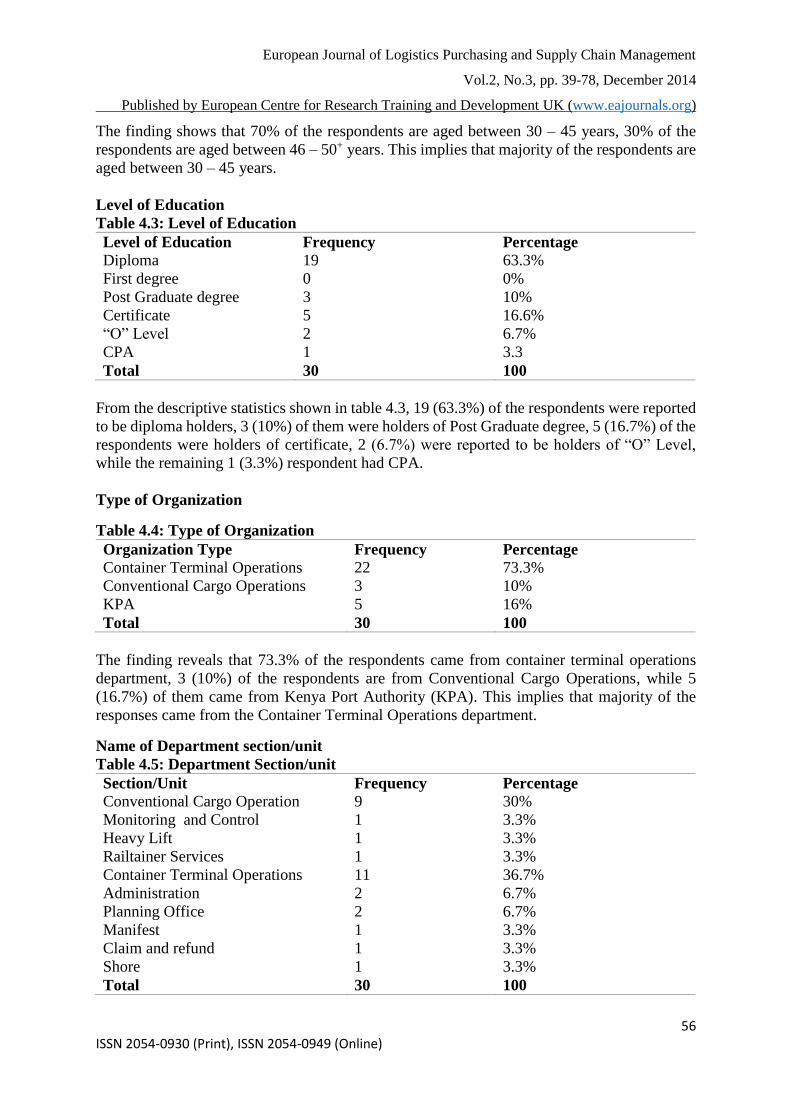
Level of Education
Table 4.3: Level of Education
Level of Education
Diploma
First degree
Post Graduate degree
Certificate
“O” Level
CPA
Total
Frequency
19
0
3
5
2
1
30
Percentage
63.3%
0%
10%
16.6%
6.7%
3.3
100
From the descriptive statistics shown in table 4.3, 19 (63.3%) of the respondents were reported
to be diploma holders, 3 (10%) of them were holders of Post Graduate degree, 5 (16.7%) of the
respondents were holders of certificate, 2 (6.7%) were reported to be holders of “O” Level,
while the remaining 1 (3.3%) respondent had CPA.
Type of Organization
Table 4.4: Type of Organization
Organization Type
Container Terminal Operations
Conventional Cargo Operations
KPA
Total
Frequency
22
3
5
30
Percentage
73.3%
10%
16%
100
The finding reveals that 73.3% of the respondents came from container terminal operations
department, 3 (10%) of the respondents are from Conventional Cargo Operations, while 5
(16.7%) of them came from Kenya Port Authority (KPA). This implies that majority of the
responses came from the Container Terminal Operations department.
Name of Department section/unit
Table 4.5: Department Section/unit
Section/Unit
Conventional Cargo Operation
Monitoring and Control
Heavy Lift
Railtainer Services
Container Terminal Operations
Administration
Planning Office
Manifest
Claim and refund
Shore
Total
Frequency
9
1
1
1
11
2
2
1
1
1
30
Percentage
30%
3.3%
3.3%
3.3%
36.7%
6.7%
6.7%
3.3%
3.3%
3.3%
100

European Journal of Logistics Purchasing and Supply Chain Management
Vol.2, No.3, pp. 39-78, December 2014
Published by European Centre for Research Training and Development UK (www.eajournals.org)
57 ISSN 2054-0930 (Print), ISSN 2054-0949 (Online)
Table 4.5 shows that 30% of the respondents came from the Conventional Cargo Operations
department/section, 3.3% of the respondent came from monitoring and Control section, 3.3%
of the respondent works in Heavy Lift section, 3.3% of the respondent works in Railtainer
Services section, 36.7% of the respondents came from Container Terminal Operation
department/section, 6.7% of the respondent came from Administration, 6.7% of the
respondents came from Planning Office section, 3.3% of the respondent work in Manifest
section, 3.3% of the respondent work in Claim and Refund section, while 3.3% of the
respondent works in Shore section.
What is your position/status in the organization?
Table 4.6: Respondent Position
Position
Senior Manager
Middle Manager
Junior Manager
Operator
Clerical
Docker
Unionisable
Total
Frequency
2
5
18
0
3
1
1
30
Percentage
6.7%
16.7%
60%
0%
10%
3.3%
3.3%
100
The finding from Table 4.6 depicts that 6.7% of the respondents hold the position of Senior
Manager, 16.7% of the respondents hold the position of Middle Manager, 60% of the
respondents hold the position/status of Junior Manager, 10% of the respondents are clerical
workers, 3.3% of the respondent holds the position of Docker, 3.3% of the respondent holds
the position of Unionisable, while operator position accounts for 0%. This shows that majority
of the respondents hold the position/status of Junior Manager.
How many years have you worked in this organization?
Table 4.7: Number of Years you have worked in the organization
Year
Over 10 years
6 – 9 years
3 – 5 years
Less than 2 years
Total
Frequency
22
8
0
0
30
Percentage
73.3%
26.7%
0%
0%
100
The finding from Table 4.7 shows that 73.3% of the respondents have worked in their
respective department/section for over 10 years, 26.7% of the respondents have worked
between the periods of 6 – 9 years. While none of the respondents worked between a period of
3 – 5 years and less the 2 years respectively. This shows that majority of the respondents have
worked with their respective departments/sections at the Port of Mombasa for over 10 years.
Container Terminal Efficiency
To what extend do you agree or disagree with the following statement.
Container Terminal Efficiency can be measured by the level of increase in inputs and
throughput.

European Journal of Logistics Purchasing and Supply Chain Management
Vol.2, No.3, pp. 39-78, December 2014
Published by European Centre for Research Training and Development UK (www.eajournals.org)
58 ISSN 2054-0930 (Print), ISSN 2054-0949 (Online)
The study sought to find out the extent of agreement or disagreement as to whether container
terminal efficiency can be measured by the level of increase in inputs and throughput at the
Mombasa Entry Port. As Figure 4.1 indicates, 6.7% of the respondents strongly disagree, 3.3%
of the respondent disagree, 3.3% of the respondent was uncertain, 50% of the respondents agree
while 36.7% of the respondent strongly agree. The finding shows that increasing the level of
inputs and throughput in container terminal determines its efficiency.
37
Figure 4.1: Container Terminal Efficiency
How do you assess the throughput of container cargo at the Port of Mombasa Currently?
The study sought to assess the current throughput of container cargo at the Port of Mombasa.
It reveals that 40% of the respondents assess the throughput to be moderate, 53.3% assess it to
be high, 6.7% of the respondents assess it to be very high, while very low and low options
account for 0%. This implies that the throughput of container cargo at the Port of Mombasa
currently is encouraging, due to its high throughput.
Figure 4.2: Throughput of Container Cargo at the Port of Mombasa
Do you think by expanding the current terminal will increase the volume of container
inputs and throughputs respectively?
The study sought to ascertain as to whether expanding the current terminal will increase the
volume of container inputs and throughputs respectively at the Port of Mombasa. Of the 30
0
2
4
6
8
10
12
14
16
Strongly disagree Disagree No opinion oruncertain
Agree Strongly agree
Container Terminal Efficiency
0 2 4 6 8 10 12 14 16 18
Very low
Low
Moderate
High
Very high
Throughput of Container Cargo at the Port of Mombasa

European Journal of Logistics Purchasing and Supply Chain Management
Vol.2, No.3, pp. 39-78, December 2014
Published by European Centre for Research Training and Development UK (www.eajournals.org)
59 ISSN 2054-0930 (Print), ISSN 2054-0949 (Online)
respondents, 30% of the respondents indicate maybe, meaning they are not too certain, 70% of
the respondents overwhelmingly say yes, while 0% accounts for no. This infers that despite the
current level of improvement at the port, it is imperative for incremental expansion to increase
more container traffic.
Figure 4.3 Expansion of Current Terminal
How do you grade the current performance of container terminal at the port of
Mombasa?
The study aimed to grade the current container terminal performance at the port of Mombasa.
Out of the 30 respondents, 3.3% of the respondent grades the current performance very poor,
0% accounts for poor, 46.7% of the respondents grades the performance on the average, 36.7%
of the respondents grade the performance goo, while 3.3% of the respondent grades the
performance to be excellent. This concludes that the current performance of container terminal
at the Port of Mombasa is on the average.
Figure 4.4: Current Performance of Container Terminal at the Port of Mombasa
0
5
10
15
20
25
No Maybe Yes
0
9
21
EXPANSION OF CURRENT TERMINAL
0
2
4
6
8
10
12
14
VERY POOR POOR AVERAGE GOOD EXCELLENT
Current Performance of Container Terminal at the Port of Mombasa

European Journal of Logistics Purchasing and Supply Chain Management
Vol.2, No.3, pp. 39-78, December 2014
Published by European Centre for Research Training and Development UK (www.eajournals.org)
60 ISSN 2054-0930 (Print), ISSN 2054-0949 (Online)
Quay Crane
How do you rank the performance of Quay Crane in terms of loading and unloading of
vessels/trucks at the port of Mombasa?
A 5-point Likert Scale was used to rank the performance of Quay Crane in terms of loading
and unloading of vessels/trucks at the port of Mombasa. The finding shows that 43.3% of the
respondents rank the performance of Quay Crane on average, 50% of the respondents rank it
good, 6.7% of the respondents rank the performance to be excellent, while very poor and poor
were left unanswered. Therefore, the findings concludes that the performance of the Quay
Crane in terms of loading and unloading of vessels/trucks at the port of Mombasa is good.
Figure 4.5 Quay Crane Performance Ranking
How do you grade the operational effectiveness of the current quay crane at the terminal?
The study sought to grade the operational effectiveness of the current Quay Crane at the
terminal. Finding reveals that 3.3% of the respondents grades the operational effectiveness
ineffective, 53.3% of the respondents grade it on average, 36.7% of the respondents grade the
operational effectiveness very effective. This implies that the operational effectiveness of the
current quay crane at the terminal is on average.
Figure 4.6: Operational Effectiveness of Quay Crane
On average, how could you measure yard crane operational efficiency?
0 2 4 6 8 10 12 14 16
VERY POOR
POOR
AVERAGE
GOOD
EXCELLENT
0
0
13
15
2
Quay Crane Performance ranking
0%3%
53%37%
7%
Operational Effectiveness of Quay Crane
Very ineffective
Ineffective
Average
Effective
Very effective

European Journal of Logistics Purchasing and Supply Chain Management
Vol.2, No.3, pp. 39-78, December 2014
Published by European Centre for Research Training and Development UK (www.eajournals.org)
61 ISSN 2054-0930 (Print), ISSN 2054-0949 (Online)
A 5-point Likert Scale was used to measure yard crane operational efficiency. Of the 30
respondents, 6.7% of the respondents’ measure yard crane operational efficiency very good,
36.7% of the respondents measure it good, 56.7% say satisfactory, while poor and very poor
were left unanswered.
Figure 4.7: Yard Crane Operational Efficiency
4.6 Dwell Time
Table 4.8: Dwell time as an indicator to assess container terminal efficiency
Option
Strongly disagree
Disagree
No opinion or uncertain
Agree
Strongly agree
Total
Frequency
0
0
0
12
16
30
Percentage
0%
0%
0%
40%
60%
100
The study sought to find out the extent of agreement or disagreement as to whether dwell time
is an indicator to assess container terminal efficiency at the Port of Mombasa. As Table 4.8
depicts, 40% of the respondents agree, 60% of the respondent strongly agree, while strongly
disagree, disagree and uncertain were unanswered. The finding shows that dwell time is used
as an indicator to assess the efficiency of container terminal.
Table 4.9 Turnaround time of trucks at the Port of Mombasa
Option
Very much below average
Below average
Above average
Very much above average
Total
Frequency
0
18
11
1
30
Percentage
0%
60%
36.7%
3.3%
100
Very good Good Satisfactory Poor Very poor
2
11
17
0 0
YARD CRANE OPERATIONAL EFFICIENCY

European Journal of Logistics Purchasing and Supply Chain Management
Vol.2, No.3, pp. 39-78, December 2014
Published by European Centre for Research Training and Development UK (www.eajournals.org)
62 ISSN 2054-0930 (Print), ISSN 2054-0949 (Online)
The study sought to find out the average position of turnaround time of trucks at the Port of
Mombasa. Table 4.8.1 shows that, of the 30 respondents, 60% of the respondents place the
turnaround time of trucks below average, 36.7% of the respondent place it above average, 3.3%
of the respondent indicates very much above average, while very much below average was
unanswered. This infers that the turnaround time of trucks at the Port of Mombasa is below
average.
Table 4.10 Container ships Port of Call
Option
Hardly ever
Occasionally
Sometimes
Frequently
Almost always
Total
Frequency
0
0
1
19
10
30
Percentage
0%
0%
3.3%
63.3%
33.3%
100
A 5-point Likert Scale was used to establish the frequency of calls for container ships at the
Port of Mombasa. The finding shows that 3.3% of the respondent says sometimes, 63.3% of
the respondents say frequently, 33.3% of the respondents say almost always, while hardly ever
and occasionally were unanswered. This infers that many container ships are called at the port
of Mombasa frequently, due to its strategic location and being the major harbors for East
Africa.
Table 4.11 Transactional dwell time at the port of Mombasa
Option
Very slow
Slow
Average
Fast
Very fast
Total
Frequency
0
1
20
9
0
30
Percentage
0%
3.3%
66.7%
30%
0%
100
The study sought to assess transactional dwell time at the Port of Mombasa. Of the 30
respondents, 3.3% of the respondent assess the transactional dwell time to be slow, 66.7% of
the respondents assess it on average, 30% of the respondents assess the transactional dwell to
be very fast, while very slow and very fast were unanswered. The finding therefore reveals that
transactional dwell time which is the total time taken to complete clearance processes is on
average.
Table 4.12: Discretionary dwell time at the port of Mombasa
Option
Very low
Low
Moderate
High
Very high
Total
Frequency
0
2
24
4
0
30
Percentage
0%
6.7%
80%
13.3%
0%
100

European Journal of Logistics Purchasing and Supply Chain Management
Vol.2, No.3, pp. 39-78, December 2014
Published by European Centre for Research Training and Development UK (www.eajournals.org)
63 ISSN 2054-0930 (Print), ISSN 2054-0949 (Online)
The study sought to rate the current discretionary dwell time at the Port of Mombasa. Of the
30 respondents, 6.7% of the respondent rate the current discretionary dwell time to be low,
80% of the respondents rate it to be moderate, 13.3% of the respondents rate the current
discretionary dwell time high, while very low and very high were unanswered. The finding
therefore infers that the current discretionary dwell time which is the decision based on
allowing cargo to stay longer time in the port is moderate.
Infrastructure
How do you assess the significance of both physical and soft infrastructure in terminal
operation?
The study sought to assess the significance of both physical and soft infrastructure in terminal
operations. So far, the finding reveals that 40% of the respondents assess both physical and soft
infrastructure in terminal operations to be important, 60% of the respondents assess it to be
very important, while the not important and somewhat important were unanswered. This
implies that both physical and soft infrastructure play a major role in terminal operation.
Figure 4.8: Significance of both Physical and Soft Infrastructure
How do you assess the congestion of container operations at the port of Mombasa?
A 5-point Likert Scale was used to assess the congestion of container operations at the port of
Mombasa. Finding reveals that of the 30 respondents, 3.3% of the respondents assess the
congestion problem of container operations to be very bad, 63.3% of the respondents assess it
on average, 20% of the respondents assess it as being good, 13.3% of the respondents assess it
to be very good, while none of the respondent mention it to be bad. This infers that the
congestion problem of container operations at the port of Mombasa is on the average.
0 0
12
18
NOT IMPORTANT SOMEWHAT IMPORT IMPORTANT VERY IMPORTANT
Significance of both physical and soft infrastructure
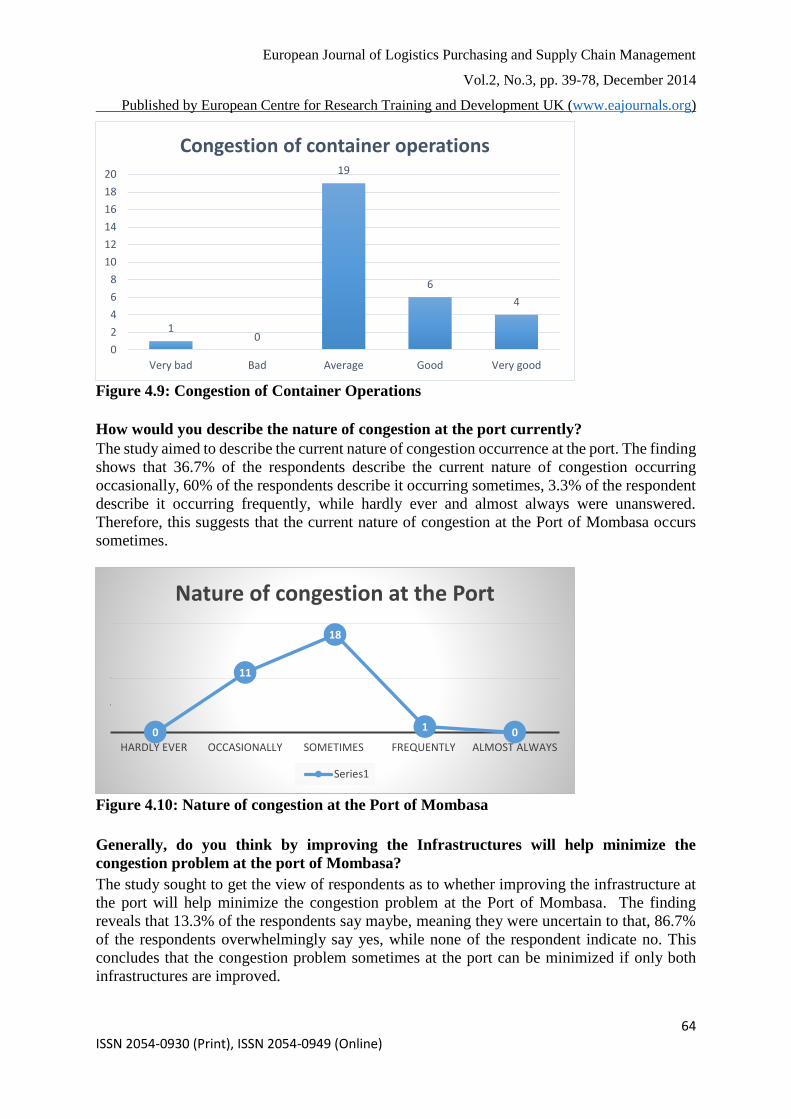
European Journal of Logistics Purchasing and Supply Chain Management
Vol.2, No.3, pp. 39-78, December 2014
Published by European Centre for Research Training and Development UK (www.eajournals.org)
64 ISSN 2054-0930 (Print), ISSN 2054-0949 (Online)
Figure 4.9: Congestion of Container Operations
How would you describe the nature of congestion at the port currently?
The study aimed to describe the current nature of congestion occurrence at the port. The finding
shows that 36.7% of the respondents describe the current nature of congestion occurring
occasionally, 60% of the respondents describe it occurring sometimes, 3.3% of the respondent
describe it occurring frequently, while hardly ever and almost always were unanswered.
Therefore, this suggests that the current nature of congestion at the Port of Mombasa occurs
sometimes.
Figure 4.10: Nature of congestion at the Port of Mombasa
Generally, do you think by improving the Infrastructures will help minimize the
congestion problem at the port of Mombasa?
The study sought to get the view of respondents as to whether improving the infrastructure at
the port will help minimize the congestion problem at the Port of Mombasa. The finding
reveals that 13.3% of the respondents say maybe, meaning they were uncertain to that, 86.7%
of the respondents overwhelmingly say yes, while none of the respondent indicate no. This
concludes that the congestion problem sometimes at the port can be minimized if only both
infrastructures are improved.
10
19
6
4
0
2
4
6
8
10
12
14
16
18
20
Very bad Bad Average Good Very good
Congestion of container operations
0
11
18
1 0HARDLY EVER OCCASIONALLY SOMETIMES FREQUENTLY ALMOST ALWAYS
Nature of congestion at the Port
Series1

European Journal of Logistics Purchasing and Supply Chain Management
Vol.2, No.3, pp. 39-78, December 2014
Published by European Centre for Research Training and Development UK (www.eajournals.org)
65 ISSN 2054-0930 (Print), ISSN 2054-0949 (Online)
Figure 4.11: Improving the Infrastructures to minimize congestion
How do you assess the competency of terminal operators at the Port of Mombasa?
The study sought to assess the competency of terminal operators at the port of Mombasa.
Finding reveals that out of 30 respondents, 80% of the respondents assess terminal operators
to be competent, 20% of the respondents assess terminal operators to be highly competent,
while not competent, some competent and uncertain were unanswered. This infers that terminal
operators are well trained and competent.
Figure 4.12: Competency of terminal Operators
Custom Clearance
What is the average number of days used in clearing containers at the port currently?
The study sought to find out the current average number of days used in clearing containers at
the port. Finding reveals that 20% of the respondents say within 24 hours, 20% of the
respondents say 1 – 3 working days, 60% of the respondents say on average is 4 – 6 working
days, while 7 – 9 and 10 – 12 working days were unanswered. This shows that the average
number of days used in clearing containers at the port of Mombasa is 4 – 6 working days;
which is still below an internationally acceptable standards of maximum 3 days dwell time.
0
4
26
Improvinng the Infrastructures to minimize congestion
No
Maybe
Yes
0
5
10
15
20
25
NOT COMPETENT
SOME COMPETENT
UNCERTAIN COMPETENT HIGHLY COMPETENT
0 0 0
24
6
Competency of Terminal Operators

European Journal of Logistics Purchasing and Supply Chain Management
Vol.2, No.3, pp. 39-78, December 2014
Published by European Centre for Research Training and Development UK (www.eajournals.org)
66 ISSN 2054-0930 (Print), ISSN 2054-0949 (Online)
Figure 4.13: Average number of days in Clearing Containers
How do you measure the effectiveness of custom clearance services at the port?
The study sought to measure the effectiveness of custom clearance services at the port. Finding
shows that, 10% of the respondents measure the effectiveness of custom clearance service
ineffective, 56.7% of the respondents measure it on average, 30% of the respondents measure
it effective, while none of the respondent measure it very ineffective. This implies that the
effectiveness of custom clearance services at the port of Mombasa is on average.
Figure 4.14: Effectiveness of Custom Clearance Services
Do you agree or disagree that security and custom practices are indicators for measuring
container terminal efficiency?
The study aimed to determine the extent of agreement and disagreement as to whether security
and custom practices are indicators for measuring container terminal efficiency. 6.7% of the
respondents disagree, 3.3% of the respondent was uncertain, 66.7% of the respondents agree,
23.3% of the respondents strongly agree, while none accounts for strongly disagree. This
finding concludes that both security and custom practices are indicators for measuring
container terminal efficiency.
0
5
10
15
20
Within 24hours
1-3 workingdays
4 - 6 workingdays
7 - 9 workingdays
10 - 12working days
Average number of days in clearing containers
0
5
10
15
20
VERY INEFFECTIVE
INEFFECTIVE AVERAGE EFFECTIVE VERY EFFECTIVE
Effectiveness of custom clearance services
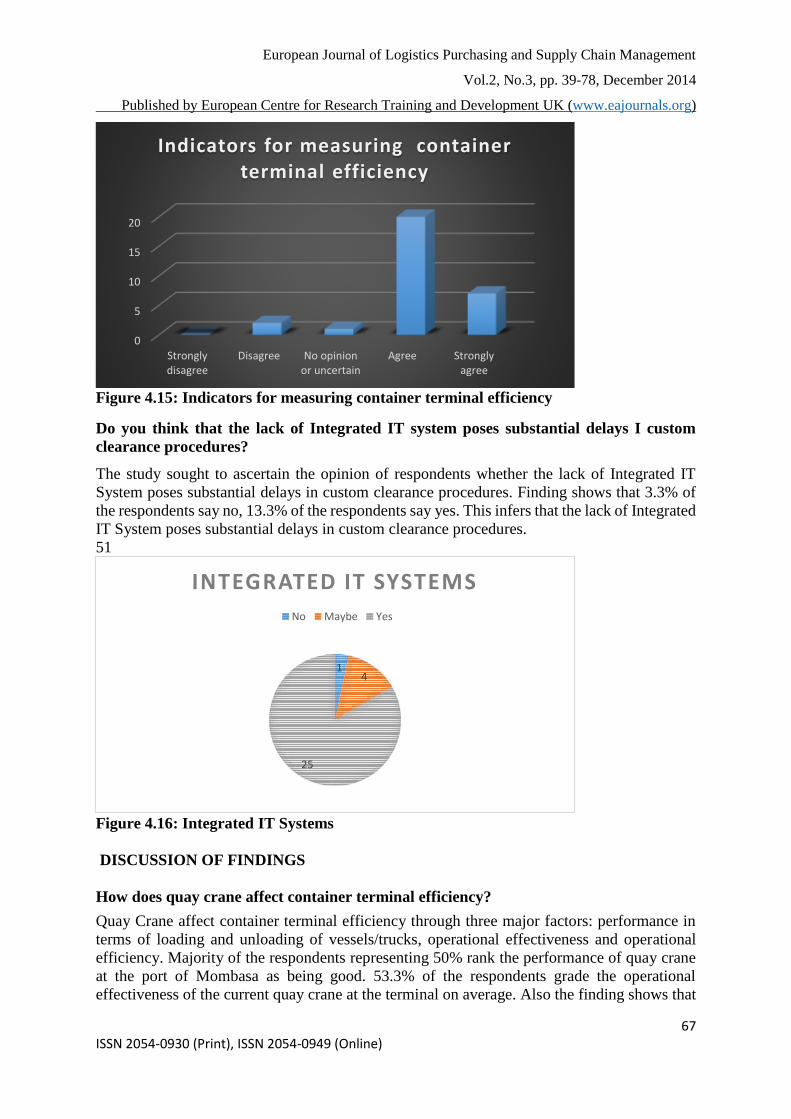
European Journal of Logistics Purchasing and Supply Chain Management
Vol.2, No.3, pp. 39-78, December 2014
Published by European Centre for Research Training and Development UK (www.eajournals.org)
67 ISSN 2054-0930 (Print), ISSN 2054-0949 (Online)
Figure 4.15: Indicators for measuring container terminal efficiency
Do you think that the lack of Integrated IT system poses substantial delays I custom
clearance procedures?
The study sought to ascertain the opinion of respondents whether the lack of Integrated IT
System poses substantial delays in custom clearance procedures. Finding shows that 3.3% of
the respondents say no, 13.3% of the respondents say yes. This infers that the lack of Integrated
IT System poses substantial delays in custom clearance procedures.
51
Figure 4.16: Integrated IT Systems
DISCUSSION OF FINDINGS
How does quay crane affect container terminal efficiency?
Quay Crane affect container terminal efficiency through three major factors: performance in
terms of loading and unloading of vessels/trucks, operational effectiveness and operational
efficiency. Majority of the respondents representing 50% rank the performance of quay crane
at the port of Mombasa as being good. 53.3% of the respondents grade the operational
effectiveness of the current quay crane at the terminal on average. Also the finding shows that
0
5
10
15
20
Stronglydisagree
Disagree No opinionor uncertain
Agree Stronglyagree
Indicators for measuring container terminal efficiency
14
25
INTEGRATED IT SYSTEMS
No Maybe Yes
European Journal of Logistics Purchasing and Supply Chain Management
Vol.2, No.3, pp. 39-78, December 2014
Published by European Centre for Research Training and Development UK (www.eajournals.org)
68 ISSN 2054-0930 (Print), ISSN 2054-0949 (Online)
56.7% of the respondents measure the operational efficiency of the yard crane to be
satisfactory.
What role does dwell time play on container terminal efficiency?
Dwell time plays major role in determining container terminal efficiency. 60% of the
respondents strongly agree that dwell time is an indicator to assess the efficiency of container
terminal. As it relates to the turnaround time of trucks at the port, 60% of the respondent place
it below average. With respect to the frequency of ships calling at the port, 63.3% of the
respondents indicate frequently. This is due to it being the largest port in East Africa and it
strategic location which serves other East African countries. 66.7% of the respondents assess
transactional dwell time at the port to be on average. This is the total time taken to complete
clearance processes. On the other hand, 80% of the respondents rate discretionary dwell time
to be moderate. This is the decision based on allowing cargo to stay longer time in the port
How does infrastructure influence container terminals efficiency?
Infrastructure for the purposes of this study refers to both physical (hard Infrastructure) and
soft (Management of Port operations) which inversely influence container terminals. 60% of
the respondents assess infrastructure to be very important. 63.3% of the respondents assess the
congestion of container operations at the port to be on average, due to limited yard capacity to
store container before collection. 60% of the respondents indicate that congestion sometimes
take place in the port. This reflects the limited space available to hold containers and trucks
respectively. As a result of the congestion problems, major of the respondents accounting for
86.7% indicate that infrastructure needs to be improved in order minimize the congestion
problems that sometimes occur at the port.
What is the effect of clearance procedures on container terminal efficiency?
Findings from the study reveals that 60% of the respondents indicate that the average number
of days used in clearing containers at the port currently is between 4 – 6 working days. This is
still below an internationally acceptable standards of a maximum 3 days dwell time. Findings
shows that 56.7% of the respondents measure the effectiveness of custom clearance services at
the port to be on average. As it relates to security and custom practices being an indicators for
measuring container terminal efficiency, 66.7% of the respondents agree. While majority of
the respondents accounting for 83.3% agree that the lack of Integrated IT system poses
substantial delays in custom clearance procedures.
SUMMARY, CONCLUSION AND RECOMMENDATIONS
The objective of the study was to assess factors Influencing Container Terminals Efficiency; a
case study of the Mombasa Entry Port. Previous studies have revealed that container terminal
efficiency is influenced by many factors which include but not limited to: quay crane, dwell
time, infrastructure, custom practices and security measures, truck turnaround time, etc. The
study thoroughly assessed these factors and discussed the extent to which they influence
container terminal efficiency within the maritime industry. The study also looked at two major
theories: Data Envelopment Analysis (DEA) and DEA Window Analysis as well other
empirical studies relating to the topic. The study targeted population included freight
forwarders/shippers, shipping lines/agents, Kenya Port Authority (KPA) as well as container
terminal operators. Questionnaire was used as a major instrument to obtain primary data. The
European Journal of Logistics Purchasing and Supply Chain Management
Vol.2, No.3, pp. 39-78, December 2014
Published by European Centre for Research Training and Development UK (www.eajournals.org)
69 ISSN 2054-0930 (Print), ISSN 2054-0949 (Online)
questionnaire was designed using Likert scale ranging from 1-3, 1-4 and 1-5 respectively. A
sample size of 50 respondents was used for the research of which 30 of the respondents
participated in the survey. The data were analyzed using Statistical Package for Social Sciences
(SPSS) and Microsoft Excel 2013.
54
However, the findings revealed that container terminal efficiency is measured by the level of
increase in inputs and throughput. The results indicated that the volume of container handled
at the port of Mombasa is high and was revealed that expansion of the current terminal will
certainly increase the volume of container inputs and throughput to meet international
standards. The findings also revealed that the performance of container terminal at the Port of
Mombasa is on average.
Additionally, findings indicated that quay crane performance in terms of loading and unloading
of vessels/trucks at the Port of Mombasa is good. Also, findings indicated that the operational
effectiveness of the current quay crane at the terminal is on the average. On the other hand, the
findings revealed that yard crane operational efficiency is satisfactory.
Moreover, findings indicated that dwell time is an indicators to assess container terminal
efficiency. Also, the results indicated that the turnaround time of trucks at the Port of Mombasa
is below average. The results further indicated that ships are frequently called at the port. This
is due to it being the largest port in East Africa and it strategic location which serves other East
African countries. The findings indicated that transactional dwell time at the port of Mombasa
is on average. This is the total time taken to complete clearance processes. The findings also
revealed that the issue with discretionary dwell time at the port is moderate. This is the decision
based on allowing cargo to stay longer time in the port.
As it relates to the significance of both physical and soft infrastructure in terminal operation,
findings revealed that it is very important. The results indicated that the congestion problem of
container operations at the port is on average. While findings revealed that the nature of
congestion occurred sometimes. In reference to improving the infrastructure at the port in order
to decongest container traffic, findings revealed that it is imperative.
55
Also, findings indicated that terminal operators at the port of Mombasa are competent and well
trained. Furthermore, findings revealed that the average number of days used in clearing
containers at the port currently is between 4 – 6 working days, which is still below an
internationally acceptable standards of a maximum 3 days dwell time. Findings revealed that
the effectiveness of custom clearance services at the port is on average. It was also revealed
that security and custom practices are indicators for measuring container terminal efficiency.
Finally, findings indicated that the lack of Integrated IT System poses substantial delays in
custom clearance procedures. Which is also attributed to container terminals efficiency.
CONCLUSION
This study aims to assess factors influencing container terminals efficiency. A case study of
the Mombasa Entry Port. The study tries to answer the following questions:
1. How does quay crane affect container terminal efficiency?
2. What role does dwell time play on container terminal efficiency?
3. How does infrastructure influence container terminals efficiency?
4. What is the effect of clearance procedures on container terminal efficiency?
European Journal of Logistics Purchasing and Supply Chain Management
Vol.2, No.3, pp. 39-78, December 2014
Published by European Centre for Research Training and Development UK (www.eajournals.org)
70 ISSN 2054-0930 (Print), ISSN 2054-0949 (Online)
To accomplish the research objectives, a 1- 3, 1 -4 and 5-point Likert Scale questionnaire
survey was conducted from the 29th of October – the 7th of November 2014, using quantitative
survey. The questionnaire was printed out in hard copy. The hard copy questionnaire was
created using Microsoft Word 2013. As the survey was about container terminal efficiency, the
respondents were all employees who were knowledgeable about container operations at the
port of Mombasa.
56
The data was analyzed using SPSS and Microsoft Excel 2013 respectively. All the research
questions of the study were answered in chapter 4. From the survey conducted, findings
revealed that container terminal efficiency is measured by the level of increase inputs and
throughput. For the research question “How does quay crane affect container terminal
efficiency?” The study found out that quay crane affect container terminal efficiency through
three major factors: performance in term of loading and unloading of vessels/trucks; it
operational effectiveness as well as it operational efficiency.
For the third research question “How does infrastructure influence container terminals
efficiency?” The study found out that infrastructure both physical (hard infrastructure) and soft
(Management of port operations) inversely influence container terminal efficiency. The
following factors were associated with infrastructure: limited yard capacity to store container
before collection, congestion problem due to over capacity. This can be overcome if the
improvement of infrastructure is considered. From the last research question “What is the
effect of clearance procedure on container terminal efficiency?” The study found out that
the delays in clearance procedures relating to the average number of days to clear container has
effect on container terminal efficiency. With respect to Mombasa port, it is 4 – 6 working days
as revealed by the findings, which is still below an internationally acceptable standards to
maximum 3 days dwell time. The study found out that the effectiveness of custom clearance
services has effect on container terminal efficiency. Also, the study found out that the lack of
integrated IT System poses delays in custom clearance procedures which inversely effect
container terminal efficiency.
From the above findings, the study concludes that the lack of adequate and performing quay
crane equipment, container cargo dwell time, vessels/trucks turnaround time, infrastructure
both physical and soft, customer clearance procedure, security, and lack of integrated IT system
in custom clearance procedure influence container terminal efficiency.
Therefore, the findings from this study have practical applications to maritime logistics in the
global supply chain due to its evolving nature.
RECOMMENDATIONS
After the analysis of the research findings of all the collected data, the researcher is pleased to
advance the following recommendations:
Quay cranes served as an essential elements of the transshipment of containers in the container
terminals. It is therefore recommended that Kenya Port Authority (KPA), a state corporation
clothed with the responsibility to “maintain, operate, improve and regulate the Port of
Mombasa considers continuous investments in modern quay cranes as well as gantry cranes
to supplement the current ones in order to continuously enhance productivity, increase
container inputs and throughput respectively. This is indeed imperative due to the huge volume

European Journal of Logistics Purchasing and Supply Chain Management
Vol.2, No.3, pp. 39-78, December 2014
Published by European Centre for Research Training and Development UK (www.eajournals.org)
71 ISSN 2054-0930 (Print), ISSN 2054-0949 (Online)
of container imports and exports the port handles as well as being the major harbor for its
neighbor countries within East African and other part of the World. This in itself will make the
Port of Mombasa survive the global competition in Maritime Logistics which will subsequently
boost economic growth for Kenya as a Nation.
Based on the findings from the survey, the Government of Kenya needs huge investments in
expanding the physical infrastructure such as adequate berthing facilities, wharves, yard
capacity, quayside, railway, as well as expanding the hinterland road network. These physical
infrastructure are the main determinants of port productivity, agility and efficiency. Not only
that, but also invest in the soft infrastructure especially the ICT infrastructure. The ICT
infrastructure needs to be re-engineered and handle by IT specialists who will then integrate
various internal systems as well as external systems to which KPA does business with. When
both internal and external systems are integrated, it will streamline the port operations, business
processes and reduce some of those barriers like long cargo dwell time, delays in custom and
clearance processes, long waiting time of vessels at deep seas, etc. These barriers cause the
Kenya Government to lose millions of shillings every year. Kenya as a nation depends heavily
on international trade due to its strategic location, by investing more in the infrastructures
especially the hinterland connections to its regional borders will accelerate trade growth and
significance increase in revenue growth will be realized thus making the Port of Mombasa
competitive.
Finally, it is recommended based on the findings that the Management of Kenya Port Authority
invest more on training and development of staff and employees. This will also minimize some
of the human errors and duplications of business processes that normally occur on the job site.
It was revealed from the survey that majority of the respondents are diploma holders and are
in higher positions with their respective department/sections and have worked with KPA for
over 10 years. The level of education when compare with the position occupied had some
implications when it comes to performance and output.
AREAS FOR FURTHER RESEARCH
Further research should be undertaken on the following areas: Container Cargo Handling
Safety Policy Implementation in Maritime Logistics and the Role Global Supply Chain plays
in Container Terminals Security. These areas have been identified for future research so as to
contribute to the academic debate in Maritime Logistics in Global Supply Chain.
REFERENCES
Acciaro, M. and Serra, P. (2013). “Maritime Supply Chain Security: A Critical Review”, in
IFSPA 2013, Trade Supply Chain Activities and Transport: Contemporary Logistics and
Maritime Issues, pp. 636
Alreck, P and R. B. Settle (1985). The Survey Research Handbook. Homewood, Illinois:
Irwin
A. Lim, B. Rodrigues., F. Xiao, and Y. Zhu, (2002). “Crane scheduling using Tabu search”,
Proceedings of the 14th IEEE International Conferenceon Tools with Artificial Intelligence.
Bailey, R., Qi Chen, Ellen E, and Abbie S., (1998). Competitive advantage, Journal of
Accounting and Economics 37, 1670201.
Bakshi, N., Flynn, S.E. and Gans, N. (2011). “Estimating the operational impact of container
inspections at international ports”, Management Science, vol. 57, no. 1, pp. 1-20.

European Journal of Logistics Purchasing and Supply Chain Management
Vol.2, No.3, pp. 39-78, December 2014
Published by European Centre for Research Training and Development UK (www.eajournals.org)
72 ISSN 2054-0930 (Print), ISSN 2054-0949 (Online)
Barros, C. (2003). “Incentive Regulation and Efficiency of Portuguese Port Authorities”,
Maritime Economics & Logistics, 5 (1), 55-69
Barros, C. and Athanassiou, M. (2004). Efficiency in European Seaports with DEA: Evidence
from Greece and Portugal. Maritime Economics & Logistics, 6, 122-140
Bichou, K. (2011). "Assessing the impact of procedural security on container port
efficiency", Maritime Economics and Logistics, vol. 13, no. 1, pp. 1-28.
Castro, C.F.d. (1999). Containerization, Logistic Cost and Facilitation (less documented
aspects of an old theme). In Regional transport and transit facilitation workshop. Bangkok.
Chang, Y-T., Lee, S-Y., Tongzon, J. (2008). Port selection factors by shipping lines:
Different perspectives between trunk liners and feeder service providers, Marine Policy, Vol.
32, p. 877 885.
Chin, A., Tongzon, J., (1998). Maintaining Singapore as a major shipping and air transport
hub. In: Toh, T. (Ed.), Competitiveness of the Singapore Economy. Singapore University
Press, Singapore, pp. 83–114.
Clark, X., Dollar, D. and Micco, A. (2004). "Port Efficiency, Maritime Transport Costs, and
Bilateral Trade", Journal of Development Economics, vol. 75 2, pp. 417-50.
Creswell, J.W. (2003). Research design: Qualitative, Quantitative, and mixed methods
Cooper, D.R and Schindler, P.S. (2003). Business research methods. Irwin: McGraw-
Hill.
Cullinane, K. and Khanna, M. (1999), "Economies of Scale in Large Container Ships", Journal
of Transport Economics and Policy, vol. 33 2, pp. 185-207.
Cullinane, K., Wang, T-F. (2006). The Efficiency of European container ports: across-
sectional Data envelopment analysis, International Journal of Logistics: Research and
Applications, Vol.9, No.1, pp 19-31.
Cullinane, K. P. B., Song, D. W. and Gray, R. (2002). A Stochastic Frontier Model of
the Efficiency of Major Container Terminals in Asia: Accessing the Influence of
Administrative and Ownership Structures. Transportation Research Part A, 36, pp.
743-762.
D. H. Lee, H. Q. Wang, and L. Miao (2000). “Quay crane scheduling with non-interference
constraints in port container terminals”, Transportation Research E, 44, pp. 124-135.
East Africa Logistics Performance Survey (2012).
ESCAP. (2005). Regional shipping and port development strategies (container traffic
forecast): Economic and Social Commission for Asia and the Pacific, United Nations.
Fraenkel, J. R. and N. E. Wallen (2002), How to Design and Evaluate Research in Education,
4th ed. – Boston
Gilman, S. (1999). "The size economies and network efficiency of large containerships",
Maritime Economics and Logistics, vol. 1, no. 1, pp. 39-59.
Guan, Y., & Yang, K.H. (2010). Analysis of berth allocation and inspection operations in a
container terminal. Maritime Economics and Logistics, 12, 347-369.
Haralambides, H. E. (2002). Competition, excess capacity, and the pricing of port
infrastructure. International Journal of Maritime Economics, 4(4), 323-347.
Haralambides, H. E., Cariou, P., and Benacchio, M. (2002). Costs, Benefits and Pricing of
Dedicated Container Terminals.International Journal of MaritimeEconomics, 4, pp. 21-34.
Haralambides, H.E. and Londoño-Kent, M.P. (2004). "Supply Chain Bottlenecks: Border
European Journal of Logistics Purchasing and Supply Chain Management
Vol.2, No.3, pp. 39-78, December 2014
Published by European Centre for Research Training and Development UK (www.eajournals.org)
73 ISSN 2054-0930 (Print), ISSN 2054-0949 (Online)
Crossing Inefficiencies between Mexico and the United States", International Journal
ofTransport Economics, vol. 31 2, pp. 183-95.
Huynh, N. (2009). "Reducing truck turn times at marine terminals with appointment
scheduling",Transportation Research Record: Journal of the Transportation
ResearchBoard, vol. 2100, no. 1, pp. 47-57.
John Adams, Haftz T.A. Khan, Robert Raeside and David White (2007). Research Methods
for Graduate Business and Social Science Students, New Delhi, pp.136.
Kaisar, I.E., Pathomsiri, S., Haghani, A. (2006). Efficiency Measurement of US Ports Using
Data Envelopment Analysis, National Urban Freight Conference, Long Beach California.
Kerlinger, F. (1986). Foundations of behavior research (3rd ed.). New York: Holt,
Rinehart, and Winston.
Keller, G. (2009). Mangerial Statistics Abbreviated, 8th ed. South Western: Cengage
Learning. 2-4,159, 513, 355.
Kenya Ports Authority Annual Review and Bulletin of Statistics, (2012).
Kenya Ports Authority, Annual Review and Bulletin of Statistics, (2009).
KPA, Container Dwell Time Study for the Port of Mombasa, March (2010).
K. H. Kim, and Y. M. Park, (2004). “A crane scheduling method for port containers”, European
Journal of Operation Research, 156, pp 752-768.
Kothari, C. (2004). Research methodology,methods & techniques (2nd ed.).New Delhi:
Wishwa Prakashan.
Langen, de, P.W. (2003), Forecasting Container Throughput: A Method and Implications for
Port Planning, Journal of International Logistics and Trade, Vol. 1(1), pp. 29-39.
Langen, de P.W., Nijdam, M., Horst, van der, M. (2007). New indicators to measure port
performance, Journal of Maritime Research, Vol. 5(1), p. 23-26.
Langen, de, P.W., Nijdam, M.H., van der Lugt, L.M. (2010). Port Economics, Policy and
Management.Erasmus University Rotterdam.
Lee, D.-H., Wang, H. Q., & Miao, L. (2008). Quay crane scheduling with non-interference
constraints. Transportation Research Part E: Logistics and Transportation Review, Volume 44
(Issue 1), 124-135.
Levinson, M. (2006). The Box: How the Shipping Container Made the World Smaller
and the World Economy Bigger. Princeton University Press.
Maloni, M., Paul, J.A. and Gligor, D.M. (2013). “Slow steaming impacts on ocean carriers and
shippers”, Maritime Economics and Logistics, 15, 151-171.
Min, H., Park, B.I (2005).: Evaluating the inter-temporal efficiency trends of international
container terminals using data envelopment analysis, Int. J. Integrated Supply Management,
Vol. 1, No. 3, pp 258-277
Notteboom, T., Konings, R., (2004). “Network dynamics in container transport”, Belgian
journal of geography - BELGEO, Volume 5, Number 4, 461-478.20.
Notteboom, T. (2008). “The Relationship between Seaports and the Inter-modal Hinterland in
light of Global Supply Chain: European Challenges” Discussion paper no. 2008-10.Joint
Transport Research Centre, OECD / International Transport Forum, Paris.
Mugenda,A .and Mugenda, O (.2003). Research methods; quantitative and qualitative
approaches. Africa Center for Technology (ACTS), Nairobi Kenya
OECD (2008). International Transport Forum, Discussion Paper.
European Journal of Logistics Purchasing and Supply Chain Management
Vol.2, No.3, pp. 39-78, December 2014
Published by European Centre for Research Training and Development UK (www.eajournals.org)
74 ISSN 2054-0930 (Print), ISSN 2054-0949 (Online)
http://www.internationaltransportforum.org/jtrc/discussionpapers/DP200819.pdf
Roll, Y. and Nayuth, Y. (1993). “Port Performance Comparison Applying Data Envelopment
Analysis (DEA)”, Maritime Policy and Management, 20 (2), 153-161.
Roso, V., Woxenius, J. and Lumsden, K. (2009). "The dry port concept: connecting container
seaports with the hinterland", Journal of Transport Geography, vol. 17, no. 5, pp. 338-345.
Roso, V. 2008, "Factors influencing implementation of a dry port", International Journal of
Physical Distribution and Logistics Management, vol. 38, no. 10, pp. 782-798.
Roso, V. and Lumsden, K. (2010). "A review of dry ports", Maritime Economics and Logistics,
vol. 12, no. 2, pp. 196-213.
Stahlbock, R. and Voß, S. (2008). "Operations research at container terminals: a literature
update", Or Spectrum, vol. 30, no. 1, pp. 1-52.
Sekaran, U. (2010). Research Methods for business :A skill Building Approach (5th
Edition .) USA: John wiley & Sons Publisher
Steenken, D., Voß, S., Stahlbock, R., (2004). “Container terminal operation and operations
research – a classification and literature review”, OR Spectrum, Springer-Verlag GmbH,
Volume 26, Number 1.
Suykens, F. (1996). Influence of Port Tariffs on Maritime TransportÓ. VI International
Congress of Maritime Traffic and Port Handling. Vigo (Spain).
Suykens, F. and van de Voorde, E. (1998). "A quarter a century of port management in
Europe: objectives and tools", Maritime Policy and Management, vol. 25, no. 3, pp. 251-261.
Tongzon, J. (1995). Determinants of Port Performance and Efficiency, Transportation
Research Part A, Vol. 29, p. 245–252.
Tongzon, J. (2002). Port Choice Determinants in a Competitive Environment, IAME
Conference, Panama.
Tongzon, J., Chang, Y., and Lee, S. (2009). How supply chain oriented is the port sector?
International Journal of Production Economics, 122, 21–34.
Tongzon, J., Heng, W. (2005). Port privatization, efficiency and competitiveness: Some
empiricalevidence from container ports (terminals). Transportation Research Part A, Vol. 39,
p. 405–424.
Tongzon, J., Chang, Y. and Lee, S. (2009). “How supply chain oriented is the port sector?”
International Journal of Production Economics, vol. 122, no. 1, pp. 21-34.
UNCTAD. (2006). Review of maritime transport, 2005: United Nations.
UNECE (1998). UN/LOCODE - Code for ports and other locations, Regulation 16, UN,
Geneva.
United Nations Conference on Trade and Development (2006). Review of Maritime
Transport. New York and Geneva: Author.
United Nations Conference on Trade and Development (2011). Review of Maritime
Transport. New York and Geneva: Author.
UNCTAD, (2003). Review of Maritime Transport.
UNCTAD, (2009). Review of Maritime Transport, Report by the UNCTAD Secretariat,
accessible online at www.unctad.org
Valentine, V.F., Gray, R. (2001). The measurement of port efficiency using data envelopment
analysis, in Proceedings of the 9th World Conference on Transport Research, Seoul.
Valentine, V.F. And Gray, R. (2002). An Organizational Approach to Port Efficiency. IAME
Panama.
Van De Voorde, E. and Vanelslander T. (2008). Market Power and Vertical and Horizontal
European Journal of Logistics Purchasing and Supply Chain Management
Vol.2, No.3, pp. 39-78, December 2014
Published by European Centre for Research Training and Development UK (www.eajournals.org)
75 ISSN 2054-0930 (Print), ISSN 2054-0949 (Online)
Integration in the Maritime Shipping and Port Industry.OECD WorkingPapers.
http://puck.sourceoecd.org/vl=4200552/cl=11/nw=1/rpsv/cgi-bin/wppdf?file=5ksq628
8rbd8.pdf
Vis, I. and R. Koster. (2003). Transshipment of containers at a container terminal: An
overview. European Journal of Operational Research, 147:1-16
Vogt, W. Paul (1999). Dictionary of statistics and methodology. Sage: Thousand Oaks,
California.
Wiegmans, B.W., van der Hoest, A. and Notteboom, T. E. (2008). “Port and terminal selection
by deep-sea container operators” Maritime Policy and Management, vol. 35, no. 6, pp. 517-
534.
Wiegmans, B.W., Van der Hoest, A., Notteboom, T.E. (2008). Port and terminal selection by
deep-sea container operators, Maritime Policy and Managements: The flagship
journal of international shipping and portresearch, Vol. 35(6), p. 517-534.
Wiegmans, B.W., Rietveld, P., Pels, E. and van Woudenberg, S. (2004). "Container Terminals
andUtilisation of Facilities", International Journal of Transport Economics, vol. 31 3, pp. 313-
39.
Wiegmans, B. (2003). Performance conditions for container terminals. Maritime Economics
& Logistics, 6, 276–277.
Wiegmans, B.W., van der Hoest, A. and Notteboom, T. E. (2008). “Port and terminal selection
by deep-sea container operators” Maritime Policy and Management, vol. 35, no.6, pp. 517-
534.
Yang, Y. (2010). "Impact of the container security initiative on Taiwan's shipping industry",
Maritime Policy and Management, vol. 37, no. 7, pp. 699-722
Yap, W.Y. and Lam, J.S.L. (2013). "80 million-twenty-foot-equivalent-unit container port?
Sustainability issues in port and coastal development", Ocean and Coastal Management, vol.
71, no. 0, pp. 13-25.
Yeo, G., Pak, J. and Yang, Z. (2013). "Analysis of dynamic effects on seaports adopting port
security policy", Transportation Research Part A: Policy and Practice, vol. 49, pp. 285-301.
APPENDICES
Appendix A: Introductory Letter to Respondents
Re: Data Collection
Dear Respondent,
I am a student pursuing Master of Science (MSc) degree in Procurement and Logistics at the
Jomo Kenyatta University of Agriculture and Technology (JKUAT). Currently, I am
undertaking a research study on “FACTORS INFLUENCING CONTAINER
TERMINALS EFFICIENCY; A CASE STUDY OF MOMBASA ENTRY PORT, in
partial fulfillment of the requirements for the award of the degree of Master of Science in
Procurement and Logistics.
You have been selected to participate in the survey and the researcher would highly appreciate
if you assist him by responding to all questions as completely, correctly and honestly as
possible. It is solely for academic purposes. Your opinions, responses and views are very
important to this study and will be completely confidential. No respondent will be identified.
Thank you very much for your participation, cooperation and understanding.
European Journal of Logistics Purchasing and Supply Chain Management
Vol.2, No.3, pp. 39-78, December 2014
Published by European Centre for Research Training and Development UK (www.eajournals.org)
76 ISSN 2054-0930 (Print), ISSN 2054-0949 (Online)
Sincerely,
Samuel Monday Nyema
RESEARCHER
Appendix B: Questionnaire
SECTION A: BACKGROUND INFORMATION OF R OF RESPONDENTS
1. Sex of Respondent: (A) Male [ ] (B) Female [ ]
2. Age of Respondent: (A) Less than 24 years [ ]
(B) 25 – 29 years [ ]
(C) 30 – 45 year [ ]
(D) 46 – 50+ years [ ]
3. Level of Education acquired: (A) Diploma [ ]
(B) First Degree [ ]
(C) Post Graduate Degree [ ]
(D) Other (Specify)_______________________
4. Type of organization: (A) Container Terminal Operations [ ]
(B) Conventional Cargo Operations [ ]
(C) Other (Specify) __________________________
5. Name of Section/Department/Unit: __________________________________
6. What is your position/status in the organization?
(A) Senior Manager [ ]
(B) Middle Manager [ ]
(C) Junior Manager [ ]
(D) Operator [ ]
(E) Other (Specify)________________________________
7. How many years have you worked in this organization?
(A) Over 10 years [ ]
(B) 6 – 9 years [ ]
(C) 3 – 5 years [ ]
(D) Less than 2 years [ ]
SECTION B: CONTAINER TERMINAL EFFICIENCY
8. To what extend do you agree or disagree with the following statement.
Container Terminal Efficiency can be measured by the level of increase in inputs and
throughput.
1 = strongly disagree { } 2 = Disagree { } 3= No opinion or uncertain { }
4 = Agree { } 5 = strongly agree { }
9. How do you assess the throughput of container cargo at the Port of Mombasa currently?
1 = Very low { } 2 = Low { } 3 = Moderate { } 4 = High { }
5 = Very high{ }
10. Do you think by expanding the current terminal will increase the volume of container inputs
and throughputs respectively.
1 = No { } 2= Maybe { } 3 = Yes { }
11. How do you grade the current performance of container terminal at the port of Mombasa.

European Journal of Logistics Purchasing and Supply Chain Management
Vol.2, No.3, pp. 39-78, December 2014
Published by European Centre for Research Training and Development UK (www.eajournals.org)
77 ISSN 2054-0930 (Print), ISSN 2054-0949 (Online)
1 = Very poor { } 2 = Poor { } 3 = Average { } 4 = Good { } 5 = Excellent { }
SECTION C: QUAY CRANE
12. How do you rank the performance of Quay Crane in terms of loading and unloading of
vessels/trucks at the port of Mombasa?
1 = Very poor { } 2 = Poor { } 3 = Average { } 4 =Good { } 5 = Excellent { }
13. How do you grade the operational effectiveness of the current quay crane at the terminal?
1 = Very ineffective { } 2 = Ineffective { } 3 = Average { } 4 = Effective { } 5 =
Very effective { }
14. On average, how could you measure yard crane operational efficiency
5 = Very good { } 4 = Good { } 3 = Satisfactory { } 2= Poor { } 1 = Very poor { }
SECTION D: DWELL TIME
15. Do you agree or disagree that dwell time is an indicator to assess container terminal efficiency.
1 = Strongly disagree { } 2 = Disagree { } 3= No opinion or uncertain { } 4= Agree { }
5 = Strongly agree { }
16. What position would you place the turnaround time of trucks at the port of Mombasa
1 = Very much below average { } 2 = Below average { } 3 = Above average { }
4 = Very much above average { }
17. How often do container ships call at the port monthly.
1 = Hardly ever { } 2 = occasionally { } 3 = sometimes { } 4 = frequently { }
5 = Almost always { }
18. How do you assess transactional dwell time at the port of Mombasa
1 = Very slow { } 2 = Slow { } 3 = Average { } 4 = Fast { } 5 = Very fast { }
19. How would you rate discretionary dwell time at the port currently?
1 = Very low { } 2 = Low { } 3 = Moderate { } 4= High { } 5 = Very high { }
SECTION E: INFRASTRUCTURE
20. How do you assess the significance of both physical and soft infrastructure in terminal
operation
1 = Not important { } 2 = somewhat important { } 3 = important { }
4= very important { }
21. How do you assess the congestion of container operation at the port of Mombasa
1 = Very bad { } 2 = Bad { } 3= Average { } 4 = Good { }
5= Very good { }
22. How would you describe the nature of congestion at the port currently?
1 = Hardly ever { } 2= Occasionally { } 3 =Sometimes { } 4= Frequently { }
5 =Almost always { }
23. Generally, do you think by improving the infrastructure will help minimize the congestion
problem at the port
1 = No { } 2 = Maybe { } 3= Yes { }
24. How do you assess the competency of terminal operators at the Port of Mombasa
1 = Not competent { } 2= Some competent { } 3= Uncertain { } 4= Competent { }
5 = Highly competent{ }

European Journal of Logistics Purchasing and Supply Chain Management
Vol.2, No.3, pp. 39-78, December 2014
Published by European Centre for Research Training and Development UK (www.eajournals.org)
78 ISSN 2054-0930 (Print), ISSN 2054-0949 (Online)
SECTION F: CUSTOM CLEARANCE
25. What is the average number of days used in clearing containers at the port currently?
(A) Within 24 hours { }
(B) 1-3 working days { }
(C) 4 – 6 working days { }
(D) 7 – 9 working days { }
(E) 10 – 12 working days { }
26. How do you measure the effectiveness of custom clearance services at the port
1 = Very ineffective { } 2 = Ineffective { } 3 = Average { } 4 = Effective { }
5 = Very effective { }
27. Do you agree or disagree that security and custom practices are indicators for measuring
container terminal efficiency
1 = Strongly disagree { }2 = Disagree { } 3= No opinion or uncertain { } 4 = Agree { }
5 = Strongly agree { }
28. Do you think that the lack of Integrated IT System poses substantial delays in custom clearance
procedures.
1 = No { } 2 = Maybe { } 3 = Yes { }
END OF QUESTIONNAIRE
Thanks for your time and participation!