Embed Size (px)
Citation preview
i
HOMEBASED FACTORS INFLUENCING INTERNAL EFFICIENCY IN
PUBLIC PRIMARY SCHOOLS IN GUCHA DISTRICT, KENYA
Isabella Bosibori Ongoto
A Research Project Submitted In Partial Fulfillment for the Requirement for the
Degree of Master of Education in Economics of Education
University Of Nairobi
2013
ii
DECLARATION
This research project is my original work and has not been presented for a Degree in
any other University.
.........................................................................
Isabella Bosibori Ongoto
E55/65222/2011
This research project has been submitted for examination with our approval as the
University Supervisors.
........................................................................
Dr. Loise Gichuhi
Lecturer,
Department of Educational administration and Planning
University of Nairobi
......................................................................
Dr. Obae Rose
Lecturer,
Department of Educational administration and Planning
University of Nairobi.
iii
DEDICATION
This research is dedicated to my husband Evans, my children, Bernadatte, Splancer,
Newton, Chillion, Perpetual, and Bildad. My parents, Mr. and Mrs. Ongoto whose
prayers and encouragement never ceased.
iv
ACKNOWLEDGEMENT
First and foremost, I thank our almighty God for the gift of life and for his divine
purpose in my life. His sufficient grace has seen me complete this work successfully. I
sincerely express my indebtness and deep sense of gratitude to my research
supervisors Dr. Loise Gichui and Dr. Rose Obae for the untiring help, unstinted
support and inspiring guidance throughout the study period.
I wish to extend my special appreciation to the DEO’s office Gucha District for the
assistance and allowing me to conduct research in the area. I will not forget to thank
the head teachers, class - teachers and the pupils of the sampled schools for their
participation and cooperation during my research.
I also appreciate my entire family for their love and support at every stage of this
work. Their encouragement helped me complete my study.
v
TABLE OF CONTENTS
Content page
Declaration ii
Dedication iii
Acknowledgement iv
Table of contents v
List of figure x
List of Tables xi
List of abbreviations and acronyms xiii
Abstract xiv
CHAPTER ONE
INTRODUCTION
1.1 Background of the study 1
1.2 Statement of the problem 7
1.3 Purpose of the study 8
1.4 Objectives of the study 8
1.5 Research questions………………………………………………………8
1.6 significance of the study 9
1.7 Delimitations of the study 9
vi
1.8 Limitations of the study 10
1.9 Assumptions of the study 10
1.10 Organization of the study 11
1.11 Definition of significant terms 11
CHAPTER TWO
LITERATURE REVIEW
2.1 Introduction 13
2.2 Importance of investing in human capital 13
2.3 Efficiency in education 14
2.4 Factors influencing internal efficiency In primary schools 19
2.5 Summary of the literature review 25
2.6 Theoretical framework 26
2.7 Conceptual framework of the study 27
vii
CHAPTER THREE
RESEARCH METHODOLOGY
3.1 Introduction 29
3.2 Research design 29
3.3 Target population 30
3.4 Sample and sampling procedures 30
3.5 Research instruments 30
3.6 Validity of the instruments 31
3.7 Reliability of the instruments 32
3.8 Data collection procedures 32
3.9 Data analysis techniques 33
CHAPTER FOUR
DATA ANALYSIS, INTERPRETATIONS, DISCUSSIONS
AND PRESENTATION
4.1 Introduction 34
4.2 Questionnaire return rate 34
4.3 Demographic characteristics of the respondents 35
4.4 Home based factors influencing internal efficiency in
public primary schools 45
4.4.1 Influence of household duties and child labour on pupils’
Performance in primary examination 46
4.4.2 The influence of parents level of education on school
viii
Completion rates 48
4.4.3 The contribution of family structure and stability on school
absenteeism in public primary schools 54
4.4.4 Influence of parents’ level of income on school dropouts 56
4.5 measures taken to enhance efficiency………………………………….68
CHAPTER FIVE
SUMMARY, CONCLUSIONS AND RECOMMENDATIONS
5.1 Introduction 70
5.2 Summary of the study 70
5.3 Conclusion 71
5.4 Recommendations 72
5.5 Suggestions for further studies 73
REFERENCES 74
ix
APPENDICES
Appendix A: Letter of Introduction to the head teachers 79
Appendix B: Questionnaire for Teachers 80
Appendix C: Pupil Questionnaire 86
Appendix D: A letter of Authorization
Appendix E: Research Permit
x
LIST OF FIGURE
Figure 2.1 Home based factors influencing internal efficiency…………….27
Figure 4.2 Head teachers' age bracket 37
Figure 4.3 Teachers' distribution by gender 39
Figure 4.4 Teachers' by their teaching experience 41
Figure 4.5 Distribution of pupils in terms of age 43
Figure 4.6 Pupils’ distribution in terms of gender 44
Figure 4.7 Pupils’ participation in household chores 46
Figure 4.8 Number of siblings………………………………………………57
Figure 4.9 Parents financial status………………………………………….58
Figure 4.10 Pupils’ opinion on the extent to which parents financial
Status influence drop outs .59
Figure 4.11 Teachers’ opinion on school levies that pupils pay…………..61
Figure 4.12 Head teachers’ suggestions to ensure high enrolments and
Completion rates……………………………………………………69
xi
LIST OF TABLES
Table 4.1 Head teachers gender distribution 35
Table 4.2 Professional qualification of head teachers 36
Table 4.3 Head teachers’ administrative experience 37
Table 4.4 Teachers’ distribution by Age 40
Table 4.5 Distribution of teachers’ professional qualification 42
Table 4.6 Children’s parents 45
Table 4.7 pupils’ academic performance in primary schools 47
Table 4.8 Pupils’ response on their fathers’ level of education 49
Table 4.9 Pupils’ response on their mothers’ level of education 50
Table 4.10 Parents’/ Guardians’’ assistance on pupils’ homework 51
Table 4.11 Teachers response on pupils’ dropping out of school
due to parents’ level of education 52
Table 4.12 Reasons cited by class teachers on Pupils’ dropping out
of schools due to their parents level of education 53
Table 4.13 Parents consultation with teachers on pupils’ progress 54
Table 4.14 Number of absentees per class per week 55
Table 4.15 Parents/guardians type of education 60
Table 4.16 Pupils’ responses on being sent home to get money
for the teachers employed by parents 62
Table 4.17 Teachers’ response on families’ inability to pay
teachers employed by parents 63
xii
Table 4.18 Pupils drop out of school to assist parents in the farm 64
Table 4.19 Pupils drop out of school to look after their
young siblings 65
Table 4.20 Lack of examination money 66
Table 4.21 Replacement of text books 66
Table 4.22 Tatted clothes 67
Table 4.23 Repetition cases……………………………………………….. 68

xiii
LIST OF ABBREVIATIONS AND ACRONYMS
ASAL Arid and Semi Arid Lands
CRD Centre for Research and Development
FPE Free Primary Education
GDP Gross domestic product
GER Gross enrolment ratio
GOK Government of Kenya
MDG Millennium development goals
MOE Ministry of Education
MOEST Ministry of education science and technology
NER Net enrolment ratio
SAPS Structural adjustment programs
UIS UNESCO Institute of Statistics
UNICEF United Nations International Children Education Fund
UPE Universal primary education
xiv
ABSTRACT
Kenya government has noted that there is internal inefficiency especially in the primary section despite heavy investment in the primary education. The district was witnessing problems of declining gross enrolment rates, high wastage as a result of absenteeism, repetition and dropout rates. This has triggered debate over the causes of internal inefficiency. Thus there is need to investigate home based factors influencing internal efficiency in public primary schools. Therefore this study has investigated on the factors that influence internal efficiency in public primary schools in Gucha District. The objectives of the study were to establish whether household duties and child labour influence pupils’ performance in primary examinations, to determine how parents’ level of education influence pupils’ completion rate, to assess whether family structure and stability influence pupils’ absenteeism in primary schools and to establish the influence of family level of income on pupils’ dropout and access to primary education. The study used the descriptive survey design and purposive sampling techniques to select the schools and simple random sampling used to select class teachers and pupils involved in the study. A total of 12 public primary schools were selected for the study. The researcher used all the 12 head teachers from the 12 selected public primary schools, 2 class teachers in each school making a total of 24 class teachers and 12 pupils from each school making a total of 144 pupils.
The researcher used the research instruments that were two different questionnaires for teachers (head teachers and class teachers) and pupils. Two schools were randomly selected for the pilot study. The researcher used the test re-test method which required only one testing session to determine the reliability of the instruments. Data was analyzed using statistical package for social sciences (SPSSL) program and presented in tables, frequencies, percentages and charts. The analysis revealed several home based factors influencing internal efficiency in the provision of primary education in Gucha District. These factors are parental poverty levels, parental level of education, family structure and stability and household duties and child labor. The study found out that case of dropouts, absenteeism, repetition and poor performance are common in the district. The study found out that case of dropouts, absenteeism, repetition and poor performance are common in the district. Based on the findings the researcher recommended that the minister of education should enforce law against repetition to allow smooth transition, there is need to sensitize the community on the importance of education so that parents can develop positive attitudes towards education in order to send their children to school and poverty alleviation measures to be established in the society so as to enable more families get higher income. The suggestions for the study include; the need to replicate this study in other districts of the country, to carry out a similar study in private primary schools so as to scrutinize their internal efficiency and finally a similar study should be conducted incorporating parents and SMC members since they are determinants of a school’s internal efficiency.
1
CHAPTER ONE
INTRODUCTION
1.1 Background of the study
Education is a fundamental right of every person (World Education Forum, 2000).
It’s through education that one is able to develop economically, socially and
spiritually by acquiring desired knowledge, skills and attitude. Countries and
governments of the world have therefore strived to provide education to all of
their citizens. Hence formal education has become the greatest consumer of
revenue. Malawi for example, allocated 4.2% of its gross domestic product (GDP)
towards public education expenditure in 2007 (Sabates, 2010), France allocated
5.58% in 2008 (World Bank, 2010) and Kenya 6.18% in 2009. Education reforms
efforts, especially in less developed countries have aimed at making education an
effective tool for national development.
Education systems in many countries exhibit high levels of inefficiency (Chiuri
and Kiumi, 2005). Mbiti (2007) defines efficiency as an appropriate, timely and
prudent utilization of available resources in achieving desired results. A system is
said to be internally efficient if the inputs and efforts channeled to it give the
expected output (Chiuri and Kiumi, 2005). According to Chiuri and Kiumi, levels
of inefficiencies are evidenced by poor performance in national examinations,
high repetition and dropout rates, absenteeism and low retention, competition and
enrollment rates.
2
According to Kenya Institute of Public Policy Research and Analysis (2003), the
high cost of education and household poverty levels often pushes the students to
do menial jobs to supplement the meager family income. Bray (2001) argued that
user fees in primary education are pervasive and a serious obstacle to enrollment
and completion rate for millions of children around the world.
According to Maicibi (2005) a good environment should be provided by the home
if our children in school must learn, if the administration must be successful and if
the school must develop. Maani (2009) observes that students’ success at school
is closely related to their home backgrounds. Maku (2005) observes that home
based factors such as the size of the household, income of parents, education level
of parents and type and level of interaction between parents and children with
regard to school work affect internal efficiency.
Studies by Chimombo (2005) in Malawi on basic education in developing
countries reveal that the necessity in children to engage in tasks that support
household survival limits school performance. This is especially in the rural and
urban squatter groups. In Kenya children from poor family settings combine
schooling and other activities such as household chores, farm work, work outside
homes and family business (Moyi, 2011). Moyi (2011) points out that most of the
children who work and attend school may be at a disadvantage because this
constitutes educational inequality. Studies have shown that children in Kenya are
3
engaged in domestic chores often to the detriment of their education (kadenyi and
Kamunyu, 2006)
Ministry of Education (2010) showed that parents with professional qualifications
ensure that children remain in school. Education level of the household members
is influential in determining whether and for how long children access schooling.
Ersado (2005), talks of the widely accepted notion that parental education is the
most consistence determinant of the child’s education and employment decisions.
Higher levels of parents education is associated with increased access to
education, higher attendance rates and lower dropout rates (Ainsworth, 2005;
Hunter and May, 2003).
The U.S center for marriage and family released a study in November 2005 that
shows broken family structures consistently lead to education difficulties for
children (Schultz, 2006). The report found that children from non – intact families
have significantly high rates of difficulty with all levels of education. Research
indicates that children exposed to domestic violence are at an increased risk of
being neglected. One of the impacts is that such children develop cognitive and
attitudinal problems (Child Welfare Information Gateway, 2009)
Household income is an important factor in determining access to education
(Cardoso, 2007). Poor economic growth in Kenya has led to persistent poverty
among Kenyan households. Majority of Kenyans live below the poverty line and
are therefore unable to access basic services like food, shelter, health and
4
education (Republic of Kenya, 2002). Although the government of Kenya has
subsidized primary education to a tune of ksh 1020 for each child per year, there
are direct and indirect costs met by parents. This affects the enrolment of pupils in
primary schools particularly in rural areas. Majority of rural households depend
on agricultural produce to obtain income to meet the costs of schools. Students are
locked out if they cannot meet the direct and indirect costs of education (Mukudi,
2004). Household income is seen as a determiner of children and is linked to a
range of factors, when children start school, how often they attend, whether they
have to temporarily withdraw and they have to drop.
Globally the quest for education for all (EFA) begun with the universal
declaration of human rights adopted in 1948 that declared education as a human
right. It aimed at ensuring that elementary education was made freely and
compulsorily available for all children in all nations. This was affirmed again in
the bill of human rights in the 1970s (EFA global monitoring report 2005).
The Kenyan government’s policy on primary education was to achieve universal
primary education (UPE) by 2005, which is a key strategy towards attaining the
overall EFA goals by 2015. This brought about the introduction of free primary
education (FPE) in January 2003 sessional paper No. 1(Republic of Kenya, 2005)
which resulted in an increased enrolment of pupils. The aim of FPE program was
to provide more school opportunities, especially to the poor communities. The
argument was that payment of school fees tended to prevent a large proportion of
5
the children from attending school (Center for Research and Development, 2004).
However Mukudi (2004) indicated that in spite of the government’s
implementation of the new policy of free primary education, children of school
going age continue to be denied access and participation.
According to EFA global monitoring report (2012), there has been much progress
in the implementation of the declaration in many countries all over the world.
However the report states that millions of children, youth and adults still lack
access to good quality education and the benefits it brings. The GER for
developed countries is close to 100% while those of developing economies
especially Africa is lower than 50%.
Economic survey (2012) indicated that in Kenya enrollment in primary schools
rose by 5.3% from 9.4 million in 2010 to 9.9 million in 2011. Sabates (2010)
reports that children are starting primary school in greater numbers than ever
before but drop-out rates are significant and this leads to low levels of primary
school completion. The pupil completion rates (PCR) declined from 76.8% in
2010 to 74.6 in 2011. The decline in PCR could be attributed to dropouts and
repetition occasioned by the class performance and socio-economic factors such
as poverty, child labor, family structure and stability (Economic Survey, 2011).
United Nations summit (2010) indicates that in sub-Saharan Africa, more than
30% of primary school pupils drop out before reaching the final grade. Bruneforth
(2006) reports that more than half of all children aged 10 to 19 who had already
6
left primary school did so without completion in Burkina Faso, Ethiopia, Kenya,
Mali and Mozambique. A survey by the Kenya national Bureau of Statistics
(2010) revealed that the overall prevalence of pupils’ dropout was 41% with boys
being 37% and girls 43.3%. Special attention should be paid therefore, to the
analysis of internal efficiency of education system which reflects dynamics of
different event over the school cycle for example promotion to subsequent grade
repetition of grade, dropout or graduation.
This dropout and repetition are elements of wastage of the scarce resources
allocated to the primary subsector and they negatively impact on the completion
rates. An ideal situation would imply that all those pupils who enroll in class 1
complete class eight after eight years of primary education after which they
graduate to join secondary level. The low completion rates, high dropout and
repetition rates lead to waste of human resources in terms of teachers and
students’ time and also increase in education costs (World Bank, 2010). Though a
lot of emphasis is placed on the efficient utilization of school inputs, the link
between inputs and outputs of an educational system makes the equation complete
(Blaug, 1970). Therefore there is an urgent need for educational managers in
Kenya to focus on ways of producing qualified primary school graduates at a
minimum cost, maximizing output and efficiently utilizing the various inputs. To
attain this, it is important to establish the level of internal efficiency in order to
come up with remedies of arresting internal inefficiency.
7
1.2 Statement of the problem
The government of Kenya recognizes the strategic importance of the overall
education level of Kenyans within the context of poverty reduction and economic
growth. Education can reduce social and economic inequality by reducing
poverty, achieving the desired economic growth, creating more employment and
guarantee sustainable development for Kenyans now and in future (session paper
2004). In a bid to expand access to primary education the government of Kenya
eliminated school fees by increasing its public expenditure in education to 27.43%
in 2003 under the introduction of FPE with an aim of maintaining high enrollment
rates (EMIS, MOE 2007).
This policy option cannot assure or guarantee high levels of efficiency as there
exists many other variables other than fees that do influence levels of efficiency
(Colcough 2003). Raja and Burret 2004 stated that there is a serious absence of
current literature examining the possible causes of internal inefficiency among
countries that have not achieved universal primary education (UPE). It is also not
in order to assume that high public expenditure in education increased the rate of
internal efficiency of primary schools. This is clearly indicated in data (MOEST
2005) that reveals high rates of repetition and dropout in some districts including
Gucha district even after the implementation of the FPE program. According to
Chiuri and Kiumi 2005, poor performance in national examination and high rates
of repetition and dropouts are evidence of internal inefficiency of an education
8
system. Hence the researcher was interested in finding out the home based factors
responsible for high dropout rates, absenteeism, repetition and poor performance
in national examinations in Gucha district.
1.3 Purpose of the study
The purpose of this study was to investigate the home based factors influencing
internal efficiency in public primary schools in Gucha district Kenya.
1.4 Objectives of the study
The following objectives guided the study:
i. To establish whether household duties and child labor influence pupils’
performance in primary examinations.
ii. To determine how parents’ level of education influence pupils’ completion
rate.
iii. To assess whether family structure and stability influence pupils’
absenteeism in primary schools.
iv. To establish the influence of family level of income on pupils’ dropout
and access to primary education.
1.5 Research questions
The research was guided by the following questions
9
i. To what extent do household duties and child labor influence the
performance in national examinations?
ii. To what extent is completion rate influenced by parents’ level of
education.
iii. To what extent do family structure and stability influence absenteeism in
primary schools.
iv. How does the family level of income influence pupils’ dropout and access
to primary education?
1.6 Significance of the study
The findings of the study provided information on various factors that affect
internal efficiency of public primary schools, information which can be useful to
the planners and policy makers, education managers and providers on proper
policies that would allow access, retention and completion of primary education
by all social economic groups in Kenya. The information gathered can be used to
educate parents and communities on the importance of education in breaking the
vicious cycle of poverty so that they can actively participate in provision of
educational facilities.
1.7 Delimitations of the study
The study was conducted to selected public primary schools in Gucha District.
The findings would therefore not be generalized to other parts of the country and
10
that the findings may not apply to all public primary schools or to private schools
in other parts of the country. The study restricted itself to responses from head
teachers, class teachers and pupils who were readily available to respond to the
questionnaires leaving out others who may have vital information but were not
sampled for the study.
1.8 Limitations of the study
The study was limited to public primary schools in Gucha District hence private
schools were excluded an implication that results from this study can only be
generalized to public schools yet education is offered by both the private and
public sectors of education. In addition, generalization should be carried out with
a lot of caution since the focus and study was on one district among the many
districts in the county.
1.9 Assumptions of the study
In the course of the study the following assumptions were held;
Schooling years are a measure of learning and an indicator of internal
efficiency
The views of pupils and teachers would adequately represent those that the
researcher could acquire from the parents and pupils who dropped out.
11
1.10 Organization of the study
The study is organized into five chapters. Chapter one comprises the introduction.
This presents the background of the study, statement of the problem, purpose of
the study, limitations of the study, delimitations, and assumptions of the study,
definition of significant terms and organization of the study. The second chapter
of the study includes the review of the related literature which is organized into
sub-themes and also captured the conceptual framework. The third chapter of the
study presents the research methodology. It contains the research design, target
population, sampling techniques, the research instruments, the data collection
procedures and data analysis techniques. Chapter four dwells on the results and
discussion of the findings while chapter five covers the summary, conclusions and
recommendations.
1.10 Definition of significant terms
Dropout refers to the student who leaves school at a non terminal point in
the cycle of the course.
Gross enrolment rate refers to the total enrolment in a given cycle of
education in spite of age, expressed as a percentage of the total population
of the age group which corresponds with the duration to the given cycle of
schooling.
Home based factors refer to factors emanating from the family background
12
that affect learners’ schooling.
Internal efficiency refers to progression of pupils from the time of enrolment
to the time of graduation without being inhibited by any factors.
Influence refers to the effect that the home environment has on learning
process of the pupils.
Pupil background refers to the environment in which a child finds himself
or herself in.
Repetition refers to stalemate of a pupil in the same grade for more than
one academic year
13
CHAPTER TWO
LITERATURE REVIEW
2.1 Introduction
This chapter covers a review of literature related to the problem to be
investigated. In this chapter the research focuses on a number of concepts namely:
- the importance of investing in human capital, efficiency in the education system
under various indicators e.g. enrolments, dropouts, repetition, retention, and
completion rates, factors that influence internal efficiency of the education
system.
2.2 Importance of investing in human capital
Investment in education contributes to economic development and raises the
income of the poor and it provides the means of developing the knowledge skills
and productive capacities of the labor force. Such a strong relationship between
education and economic development has been given a lot of emphasis; for
instance, Plato stipulated that general education is indispensable to the economic
health of a good society. Marshal also in support of investment in education
asserted that most valuables of all capital are that invested in human beings.
Similar sentiments came from Lockheed (1980) when he measured the
relationship between farmers’ educational attainment and their agricultural
efficiency in developing countries and found out those farmers with four years of
14
elementary education recorded productivity of 89.7% higher than farmers with no
education
Hyde (1995) termed education as a means of facilitating change in attitude which
in turn enhanced productivity and Todaro (1997) concurs by asserting that human
beings are the active agents who accumulate capital ,knowledge , exploit natural
resources built social economic and political organizations, and carry forward
national development. Thus, education is part and parcel of individual and
national development. The government of Kenya recognizes education as a major
agent of economic, political and social development. This recognition is seen in
the government’s commitment to provide education, for example in 2003 the
government introduced free primary education.
2.3 Efficiency in education
Efficiency of an education system refer to the intrinsic ability to educate the
greatest number of students who have entered the system in a given year in the
shortest time and with the least use of financial and human resources
(UNESCO,2008). Internal efficiency deals with the relationship between various
inputs and outputs within the education system or within the individual
institutions. An education system is said to be efficient if maximum output is
obtained from a given input or a combination of various inputs. The government,
parents, donor agencies, and non-governmental organizations all recognize that
major strides have been made in education in quantitative terms but regret that

15
there are still shortcomings in the education systems which include low GER, low
completion rates, and high dropout rates.
2.3.1 Enrolment rate
Enrollment rates will reflect access to primary education. The rates in 2007 were
94.1% for boys and 89.0% for girls giving a national average of 91.6% while that
of Gucha district was 73.7% for boys and 73.9% for girls an average of 73.8%
(EMIS, MOE 2007). One of the goals of the MOE is to attain 100% transition
rate.
This enrollment rate is largely determined by the number of available places and
the willingness of parents to enroll their children. Eshiwani(1990) notes that
Kenya’s population growth is one of the highest in the world and that one of the
major problems facing the government is meeting social demand for education.
To enhance transition the government encourages private sector participation in
the provision of primary education. In Kenya, primary school enrollment have
been rising from 80.8% in 2003 to 91.6% in 2007 but whereas the figures reflect
that much has been achieved, the NER has been declining in Gucha District where
in 2003 it was 98.1% to 73.8% in 2007 below the national average (EMIS, MOE
2007).
16
2.3.2 Drop outs and internal efficiency
Drop outs refer to those pupils who leave the education system before completing
the education cycle. It is a wastage of resources for the education system invests
for the years of study which do not yield the expected results
(UNESCO,2005).According to Todaro (1989) one of the major educational
problems of developing nations is the very high percentage of pupils who drop
out before completing a particular cycle. Any education system aims to have
pupils complete the full primary cycle before either joining secondary schools or
joining the world of work (Nduku, 2003; Ngotho, 2003; Mutuma, 2005).
When it is apparent that a big number of children drop out of school before
completing the cycle, this becomes a major problem because: firstly, children who
drop out are pushed out of the education system and prematurely flow into the
free world without the necessary skills and qualifications. When they join their
unemployed colleagues, they soon lose the little literacy they had acquired.
Secondly, each child that leaves school prematurely leads to economic loss to the
government and parents. Thirdly, a child with little education finds it difficult to
move upwards along the social ladder. Lastly, school dropouts indulge in
antisocial activities such as crime, prostitution, drug and substance abuse and
frustrations may lead some into suicide. School dropouts thus create problems for
themselves and the society at large (Mathenge, 1996). For example, in Kenya the
number of boys who reached standard five was 620.7 thousand in 2011 compared
17
to 667.9 thousand who joined standard one in 2007, a drop of 7.7%. Similarly the
number of girls dropped by 3.3% from 644.2 thousand in 2007 to 622.9 thousand
in 2011 (Economic survey, 2012). Whereas in Gucha the number of pupils who
reached class four was 2614 in 2012 compared to 3328 who joined class one in
2009, a drop of 21.45% (DEO’S office Gucha).
2.3.3 Repetition and internal efficiency
Class repetition occurs when students begin a new school year in the same class
as the previous year instead of moving to a higher class. UNESCO (2006), in their
education policy series, explains that class repetition takes five major forms
depending on the source and reasons for decisions to repeat. When repetition
occurs because of decisions made by students, or their families, it is usually
voluntary and undertaken willingly because it is viewed as serving the student’s
best interests. However, school imposed class repetition has negative effects on
learner achievement and is sometimes associated with social adjustment problems
and increased likelihood of school dropout. NCES, (2009) reports that grade
repetition is the major cause of school dropouts in all the education systems that
still practice it. This practice of class repetition is an issue of concern all over the
world. The issue is often debated in comparison to the policy of social promotion
which aims to suspend class repetition in an effort to provide opportunities for
students to improve their standards of living by acquiring education through a
more egalitarian distribution of educational opportunities (World Bank, 2010).
18
A study conducted by UNESCO (1977) on repetition in developing countries
found out that repeaters constitute about 15% of the total enrolment in primary
education in Latin America, 15% in Africa and 18% in south Asia. The
implications of such repetition are wastage of educational resources especially
financial and human resources. Lockheed (1991) cautioned that in order to
achieve internal efficiency such wastage need to be minimized. Repetition can
lead to dropping out of the education system. Matuku (2007) while citing
Schreiber (1964) argues that those pupils who fail and are made to repeat a grade
are likely to and subsequently do drop out of school (p.12). According to the
UNESCO (2008) report many pupils drop out of school rather than repeat grades.
The report further states that average children are more likely to repeat grades and
eventually drop out. It cites sub-Saharan Africa as having the highest repetition
rates as compared to other developing countries. Namanga (2005) noted that
repetition in Bumula division of Bungoma district was higher in class seven
because few pupils were admitted in standard eight in an attempt to increase the
class mean standard score. Mingat and sosale (2000) pointed out that dropping out
is not an instance decision but emanates from other factors like repetition and
absenteeism.
2.3.4 Retention and completion rates
For an education system to record high survival rates it calls for a collective
responsibility between the children, parents, communities, local government and
19
international agencies. This is because no one individual or one government can
ensure that all children enjoy their right to quality education. UNICEF (2004)
stipulated that collective responsibility of similar magnitude should be displayed
in primary education systems to ensure that they experience high survival rates.
The ideal average number of years per successful completer should be equal to
the duration of the school cycle. In the case of primary education cycle a
successful graduate should take 8 years to complete primary education. This can
only be achieved if the various inputs in the education system are efficiently and
maximally utilized to produce maximum output.
2.4 Factors influencing internal efficiency in primary schools.
According to Abagi and Odipo (2007), the constituents of efficiency in education
include repetition, dropout, retention and examination results. There are several
factors that affect internal efficiency in primary schools such as poverty levels,
parents’ level of income, parents’ level of education, household chores and child
labor, and family structure and stability.
2.4.1 Parents’ level of education and internal efficiency
According to UNICEF (2004), children of educated parents are much more likely
to go to school and the more schooling the parents have received the more
probable it is that they would benefit from education. The report said that if
educated girls became mothers, they are likely to send their children to school,
20
thereby passing on and multiplying benefits both for themselves and society in a
positive integrated manner.
According to USAID (1999 – 2004) in Guatemala, the national statistics shows
that 75% of rural indigenous women were illiterate and only one out of three rural
indigenous children went to school. Fewer than two of every ten rural indigenous
children who enter primary school complete sixth grade. The report further notes
that, increased community participation in educational decision making process,
promoting women leadership and parent participation in school committees led to
increased retention and promotion from 51% to 66%.
2.4.2 Household duties and child labor and internal efficiency
UNICEF conducted a survey on households in 25 sub-Saharan countries and
found that 31% of children aged between 5-14 years were engaged in a form of
child labor. A large number of children estimated to be 75 million in sub-Saharan
Africa are out of school and about 165 million all over the world are working as
child laborers (Elimu news, 2010). Abagi and Odipo (2007) observe that as
poverty levels rises child labor has become crucial for family survival. Household
chores often affect girls’ opportunities to learn by taking away valuable time that
they would spend on their education (UNICEF, 2007). According to UNICEF
(2004) labor participation by persons below the age of 15 is not only widespread
but also escalating at an acceptable rate.
21
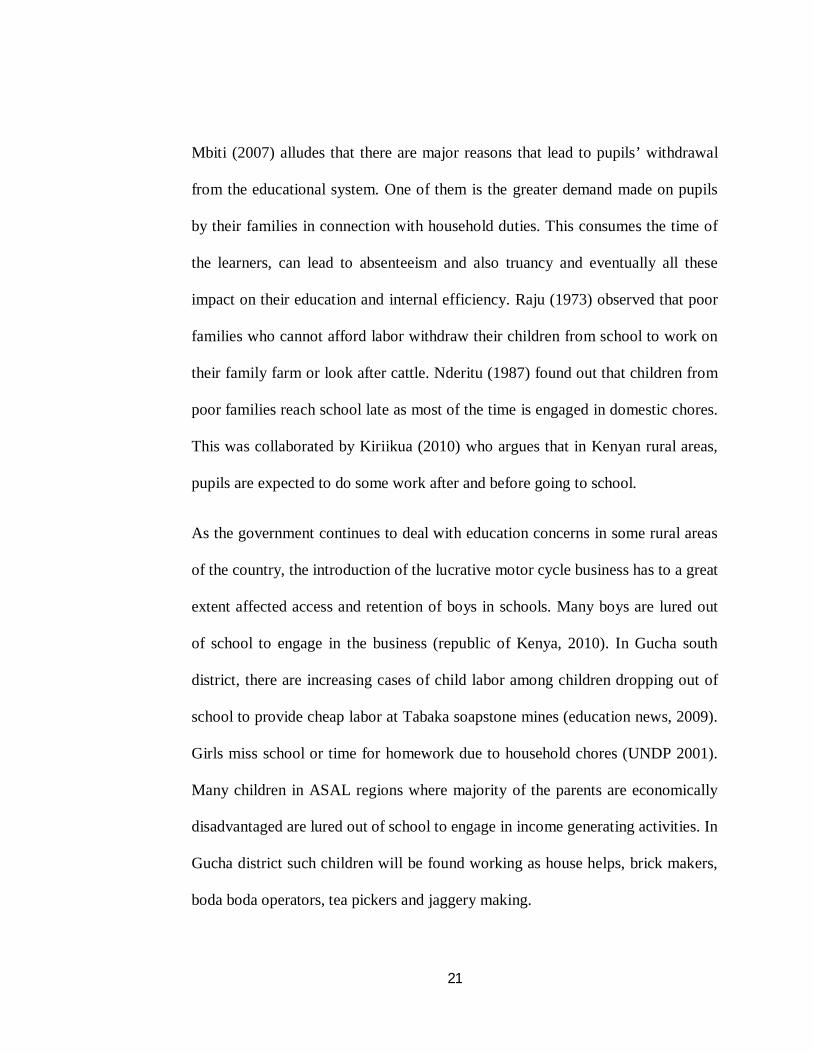
Mbiti (2007) alludes that there are major reasons that lead to pupils’ withdrawal
from the educational system. One of them is the greater demand made on pupils
by their families in connection with household duties. This consumes the time of
the learners, can lead to absenteeism and also truancy and eventually all these
impact on their education and internal efficiency. Raju (1973) observed that poor
families who cannot afford labor withdraw their children from school to work on
their family farm or look after cattle. Nderitu (1987) found out that children from
poor families reach school late as most of the time is engaged in domestic chores.
This was collaborated by Kiriikua (2010) who argues that in Kenyan rural areas,
pupils are expected to do some work after and before going to school.
As the government continues to deal with education concerns in some rural areas
of the country, the introduction of the lucrative motor cycle business has to a great
extent affected access and retention of boys in schools. Many boys are lured out
of school to engage in the business (republic of Kenya, 2010). In Gucha south
district, there are increasing cases of child labor among children dropping out of
school to provide cheap labor at Tabaka soapstone mines (education news, 2009).
Girls miss school or time for homework due to household chores (UNDP 2001).
Many children in ASAL regions where majority of the parents are economically
disadvantaged are lured out of school to engage in income generating activities. In
Gucha district such children will be found working as house helps, brick makers,
boda boda operators, tea pickers and jaggery making.
22
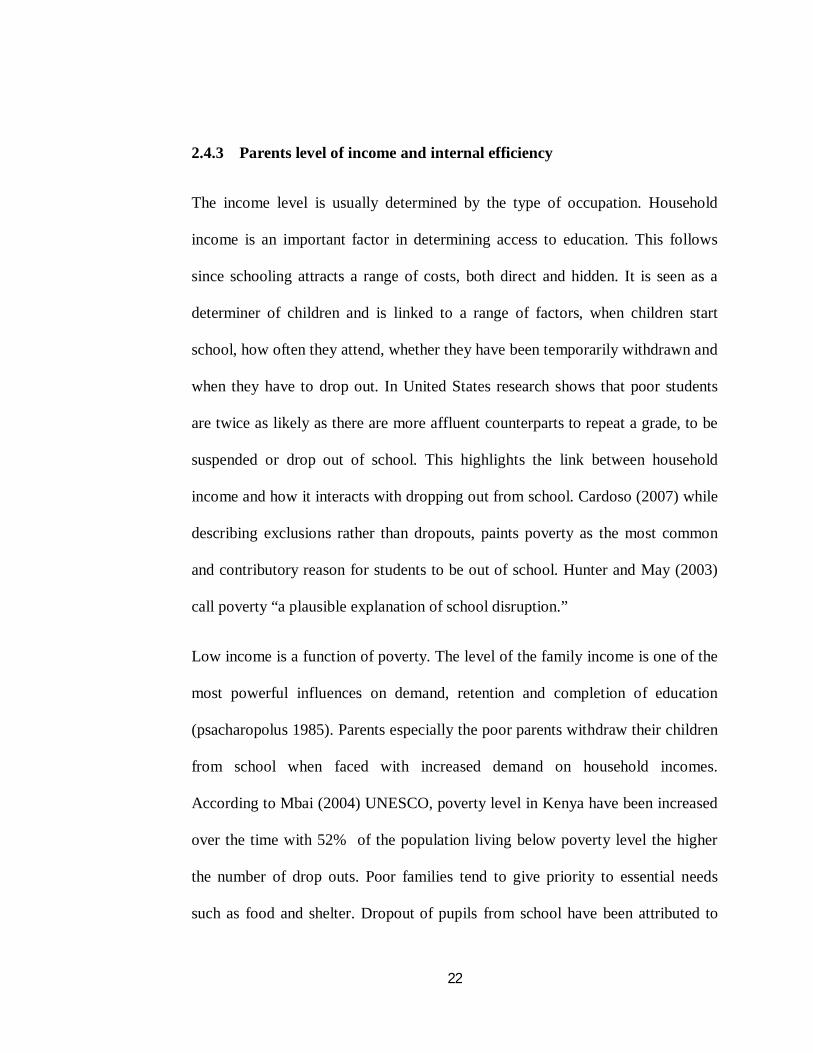
2.4.3 Parents level of income and internal efficiency
The income level is usually determined by the type of occupation. Household
income is an important factor in determining access to education. This follows
since schooling attracts a range of costs, both direct and hidden. It is seen as a
determiner of children and is linked to a range of factors, when children start
school, how often they attend, whether they have been temporarily withdrawn and
when they have to drop out. In United States research shows that poor students
are twice as likely as there are more affluent counterparts to repeat a grade, to be
suspended or drop out of school. This highlights the link between household
income and how it interacts with dropping out from school. Cardoso (2007) while
describing exclusions rather than dropouts, paints poverty as the most common
and contributory reason for students to be out of school. Hunter and May (2003)
call poverty “a plausible explanation of school disruption.”
Low income is a function of poverty. The level of the family income is one of the
most powerful influences on demand, retention and completion of education
(psacharopolus 1985). Parents especially the poor parents withdraw their children
from school when faced with increased demand on household incomes.
According to Mbai (2004) UNESCO, poverty level in Kenya have been increased
over the time with 52% of the population living below poverty level the higher
the number of drop outs. Poor families tend to give priority to essential needs
such as food and shelter. Dropout of pupils from school have been attributed to
23
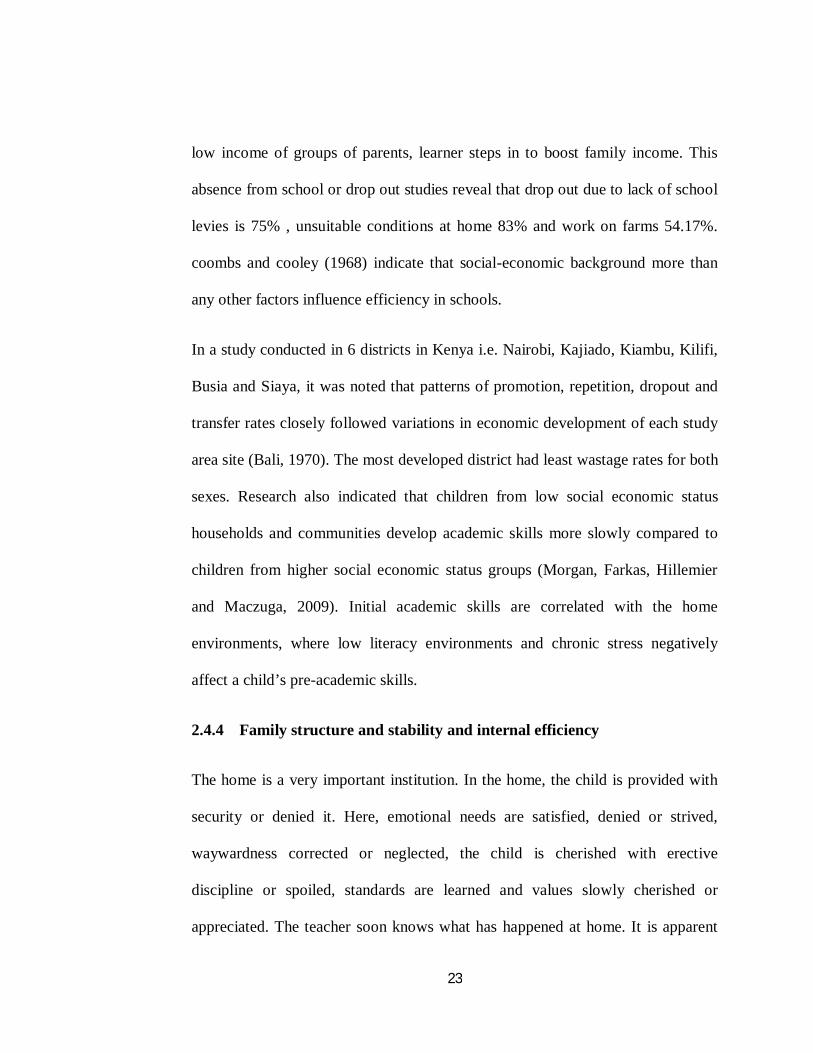
low income of groups of parents, learner steps in to boost family income. This
absence from school or drop out studies reveal that drop out due to lack of school
levies is 75% , unsuitable conditions at home 83% and work on farms 54.17%.
coombs and cooley (1968) indicate that social-economic background more than
any other factors influence efficiency in schools.
In a study conducted in 6 districts in Kenya i.e. Nairobi, Kajiado, Kiambu, Kilifi,
Busia and Siaya, it was noted that patterns of promotion, repetition, dropout and
transfer rates closely followed variations in economic development of each study
area site (Bali, 1970). The most developed district had least wastage rates for both
sexes. Research also indicated that children from low social economic status
households and communities develop academic skills more slowly compared to
children from higher social economic status groups (Morgan, Farkas, Hillemier
and Maczuga, 2009). Initial academic skills are correlated with the home
environments, where low literacy environments and chronic stress negatively
affect a child’s pre-academic skills.
2.4.4 Family structure and stability and internal efficiency
The home is a very important institution. In the home, the child is provided with
security or denied it. Here, emotional needs are satisfied, denied or strived,
waywardness corrected or neglected, the child is cherished with erective
discipline or spoiled, standards are learned and values slowly cherished or
appreciated. The teacher soon knows what has happened at home. It is apparent
24
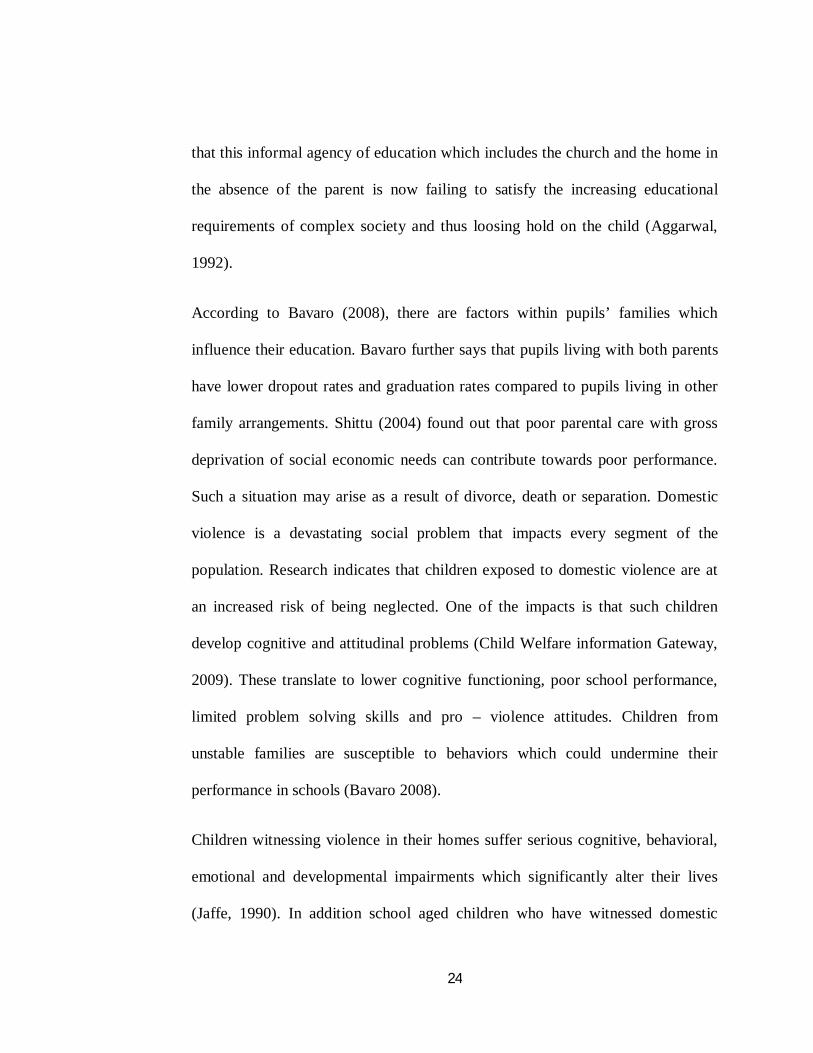
that this informal agency of education which includes the church and the home in
the absence of the parent is now failing to satisfy the increasing educational
requirements of complex society and thus loosing hold on the child (Aggarwal,
1992).
According to Bavaro (2008), there are factors within pupils’ families which
influence their education. Bavaro further says that pupils living with both parents
have lower dropout rates and graduation rates compared to pupils living in other
family arrangements. Shittu (2004) found out that poor parental care with gross
deprivation of social economic needs can contribute towards poor performance.
Such a situation may arise as a result of divorce, death or separation. Domestic
violence is a devastating social problem that impacts every segment of the
population. Research indicates that children exposed to domestic violence are at
an increased risk of being neglected. One of the impacts is that such children
develop cognitive and attitudinal problems (Child Welfare information Gateway,
2009). These translate to lower cognitive functioning, poor school performance,
limited problem solving skills and pro – violence attitudes. Children from
unstable families are susceptible to behaviors which could undermine their
performance in schools (Bavaro 2008).
Children witnessing violence in their homes suffer serious cognitive, behavioral,
emotional and developmental impairments which significantly alter their lives
(Jaffe, 1990). In addition school aged children who have witnessed domestic
25
violence are prone to poor academic performance, constant fighting with peers,
and rebellion against adult authority (National Center on Women and Family Law
1994). In Oregon 68% of juvenile offenders in treatment programs had witnessed
the abuse of their mother and/or were subjected to abuse themselves (Rhodes and
Parker, 1981). Study shows that in 50 – 70% of the cases in which a parent abuses
another parent, children are physically abused as well (Bowker, 1988). Some
parents do not encourage their children to work hard in school and some families
are headed by children. This is a situation which can not inspire the children to
work hard in primary school. In some homes, it is an establishment that the
highest education attainment is primary education.
2.5 Summary of the literature review
This chapter has reviewed literature on internal efficiency phenomenon. Three
areas related to the subject content have been discussed. This include importance
in investing in human capital; scope of internal efficiency such as enrolment rate,
dropouts, repetition, retention and completion rates; and factors influencing
internal efficiency (parents’ level of income, parents level of education, household
duties and child labor and family structure and stability). Looking at the
completion rates, less than a half of pupils who enroll in primary school complete
the entire cycle. Two determinants of low completion rates identified are high
dropout rates and increased repetitions among pupils. Low primary completion
rates and low pupil achievement are identified as the most visible signs of

26
inefficient education systems. In Kenya, most studies on internal efficiency have
been carried out in areas like Makuu, Meru, Bungoma and Yatta but in Gucha
district there is limited research on this area. This made this study crucial.
2.6 Theoretical framework
The study embraced human capital theory developed by Schultz in 1960. Based
upon the work of Schultz (2006), Psacharopoulos and Woodhall(2002), human
capital theory rest on the assumption that formal education is highly instrumental
and necessary to improve the production capacity of a population. Human capital
theorists argue that an educated population is a productive population
emphasizing how education increases productivity and efficiency of workers by
increasing the level of cognitive stock of economically productive human
capability which is a product of innate abilities and investment in human beings.
The provision of formal education is seen as a productive investment in human
capital.
On the basis of this theory, this study sought to establish the home based factors
influencing internal efficiency in the provision of primary school education. The
theory guides this study because it provides a basis for considering home based
factors which promote education in the country for sufficient and efficient human
capital availability. An educated population is a productive population and hence
there is need to remove barriers for the population to access education. If home
27
based factors are managed, they will lead to enhanced enrolments, retention, low
dropouts and increased completion rates.
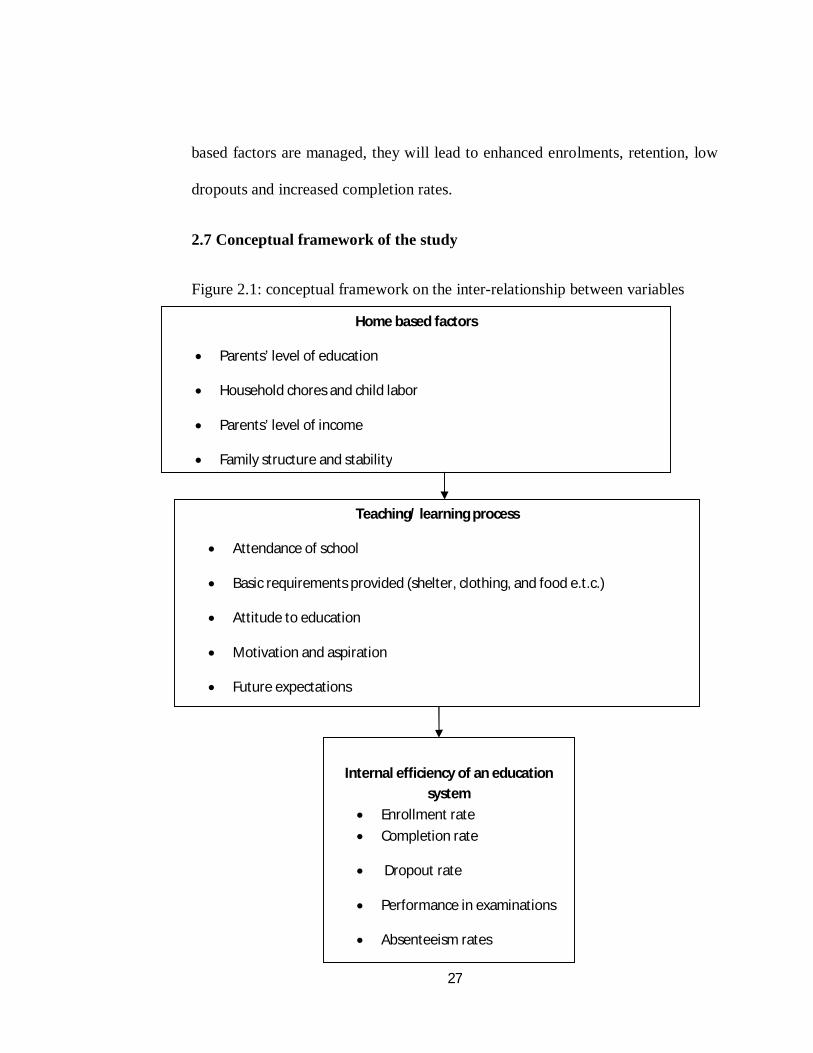
2.7 Conceptual framework of the study
Figure 2.1: conceptual framework on the inter-relationship between variables
Home based factors
Parents’ level of education
Household chores and child labor
Parents’ level of income
Family structure and stability
Teaching/ learning process
Attendance of school
Basic requirements provided (shelter, clothing, and food e.t.c.)
Attitude to education
Motivation and aspiration
Future expectations
Internal efficiency of an education
system
Enrollment rate
Completion rate
Dropout rate
Performance in examinations
Absenteeism rates
28
According to Mbwesa (2006) conceptual framework is a hypothesized model
showing the variables under study as conceptualized by the researcher. The
independent variables represent the home based factors which influences the
internal efficiency in schools. These include household duties and child labour,
family structure and stability, parental level of education and poverty levels. All
these factors influence enrolment rates, dropout rates, repetition rates,
absenteeism levels and graduation rate. If they lead to high level of enrolment and
achievement, high rate of graduation and low rates of dropout, repetition and
absenteeism, they impact positively on efficiency in the school system. If they
lead to low enrolment and achievement levels, high dropout, absenteeism,
repetition rates and low graduation rates, the system will be internally inefficient.
However, an efficient system can become inefficient if its operations are
compromised by home based factors while inefficient system by putting in place
policies and measures geared towards addressing the factors contributing to
internal inefficiency.
29
CHAPTER THREE
RESEARCH METHODOLOGY
3.1 Introduction
This chapter describes the methodology that was used in the study and include;
the research design, target population, sample size and sampling procedure, data
collecting instruments, data collection procedures and data processing and
analysis.
3.2 Research design
In this study, the researcher employed the descriptive survey design. According to
Mugenda and Mugenda (2003), surveys can be defined as systematic descriptions
of the facts and characteristics of a given population accurately and objectively. It
can be extensive and cross-sectional, dealing with a relatively large number of
cases at a particular time. It aids in describing the nature of existing conditions,
determining the existing relationship between a specific event influencing and
affecting a present condition The design is chosen on the rationale that it can be
carried out within a short frame of time as it is cross-sectional, it maintains ethics
as it doesn’t manipulate participant’s behavior; it’s dynamic as it varies in
complexity and scope, and it’s open to incorporating different data collection
techniques.
30
3.3 Target population
Target population is defined as the concentrated area of research from which the
researcher wishes to obtain research data. In this study the target population was
40 head teachers, 80 class teachers and 1440 pupils in classes 7 and 8 within
Gucha district. (DEO’s Office Gucha)
3.4 Sample and sampling procedures
Purposive sampling method was used to select class seven and eight pupils from
the target school. These were selected because they are well experienced in the
school hence able to address issues being investigated in the study. According to
Mugenda and Mugenda (2003) a sample of 30% is appropriate in social sciences
study therefore, out of 40 schools in the district, 12 schools was the sample
selected. 12 head teachers and 24 class teachers per school participated. Simple
random techniques will be used to select the specific schools where respondents
will be sampled. In addition, the individual pupils in class 7 and 8 in each of the
selected school will be sampled using simple random techniques. This eliminated
bias since any pupils in class 7 and 8 had an equal chance of being selected in the
sample. A sample percentage of 10% was chosen to select 144 pupils translating
to 12 pupils in every school participated in the study.
3.5 Research instruments
Research instruments are tools used to gather required data for the study. Kombo
and Tromp in (2006) argued that the researcher requires methods that provide
31
high accuracy, generalizability and explanatory power; with low cost, rapid and
minimum management demands and with administrative convenience. To this
respect, the researcher collected data from the respondents using two sets of
questionnaires (one for head teachers and teachers and the other for pupils) that
contained both closed and open ended questions.
A questionnaire would elicit and extract response from the respondents in the
process of finding out the variables that influence internal efficiency. In closed
ended questions, the respondents were expected to select the item that best suits
their situation from a given list of alternatives while the open ended question gave
the respondents complete freedom to respond through brief statements or
explanation. Likert scale questions were also used to establish perception and
attitude of the respondents.
3.6 Validity of the instruments
Three study specialists, one independent and two supervisors with training in
education administration, planning and economics checked of the face contents
and content validity to determine whether the questionnaire accurately represents
the items under study. The final instrument was developed in the light of
comments (Mugenda and Mugenda, 2003). The instruments were tested using two
schools chosen using simple random sampling from the schools that did not
participate in the actual study. Piloting helped in making adjustments and also in
establishing the reliability and validity of the research instruments.
32
3.7 Reliability of the instruments
Reliability is a measure of the degree to which an instrument yields consistent
results or data after repeated trials (Orodho, 2009). To determine reliability of the
instrument the test retest was used in this study. This method involved
administering the same instrument twice to the group of subjects with a time lapse
between the first and the second test of about two weeks. Reliability was
calculated using the Pearson’s product moment coefficient (r). A coefficient of
0.7 and above would be deemed appropriate for this study as recommended by
Koul 1990.
풓 = 푵∑풙풚 − ∑(풙)∑(풚)
√ (Nx2 – (∑(x) 2) (N∑y2 – (∑(y) 2)
Where, ∑x= sum of scores in x distribution, ∑y= sum of scores in y distribution,
∑y2= sum of squared scores in y distribution, ∑ x2 = sum of squared scores in x
distribution, ∑x y = sum of the products of paired x and y score, N = number of
paired x and y score, r = coefficient of reliability (Best and Khan, 2006). The
study attained a coefficient of 0.8 and was considered appropriate.
3.8 Data collection procedures
A research permit was obtained from the National Council for Science and
Technology. The researcher then reported to the District commissioner and
District Education Officer, Gucha District for final clearance. The researcher
33
administered the instruments through drop and pick method whereby the
researcher delivered the instruments to the respondents in person and explained
the instrument items to them and assure them of the confidentiality of their
responses.
3.9 Data analysis techniques
Data analysis refers to the interpretation of collected raw data into useful
information (Kombo and Tromp, 2006). Thorough editing of the data has been
done. Data collected was analyzed both qualitatively and quantitatively.
Qualitatively data analysis considers inferences that were made from opinions of
the respondents.
Qualitative data was analyzed by organizing it into categories on the basis of the
themes, concepts and similar features. Quantitative data was analyzed using the
statistical packages for social sciences (SPSS). The computed data was then
analyzed using descriptive statistics. The statistics calculated was included
frequencies, tables, percentages and graphs.

34
CHAPTER FOUR
DATA ANALYSIS, INTERPRETATION, DISCUSSIONS AND
PRESENTATION,
4.1 Introduction
This chapter presents the findings of the study on home based factors that
influence internal efficiency in public primary schools in Gucha district. The
researcher used school head teachers, class teachers and class seven and eight
pupils to collect the required data for the study. The collected data was coded and
fed into the computer and analyzed using the Statistical Package for Social
Sciences SPSS program. Demographic characteristics of the respondents are
presented first, and then the findings are presented according to the key research
questions.
4.2 Questionnaire return rate
It is the proportion of the questionnaires that are returned to the researcher from
the sample that participated in the survey. All the head teachers and teachers
returned their questionnaires making a return rate of 100%. Out of 144 pupils, 142
returned the questionnaires constituting 98.6%. The average return rate is
therefore 99.3% which the researcher found to be a satisfactory representation of
the target population.
35
4.3 Demographic characteristics of the respondents
Head teachers’ background information
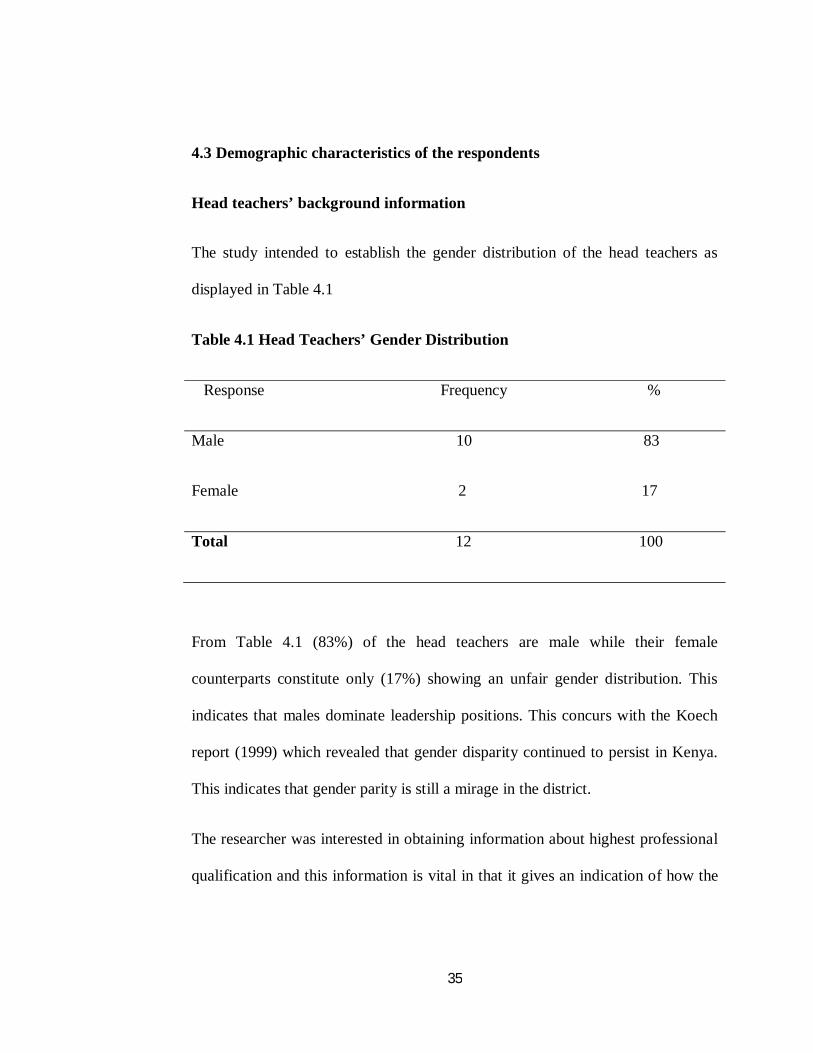
The study intended to establish the gender distribution of the head teachers as
displayed in Table 4.1
Table 4.1 Head Teachers’ Gender Distribution
Response Frequency %
Male 10 83
Female 2 17
Total 12 100
From Table 4.1 (83%) of the head teachers are male while their female
counterparts constitute only (17%) showing an unfair gender distribution. This
indicates that males dominate leadership positions. This concurs with the Koech
report (1999) which revealed that gender disparity continued to persist in Kenya.
This indicates that gender parity is still a mirage in the district.
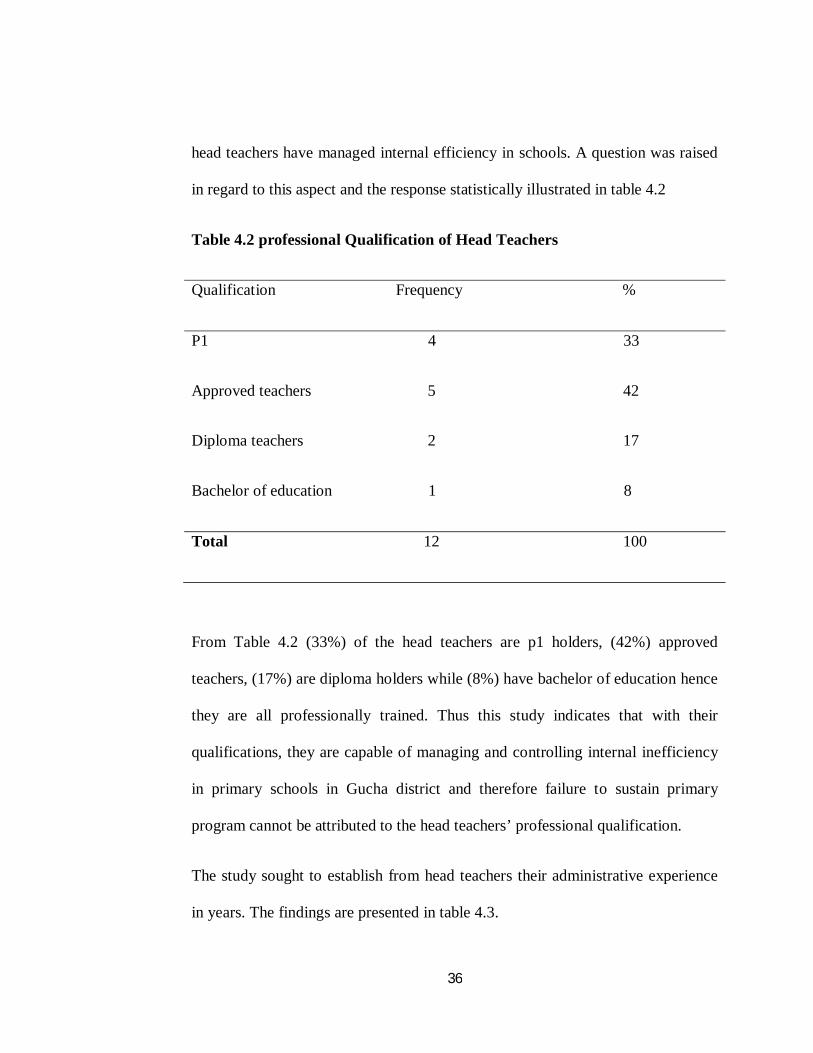
The researcher was interested in obtaining information about highest professional
qualification and this information is vital in that it gives an indication of how the
36
head teachers have managed internal efficiency in schools. A question was raised
in regard to this aspect and the response statistically illustrated in table 4.2
Table 4.2 professional Qualification of Head Teachers
Qualification Frequency %
P1 4 33
Approved teachers 5 42
Diploma teachers 2 17
Bachelor of education 1 8
Total 12 100
From Table 4.2 (33%) of the head teachers are p1 holders, (42%) approved
teachers, (17%) are diploma holders while (8%) have bachelor of education hence
they are all professionally trained. Thus this study indicates that with their
qualifications, they are capable of managing and controlling internal inefficiency
in primary schools in Gucha district and therefore failure to sustain primary
program cannot be attributed to the head teachers’ professional qualification.
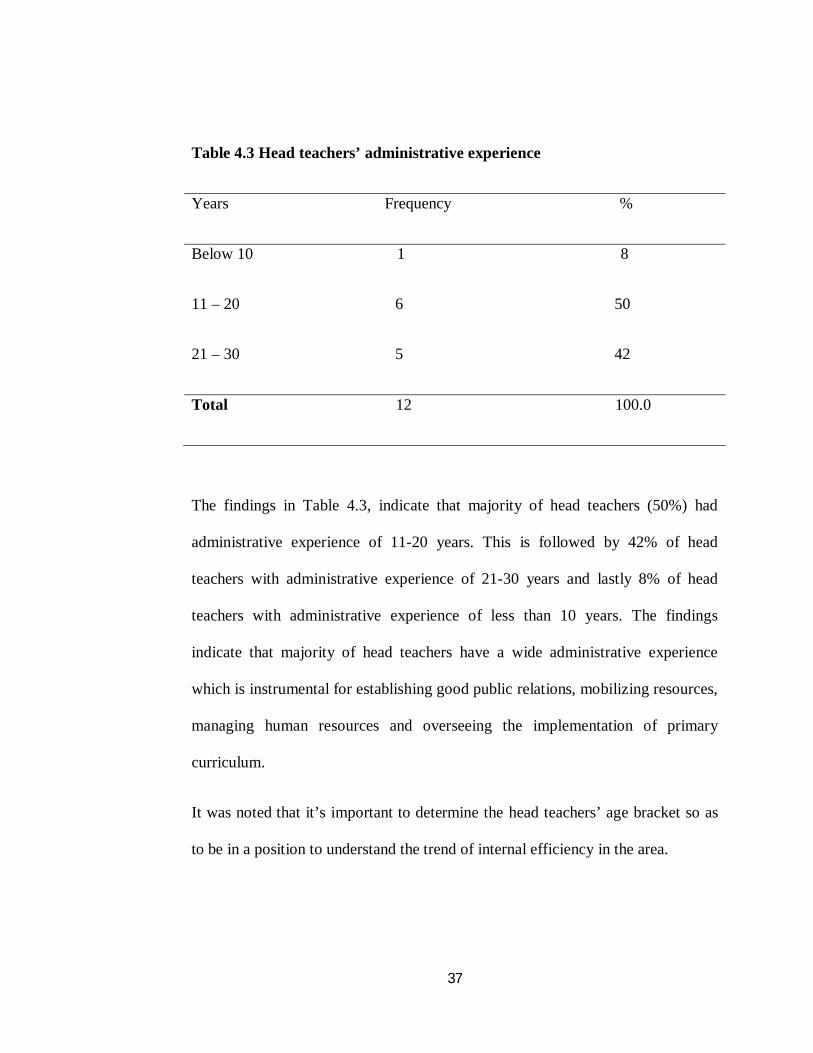
The study sought to establish from head teachers their administrative experience
in years. The findings are presented in table 4.3.
37
Table 4.3 Head teachers’ administrative experience
Years Frequency %
Below 10 1 8
11 – 20 6 50
21 – 30 5 42
Total 12 100.0
The findings in Table 4.3, indicate that majority of head teachers (50%) had
administrative experience of 11-20 years. This is followed by 42% of head
teachers with administrative experience of 21-30 years and lastly 8% of head
teachers with administrative experience of less than 10 years. The findings
indicate that majority of head teachers have a wide administrative experience
which is instrumental for establishing good public relations, mobilizing resources,
managing human resources and overseeing the implementation of primary
curriculum.
It was noted that it’s important to determine the head teachers’ age bracket so as
to be in a position to understand the trend of internal efficiency in the area.
38
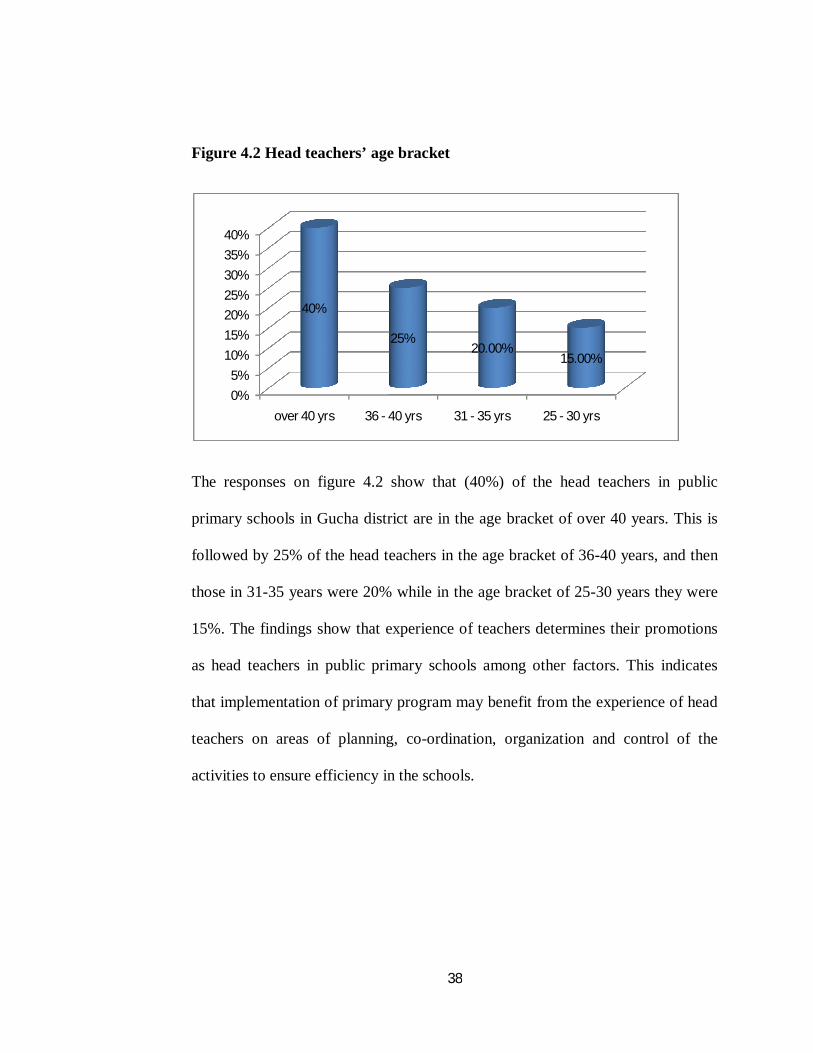
Figure 4.2 Head teachers’ age bracket
The responses on figure 4.2 show that (40%) of the head teachers in public
primary schools in Gucha district are in the age bracket of over 40 years. This is
followed by 25% of the head teachers in the age bracket of 36-40 years, and then
those in 31-35 years were 20% while in the age bracket of 25-30 years they were
15%. The findings show that experience of teachers determines their promotions
as head teachers in public primary schools among other factors. This indicates
that implementation of primary program may benefit from the experience of head
teachers on areas of planning, co-ordination, organization and control of the
activities to ensure efficiency in the schools.
0%
5%
10%
15%
20%
25%
30%
35%
40%
over 40 yrs 36 - 40 yrs 31 - 35 yrs 25 - 30 yrs
40%
25%20.00%
15.00%

39
Teachers’ background information
The teacher gender distribution was important to the study so as to see how they
cater for the unique needs of either gender therefore the researcher sought to
know the distribution of teachers by gender.
Fig 4.3 Teachers’ distribution by gender
Majority of the respondents were male teachers with a percentage of 75 to that of
the female with a percentage of 25 indicating an unfair distribution of the
respondents in terms of gender.
Teacher respondents were asked to indicate their distribution in terms of age and
their responses are elaborated in Table 4.4.
75%
25%
male
female

40
Table 4.4 Teachers’ Distribution by age
Teachers’ age frequency %
Over 41 years 6 25.00
36 – 40 years 10 41.67
31 – 35 years 8 33.33
Total 24 100.0
Majority of the teachers respondents were between 36 – 40 years indicating that
data was obtained from the right group of respondents who were aware of the
causes of internal inefficiency and would guide and counsel the pupils. The
findings show that most of the class teachers are young people. Their age is
instrumental to the primary program because they are able to work long with
pupils, fresh with current methodologies and other skills of handling pupils. If
their knowledge and skills are combined with the right rewards, the program can
eventually succeed in meeting its objectives.

41
Figure 4.4 shows the teachers’ period of teaching since they graduated.
Fig 4.4 Teachers’ distribution by their teaching experience
From figure 4.4, 41.6% of the teachers had taught for over 20 years, 33.3% had
taught for 10-20 years and 25% were below 10 years in the teaching experience.
The results show that majority of the teachers had sufficient experience and could
therefore positively contribute to the implementation and management of the
primary program.
It was important to determine the professional qualification of teachers to
determine how they handle the issue of internal efficiency.
25%
41.67%
33.33% over 20 yrs
10 - 20 yrs
below 10 yrs
42
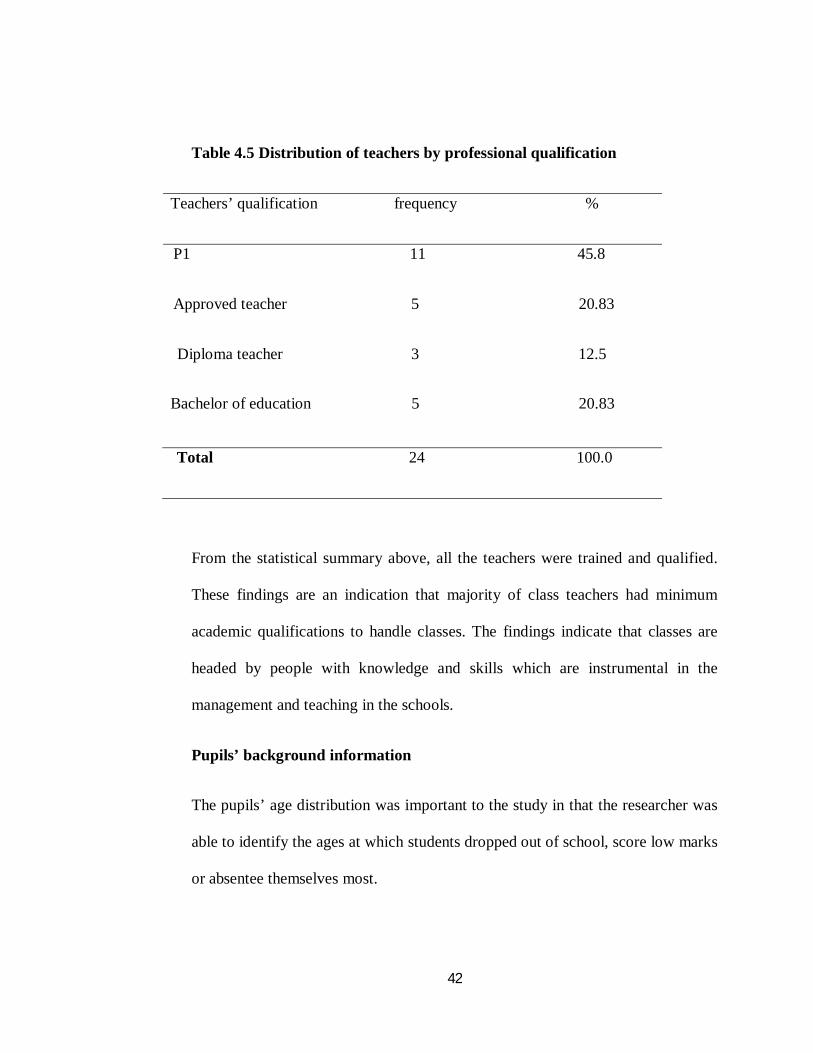
Table 4.5 Distribution of teachers by professional qualification
Teachers’ qualification frequency % P1 11 45.8
Approved teacher 5 20.83
Diploma teacher 3 12.5
Bachelor of education 5 20.83
Total 24 100.0
From the statistical summary above, all the teachers were trained and qualified.
These findings are an indication that majority of class teachers had minimum
academic qualifications to handle classes. The findings indicate that classes are
headed by people with knowledge and skills which are instrumental in the
management and teaching in the schools.
Pupils’ background information
The pupils’ age distribution was important to the study in that the researcher was
able to identify the ages at which students dropped out of school, score low marks
or absentee themselves most.
43
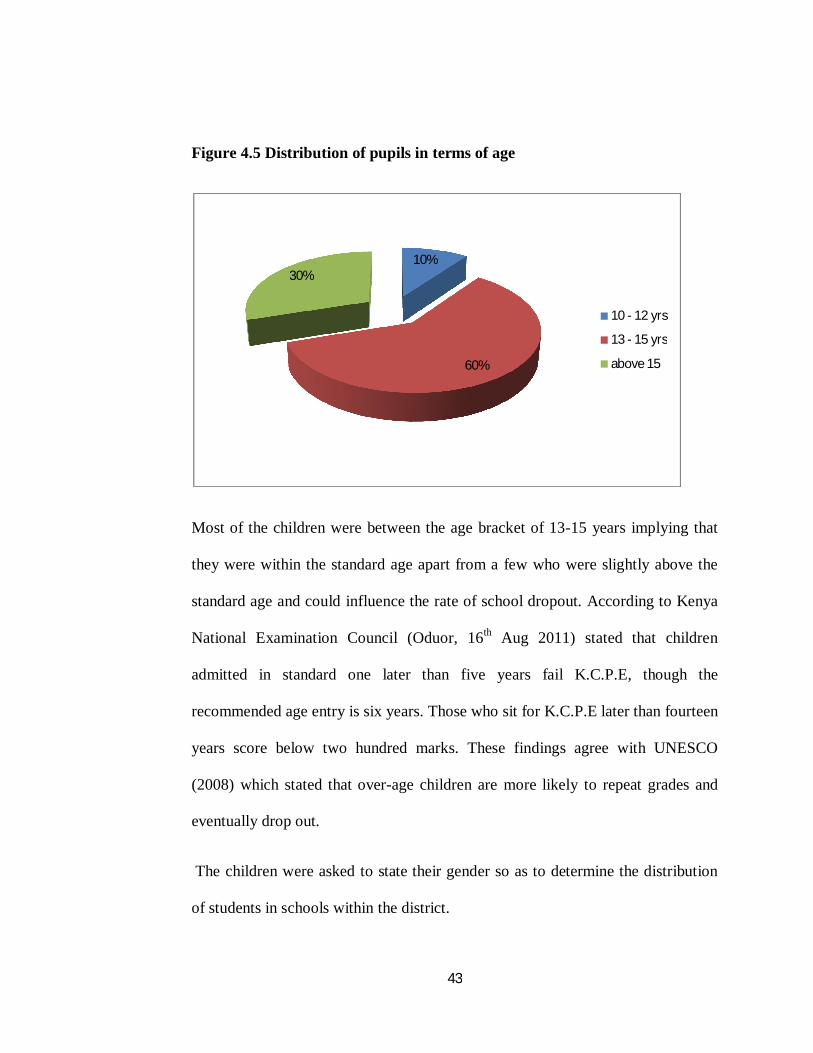
Figure 4.5 Distribution of pupils in terms of age
Most of the children were between the age bracket of 13-15 years implying that
they were within the standard age apart from a few who were slightly above the
standard age and could influence the rate of school dropout. According to Kenya
National Examination Council (Oduor, 16th Aug 2011) stated that children
admitted in standard one later than five years fail K.C.P.E, though the
recommended age entry is six years. Those who sit for K.C.P.E later than fourteen
years score below two hundred marks. These findings agree with UNESCO
(2008) which stated that over-age children are more likely to repeat grades and
eventually drop out.
The children were asked to state their gender so as to determine the distribution
of students in schools within the district.
10%
60%
30%
10 - 12 yrs
13 - 15 yrs
above 15

44
Figure 4.6 pupils’ distribution in terms of gender.
There was gender balance in terms of pupils indicating that the community
supported both boys and girls equally to access educational opportunities. A clear
indication that gender parity is practiced in the district in line with the MDGs.
The children were asked to indicate the type of parent they live with; this would
show the type of families, school absentees and dropouts came from. Their
responses were recorded in Table 4.6.
50%50%male
female
45
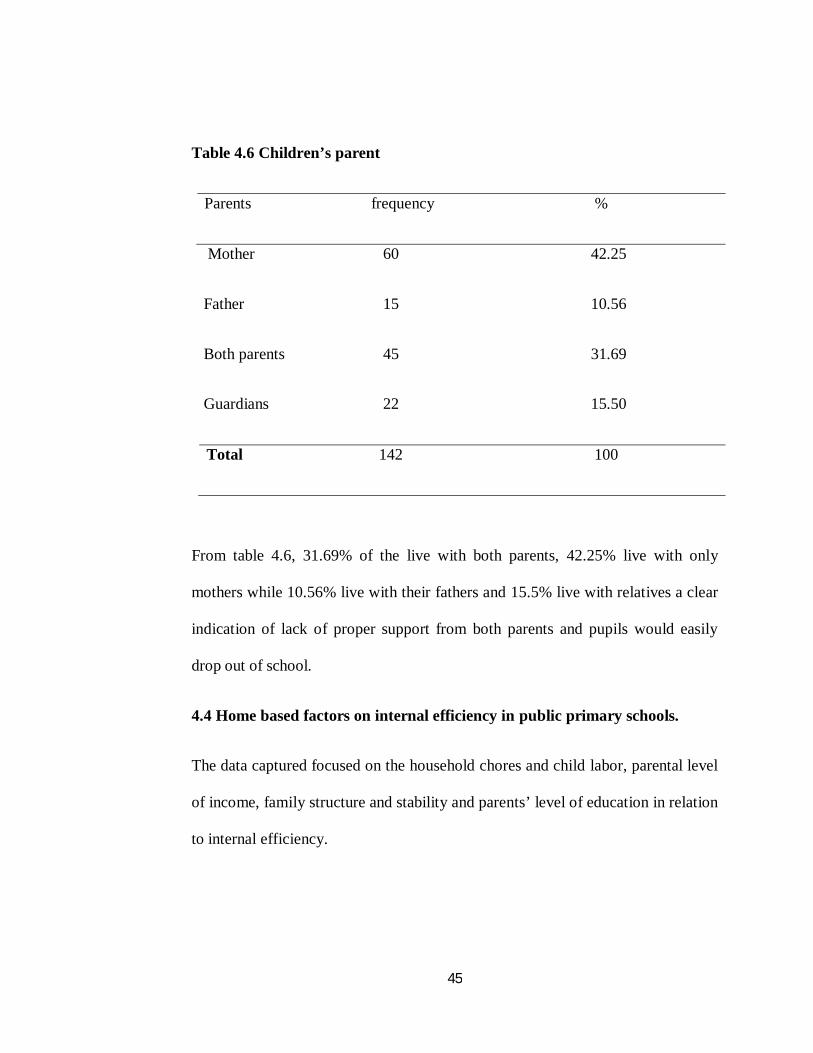
Table 4.6 Children’s parent
Parents frequency %
Mother 60 42.25
Father 15 10.56
Both parents 45 31.69
Guardians 22 15.50
Total 142 100
From table 4.6, 31.69% of the live with both parents, 42.25% live with only
mothers while 10.56% live with their fathers and 15.5% live with relatives a clear
indication of lack of proper support from both parents and pupils would easily
drop out of school.
4.4 Home based factors on internal efficiency in public primary schools.
The data captured focused on the household chores and child labor, parental level
of income, family structure and stability and parents’ level of education in relation
to internal efficiency.
46
4.4.1 The influence of household chores and child labor on performance in
primary examinations.
Parents with low levels of education were found to engage their children in
household chores which compromised their academic performance. The pupils
were asked to indicate whether they participated in household chores at home or
any work for pay. This aimed at establishing whether house hold chores and child
labor affect their performance in examinations in primary schools in Gucha
district. The results are as in figure 4.7
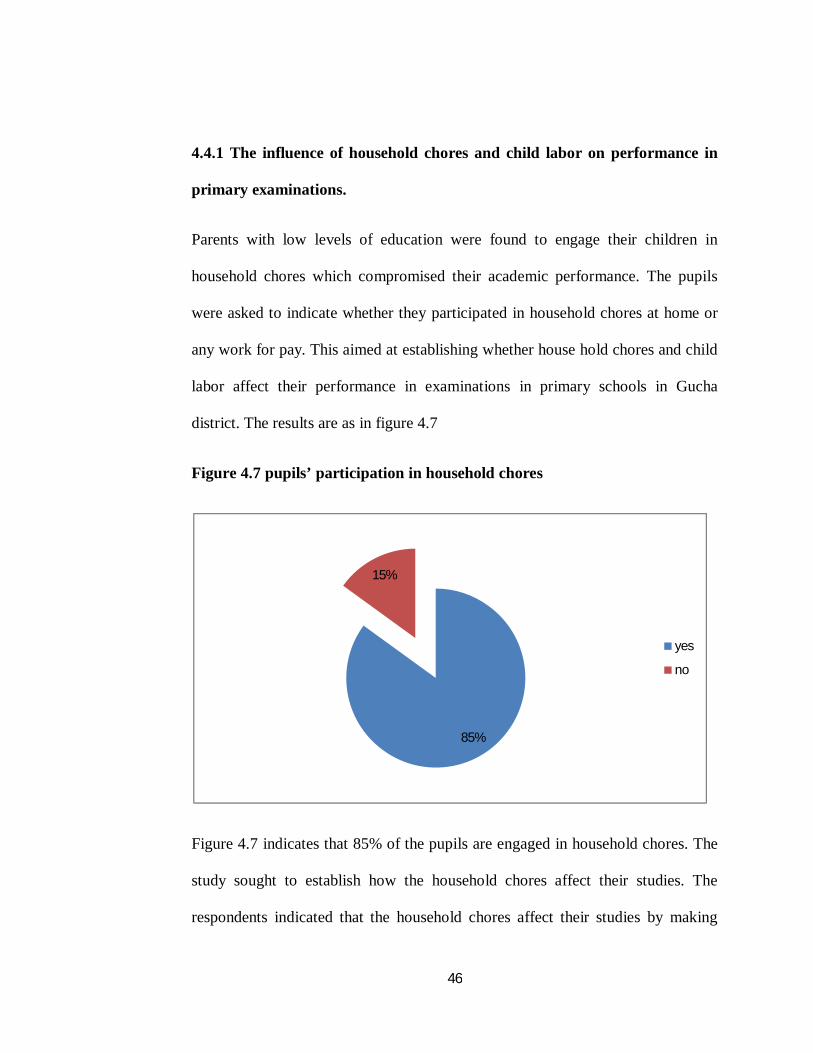
Figure 4.7 pupils’ participation in household chores
Figure 4.7 indicates that 85% of the pupils are engaged in household chores. The
study sought to establish how the household chores affect their studies. The
respondents indicated that the household chores affect their studies by making
85%
15%
yes
no
47
them absent from school (48%), making them not to concentrate when doing
private studies at home (30%) and making them have no time to do private
studies at home (22%). Abagi and Odipo (2007) observed that as poverty levels
rise, child labor becomes crucial for family survival. Household chores often
affect pupils’ opportunities to learn by taking away valuable time that they could
spend on their education (UNICEF 2007).
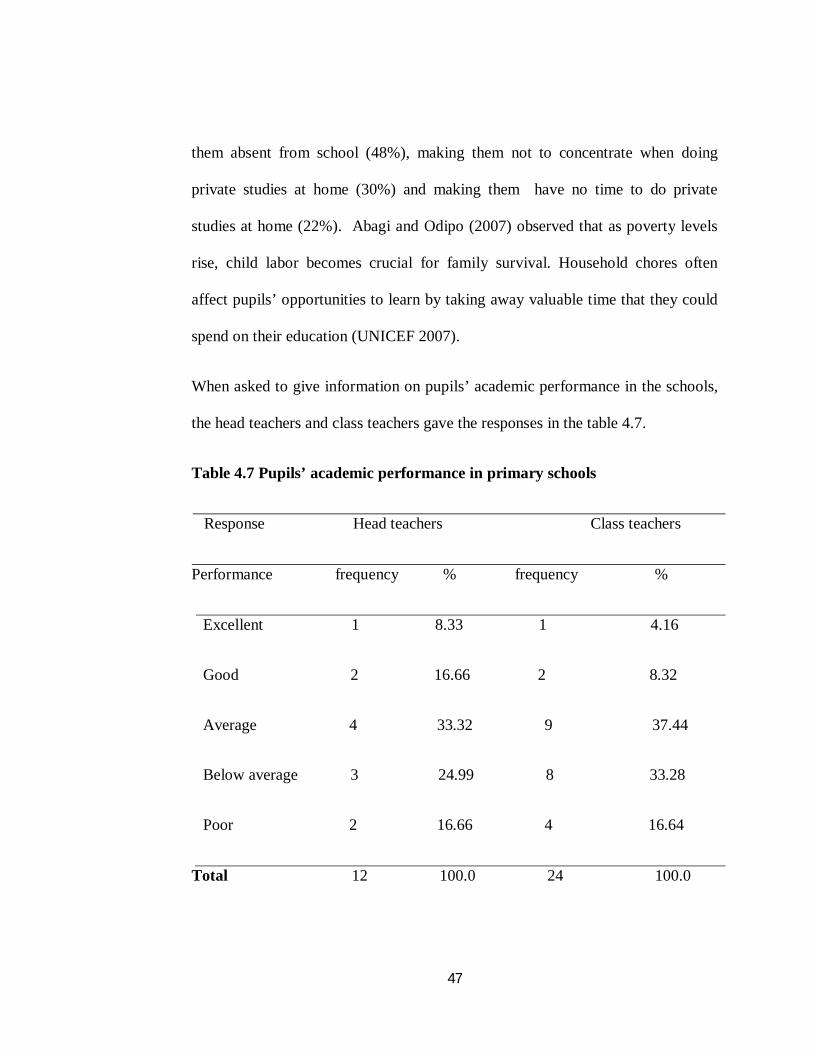
When asked to give information on pupils’ academic performance in the schools,
the head teachers and class teachers gave the responses in the table 4.7.
Table 4.7 Pupils’ academic performance in primary schools
Response Head teachers Class teachers
Performance frequency % frequency %
Excellent 1 8.33 1 4.16
Good 2 16.66 2 8.32
Average 4 33.32 9 37.44
Below average 3 24.99 8 33.28
Poor 2 16.66 4 16.64
Total 12 100.0 24 100.0
48
From Table 4.7 most of the schools perform averagely and below averagely at
33.32% and 24.99% respectively. The classes are equally performing averagely
and below averagely at 37.44% and 33.28% respectively. Overall, therefore, the
academic performance in the district is average, an indication that there is internal
inefficiency in public primary schools in Gucha district. These study results
mimics UNDP (2001) and Glennerster, (2011) who established that the
performance of pupils Kenya Certificate of Primary Education (K.C.P.E) has been
below average. Poverty levels in the district have forced many children to drop
out and because of many cases of absenteeism; the performance in national
examinations is below the average.
4.4.2. The influence of parents’ level of education on school completion rates.
Parents play an important role as models to their children’s lives, this triggered
the researcher to investigate how parents’ level of education influences pupils’
completion rate in public primary schools (objective 2 of the study). The
researcher asked the pupils to indicate their parents’ level of education and their
responses are tabulated in table 4.8.

49
Table 4.8 Pupils’ response on their fathers’ level of education
Response Frequency %
Never went to school 14 9.86
Primary 64 45.07
Secondary 38 26.76
College 18 12.68
University 4 2.82
No response 2 1.41
Total 142 100
Table 4.8 indicates that most of the pupils (45.07%) stated that their fathers were
primary school leavers. The findings are in line with Al – samarai and Peasgood
(1998) who argued that primary education of the head or spouse does increase the
chances of pupil’s school completion.
The researcher also requested the pupils to indicate their mothers’ level of
education. The findings are as in table 4.9.
50
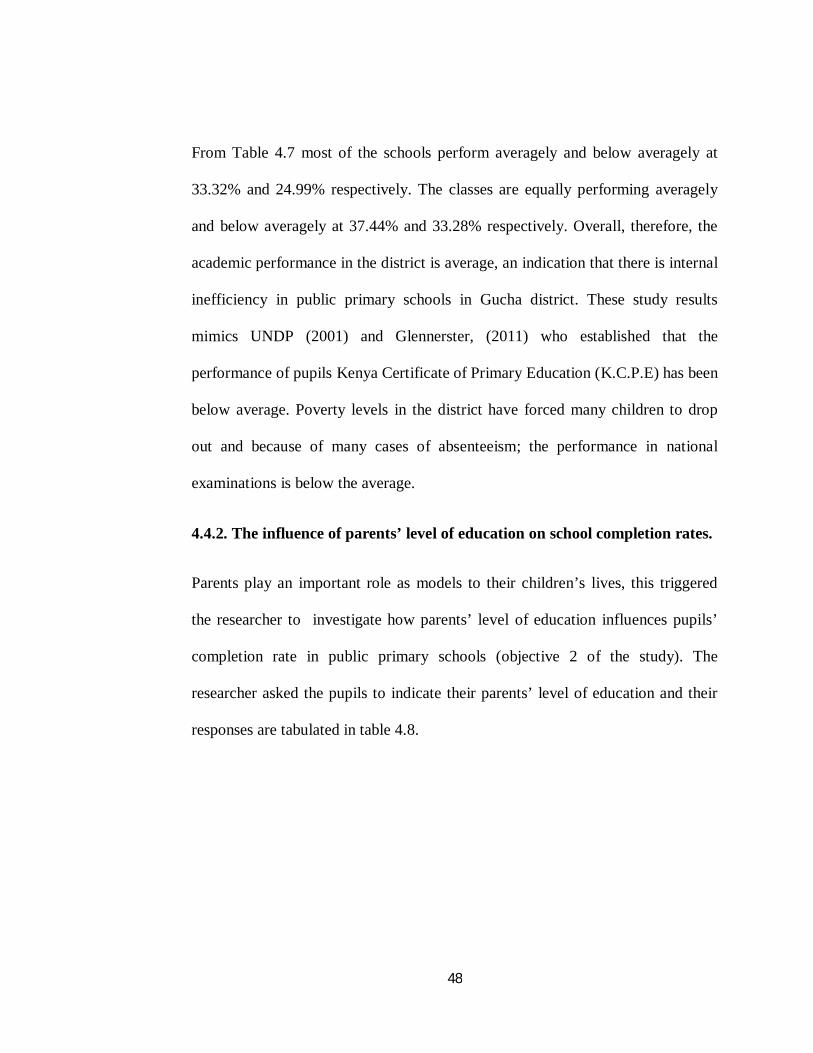
Table 4.9. Pupils’ response on their mothers’ level of education
Responses Frequency %
Never went to school 32 22.54
Primary 71 50.00
Secondary 26 18.31
Training college 4 2.82
University 2 1.41
No response 7 4.93
Total 142 100
Table 4.9 shows that half of the pupils (50%) indicated that their mothers were
primary school leavers. The findings are in line with the arguments of Hunter and
May (2003) that the parents’ level of education is associated with increased access
to education, higher attendance rates and low dropout rates.
Looking at Table 4.8 and Table 4.9, we realize that the majority of the parents’
relationship between the internal efficiency of the primary school education and
the education level of their mothers have had little or no education and may not be
able to help pupils’ complete primary education. This is because children tend to
51
imitate their parents especially mothers and so aspire to be highly educated as
their parents.
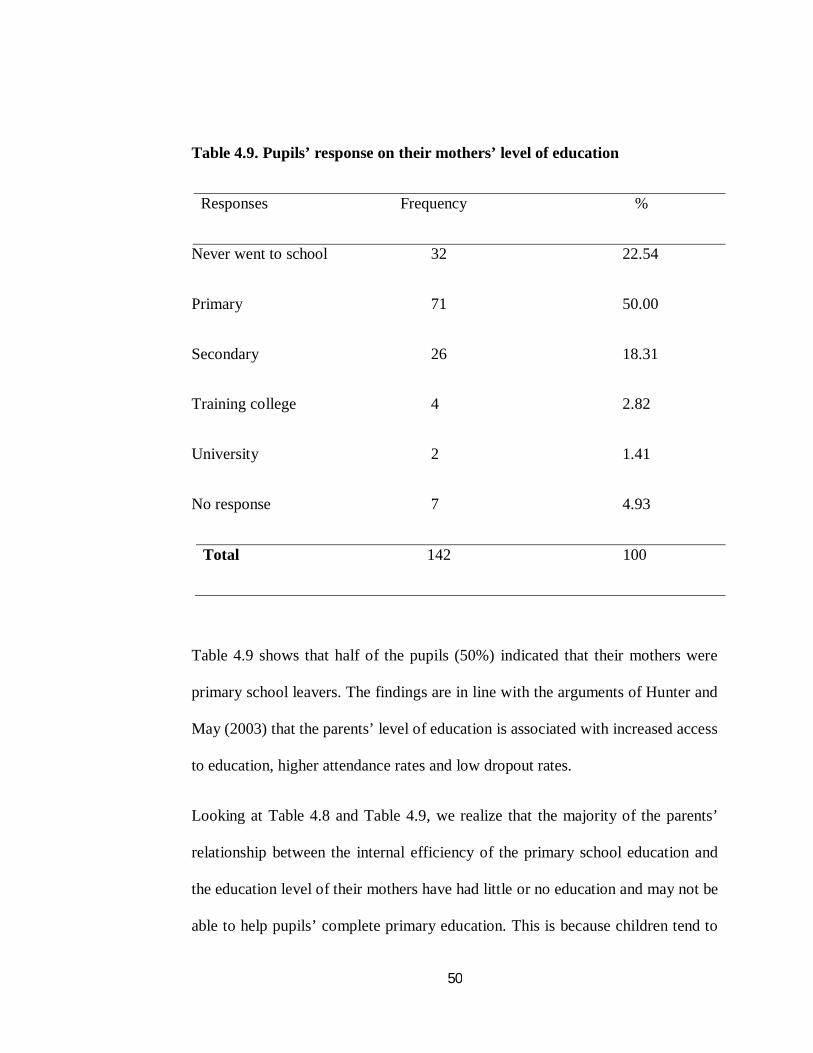
Pupils do not only need academic support in school but also at home. Therefore, it
is important they are assisted on areas they are weak in when doing their
homework. The researcher sought to identify if the parents/guardians assists their
children to do their homework. The findings are tabulated Table 4.10:
Table 4.10. Parents/guardians’ assistance on pupils homework
Responses frequency %
Agree 38 26.76
Disagree 104 73.24
Total 142 100
The majority of the pupils (73.24%) indicated that their parents/guardians did not
assist them with their homework. The findings are supported by Pryor and
Ampiah (2003) who argued that uneducated parents cannot provide support or
often do not appreciate the benefit of schooling. This concurs with the ministry of
education (2002) report which showed that parents with professional
qualifications ensure that children remain in school. Parents with low level of
education have negative attitudes towards education because they do not see
52
immediate benefits. Again they are not in a position to help their children in areas
in academic difficulties which discourage learners making them to drop out.
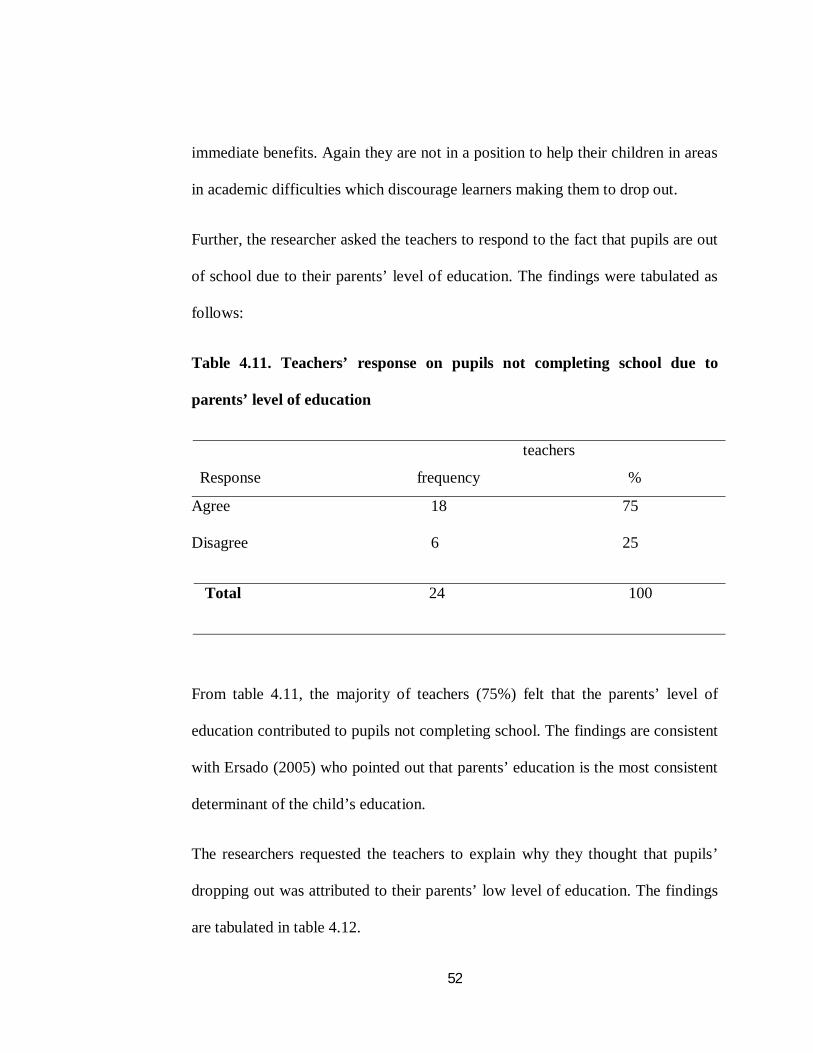
Further, the researcher asked the teachers to respond to the fact that pupils are out
of school due to their parents’ level of education. The findings were tabulated as
follows:
Table 4.11. Teachers’ response on pupils not completing school due to
parents’ level of education
teachers
Response frequency %
Agree 18 75
Disagree 6 25
Total 24 100
From table 4.11, the majority of teachers (75%) felt that the parents’ level of
education contributed to pupils not completing school. The findings are consistent
with Ersado (2005) who pointed out that parents’ education is the most consistent
determinant of the child’s education.
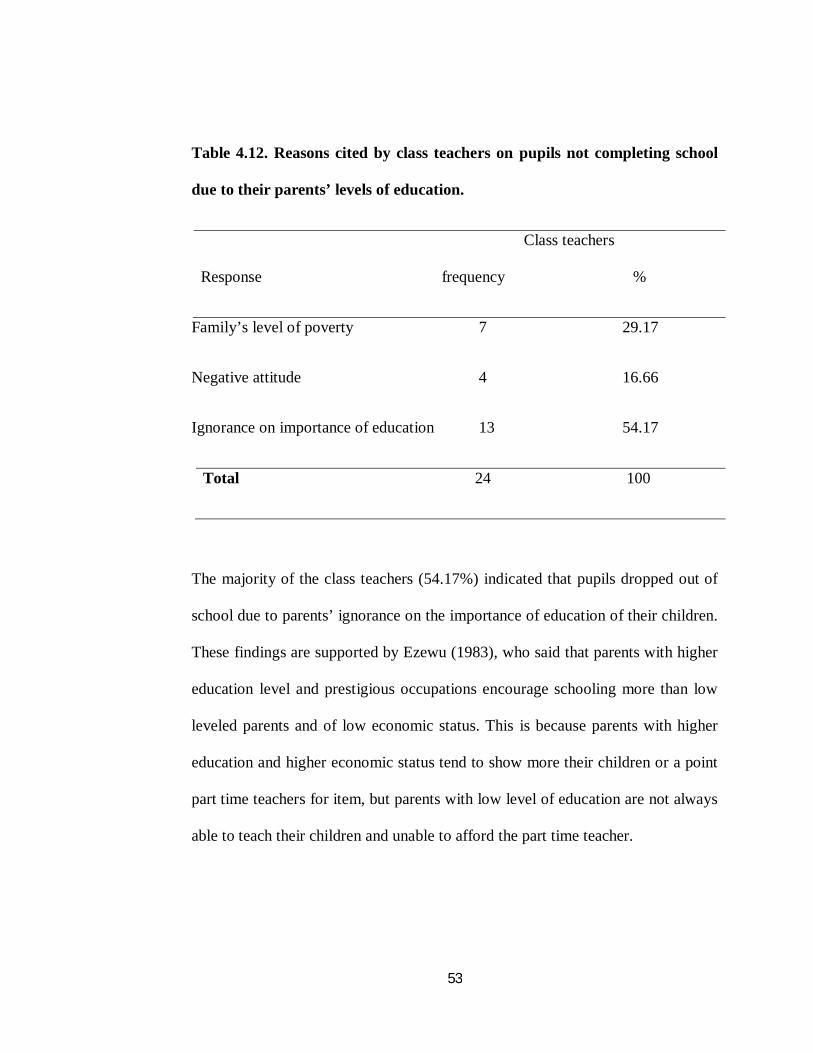
The researchers requested the teachers to explain why they thought that pupils’
dropping out was attributed to their parents’ low level of education. The findings
are tabulated in table 4.12.
53
Table 4.12. Reasons cited by class teachers on pupils not completing school
due to their parents’ levels of education.
Class teachers
Response frequency %
Family’s level of poverty 7 29.17
Negative attitude 4 16.66
Ignorance on importance of education 13 54.17
Total 24 100
The majority of the class teachers (54.17%) indicated that pupils dropped out of
school due to parents’ ignorance on the importance of education of their children.
These findings are supported by Ezewu (1983), who said that parents with higher
education level and prestigious occupations encourage schooling more than low
leveled parents and of low economic status. This is because parents with higher
education and higher economic status tend to show more their children or a point
part time teachers for item, but parents with low level of education are not always
able to teach their children and unable to afford the part time teacher.
54
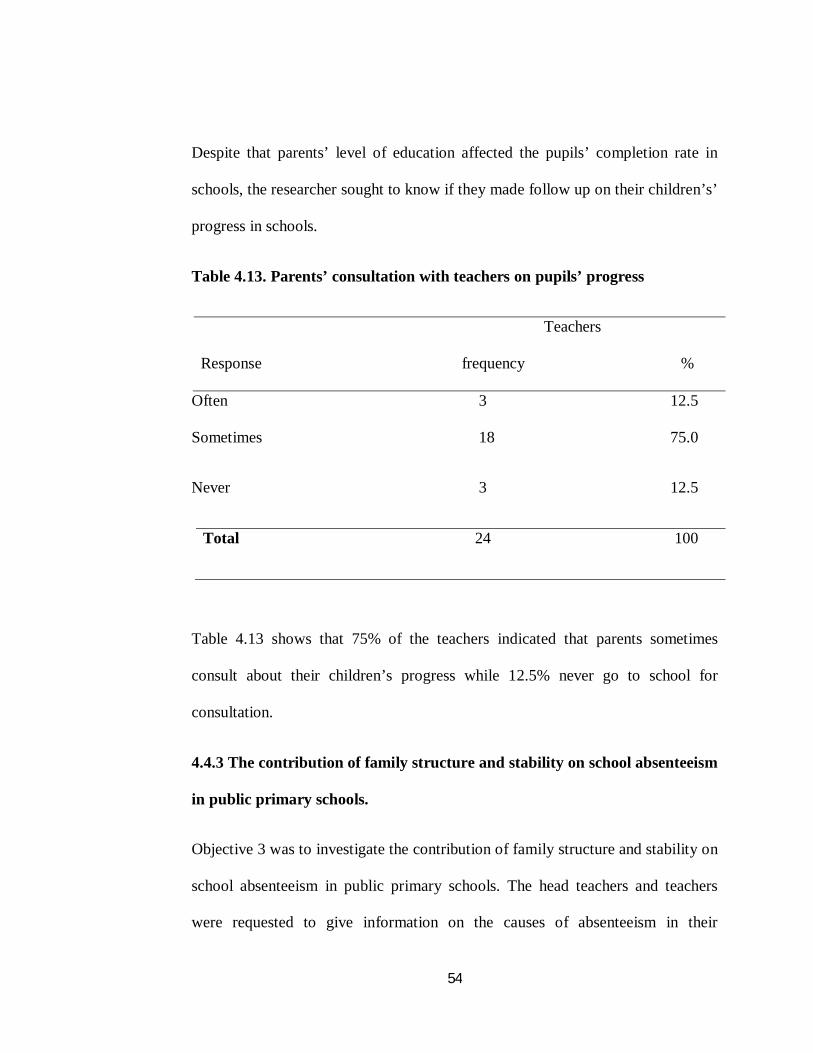
Despite that parents’ level of education affected the pupils’ completion rate in
schools, the researcher sought to know if they made follow up on their children’s’
progress in schools.
Table 4.13. Parents’ consultation with teachers on pupils’ progress
Teachers
Response frequency %
Often 3 12.5
Sometimes 18 75.0
Never 3 12.5
Total 24 100
Table 4.13 shows that 75% of the teachers indicated that parents sometimes
consult about their children’s progress while 12.5% never go to school for
consultation.
4.4.3 The contribution of family structure and stability on school absenteeism
in public primary schools.
Objective 3 was to investigate the contribution of family structure and stability on
school absenteeism in public primary schools. The head teachers and teachers
were requested to give information on the causes of absenteeism in their

55
institutions. 64% and 56% of the head teachers and teachers respectively said that
lack of strong family values was a contributing factor. In Gucha district 52.81%
are children raised by single parents while 15.5% by other people than their own
parents were the most affected by absenteeism. This made the researcher to
investigate the number of absentees per week and the results are indicated in
Table 4.14.
Table 4.14. Number of absentees per week per class
Absentees Frequency %
1 – 2 7 32
3 – 4 12 54
5 – 7 3 14
Total 22 100
The information in Table 4.14 shows that absenteeism is experienced in all
classes with 3 – 4 being the highest number of absentees at 54%. According to
Chiuri and Kiumi (2005), absenteeism affects examinations. Thus, the cases of
absenteeism point to internal inefficiency in education in Gucha district.
The respondents were also requested to give information on whether there were
cases of repeaters. The respondents were requested to give information about
56
repeaters with a view to establish the extent to which internal efficiency is
compromised by repetitions. Twenty teachers reported to have repeaters in their
classes which constituted 83.33%. The students were requested to give the
number of children in their family aged 6 – 13 years and who among them were in
primary school. This was in order to ascertain whether there were children who
were supposed to have been enrolled in school and were not. From the responses,
the total number of children aged 6 – 13 years was 376. The students were also
requested to indicate the number that was in primary school. The sum total given
was 308 which showed that 18.08% of school age going children was not enrolled
in school. This indicated that in Gucha District, there was a group of school going
age children which either did not have access to primary school education or they
had dropped out of school. This agrees with Sabates (2010) who said that many
children especially from low income and unstable families are either not enrolled
in school or dropped out.
4.4.4 Influence of parents’ level of income on school dropouts and excess to
primary education
From the findings of the study, it was clear that public primary schools in Gucha
district were experiencing internal inefficiency. This was seen by high rates of
dropouts which prompted the researcher to find out the poverty levels of parents
which influenced dropouts in the district. To achieve this, pupils were requested
to indicate the number of siblings in their family, parents’ financial status,

57
parents’ occupation and the extent to which parental status influence drop out of
pupils.
Figure 4.8 Number of siblings
The respondents were required to indicate the number of brothers and sisters they
had. This was important since schools entail monitory costs such as uniform and
learning material and depending on the number of children that parents have;
majority of them ranged from 4-7 children per every house hold indicating that
most of the children who attend public primary school come from poor family
backgrounds. The data revealed that family size may have an effect on the number
of pupils participating in primary education. According to Amayo (1997), large
family size categorizes in to low participation among students in education.
The pupils were asked to indicate the level at which they placed their parents’
financial status in terms of whether they are able to provide for the basic needs.
14.08%
35%
50%
1-2 children
3-4 children
5-7 children
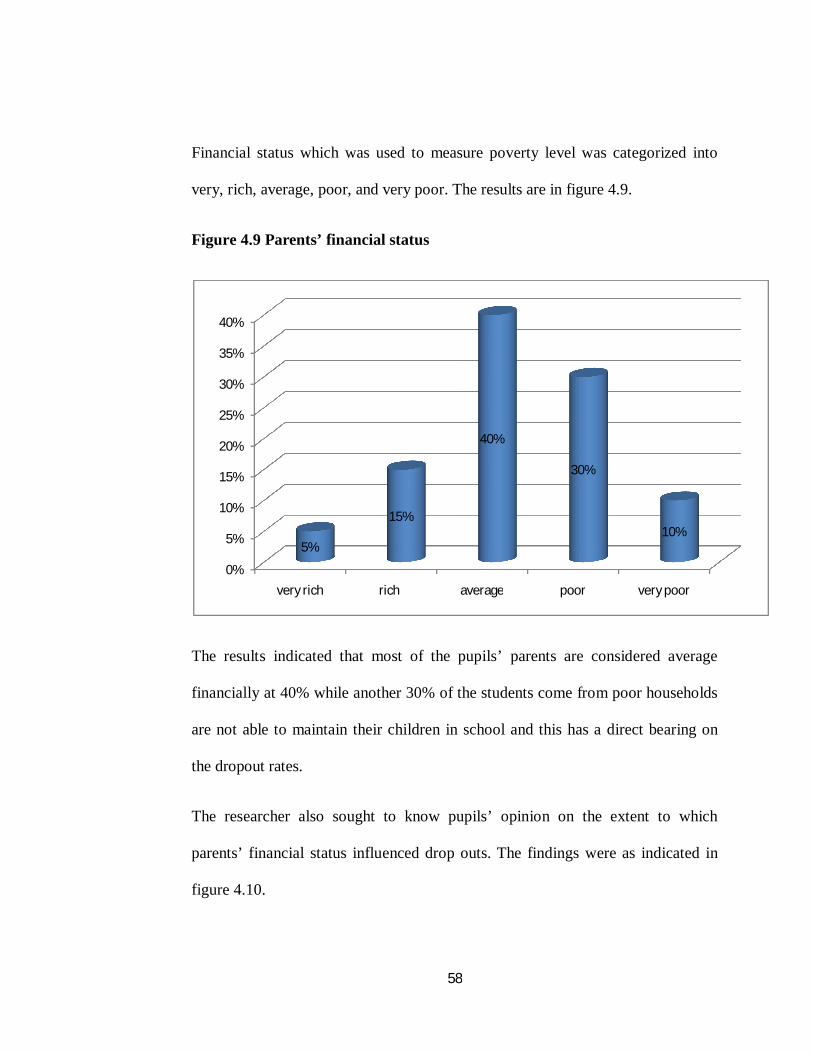
58
Financial status which was used to measure poverty level was categorized into
very, rich, average, poor, and very poor. The results are in figure 4.9.
Figure 4.9 Parents’ financial status
The results indicated that most of the pupils’ parents are considered average
financially at 40% while another 30% of the students come from poor households
are not able to maintain their children in school and this has a direct bearing on
the dropout rates.
The researcher also sought to know pupils’ opinion on the extent to which
parents’ financial status influenced drop outs. The findings were as indicated in
figure 4.10.
0%
5%
10%
15%
20%
25%
30%
35%
40%
very rich rich average poor very poor
5%
15%
40%
30%
10%
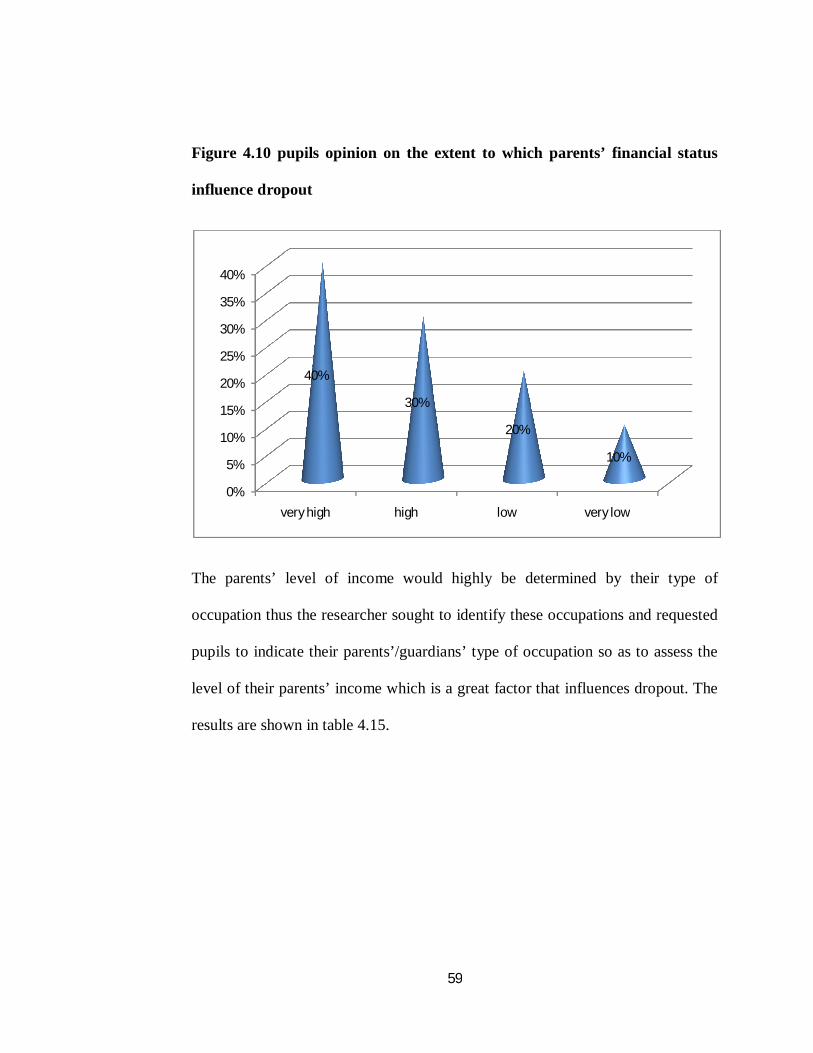
59
Figure 4.10 pupils opinion on the extent to which parents’ financial status
influence dropout
The parents’ level of income would highly be determined by their type of
occupation thus the researcher sought to identify these occupations and requested
pupils to indicate their parents’/guardians’ type of occupation so as to assess the
level of their parents’ income which is a great factor that influences dropout. The
results are shown in table 4.15.
0%
5%
10%
15%
20%
25%
30%
35%
40%
very high high low very low
40%
30%
20%
10%
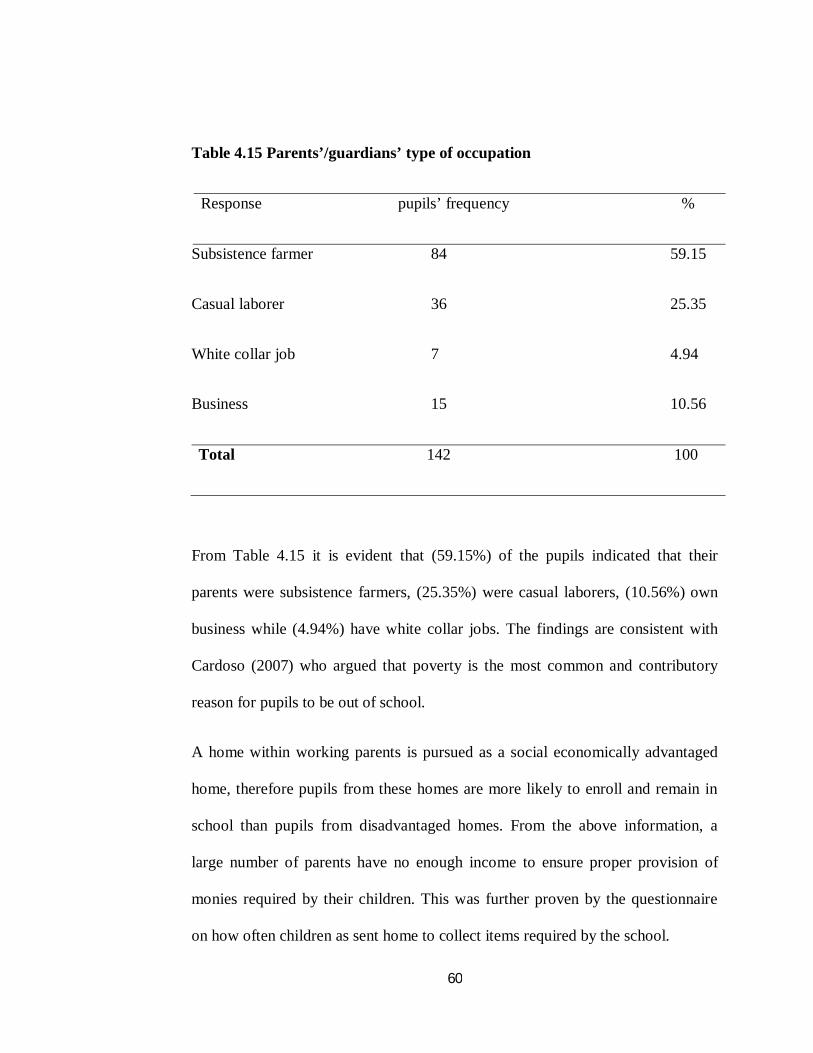
60
Table 4.15 Parents’/guardians’ type of occupation
Response pupils’ frequency %
Subsistence farmer 84 59.15
Casual laborer 36 25.35
White collar job 7 4.94
Business 15 10.56
Total 142 100
From Table 4.15 it is evident that (59.15%) of the pupils indicated that their
parents were subsistence farmers, (25.35%) were casual laborers, (10.56%) own
business while (4.94%) have white collar jobs. The findings are consistent with
Cardoso (2007) who argued that poverty is the most common and contributory
reason for pupils to be out of school.
A home within working parents is pursued as a social economically advantaged
home, therefore pupils from these homes are more likely to enroll and remain in
school than pupils from disadvantaged homes. From the above information, a
large number of parents have no enough income to ensure proper provision of
monies required by their children. This was further proven by the questionnaire
on how often children as sent home to collect items required by the school.
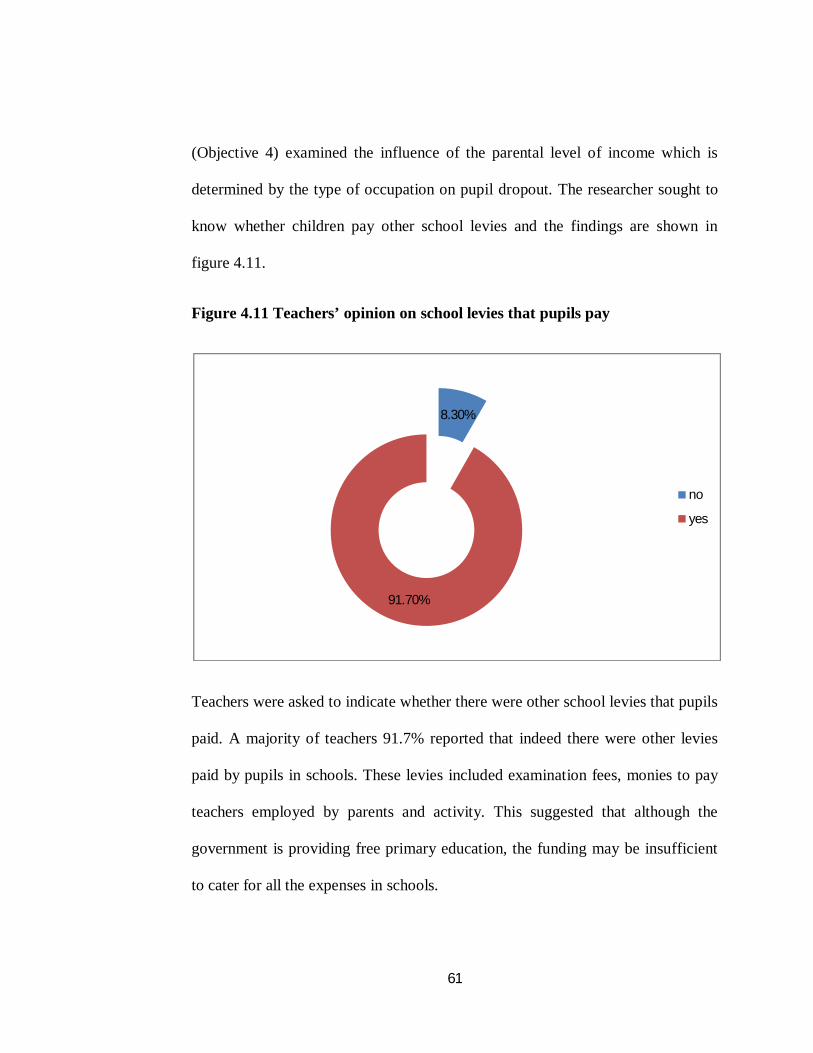
61
(Objective 4) examined the influence of the parental level of income which is
determined by the type of occupation on pupil dropout. The researcher sought to
know whether children pay other school levies and the findings are shown in
figure 4.11.
Figure 4.11 Teachers’ opinion on school levies that pupils pay
Teachers were asked to indicate whether there were other school levies that pupils
paid. A majority of teachers 91.7% reported that indeed there were other levies
paid by pupils in schools. These levies included examination fees, monies to pay
teachers employed by parents and activity. This suggested that although the
government is providing free primary education, the funding may be insufficient
to cater for all the expenses in schools.
8.30%
91.70%
no
yes
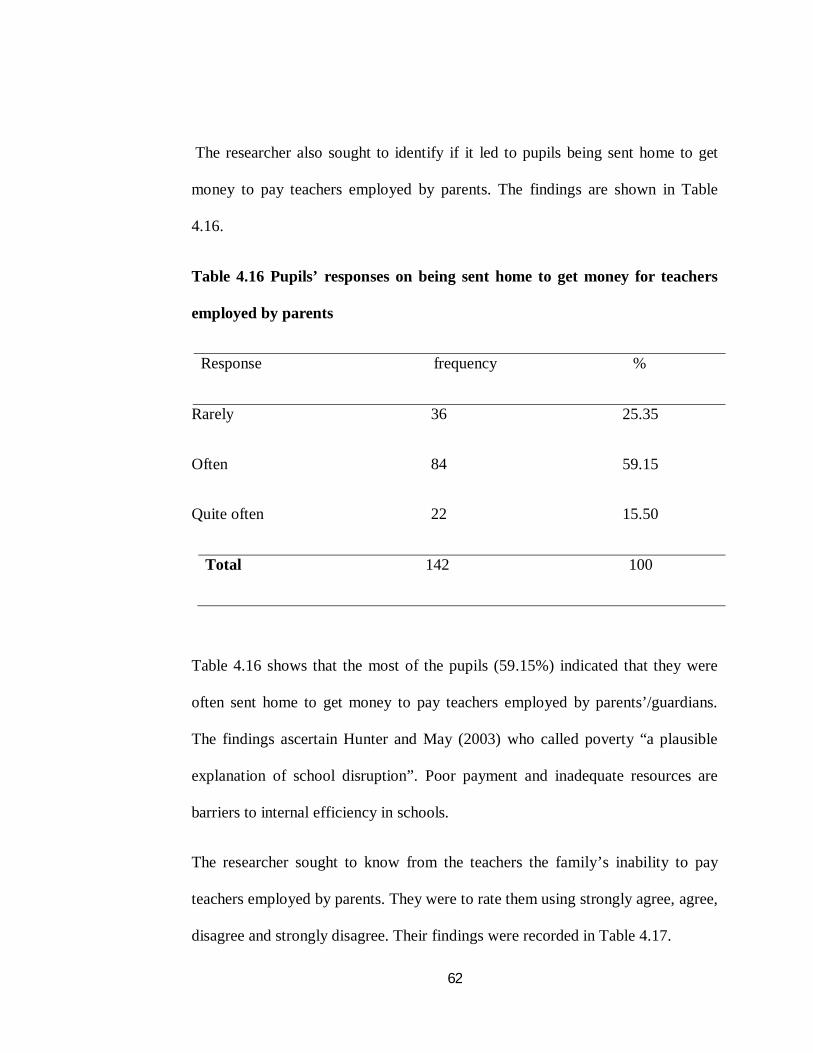
62
The researcher also sought to identify if it led to pupils being sent home to get
money to pay teachers employed by parents. The findings are shown in Table
4.16.
Table 4.16 Pupils’ responses on being sent home to get money for teachers
employed by parents
Response frequency %
Rarely 36 25.35
Often 84 59.15
Quite often 22 15.50
Total 142 100
Table 4.16 shows that the most of the pupils (59.15%) indicated that they were
often sent home to get money to pay teachers employed by parents’/guardians.
The findings ascertain Hunter and May (2003) who called poverty “a plausible
explanation of school disruption”. Poor payment and inadequate resources are
barriers to internal efficiency in schools.
The researcher sought to know from the teachers the family’s inability to pay
teachers employed by parents. They were to rate them using strongly agree, agree,
disagree and strongly disagree. Their findings were recorded in Table 4.17.
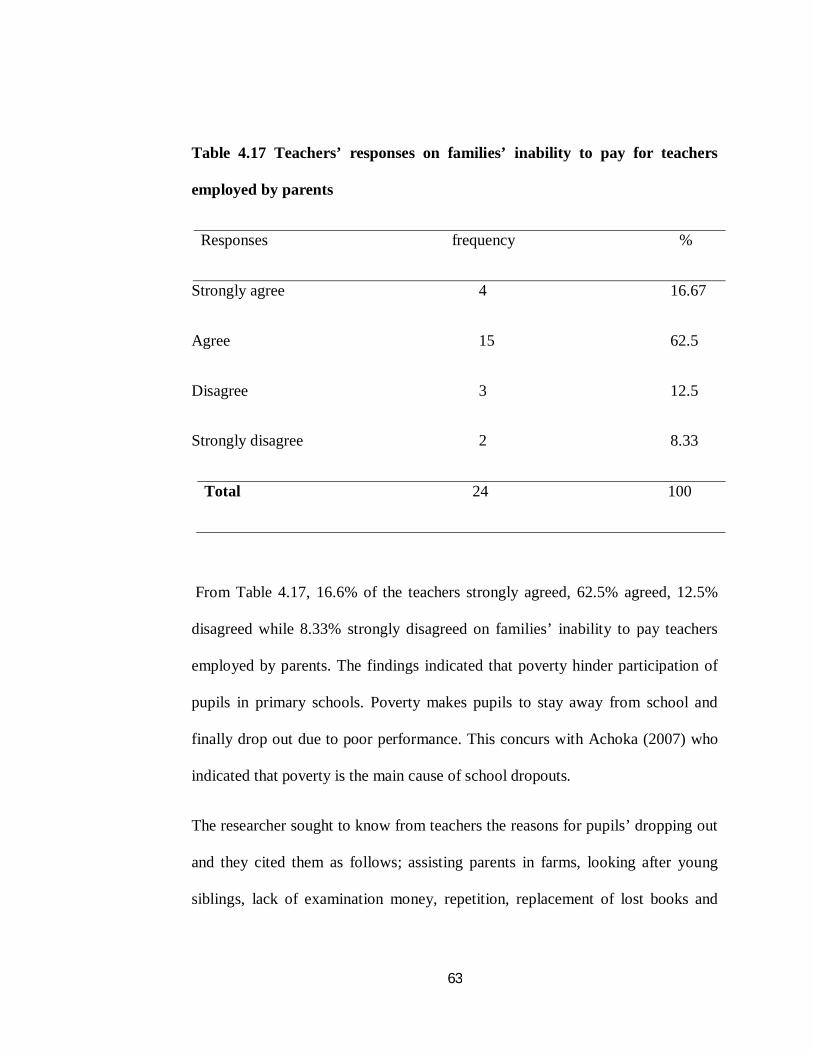
63
Table 4.17 Teachers’ responses on families’ inability to pay for teachers
employed by parents
Responses frequency %
Strongly agree 4 16.67
Agree 15 62.5
Disagree 3 12.5
Strongly disagree 2 8.33
Total 24 100
From Table 4.17, 16.6% of the teachers strongly agreed, 62.5% agreed, 12.5%
disagreed while 8.33% strongly disagreed on families’ inability to pay teachers
employed by parents. The findings indicated that poverty hinder participation of
pupils in primary schools. Poverty makes pupils to stay away from school and
finally drop out due to poor performance. This concurs with Achoka (2007) who
indicated that poverty is the main cause of school dropouts.
The researcher sought to know from teachers the reasons for pupils’ dropping out
and they cited them as follows; assisting parents in farms, looking after young
siblings, lack of examination money, repetition, replacement of lost books and
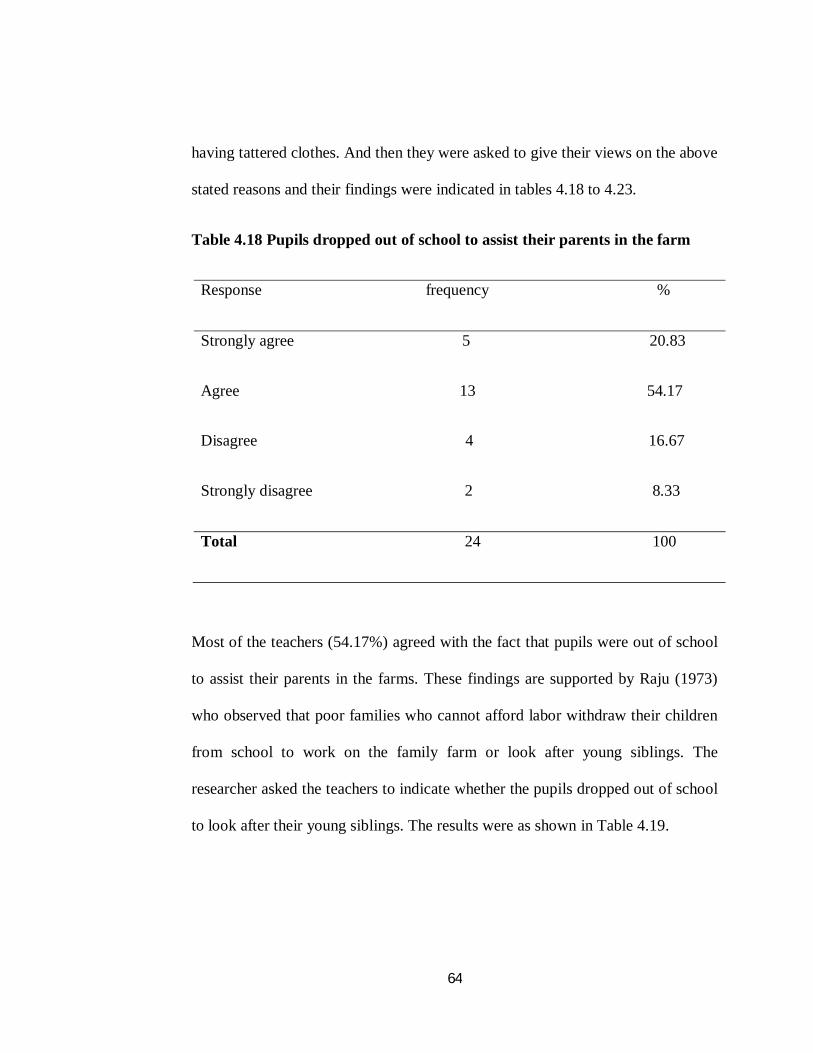
64
having tattered clothes. And then they were asked to give their views on the above
stated reasons and their findings were indicated in tables 4.18 to 4.23.
Table 4.18 Pupils dropped out of school to assist their parents in the farm
Response frequency %
Strongly agree 5 20.83
Agree 13 54.17
Disagree 4 16.67
Strongly disagree 2 8.33
Total 24 100
Most of the teachers (54.17%) agreed with the fact that pupils were out of school
to assist their parents in the farms. These findings are supported by Raju (1973)
who observed that poor families who cannot afford labor withdraw their children
from school to work on the family farm or look after young siblings. The
researcher asked the teachers to indicate whether the pupils dropped out of school
to look after their young siblings. The results were as shown in Table 4.19.
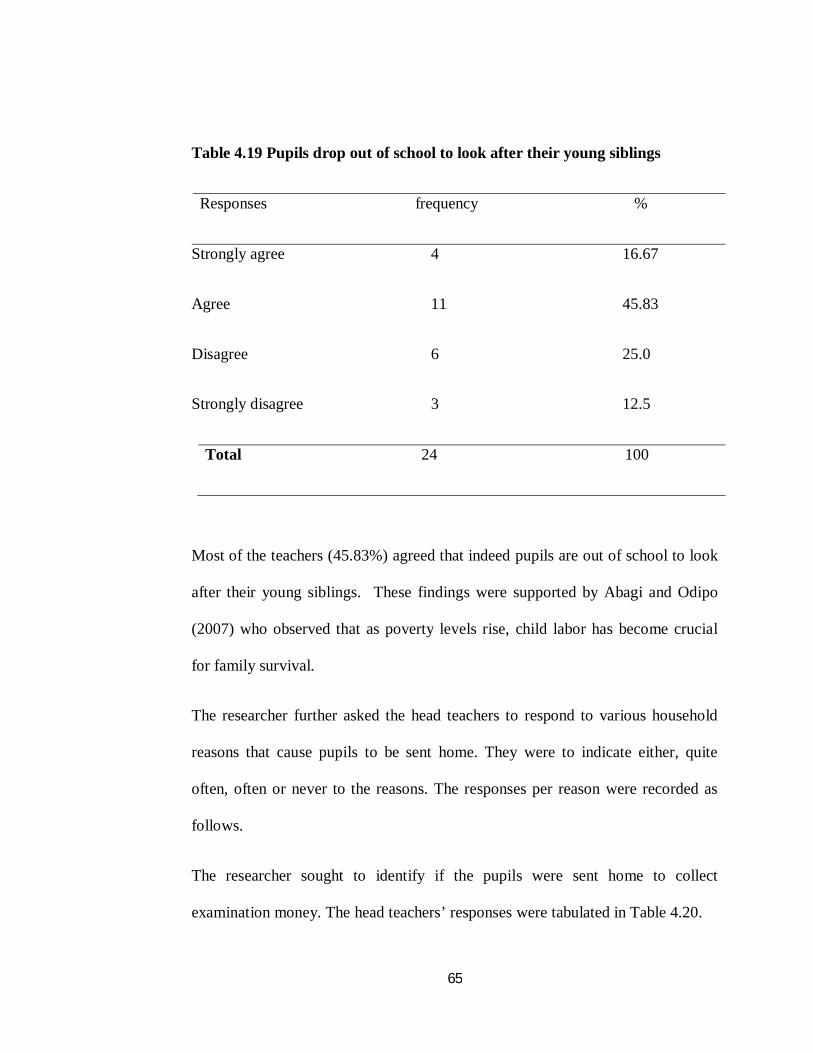
65
Table 4.19 Pupils drop out of school to look after their young siblings
Responses frequency %
Strongly agree 4 16.67
Agree 11 45.83
Disagree 6 25.0
Strongly disagree 3 12.5
Total 24 100
Most of the teachers (45.83%) agreed that indeed pupils are out of school to look
after their young siblings. These findings were supported by Abagi and Odipo
(2007) who observed that as poverty levels rise, child labor has become crucial
for family survival.
The researcher further asked the head teachers to respond to various household
reasons that cause pupils to be sent home. They were to indicate either, quite
often, often or never to the reasons. The responses per reason were recorded as
follows.
The researcher sought to identify if the pupils were sent home to collect
examination money. The head teachers’ responses were tabulated in Table 4.20.
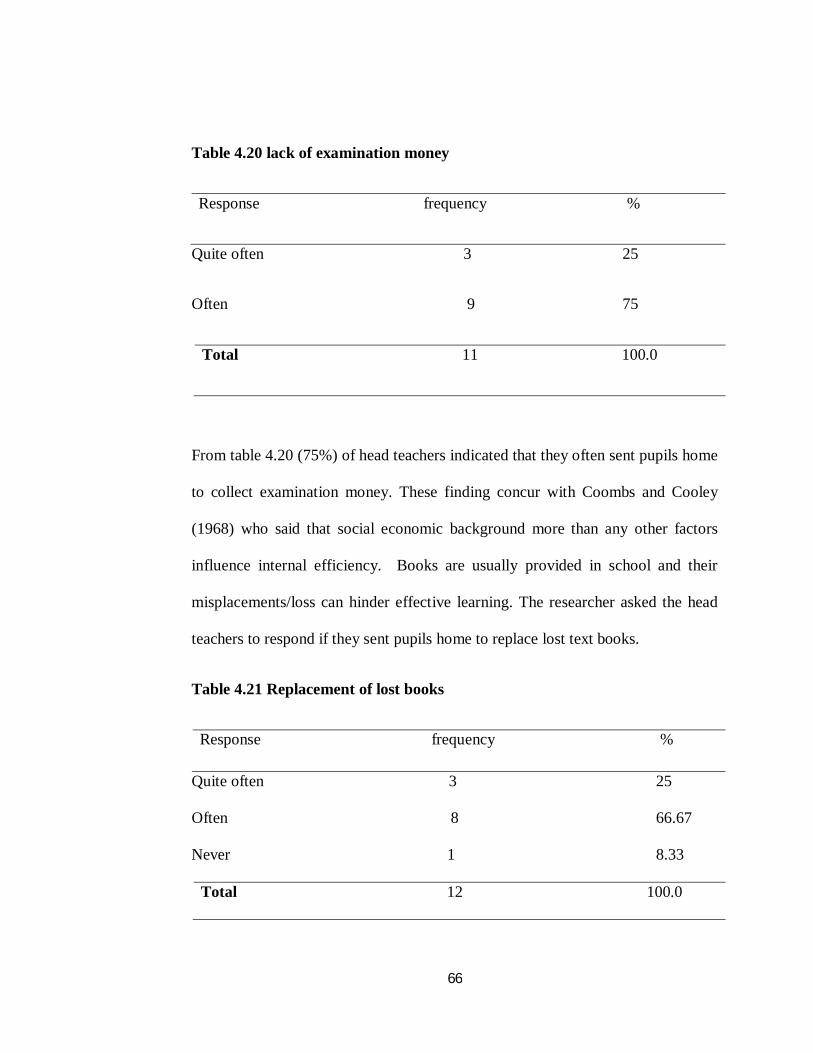
66
Table 4.20 lack of examination money
Response frequency %
Quite often 3 25
Often 9 75
Total 11 100.0
From table 4.20 (75%) of head teachers indicated that they often sent pupils home
to collect examination money. These finding concur with Coombs and Cooley
(1968) who said that social economic background more than any other factors
influence internal efficiency. Books are usually provided in school and their
misplacements/loss can hinder effective learning. The researcher asked the head
teachers to respond if they sent pupils home to replace lost text books.
Table 4.21 Replacement of lost books
Response frequency %
Quite often 3 25
Often 8 66.67
Never 1 8.33
Total 12 100.0
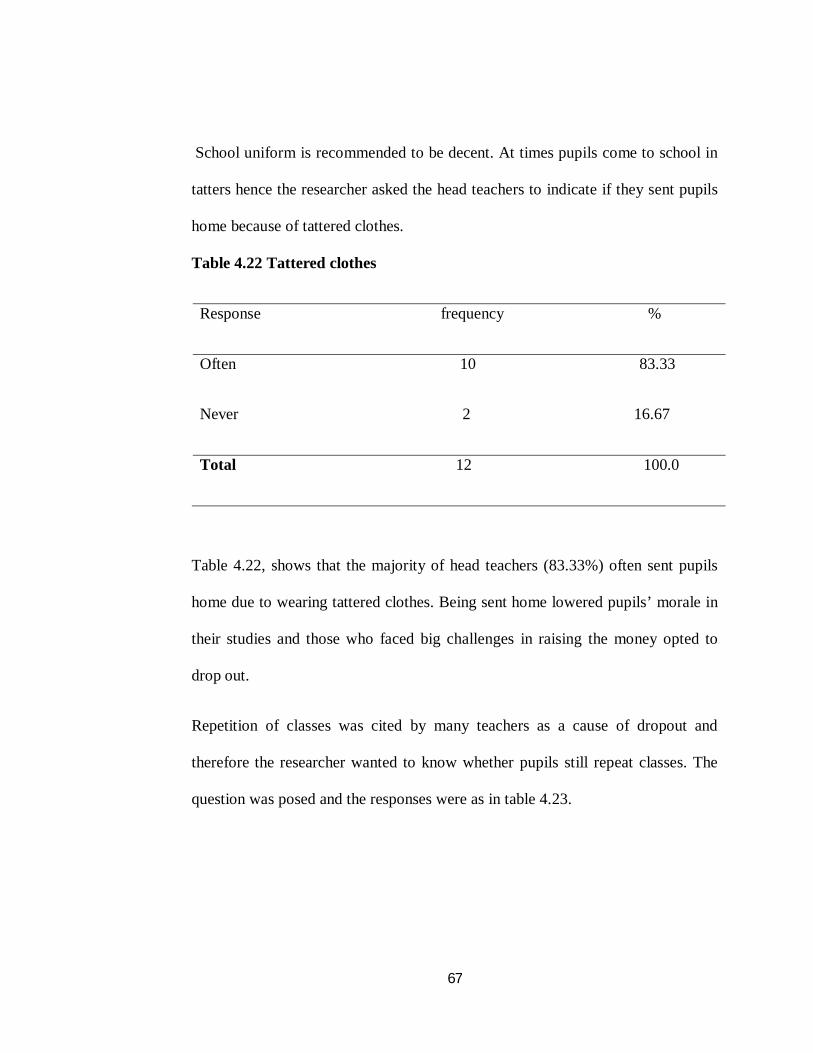
67
School uniform is recommended to be decent. At times pupils come to school in
tatters hence the researcher asked the head teachers to indicate if they sent pupils
home because of tattered clothes.
Table 4.22 Tattered clothes
Response frequency %
Often 10 83.33
Never 2 16.67
Total 12 100.0
Table 4.22, shows that the majority of head teachers (83.33%) often sent pupils
home due to wearing tattered clothes. Being sent home lowered pupils’ morale in
their studies and those who faced big challenges in raising the money opted to
drop out.
Repetition of classes was cited by many teachers as a cause of dropout and
therefore the researcher wanted to know whether pupils still repeat classes. The
question was posed and the responses were as in table 4.23.

68
Table 4.23 Repetition cases
Teachers pupils
Response frequency % frequency %
Agreed 20 83.33 104 73.24
Disagreed 4 16.67 38 26.76
Total 24 100.0 142 100.0
From Table 4.23 majority of the teachers 20 (83.33%) agreed to have repeaters in
their classes while 4 (16.67%) did not have repeaters. At the same time 104
(73.24%) of the pupils agreed to have repeated a class while 38 (26.76%) have
never repeated.
The findings are supported by NCES (2009) that reported that repetition is the
major cause of school dropout in all education systems that still practice it.
4.5 Measures taken to enhance efficiency
The researcher sought to know from the head teachers what should be done to
ensure high enrolment and completion rates in public primary schools and the
findings summarized in the figure below.
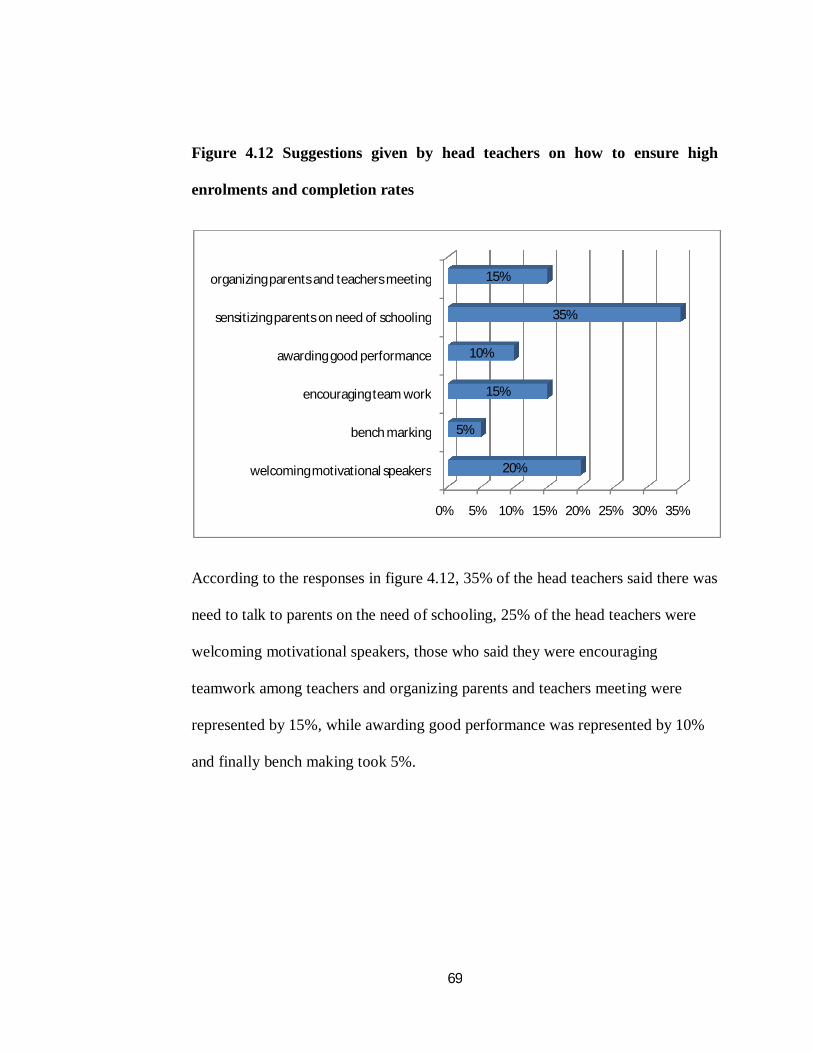
69
Figure 4.12 Suggestions given by head teachers on how to ensure high
enrolments and completion rates
According to the responses in figure 4.12, 35% of the head teachers said there was
need to talk to parents on the need of schooling, 25% of the head teachers were
welcoming motivational speakers, those who said they were encouraging
teamwork among teachers and organizing parents and teachers meeting were
represented by 15%, while awarding good performance was represented by 10%
and finally bench making took 5%.
0% 5% 10% 15% 20% 25% 30% 35%
welcoming motivational speakers
bench marking
encouraging team work
awarding good performance
sensitizing parents on need of schooling
organizing parents and teachers meeting
20%
5%
15%
10%
35%
15%
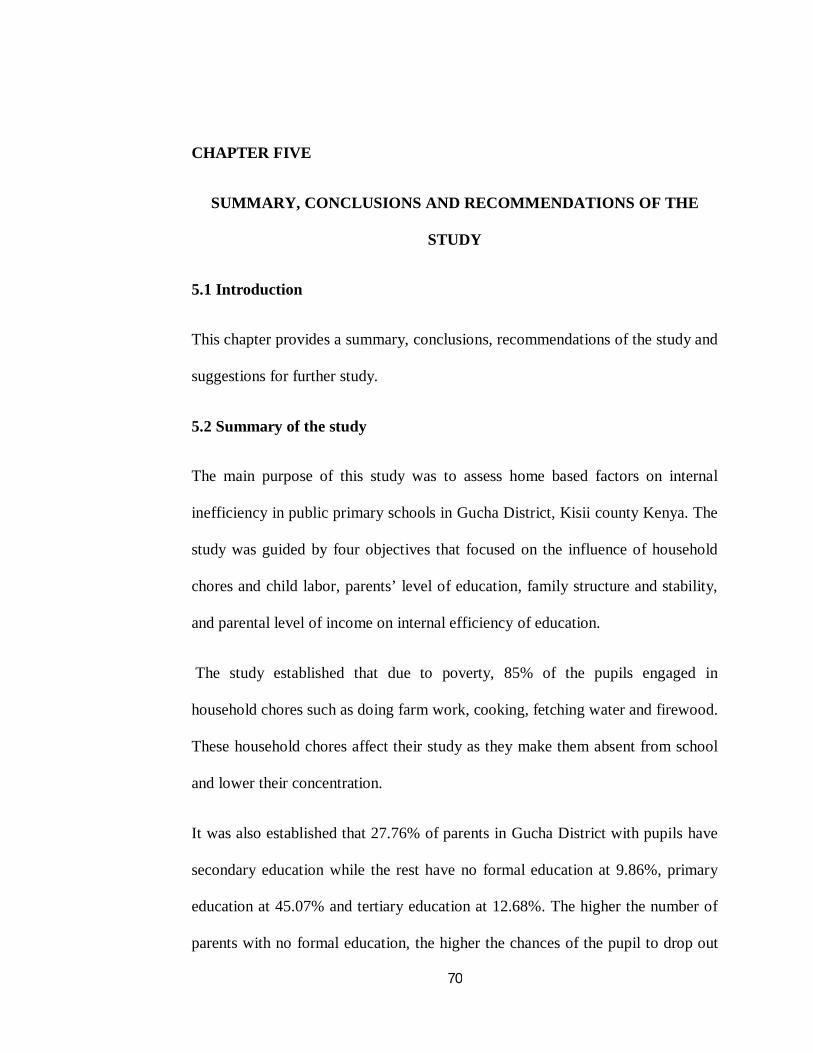
70
CHAPTER FIVE
SUMMARY, CONCLUSIONS AND RECOMMENDATIONS OF THE
STUDY
5.1 Introduction
This chapter provides a summary, conclusions, recommendations of the study and
suggestions for further study.
5.2 Summary of the study
The main purpose of this study was to assess home based factors on internal
inefficiency in public primary schools in Gucha District, Kisii county Kenya. The
study was guided by four objectives that focused on the influence of household
chores and child labor, parents’ level of education, family structure and stability,
and parental level of income on internal efficiency of education.
The study established that due to poverty, 85% of the pupils engaged in
household chores such as doing farm work, cooking, fetching water and firewood.
These household chores affect their study as they make them absent from school
and lower their concentration.
It was also established that 27.76% of parents in Gucha District with pupils have
secondary education while the rest have no formal education at 9.86%, primary
education at 45.07% and tertiary education at 12.68%. The higher the number of
parents with no formal education, the higher the chances of the pupil to drop out
71
of school and increased absenteeism hence low performance that affect internal
efficiency of education. Most of the schools perform averagely and below average
at 34% and 26% respectively while 16% of the schools perform poorly. This is an
indication that there is internal inefficiency in primary schools in Gucha District.
It was established that the majority of parents (59.15%) were subsistence farmers
and were not able to raise school levies causing children to be sent home regularly
to collect examination money, wearing tattered clothes, and money to pay
teachers employed by parents that eventually lead to dropout, thus affecting the
internal efficiency of schools.
The study found that 40% of the students view their parents’ financial status as
average while another 30% come from poor households. Pupils from low income
earning households reported higher cases of dropout, absenteeism, repetition
fueled by poverty thus fuelling internal inefficiency of educational institutions.
5.3 Conclusion
The foregoing discussion shows that there is internal inefficiency in public
primary schools in Gucha District. This is as demonstrated by prevalence of all
indicators of internal inefficiency in education such as high repetition rates, high
dropout rates and high absenteeism rates. The high repetition rates, dropout rates
and absenteeism in Gucha District are contributed to by high poverty rates of the
households hence minimizing the chances of student attending school because of
levies charged in schools.
72
The family structure has been known to be one of the factors that influence
inefficiency in schools because children from single parents households are
mainly poor hence making them unable to pay school levies. It can also be
concluded that, child labor and household chores affect internal efficiency
because pupils are forced to be out of schools to attend to household chores.
These factors are barriers to the realization of internal efficiency in primary
schools. It is therefore necessary to address these challenges so that this noble
idea of providing education for all retains its intended purpose which is to ensure
holistic development of human resources.
5.4 Recommendations
Based on the findings of the study, the following recommendations were made:
I. Since the level of parents’ education contributes to children’s completion
rates, there is need to sensitize the community on the importance of
education so that more parents can develop positive attitude towards
education and send their children to school.
II. Poverty alleviation measures should be established in the society so as to
enable more families to get higher income and therefore send their
children to school for the entire schooling period. There is also need to
help pupils from needy families through grants/bursaries.
73
III. The ministry of education to enforce close supervision and inspection of
primary schools in order to ensure that pupils do not repeat classes and to
allow them transit to their next classes regardless of their performance.
5.5 Suggestion for further studies
Based on the finding of the study, the researcher suggests the following studies to
be carried in order to complement this study:
1. A similar study should also be conducted in other districts of the
country so as to establish prevailing conditions in those parts with
a view of comparing with this study.
2. A similar study should be carried out in private primary schools
given that private schools were on the increase and therefore
internal efficiency in these schools should be scrutinized.
3. A similar study should be conducted incorporating parents, SMC
members since they were determinants of a school’s internal
efficiency.

74
REFERENCES
Abagi, J.O (2007) Status of education in Kenya: indicators for planning and policy formation Nairobi, institute of policy Analysis and Research .
Achoka,I.(2007). Access to basic education in Kenya: Inherent concerns. Educational research and review 2(10), 275-284. Retrieved November 14, 2008 from http://www.academic/journals.org/ERR
Aggarwal,J.C.(1992). Theory and principles of education: philosophical and sociological bases of education: Vikas publishing house PVT ltd.
Ainsworth, M; Beegle, K; and Koda, G. (2005). The impact of adult mortality and parent deaths on primary schooling in North-western Tanzania. The journal of development studies
Bali, S. K. (1997). A comparative study of antecedents of gender specific school wastage rates in Kenya. Nairobi, academy & science publishers; Kenya.
Bavaro, B. (ed), (2008). California dropout. Research project policy brief, No. 15. California.University of California.
Best, J. and Khan, (2006). Research in Education. New Delhi India. Dorling pvt ltd Kindersly.
Blaug , M.(1970). An introduction to economics of education. London; penguin press
Bray,M.(2001). Government and household financing of education: finding appropriate balances. A paper presented to the international conference on economics of education. (May 16th -19th) at Beijing university; Beijing
75
Bruneforth, M.(2006). Characteristics of children whom drop out of school and comments on the drop-out population compared o the population out-of school children. Background paper for the EFA Global Monitoring Report 2007
Cardoso, A. R. & Verner, D. (2007). School dropout and push out factors in Brazil. The role of earlier parenthood, child labor and poverty. IZA. Discussion paper No. 2515.
Center for research and development (2004).Monitoring of the free primary education and establishing the unit costs of primary education in kenya.Nairobi.
Chimombo, J.P.G. (2005). Issues in basic educations in developing countries: an exploration of policy options for improved delivery. Journal of international co-operation in education. vol 8
Chiuri, W. & Kirimi, K. (2005). Planning and economics of education. Njoro, Pangolin publishers.
Colcough,C and Al-samarrai, S. (2003). Achieving schooling for all in africa: costs, commitment and gender. Bullington: cash gate publishing house.
Coombs,A.N. (1968). The world education crisis system analysis. New York. OUP
Ersado,L.(2005). Child labor and schooling decisions in urban and rural areas: comparative evidence from Nepal, Peru and Zimbambwe.washington D.C. USA. World bank.
Global Monitoring report (2010): Reaching the marginalized; education marginalization in Northern Kenya; Paris France UNESCO
76
Hunter, N. & May, J. (2003). Poverty shocks and school disruptions Episodes among adolescents in south Africa. CSDS working paper No. 35
Jaffe, P., Willison, S., & Wolfe, D. (1990). Children of battered women. Newbury Park, CA. sage publications.
Kadenyi,M.M & Kamunyu,M.E.(2006). Challenges facing women in tertiary institutions: a case of Eldoret Municipality. The educator.
KIPPRA (2004). Education and child labour. Policy brief No. 7 October
Kiriikua,H.T.(2010). Effects of miraa farming on pupils’ participation in primary schools in kienyu Division, Kenya. Unpublished M.E.D thesis. University of Nairobi
Kivuva J. (2006). A study of factors influencing enrolment and completion Rates in public primary schools in Machakos district. Unpublished MED project. University of Nairobi.
Maani,B.F. (2009). Factors affecting academic performance. Unpublished dissertation, Makerere University, Kampala, Uganda.
Maicibi,N.A. (2005). Pertinent issues in management: Human Resource and educational management .Net Media publishers LTD.
Mbiti, D. M. (2007). Foundations of school administration; Nairobi, oxford university press.
Mbwesa, J.K (2006). Introduction to management research. A student handbook Nairobi, Basic Modern Management Consultants
Moyi, P. (2011). Child labor and school attendance in Kenya. Educational Research and reviews vol 6.
77
Mugenda, O.M.,Mugenda.G.A.(2003).researchmethods.qualitaiveandquantitative
approaches.(Rev.Ed) Nairobi.african center for technology. Studies press
Mukudi, E. (2004). Education for All: A framework for addressing the persisting illusion for Kenyan context: international journal of educational development.
Mutuma,W.M.(2005). A study into the factors influencing enrolment and completion rates in public secondary schools in Meru north district, Kenya. Unpublished M.E.D thesis. University of Nairobi.
Namunga,N.W.(2005). Effects of FPE on pupils’ participation in primary schools in Bumula Division, Bungoma District. Unpublished M.E.D thesis. University of Nairobi.
Nduku,M.M.(2003). A study of factors influencing enrolment and grade repletion rates in public primary schools in Yatta Division in Machakos District. Unpublished M.E.D thesis. University of Nairobi.
Orodho, J.A. (2009). Elements of education and social science research methods. Masola publishers, Nairobi, Kenya.
Psacharopoulos, G and Patrinos, H.A (2002). Reuturns to investment in education. further update. the world bank policy research working paper. Vol (2881)
Pryor, J and Ampiah, J.G. (2003). Understanding education in an African Village: The impact of information and communication technologies.
Raja , K.J, and Burret,N.(2004). user fees in primary education. Washington DC; Human development network
Raju,B.(1973). Education in Kenya: problems and perspectives in educational planning and administration. London. Heinemann.

78
Republic of Kenya, (2002). National development plan 2002-2008. Effective management for sustainable Economic Growth and Poverty Reduction. Nairobi: government printer.
Republic of Kenya (2005), sessional paper no.1, 2005 Nairobi: Government printers
Sabates,R.;Akyeampong,K.;Westbrook,J.;Hunt.F.;(2010). school dropouts: patterns, causes, changes and policies. Univbersity of Sussex: Centre for International Education School of Education and Social Work.
Schultz,T.W(2006), Education and Economic growth, social forces influencing American Education, society for the study of Education Chicago National, , University of Chicago
UNICEF (2004). The state of the world’s children 2004. For every child, health, education, equality, protection. Advanced humanity.
World bank (2001). Attacking poverty. The international bank for reconstruction and development. World bank development report
World Bank (2004).global monitoring report, policies and actions for achieving the millennium development goals and related outcomes. International bank for reconstruction and development
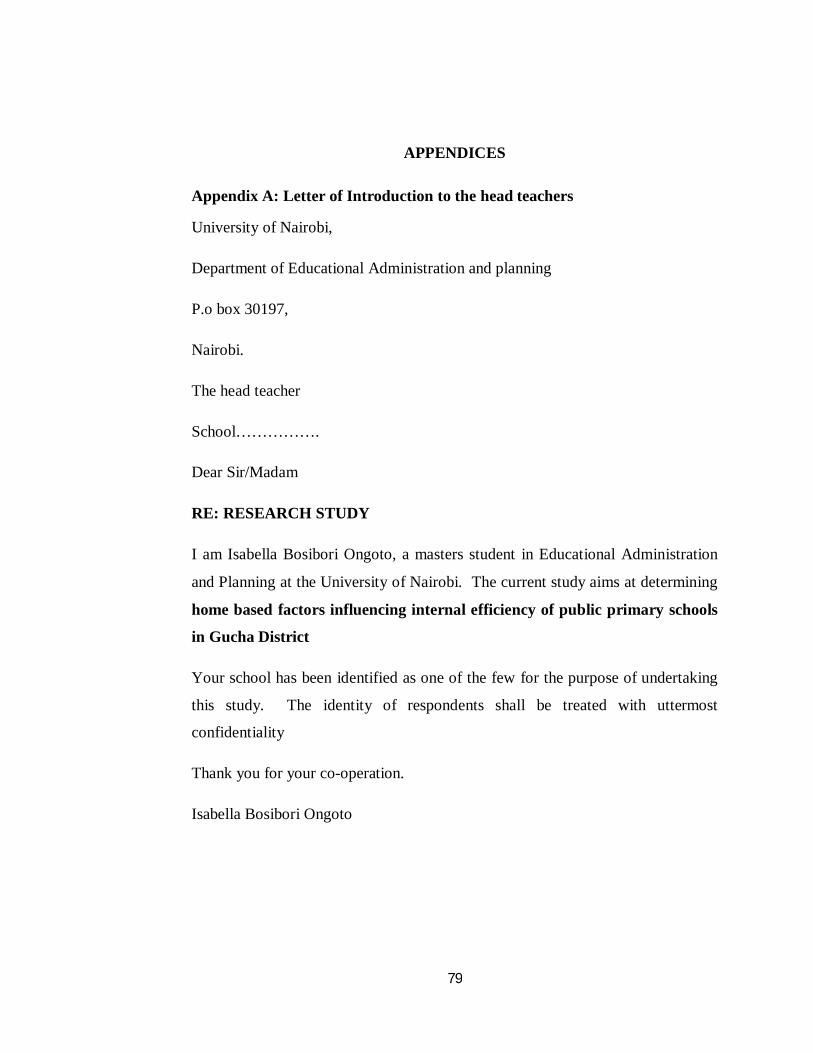
79
APPENDICES
Appendix A: Letter of Introduction to the head teachers
University of Nairobi,
Department of Educational Administration and planning
P.o box 30197,
Nairobi.
The head teacher
School…………….
Dear Sir/Madam
RE: RESEARCH STUDY
I am Isabella Bosibori Ongoto, a masters student in Educational Administration
and Planning at the University of Nairobi. The current study aims at determining
home based factors influencing internal efficiency of public primary schools
in Gucha District
Your school has been identified as one of the few for the purpose of undertaking
this study. The identity of respondents shall be treated with uttermost
confidentiality
Thank you for your co-operation.
Isabella Bosibori Ongoto
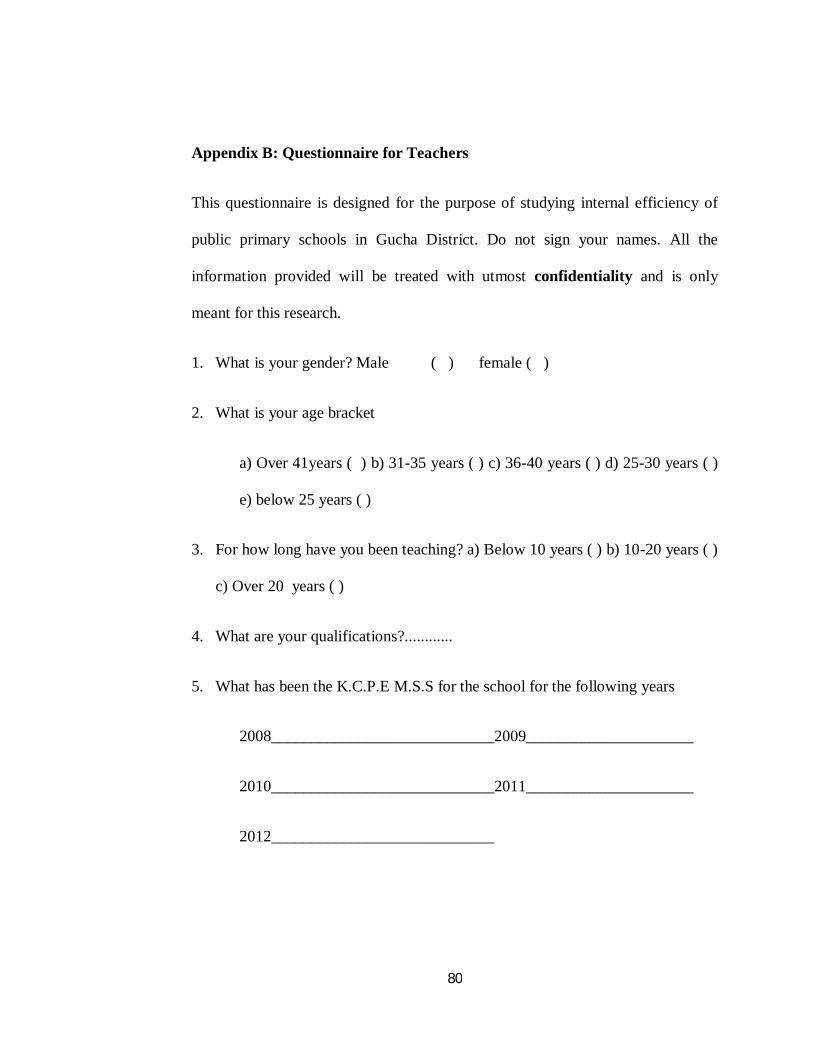
80
Appendix B: Questionnaire for Teachers
This questionnaire is designed for the purpose of studying internal efficiency of
public primary schools in Gucha District. Do not sign your names. All the
information provided will be treated with utmost confidentiality and is only
meant for this research.
1. What is your gender? Male ( ) female ( )
2. What is your age bracket
a) Over 41years ( ) b) 31-35 years ( ) c) 36-40 years ( ) d) 25-30 years ( )
e) below 25 years ( )
3. For how long have you been teaching? a) Below 10 years ( ) b) 10-20 years ( )
c) Over 20 years ( )
4. What are your qualifications?............
5. What has been the K.C.P.E M.S.S for the school for the following years
2008____________________________2009_____________________
2010____________________________2011_____________________
2012____________________________
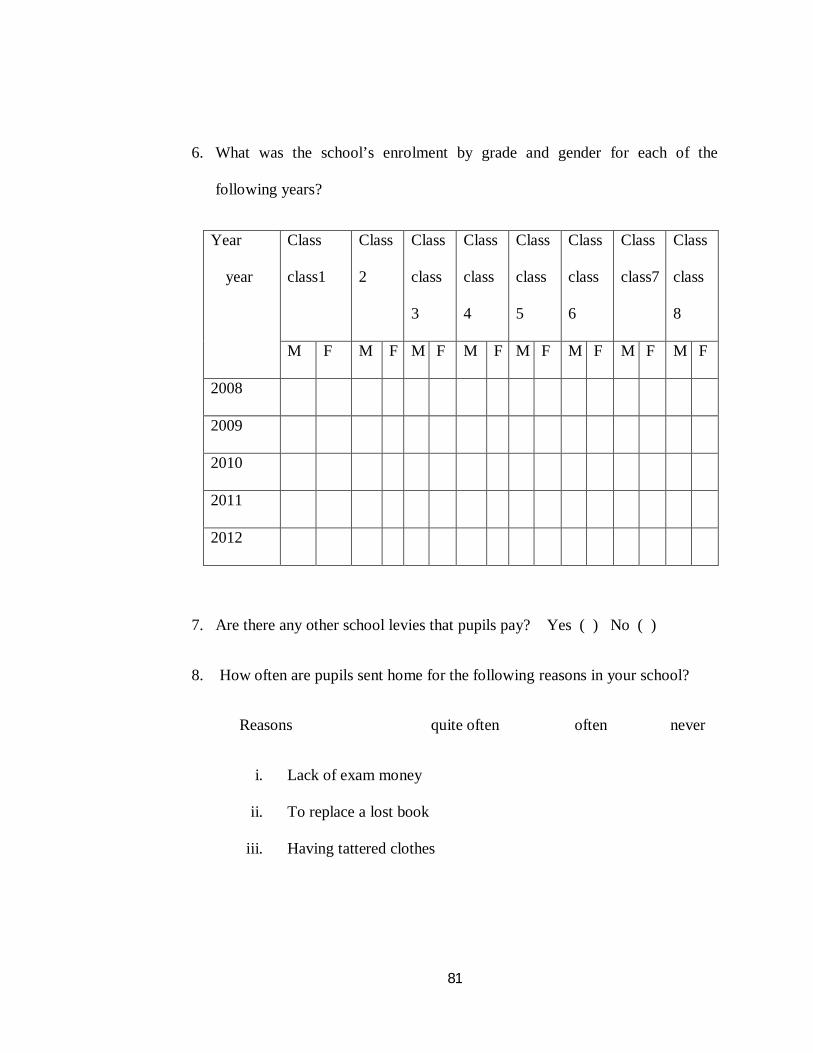
81
6. What was the school’s enrolment by grade and gender for each of the
following years?
Year
year
Class
class1
Class
2
Class
class
3
Class
class
4
Class
class
5
Class
class
6
Class
class7
Class
class
8
M F M F M F M F M F M F M F M F
2008
2009
2010
2011
2012
7. Are there any other school levies that pupils pay? Yes ( ) No ( )
8. How often are pupils sent home for the following reasons in your school?
Reasons quite often often never
i. Lack of exam money
ii. To replace a lost book
iii. Having tattered clothes
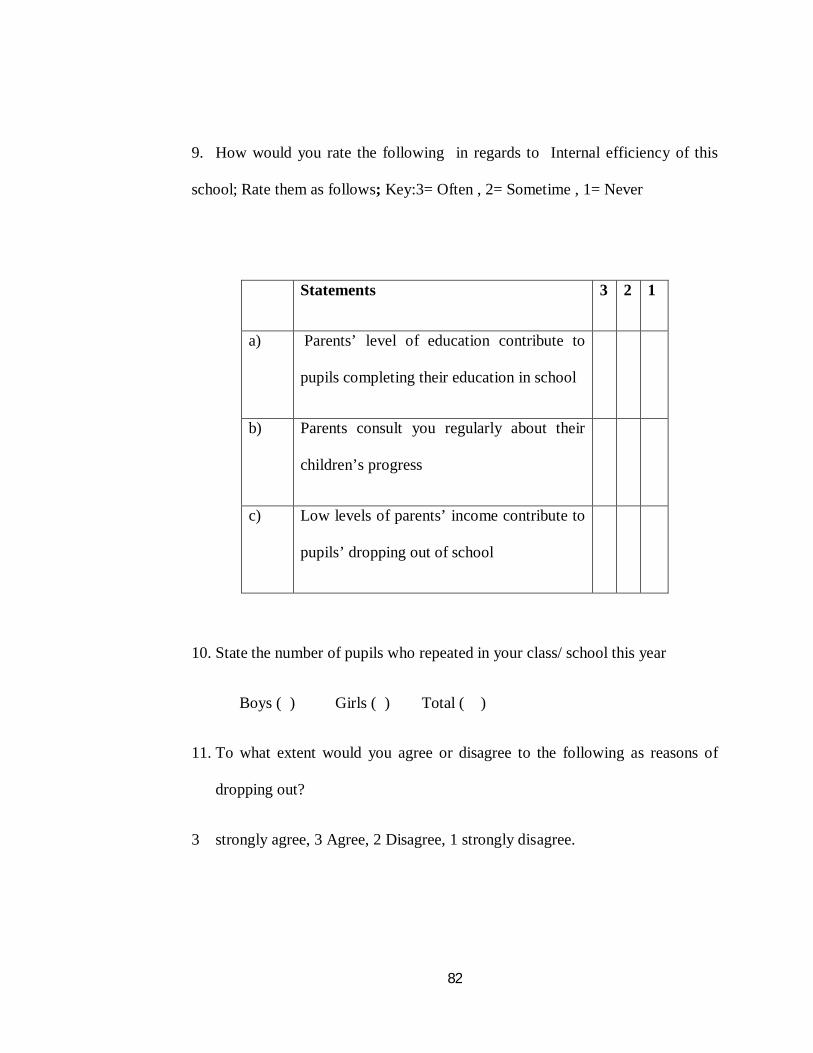
82
9. How would you rate the following in regards to Internal efficiency of this
school; Rate them as follows; Key:3= Often , 2= Sometime , 1= Never
Statements 3 2 1
a)
Parents’ level of education contribute to
pupils completing their education in school
b) Parents consult you regularly about their
children’s progress
c) Low levels of parents’ income contribute to
pupils’ dropping out of school
10. State the number of pupils who repeated in your class/ school this year
Boys ( ) Girls ( ) Total ( )
11. To what extent would you agree or disagree to the following as reasons of
dropping out?
3 strongly agree, 3 Agree, 2 Disagree, 1 strongly disagree.
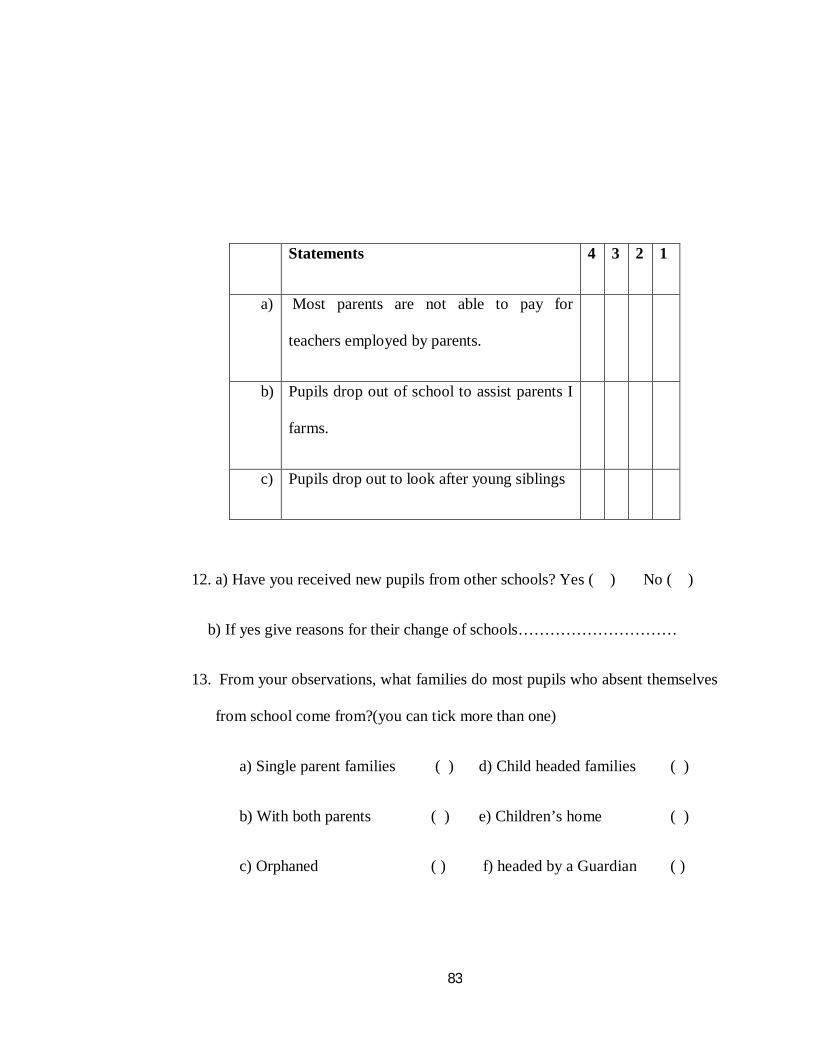
83
Statements 4 3 2 1
a)
Most parents are not able to pay for
teachers employed by parents.
b) Pupils drop out of school to assist parents I
farms.
c) Pupils drop out to look after young siblings
12. a) Have you received new pupils from other schools? Yes ( ) No ( )
b) If yes give reasons for their change of schools…………………………
13. From your observations, what families do most pupils who absent themselves
from school come from?(you can tick more than one)
a) Single parent families ( ) d) Child headed families ( )
b) With both parents ( ) e) Children’s home ( )
c) Orphaned ( ) f) headed by a Guardian ( )
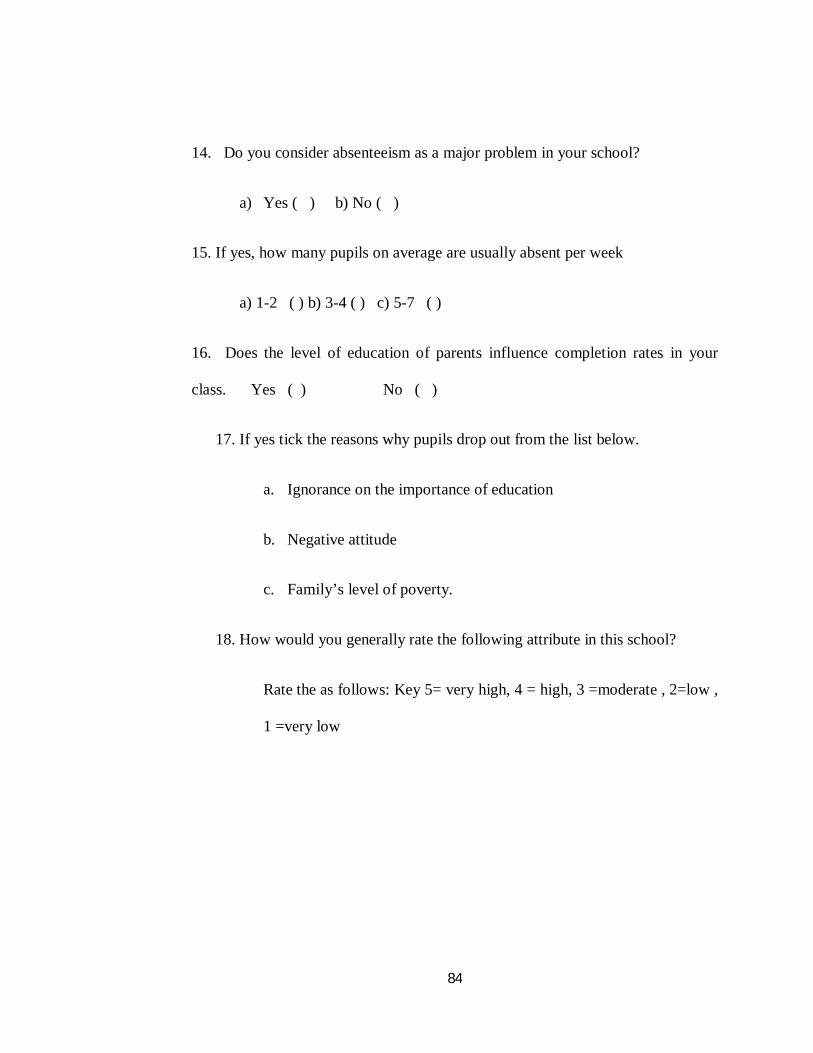
84
14. Do you consider absenteeism as a major problem in your school?
a) Yes ( ) b) No ( )
15. If yes, how many pupils on average are usually absent per week
a) 1-2 ( ) b) 3-4 ( ) c) 5-7 ( )
16. Does the level of education of parents influence completion rates in your
class. Yes ( ) No ( )
17. If yes tick the reasons why pupils drop out from the list below.
a. Ignorance on the importance of education
b. Negative attitude
c. Family’s level of poverty.
18. How would you generally rate the following attribute in this school?
Rate the as follows: Key 5= very high, 4 = high, 3 =moderate , 2=low ,
1 =very low
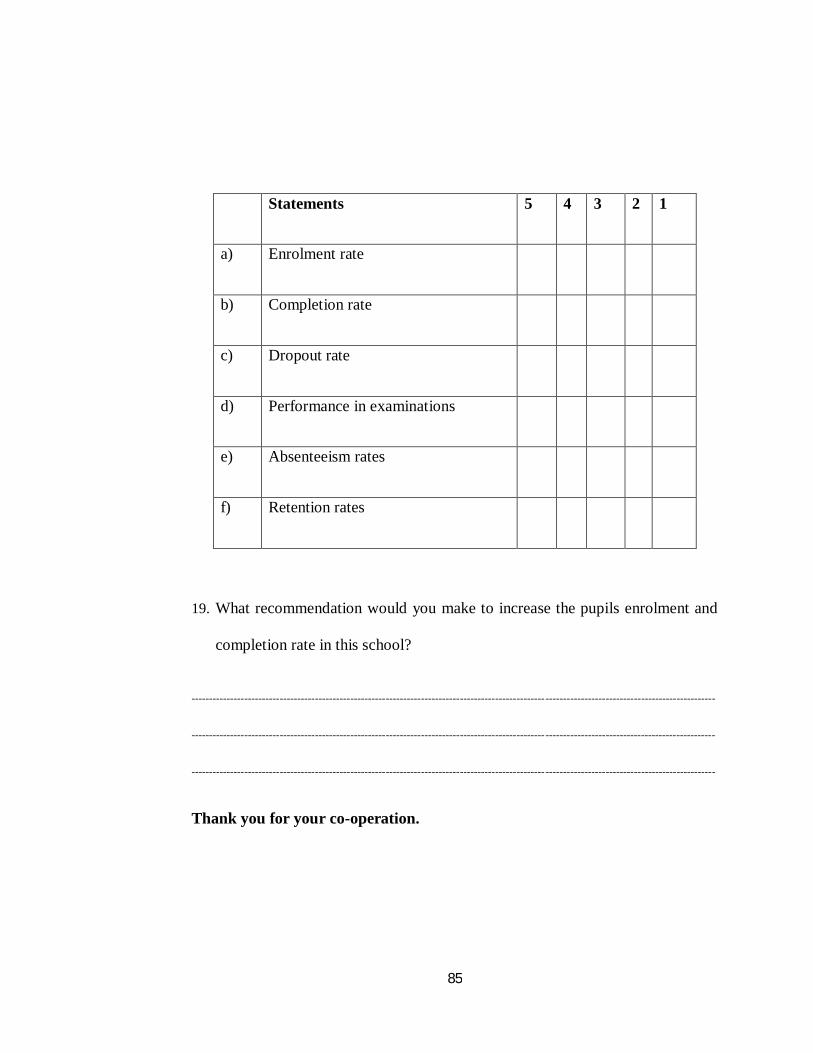
85
Statements 5 4 3 2 1
a) Enrolment rate
b) Completion rate
c) Dropout rate
d) Performance in examinations
e) Absenteeism rates
f) Retention rates
19. What recommendation would you make to increase the pupils enrolment and
completion rate in this school?
----------------------------------------------------------------------------------------------------------------------------------------------------
----------------------------------------------------------------------------------------------------------------------------------------------------
----------------------------------------------------------------------------------------------------------------------------------------------------
Thank you for your co-operation.
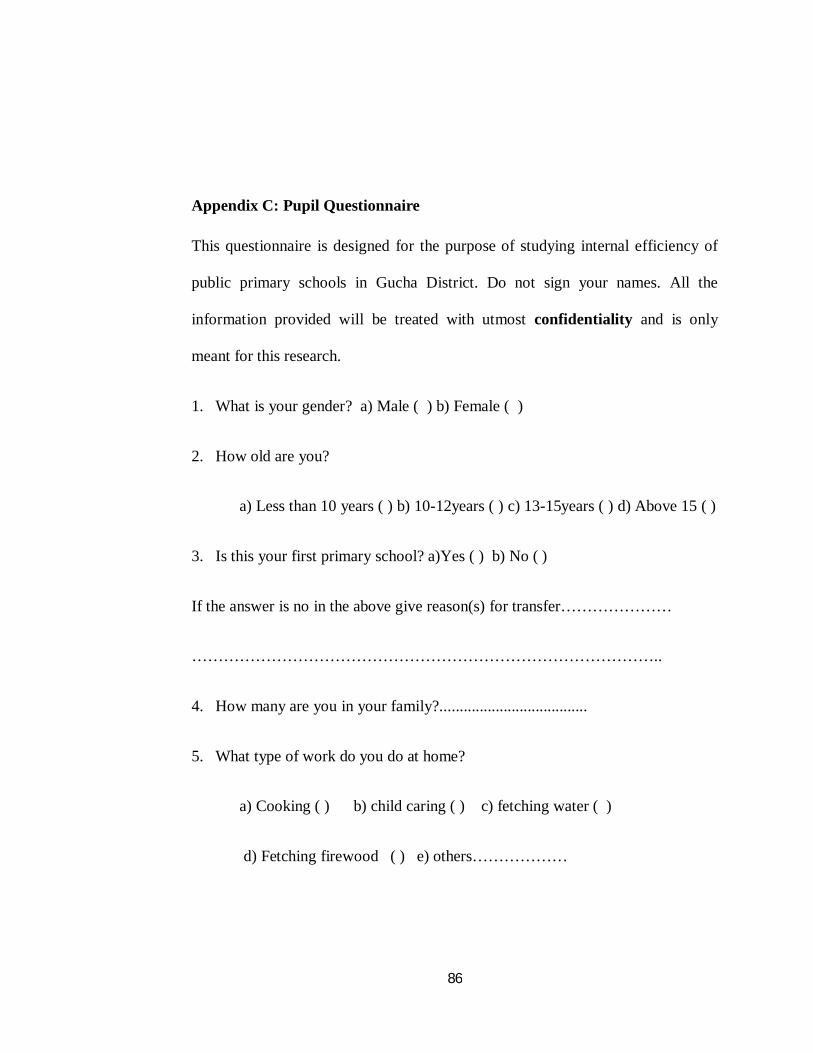
86
Appendix C: Pupil Questionnaire
This questionnaire is designed for the purpose of studying internal efficiency of
public primary schools in Gucha District. Do not sign your names. All the
information provided will be treated with utmost confidentiality and is only
meant for this research.
1. What is your gender? a) Male ( ) b) Female ( )
2. How old are you?
a) Less than 10 years ( ) b) 10-12years ( ) c) 13-15years ( ) d) Above 15 ( )
3. Is this your first primary school? a)Yes ( ) b) No ( )
If the answer is no in the above give reason(s) for transfer…………………
……………………………………………………………………………..
4. How many are you in your family?.....................................
5. What type of work do you do at home?
a) Cooking ( ) b) child caring ( ) c) fetching water ( )
d) Fetching firewood ( ) e) others………………
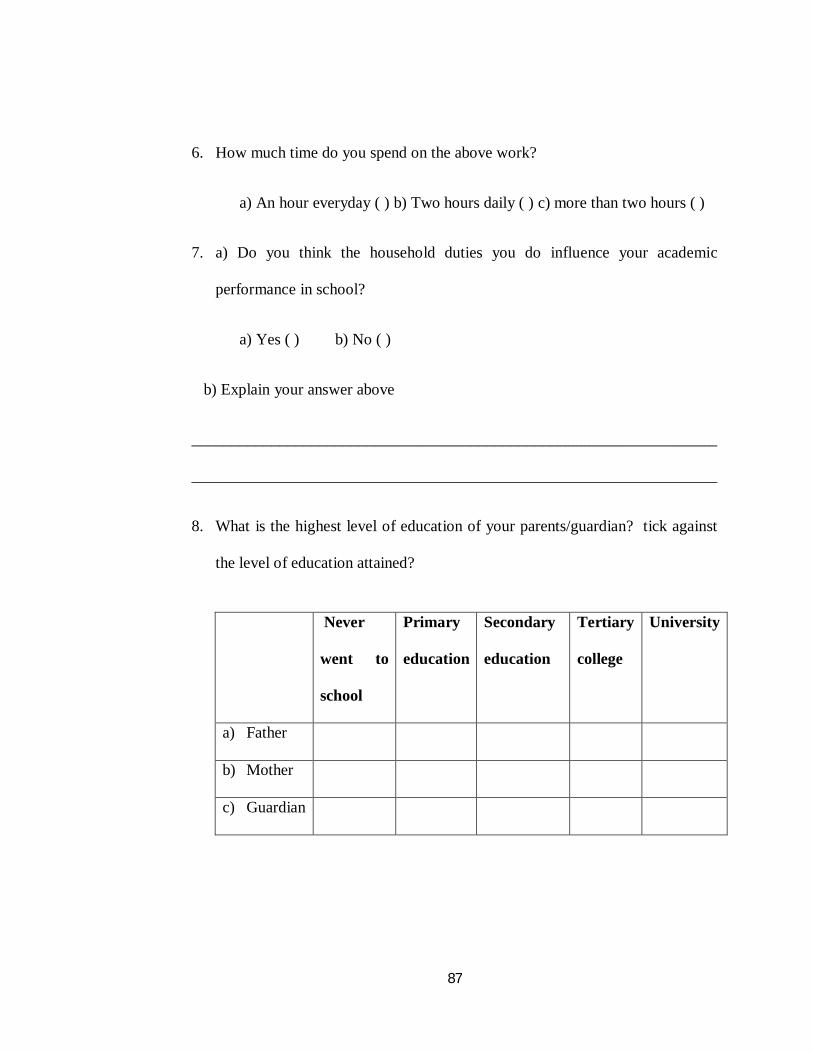
87
6. How much time do you spend on the above work?
a) An hour everyday ( ) b) Two hours daily ( ) c) more than two hours ( )
7. a) Do you think the household duties you do influence your academic
performance in school?
a) Yes ( ) b) No ( )
b) Explain your answer above
__________________________________________________________________
__________________________________________________________________
8. What is the highest level of education of your parents/guardian? tick against
the level of education attained?
Never
went to
school
Primary
education
Secondary
education
Tertiary
college
University
a) Father
b) Mother
c) Guardian
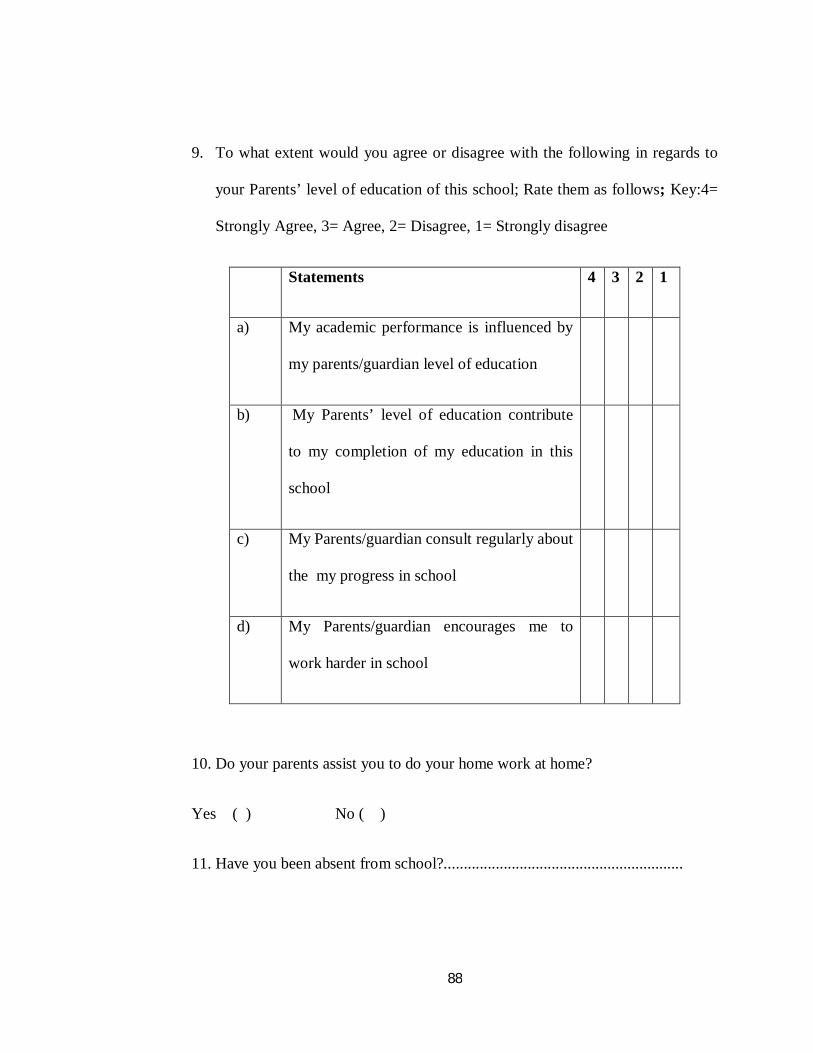
88
9. To what extent would you agree or disagree with the following in regards to
your Parents’ level of education of this school; Rate them as follows; Key:4=
Strongly Agree, 3= Agree, 2= Disagree, 1= Strongly disagree
Statements 4 3 2 1
a) My academic performance is influenced by
my parents/guardian level of education
b)
My Parents’ level of education contribute
to my completion of my education in this
school
c) My Parents/guardian consult regularly about
the my progress in school
d) My Parents/guardian encourages me to
work harder in school
10. Do your parents assist you to do your home work at home?
Yes ( ) No ( )
11. Have you been absent from school?............................................................

89
12. Whom do you live with now? a) Both parents () b) Mother only () c) father
only ( ) d) guardian/relative ( ) e) children’s home ( )
13. Does your current family structure influence absenteeism in the schools?
a) Yes ( ) b) No ( )
14. If yes above, in what ways?
__________________________________________________________________
__________________________________________________________________
15. In your own opinion, how can you rate your family’s financial background?
Very rich ( ) rich ( ) poor ( ) very poor ( )
16. Who pays your schools levies and other school requirements?
a) Both parents () b) Mother only () c) father only ( ) d) guardian/relative ( )
e) children’s home ( ) f) other well wishers ( )
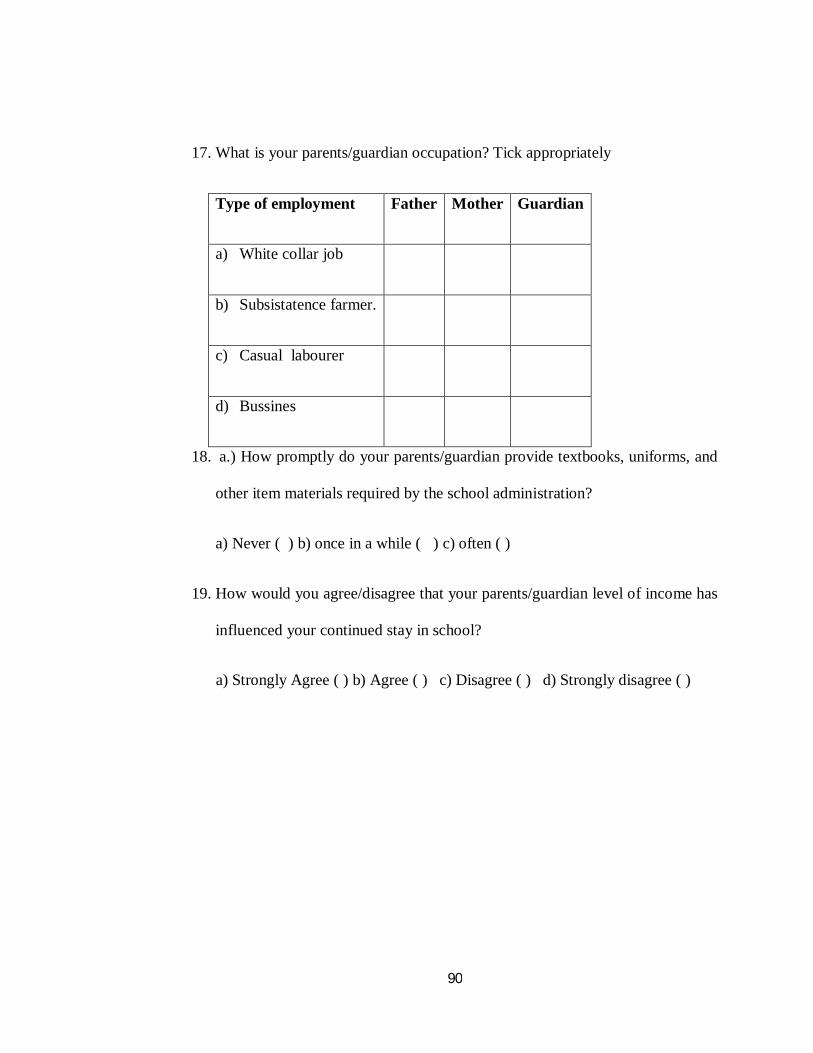
90
17. What is your parents/guardian occupation? Tick appropriately
Type of employment Father Mother Guardian
a) White collar job
b) Subsistatence farmer.
c) Casual labourer
d) Bussines
18. a.) How promptly do your parents/guardian provide textbooks, uniforms, and
other item materials required by the school administration?
a) Never ( ) b) once in a while ( ) c) often ( )
19. How would you agree/disagree that your parents/guardian level of income has
influenced your continued stay in school?
a) Strongly Agree ( ) b) Agree ( ) c) Disagree ( ) d) Strongly disagree ( )
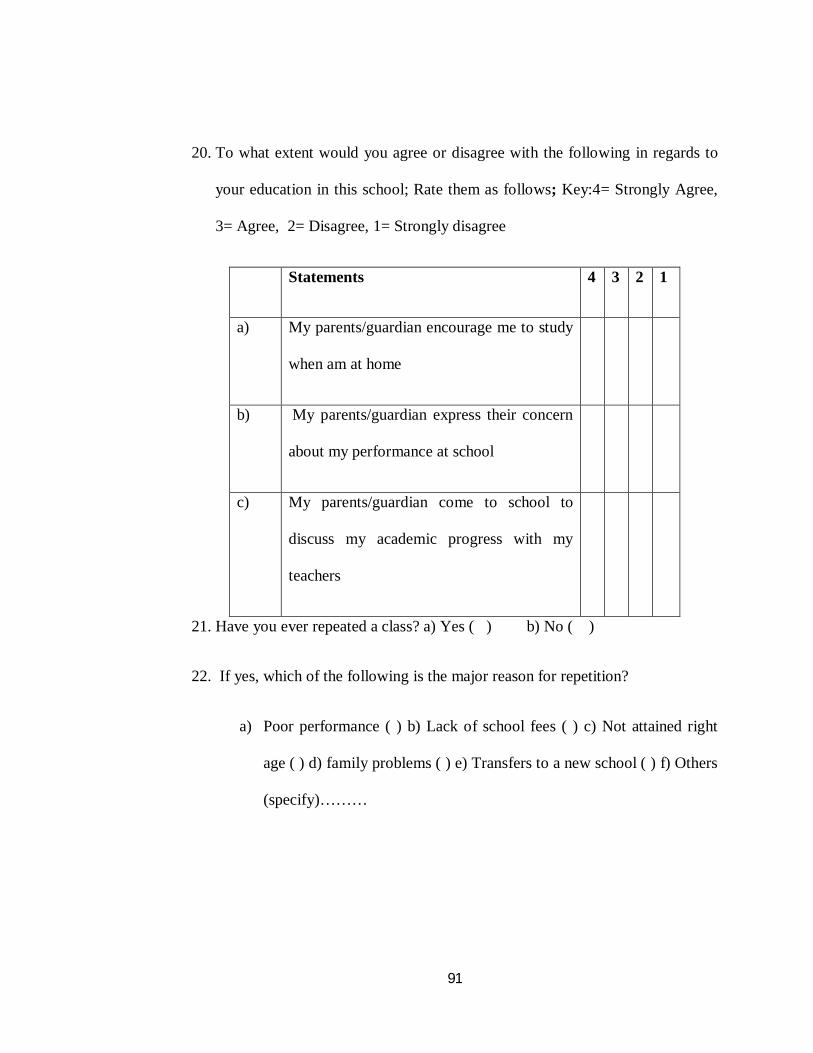
91
20. To what extent would you agree or disagree with the following in regards to
your education in this school; Rate them as follows; Key:4= Strongly Agree,
3= Agree, 2= Disagree, 1= Strongly disagree
Statements 4 3 2 1
a) My parents/guardian encourage me to study
when am at home
b)
My parents/guardian express their concern
about my performance at school
c) My parents/guardian come to school to
discuss my academic progress with my
teachers
21. Have you ever repeated a class? a) Yes ( ) b) No ( )
22. If yes, which of the following is the major reason for repetition?
a) Poor performance ( ) b) Lack of school fees ( ) c) Not attained right
age ( ) d) family problems ( ) e) Transfers to a new school ( ) f) Others
(specify)………
92
23. What do you think can be done to ensure pupils stay in school and complete
their studies as scheduled?
__________________________________________________________________
__________________________________________________________________
Thank you for your co-operation
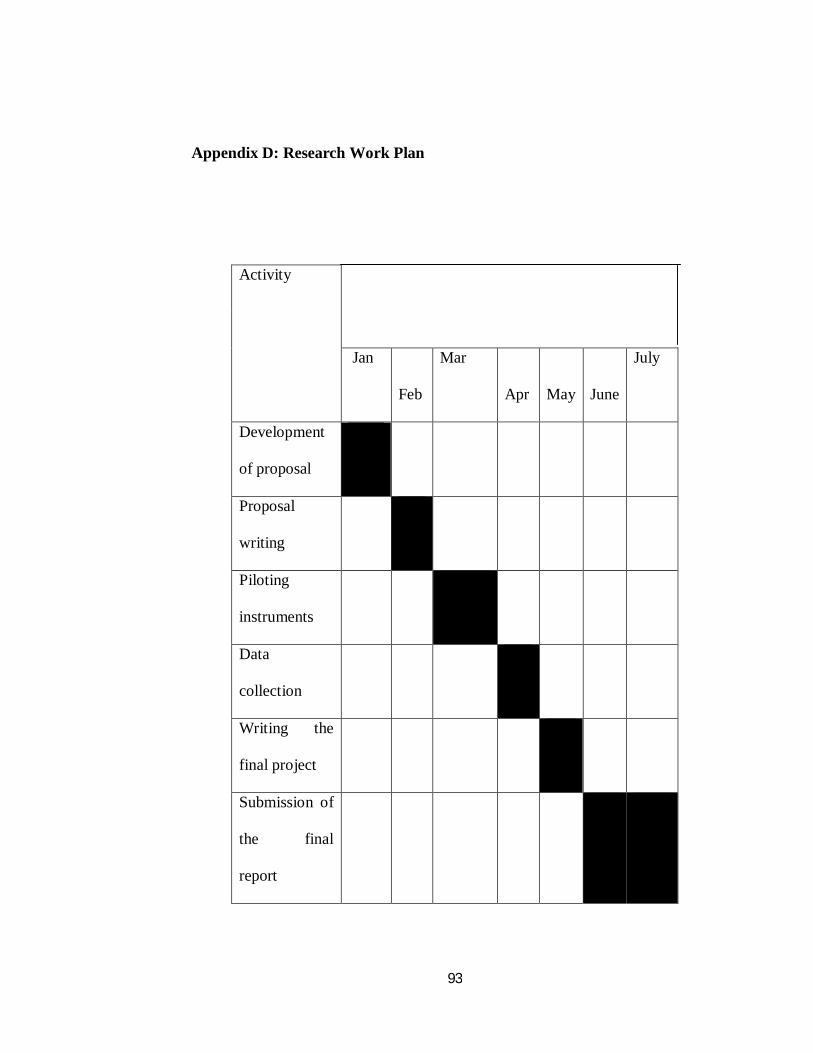
93
Appendix D: Research Work Plan
Activity
Jan
Feb
Mar
Apr
May
June
July
Development
of proposal
Proposal
writing
Piloting
instruments
Data
collection
Writing the
final project
Submission of
the final
report
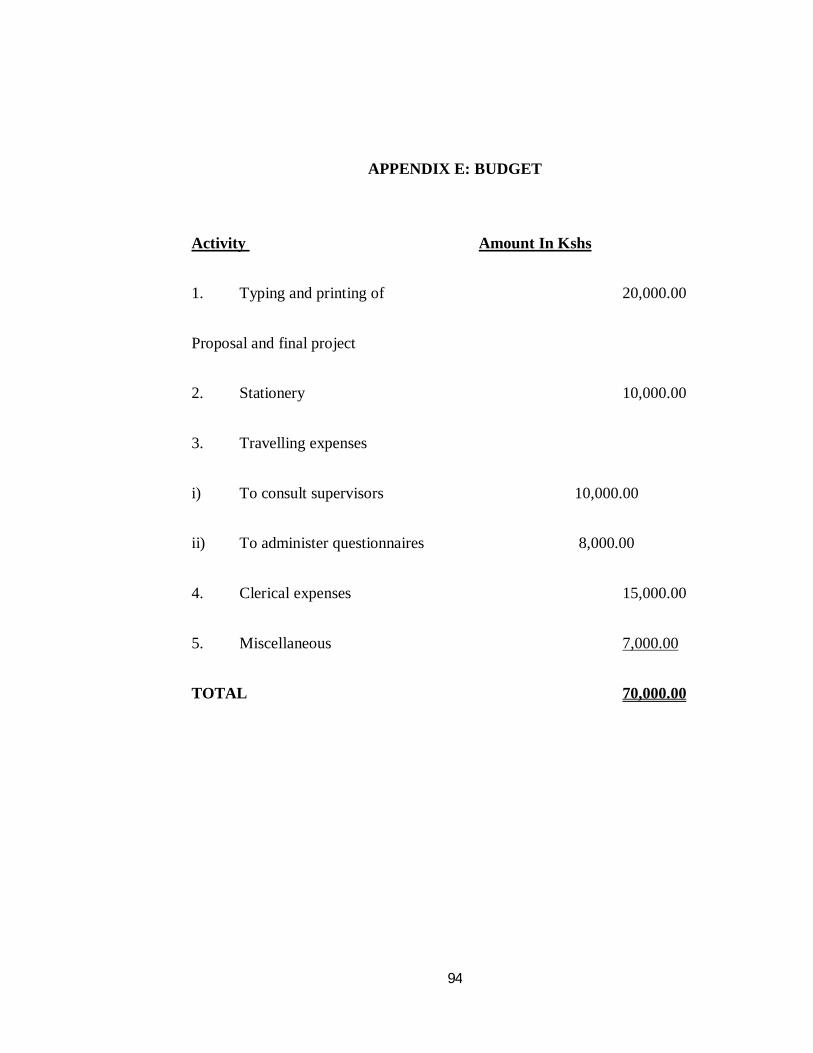
94
APPENDIX E: BUDGET
Activity Amount In Kshs
1. Typing and printing of 20,000.00
Proposal and final project
2. Stationery 10,000.00
3. Travelling expenses
i) To consult supervisors 10,000.00
ii) To administer questionnaires 8,000.00
4. Clerical expenses 15,000.00
5. Miscellaneous 7,000.00
TOTAL 70,000.00

95

96