Embed Size (px)
Citation preview

Effects of Tart Cherry Intake on
Exercise Performance and Recovery
RESEARCH ARTICLE Open Access
Effect of tart cherry juice on recovery andnext day performance in well-trained WaterPolo playersRachel McCormick1,2, Peter Peeling1,2, Martyn Binnie2, Brian Dawson1 and Marc Sim2,3*
Abstract
Background: Tart Montmorency cherries contain high concentrations of phytochemicals and anthocyanins, whichhave recently been linked to improved athletic recovery and subsequent performance. To date however, previouswork reporting promising results has focused on land-based endurance sports, with any potential benefits to teamsports remaining unknown. As such, this investigation set-out to examine the effect of supplemental tart cherry juice(CJ) on recovery and next day athletic performance in highly-trained water-based team sport athletes over seven days.
Methods: In a randomised, double-blind, repeated measures, crossover design, nine male Water Polo athleteswere supplemented with CJ or a placebo equivalent (PLA) for six consecutive days. Prior to, and at the completion ofthe supplementation period, water-based performance testing was conducted. On day 6, participants also undertook afatiguing simulated team game activity. Venous blood samples were collected (Pre-exercise: day 1, 6 and 7;Post-exercise: day 6) to investigate markers of inflammation [Interleukin-6 (IL-6); C-reactive protein (CRP)] andoxidative stress [Uric Acid (UA); F2-Isoprostane (F2-IsoP)]. A daily diary was also completed (total quality ofrecovery, delayed onset muscle soreness) as a measure of perceptual recovery.
Results: In both conditions, day 6 post-exercise IL-6 was significantly higher than pre-exercise and day 7 (p < 0.05);CRP was greater on day 7 as compared to day 6 pre- and post-exercise (p < 0.05); F2-IsoP was significantly lower onday 7 as compared to day 1 and day 6 (p < 0.05); UA remained unchanged (p > 0.05). No differences were found forany performance or recovery measures.
Conclusions: The lack of difference observed in the blood markers between groups may reflect the intermittent,non-weight bearing demands of Water Polo, with such activity possibly unable to create a substantial inflammatoryresponse or oxidative stress (over 7 days) to impede performance; thereby negating any potential beneficial effectsassociated with CJ supplementation.
Trial registration: This trial was registered with the Australian and New Zealand Clinical Trials Registry (ANZCTR).Registration number: ACTRN12616001080415. Date registered: 11/08/2016, retrospectively registered.
Keywords: Supplement, Inflammation, Oxidative stress, Team-sports
* Correspondence: [email protected] Australian Institute of Sport, Mt Claremont, Western Australia,Australia3School of Health Sciences and Psychology, Federation University, Mt Helen,Victoria, AustraliaFull list of author information is available at the end of the article
© The Author(s). 2016 Open Access This article is distributed under the terms of the Creative Commons Attribution 4.0International License (http://creativecommons.org/licenses/by/4.0/), which permits unrestricted use, distribution, andreproduction in any medium, provided you give appropriate credit to the original author(s) and the source, provide a link tothe Creative Commons license, and indicate if changes were made. The Creative Commons Public Domain Dedication waiver(http://creativecommons.org/publicdomain/zero/1.0/) applies to the data made available in this article, unless otherwise stated.
McCormick et al. Journal of the International Society of Sports Nutrition (2016) 13:41 DOI 10.1186/s12970-016-0151-x

BackgroundTart Montmorency cherries have recently gained reputeas a useful supplement for athletes due to their highconcentration of phytochemicals and anthocyanins,which have been linked to numerous health benefits.These include high anti-inflammatory and anti-oxidantcapacities, enhanced sleep, improved recovery and a re-duction in post-exercise muscle damage and soreness[1–3]. Such findings have recently led to tart cherry juice(CJ) being included as a ‘Group B’ supplement (warrantsfurther research/provided to athletes within research orclinical monitoring situations) on the Australian Institutueof Sport Supplement Classification System. To date how-ever, all exercise-based studies have investigated the ef-fects of CJ supplementation on recovery from maximalstrength or endurance (>60 min duration) exercise, dem-onstrating an attenuation of markers related to both in-flammation and oxidative stress [2, 4, 5]. As such, anyresponse linked to accelerated recovery would appearbeneficial when considering the large training load experi-enced by high performance athletes.Despite the aforementioned benefits of tart CJ supple-
mentation, its effect on performance, inflammation andoxidative stress in water-based team sport athletes re-mains unknown. Specifically, the non-weight bearingintermittent nature of Water Polo may influence the typ-ical post-exercise inflammatory and oxidative stress re-sponse (compared to endurance exercise), thus havingimplications for the type of recovery strategies adoptedby such populations. Therefore, the aim of this investiga-tion was to assess the effect of supplemental tart CJ onathletic recovery and next day performance in highly-trained Water Polo players. It was hypothesised that tartCJ supplementation (in comparison to a placebo [PLA]equivalent) would; (a) improve athletic performance, and(b) reduce post-exercise markers of inflammation, oxida-tive stress and perceptual muscle soreness.
MethodsSubject background and preparationNine highly-trained male Water Polo players were re-cruited from the Western Australian Institute of Sport(WAIS) Water Polo squad. The mean (± SD) physicalcharacteristics of the participants were; age: 18.6 (±1.4)years, body mass: 82.7 (±9.8) kg and Σ7 skin-folds: 70.7(±29.7) mm. All players were provided with an informa-tion sheet outlining the procedures, potential risks andbenefits of the study prior to signing an informed con-sent agreement to participate. In the event that the par-ticipant was under the age of 18 years, signed consentwas obtained from the individuals’ parent or legal guard-ian. Approval for the study was obtained from theHuman Research Ethics Committee at the University ofWestern Australia (RA/4/1/7380).
Experimental overviewA randomised double-blind, repeated measures, crossoverdesign was employed to assess the influence of the tart CJsupplementation versus the PLA. The investigation con-sisted of two experimental trials, each involving a 7-dayprotocol. A 5-week washout period was adopted betweenthe two experimental trials to preclude any follow-on ef-fects, based on comparable previous supplementation re-gimes [6, 7]. During the experimental trials, participantswere supplemented with CJ or a PLA equivalent from day1 to day 6. On day 1, prior to the supplementation period,water-based performance testing was conducted. No formof physical activity was performed in the preceding 48 h ofday 1, with participants arriving at the laboratory at05:00 am to provide a venous blood sample immediatelyprior to commencing a standardised warm-up and thetesting battery. The swimming-based tests comprised ofthe in-water vertical jump test (VJ), 10 m sprint test, therepeat sprint test (RST) and the Water Polo IntermittentShuttle Test (WIST) [8], completed in the aforementionedorder. All test protocols were conducted in accordancewith the Australian National Water Polo Test Protocols[9, 10]. Capillary blood samples were collected to measureblood lactate levels (BLa) following the RST and WISTusing a Lactate Pro II analyser (Arkray, Japan). All testingsessions were performed in a heated indoor Water Polopool (27.5 °C). The testing battery was conducted in themorning (identical to typical training times) to minimiseany diurnal influence on the test outcomes.Throughout each experimental trial, participants had a
fixed training regime (Table 1). All training (technicalskill, weights, and swimming) performed during the 7-day trials was identical, and took place in the controlledenvironment of the indoor Water Polo pool or gymna-sium. Training duration and a rating of perceived exer-tion (RPE) were collected after each training session toestablish a quantified training load (RPE x Session Dur-ation; [11]). The average daily training load was similarbetween trials (p > 0.05), at 561 ± 108 arbitrary units(AU) and 572 ± 89 AU for the CJ and PLA conditions,respectively. Participants also completed a comprehen-sive online daily diary for the duration of each experi-mental trial in order to assess their perceived recovery.On day 6, participants attended the laboratory at
15:45 pm to provide a venous blood sample immediatelyprior to undertaking a simulated fatiguing team gameactivity, designed to replicate the demands of a WaterPolo match [12]. A post-exercise venous blood samplewas collected upon completion of the simulation. Finally,on day 7 of the supplementation period, participants ar-rived at the laboratory at 07:30 am to provide a finalvenous blood sample. Immediately thereafter, the ath-letes were required to re-perform the water-based per-formance tests as per day 1.
McCormick et al. Journal of the International Society of Sports Nutrition (2016) 13:41 Page 2 of 8
Venous blood samples collected throughout each experi-mental trial were used to investigate biological markers in-dicative of the efficacy of CJ. Inflammatory markers [highsensitivity (hs) IL-6 and CRP] were measured on day 6(pre- & post-match simulation) and day 7 (12 h post-match simulation) of each testing week. Markers of oxida-tive stress [Uric acid (UA) and F2 isoprostane (F2-IsoP)]were measured at all 4 venous blood sampling time points;day 1 (pre-performance testing), day 6 (pre- & post-matchsimulation), and again on day 7 (pre-performance testing).
Experimental proceduresCherry juice supplementationParticipants consumed 90 mL daily of tart MontmorencyCJ (Prunus Cerasus) concentrate (Cherry Active, Sunbury,UK) or a PLA equivalent for a total of 6 days. The cherryconcentrate was diluted with water, such that each 30 mLserving was made up into a 200 mL beverage. Both the CJand PLA were consumed in two doses each day; 200 mLbefore morning training, and 400 mL in the evening post-training. According to the manufacturer, a 30 mL dose ofCherry Active concentrate is equivalent to approximately90 whole Montmorency tart cherries (Cherry Active,Sunbury, UK) containing 9.117 mg/mL of anthocyanins,
which has previously been reported to have positive healthand performance outcomes [4, 6, 13].The PLA was made by combining 40 mL of three differ-
ent ‘off the shelf ’ cordials. Lime (Woolworths select limecordial, Australia), cranberry (Bickford’s cranberry juicecordial, Australia) and raspberry (Cottee’s raspberry fla-voured cordial, Australia) cordials were mixed with foodcolouring and 480 mL of water in order to closely imitatethe taste, colour and carbohydrate content (10 g/100 mL,maltodextrin powder, Nutricia Poly-Joule, Australia) with-out any of the anthocyanin content of the CJ. Daily adher-ence to supplement consumption was made by theinvestigators being present at every session.
Performance tests and match simulationTesting batteryAs previously highlighted, all four performance tests (VJ,10 m sprint, RST, WIST) were specifically selected basedon their ability to assess important traits of Water Polo[8–10]. A minimum of 5 min rest between each test wasalso adopted to ensure adequate recovery. The VJ test re-quired participants to propel themselves as high out of thewater as possible, extending their arms and fingers directlyupward at the peak of the jump to displace as many vaneson a customised Water Polo specific Yardstick®; with the
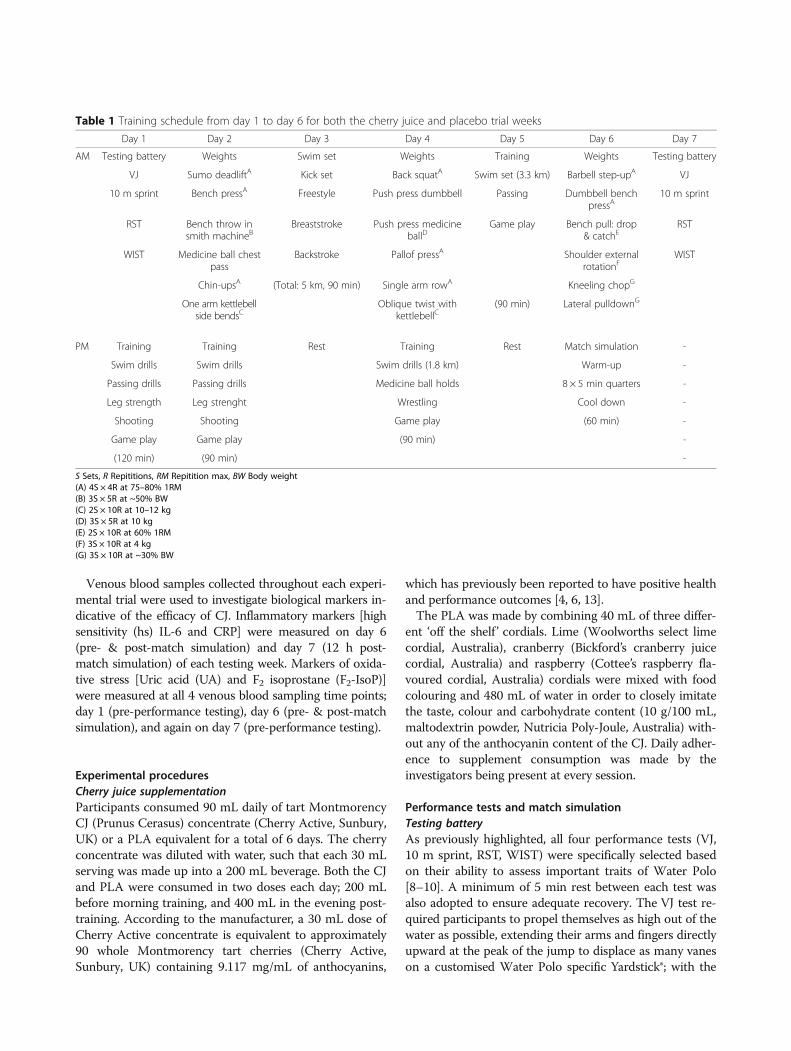
Table 1 Training schedule from day 1 to day 6 for both the cherry juice and placebo trial weeksDay 1 Day 2 Day 3 Day 4 Day 5 Day 6 Day 7
AM Testing battery Weights Swim set Weights Training Weights Testing battery
VJ Sumo deadliftA Kick set Back squatA Swim set (3.3 km) Barbell step-upA VJ
10 m sprint Bench pressA Freestyle Push press dumbbell Passing Dumbbell benchpressA
10 m sprint
RST Bench throw insmith machineB
Breaststroke Push press medicineballD
Game play Bench pull: drop& catchE
RST
WIST Medicine ball chestpass
Backstroke Pallof pressA Shoulder externalrotationF
WIST
Chin-upsA (Total: 5 km, 90 min) Single arm rowA Kneeling chopG
One arm kettlebellside bendsC
Oblique twist withkettlebellC
(90 min) Lateral pulldownG
PM Training Training Rest Training Rest Match simulation -
Swim drills Swim drills Swim drills (1.8 km) Warm-up -
Passing drills Passing drills Medicine ball holds 8 × 5 min quarters -
Leg strength Leg strenght Wrestling Cool down -
Shooting Shooting Game play (60 min) -
Game play Game play (90 min) -
(120 min) (90 min) -
S Sets, R Repititions, RM Repitition max, BW Body weight(A) 4S × 4R at 75–80% 1RM(B) 3S × 5R at ~50% BW(C) 2S × 10R at 10–12 kg(D) 3S × 5R at 10 kg(E) 2S × 10R at 60% 1RM(F) 3S × 10R at 4 kg(G) 3S × 10R at ~30% BW
McCormick et al. Journal of the International Society of Sports Nutrition (2016) 13:41 Page 3 of 8
best attempt of three trials recorded. The 10 m sprint(best of two trials) required participants to swim betweentwo ropes held just above water level at 0 and 10 m (thatwere raised/lowered by the research team). Similar in de-sign to the 10 m sprint, the RST consisted of 6 × 10 msprints departing every 17 s between the 0 and 10 mropes. A digital video camera (Sony HDR-HC9, Japan)filming at 50 Hz was positioned on the opposite side ofthe pool, with the viewing width set to ensure both startand finish markers were clearly visible. Before testing, acalibration rope was also filmed allowing virtual lines tobe accurately overlaid onto the video analysis program(Dartfish, Australia) at both 0 and 10 m for the accuratecalculation of sprint time. Finally, WIST may be consid-ered the water specific equivalent of the land-based Yo-Yointermittent recovery test [9, 10]. The WIST lasts approxi-mately 14 min in total (for this population) and consists ofrepeated 2 × 7.5 m shuttles (swims out and back) at pro-gressively increasing speeds, interspaced by 10 s of recov-ery (treading water) that is controlled by audio signals.The protocols, validity and reliability of the water-basedtesting schedule have been previously established, and arecurrently adopted by Water Polo Australia [9]. Finally,specific details of the match simulation protocol have pre-viously been reported [12]. The purpose of use here wassolely to function as a fatiguing mechanism.
Daily diariesOn waking, athletes provided a Total Quality of Recovery(TQR) rating and Delayed Onset Muscle Soreness(DOMS) score for the upper body, upper legs, lower legsand overall body. The TQR measured how well athletes feltthey had recovered, and encompassed the anchor points 6(very, very poor recovery) to 20 (very, very good recovery)[14]. The DOMS scale was included to measure how soreathletes felt, encompassing the anchor points of 0 (normal;without pain or stiffness) to 10 (very painful) [15].
Blood analysisVenous blood was collected from an antecubital veinusing a 21-gauge needle into an 8 ml gel separator tube.All samples were subsequently centrifuged at 10 °C for10 min at 3000 rpm, and stored in 1.5 mL eppendorfs at−80 °C until further analysis at a commercial pathologylaboratory (PathWest Laboratory, Fiona Stanley Hospital).The IL-6 was analysed via immunoassay technique(Quantikine HS ELISA, R&D Systems, Inc. Minneapolis,USA). The coefficient of variation (CV) for inter-assayprecision at 0.49 and 2.78 pg/mL was 9.6 and 7.2%respectively. The hsCRP was measured using an Architectanalyser (ci8200), and determined using a CRP VarioReagent (SENTINEL CH. SpA, Via Robert Koch, 2, Milan20152, Italy). The CV for CRP determination at 0.88, 2.21and 6.22 mg/L was 2.3, 1.2 and 1.0%, respectively. The UA
was measured using an Architect analyser (ci8200), anddetermined using a UA Reagent (Abbott Diagnostics, Ab-bott Laboratories, Abbott Park, IL 60064, USA). The CVfor UA determination at 0.25 and 0.56 mg/L was 1.92 and1.5%, respectively. F2-IsoP was analysed using an Agilent6890 gas chromatograph coupled to an Agilent 5973 massselective detector. The mean total (free + esterified)plasma F2-IsoP concentration was 952 ± 38 pmol/L, with awithin and between assay reproducibility of 8.0 and 5.6%,respectively [16].
Statistical analysisResults are expressed as mean (±SD) and were analysedusing a repeated measures analysis of variance (ANOVA)to determine time, condition and interaction effects oftart CJ on measures of recovery and performance. Apost-hoc paired samples t-test was used to determineany differences between trials. The alpha level was ac-cepted at p < 0.05.
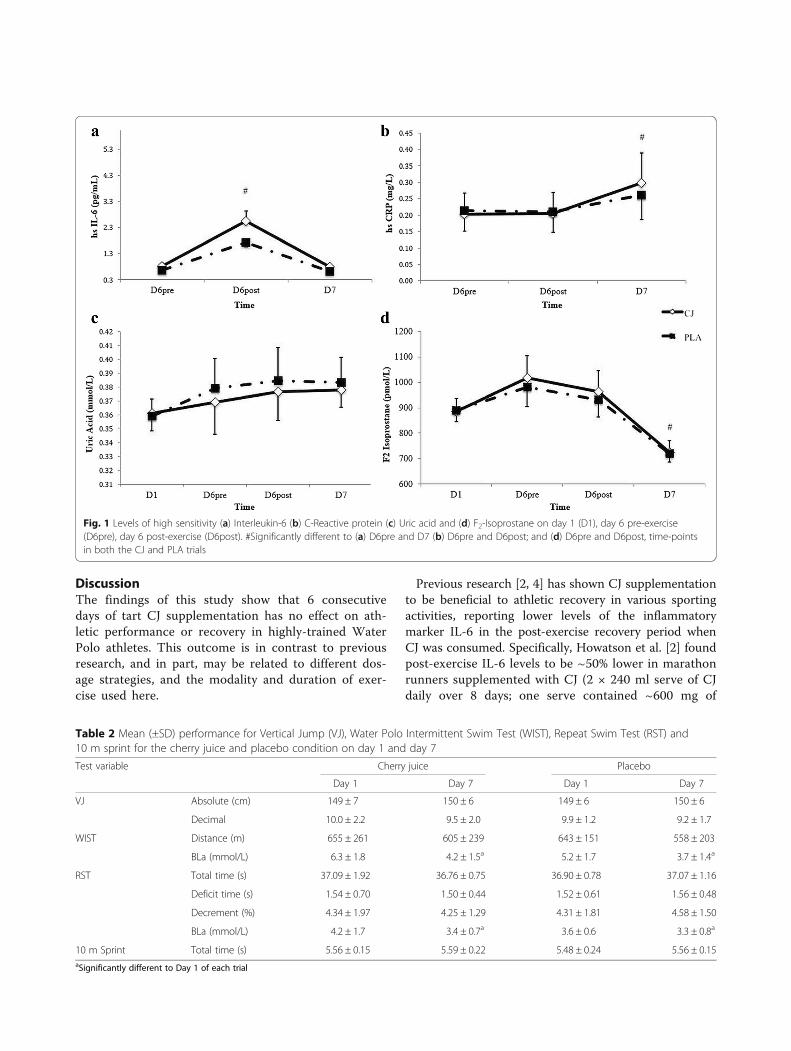
ResultsBlood variablesThe levels of IL-6, CRP, UA and F2-IsoP are depicted inFig. 1 (a), (b), (c) and (d), respectively. For IL-6, CRP andF2-IsoP, a significant time (p < 0.05), but no condition orinteraction effect, was apparent across the supplementa-tion period. Specifically, IL-6 levels were significantlygreater (p < 0.05) on day 6 post-exercise as compared today 6 pre-exercise and day 7. Additionally, CRP levelswere significantly greater on day 7 as compared to thosemeasured on day 6 pre- and post-exercise (p < 0.05). Fur-thermore, F2-IsoP levels were significantly lower (p < 0.05)on day 7 as compared to those recorded on day 1 and day6 pre- and post-exercise. Finally, no condition, time orinteraction effects were evident for UA.
Performance variablesPerformance data for the numerous Water Polo tests areshown in Table 2. No condition, time or interaction ef-fects were found for the WIST, VJ, 10 m sprint and RSTscores achieved across the supplementation period.However, analysis of post-WIST and RST BLa levelsshowed a significant effect for time (p < 0.05) betweenday 1 and day 7; such that BLa levels were significantlylower on day 7 (p < 0.05) compared to day 1 across bothconditions.
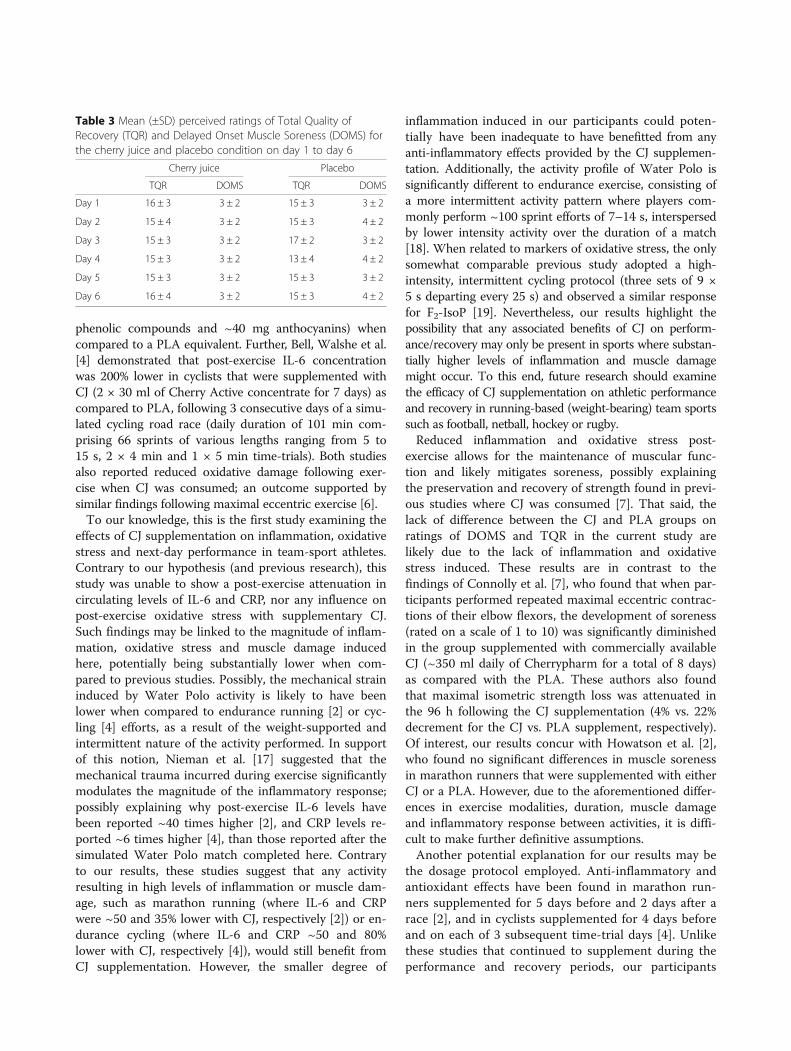
Perceptual variablesRatings of DOMS and TQR are displayed in Table 3. Nocondition, time or interaction effects (p > 0.05) werefound for the respective ratings for the duration of CJ orPLA supplementation.
McCormick et al. Journal of the International Society of Sports Nutrition (2016) 13:41 Page 4 of 8
DiscussionThe findings of this study show that 6 consecutivedays of tart CJ supplementation has no effect on ath-letic performance or recovery in highly-trained WaterPolo athletes. This outcome is in contrast to previousresearch, and in part, may be related to different dos-age strategies, and the modality and duration of exer-cise used here.
Previous research [2, 4] has shown CJ supplementationto be beneficial to athletic recovery in various sportingactivities, reporting lower levels of the inflammatorymarker IL-6 in the post-exercise recovery period whenCJ was consumed. Specifically, Howatson et al. [2] foundpost-exercise IL-6 levels to be ~50% lower in marathonrunners supplemented with CJ (2 × 240 ml serve of CJdaily over 8 days; one serve contained ~600 mg of
Fig. 1 Levels of high sensitivity (a) Interleukin-6 (b) C-Reactive protein (c) Uric acid and (d) F2-Isoprostane on day 1 (D1), day 6 pre-exercise(D6pre), day 6 post-exercise (D6post). #Significantly different to (a) D6pre and D7 (b) D6pre and D6post; and (d) D6pre and D6post, time-pointsin both the CJ and PLA trials
Table 2 Mean (±SD) performance for Vertical Jump (VJ), Water Polo Intermittent Swim Test (WIST), Repeat Swim Test (RST) and10 m sprint for the cherry juice and placebo condition on day 1 and day 7Test variable Cherry juice Placebo
Day 1 Day 7 Day 1 Day 7
VJ Absolute (cm) 149 ± 7 150 ± 6 149 ± 6 150 ± 6
Decimal 10.0 ± 2.2 9.5 ± 2.0 9.9 ± 1.2 9.2 ± 1.7
WIST Distance (m) 655 ± 261 605 ± 239 643 ± 151 558 ± 203
BLa (mmol/L) 6.3 ± 1.8 4.2 ± 1.5a 5.2 ± 1.7 3.7 ± 1.4a
RST Total time (s) 37.09 ± 1.92 36.76 ± 0.75 36.90 ± 0.78 37.07 ± 1.16
Deficit time (s) 1.54 ± 0.70 1.50 ± 0.44 1.52 ± 0.61 1.56 ± 0.48
Decrement (%) 4.34 ± 1.97 4.25 ± 1.29 4.31 ± 1.81 4.58 ± 1.50
BLa (mmol/L) 4.2 ± 1.7 3.4 ± 0.7a 3.6 ± 0.6 3.3 ± 0.8a
10 m Sprint Total time (s) 5.56 ± 0.15 5.59 ± 0.22 5.48 ± 0.24 5.56 ± 0.15aSignificantly different to Day 1 of each trial
McCormick et al. Journal of the International Society of Sports Nutrition (2016) 13:41 Page 5 of 8
phenolic compounds and ~40 mg anthocyanins) whencompared to a PLA equivalent. Further, Bell, Walshe et al.[4] demonstrated that post-exercise IL-6 concentrationwas 200% lower in cyclists that were supplemented withCJ (2 × 30 ml of Cherry Active concentrate for 7 days) ascompared to PLA, following 3 consecutive days of a simu-lated cycling road race (daily duration of 101 min com-prising 66 sprints of various lengths ranging from 5 to15 s, 2 × 4 min and 1 × 5 min time-trials). Both studiesalso reported reduced oxidative damage following exer-cise when CJ was consumed; an outcome supported bysimilar findings following maximal eccentric exercise [6].To our knowledge, this is the first study examining the
effects of CJ supplementation on inflammation, oxidativestress and next-day performance in team-sport athletes.Contrary to our hypothesis (and previous research), thisstudy was unable to show a post-exercise attenuation incirculating levels of IL-6 and CRP, nor any influence onpost-exercise oxidative stress with supplementary CJ.Such findings may be linked to the magnitude of inflam-mation, oxidative stress and muscle damage inducedhere, potentially being substantially lower when com-pared to previous studies. Possibly, the mechanical straininduced by Water Polo activity is likely to have beenlower when compared to endurance running [2] or cyc-ling [4] efforts, as a result of the weight-supported andintermittent nature of the activity performed. In supportof this notion, Nieman et al. [17] suggested that themechanical trauma incurred during exercise significantlymodulates the magnitude of the inflammatory response;possibly explaining why post-exercise IL-6 levels havebeen reported ~40 times higher [2], and CRP levels re-ported ~6 times higher [4], than those reported after thesimulated Water Polo match completed here. Contraryto our results, these studies suggest that any activityresulting in high levels of inflammation or muscle dam-age, such as marathon running (where IL-6 and CRPwere ~50 and 35% lower with CJ, respectively [2]) or en-durance cycling (where IL-6 and CRP ~50 and 80%lower with CJ, respectively [4]), would still benefit fromCJ supplementation. However, the smaller degree of
inflammation induced in our participants could poten-tially have been inadequate to have benefitted from anyanti-inflammatory effects provided by the CJ supplemen-tation. Additionally, the activity profile of Water Polo issignificantly different to endurance exercise, consisting ofa more intermittent activity pattern where players com-monly perform ~100 sprint efforts of 7–14 s, interspersedby lower intensity activity over the duration of a match[18]. When related to markers of oxidative stress, the onlysomewhat comparable previous study adopted a high-intensity, intermittent cycling protocol (three sets of 9 ×5 s departing every 25 s) and observed a similar responsefor F2-IsoP [19]. Nevertheless, our results highlight thepossibility that any associated benefits of CJ on perform-ance/recovery may only be present in sports where substan-tially higher levels of inflammation and muscle damagemight occur. To this end, future research should examinethe efficacy of CJ supplementation on athletic performanceand recovery in running-based (weight-bearing) team sportssuch as football, netball, hockey or rugby.Reduced inflammation and oxidative stress post-
exercise allows for the maintenance of muscular func-tion and likely mitigates soreness, possibly explainingthe preservation and recovery of strength found in previ-ous studies where CJ was consumed [7]. That said, thelack of difference between the CJ and PLA groups onratings of DOMS and TQR in the current study arelikely due to the lack of inflammation and oxidativestress induced. These results are in contrast to thefindings of Connolly et al. [7], who found that when par-ticipants performed repeated maximal eccentric contrac-tions of their elbow flexors, the development of soreness(rated on a scale of 1 to 10) was significantly diminishedin the group supplemented with commercially availableCJ (~350 ml daily of Cherrypharm for a total of 8 days)as compared with the PLA. These authors also foundthat maximal isometric strength loss was attenuated inthe 96 h following the CJ supplementation (4% vs. 22%decrement for the CJ vs. PLA supplement, respectively).Of interest, our results concur with Howatson et al. [2],who found no significant differences in muscle sorenessin marathon runners that were supplemented with eitherCJ or a PLA. However, due to the aforementioned differ-ences in exercise modalities, duration, muscle damageand inflammatory response between activities, it is diffi-cult to make further definitive assumptions.Another potential explanation for our results may be
the dosage protocol employed. Anti-inflammatory andantioxidant effects have been found in marathon run-ners supplemented for 5 days before and 2 days after arace [2], and in cyclists supplemented for 4 days beforeand on each of 3 subsequent time-trial days [4]. Unlikethese studies that continued to supplement during theperformance and recovery periods, our participants
Table 3 Mean (±SD) perceived ratings of Total Quality ofRecovery (TQR) and Delayed Onset Muscle Soreness (DOMS) forthe cherry juice and placebo condition on day 1 to day 6
Cherry juice Placebo
TQR DOMS TQR DOMS
Day 1 16 ± 3 3 ± 2 15 ± 3 3 ± 2
Day 2 15 ± 4 3 ± 2 15 ± 3 4 ± 2
Day 3 15 ± 3 3 ± 2 17 ± 2 3 ± 2
Day 4 15 ± 3 3 ± 2 13 ± 4 4 ± 2
Day 5 15 ± 3 3 ± 2 15 ± 3 3 ± 2
Day 6 16 ± 4 3 ± 2 15 ± 3 4 ± 2
McCormick et al. Journal of the International Society of Sports Nutrition (2016) 13:41 Page 6 of 8
consumed their final CJ dose in the evening followingthe Water Polo match simulation (day 6) prior to theperformance testing (morning of day 7), as we wantedto specifically investigate next-day performance. Subse-quently, this may have influenced the recovery out-comes, since the levels of CRP often continue to rise toa peak at 24 h post-exercise [2, 4]. However, it is sug-gested that the supplementation duration (6 days) anddosage (90 ml of CJ concentrate daily) used here wouldhave been sufficient to show any potential benefits. Ourdosage was equivalent to 270 cherries and 820 mg ofanthocyanins daily (accounting for Water Polo playersbeing heavier than endurance athletes) as opposed toprevious investigations where performance benefitswere recorded equating to a lower dose of 120 cherriesand 80 mg of anthocyanins daily [2].A limitation of this investigation is that the anthocyanin
concentration of both the commercial and placebo sup-plement used was not confirmed. However, the concentra-tion of the active ingredient in the tart cherry juicesupplement used here has been previously published, andwas therefore used due to the positive results from thisresearch [4, 12]. Additionally, the placebo supplement wasselected because the manufacturer of these cordials sug-gest there was no known anthocyanin content in theirproducts. Furthermore, no blood analysis of supplementefficacy on increasing plasma anthocyanin levels was pos-sible here; however, adherence to supplement consumptionwas confirmed by direct investigator contact with athletesat every training session. Regardless, future research mustfurther consider these points moving forward.
ConclusionIn summary, CJ supplementation had no significant effecton the recovery of Water Polo specific athletic perform-ance. Unlike previous research, the current study showedno difference in anti-inflammatory or antioxidant activityin athletes supplemented with CJ compared with the PLA,thereby precluding any potential benefits to performanceor recovery in Water Polo players. As such, our resultssuggest that CJ supplementation may not be necessary forwater-based non-weight bearing intermittent sports suchas Water Polo. Regardless, future research should examinethe use of CJ in other running-based weight-bearing teamsports before CJ can be recommended or excluded as aneffective mechanism to improve recovery and next-dayteam sport performance.
AbbreviationsAU: Arbitrary units; BLa: Blood lactate; CJ: Cherry juice; CRP: C reactiveprotein; DOMS: Delayed onset muscle soreness; F2-Isop: F2-isoprostane; hsIL6: High sensitive Interleukin 6; PLA: Placebo; RPE: Rate of perceivedexertion; RST: Repeat sprint test; TQR: Total quality of recovery; UA: Uric acid;VJ: Vertical jump; WIST: Water Polo intermittent shuttle test
AcknowledgementsThe authors would also like to thank Mr Paul Oberman (Australian WaterPolo [Men] National Assistant Coach/WAIS Head Coach) and Mr AndrasJo-Kovacs (WAIS Assistant Water Polo Coach) for their assistance with thestudy design.
FundingThe authors wish to acknowledge the High Performance Sports ResearchFunds received from the Australian Institute of Sport and the AustralianSports Commission.
Availability of data and materialsThe datasets during and/or analysed during the current study available fromthe corresponding author on reasonable request.
Authors’ contributionsRM, PP, MB, BD, MS: Experimental design, data collection, interpretation offindings and manuscript preparation. All authors read and approved the finalmanuscript.
Competing interestThe authors declare that they have no competing interests.
Consent for publicationThis manuscript contains no identifiable individual data.
Ethics approval and consent to participateParticipants were provided with an information sheet outlining theprocedures, potential risks and benefits of the study prior to signing aninformed consent agreement to participate. Approval for the study wasobtained from the Human Research Ethics Committee at the University ofWestern Australia (RA/4/1/7380).
Author details1School of Sport Science, Exercise and Health, The University of WesternAustralia, Crawley, Western Australia, Australia. 2Western Australian Institute ofSport, Mt Claremont, Western Australia, Australia. 3School of Health Sciencesand Psychology, Federation University, Mt Helen, Victoria, Australia.
Received: 12 August 2016 Accepted: 25 October 2016
References1. Bell PG, McHugh M, Stevenson E, Howatson G. The role of cherries in
exercise and health. Scand J Med Sci Spor. 2014;24:477–90.2. Howatson G, McHugh MP, Hill JA, Brouner J, Jewell AP, Van Someren KA,
Howatson SA, Shave RE. Influence of tart cherry juice on indices of recoveryfollowing marathon running. Scand J Med Sci Spor. 2009;20:843–52.
3. Keuhl K, Perrier E. Efficacy of tart cherry juice in reducing muscle painduring running. J Int Soc Sports Nutr. 2010;7:17.
4. Bell PG, Walshe IH, Davison GW, Stevenson E, Howatson G. Montmorencycherries reduce the oxidative stress and inflammatory responses torepeated days high-intensity stochastic cycling. Nutrients. 2014;6:829–43.
5. Kelley DS, Rasooly R, Jacob RA, Kader AA, Mackey BE. Consumption of bingsweet cherries lowers circulating concentrations of inflammation markers inhealthy men and women. J Nutr. 2006;136:981–6.
6. Bowtell J, Sumners D, Dyer A, Fox P, Mileva K. Montmorency cherry juicereduces muscle damage caused by intensive strength exercise. Med SciSport Exer. 2011;43:1544–51.
7. Connolly D, McHugh M, Padilla-Zakour O. Efficacy of a tart cherry juiceblend in preventing the symptoms of muscle damage. Brit J Sport Med.2006;40:679–83.
8. Tan F, Polglaze T, Dawson B. Activity profiles and physical demands of elitewomen’s water polo match play. J Sport Sci. 2009;27:1095–104.
9. Tanner RK, Gore CJ, Australian Institute of Sport. Physiological tests for eliteathletes. 2nd ed. Champaign: Human Kinetics; 2013.
10. Tan F, Polglaze T, Dawson B. Comparison of progressive maximal swimmingtests in elite female Water Polo players. Int J Sport Physiol Perform. 2009;4:206–17.
11. Foster C, Daines E, Hector L, Snyder AC, Welsh R. Athletic performance inrelation to training load. Wisc Med J. 1996;95:370–4.
McCormick et al. Journal of the International Society of Sports Nutrition (2016) 13:41 Page 7 of 8

12. Tan F, Polglaze T, Cox G, Dawson B, Mujika I, Clark S. Effects of inducedalkalosis on simulated match performance in elite female water poloplayers. Int J Sport Nutr Exe. 2010;20:198.
13. Howatson G, Bell PG, Tallent J, Middleton B, McHugh MP, Ellis J. Effect oftart cherry juice (prunus cerasus) on melatonin levels and enhanced sleepquality. Eur J Nutr. 2012;51:909–16.
14. Kenttä G, Hassmén P. Overtraining and recovery. Sports Med. 1998;26:1–16.15. Hill DW, Richardson JD. Effectiveness of 10% trolamine salicylate cream on
muscular soreness induced by a reproducible program of weight training. JOrthop Sports Phys Ther. 1989;11:19–23.
16. White J, Dawson B, Landers G, Croft K, Peeling P. Effect of supplementaloxygen on post-exercise inflammatory response and oxidative stress. Eur JAppl Physiol. 2013;113:1059–67.
17. Nieman DC, Nehlsen-Cannarella SL, Fagoaga OR, Henson D, Utter A, DavisJM, Williams F, Butterworth DE. Influence of mode and carbohydrate on thecytokine response to heavy exertion. Med Sci Sports Exerc. 1998;30:671–8.
18. Smith HK. Applied physiology of water polo. Sports Med. 1998;26:317–34.19. Goods PS, Dawson B, Landers GJ, Gore CJ, Croft K, Peeling P. Effect of
repeat-sprint training in hypoxia on post-exercise interleukin-6 and f2-isoprostanes. Eur J Sport Sci. 2015;22:1–8.
• We accept pre-submission inquiries • Our selector tool helps you to find the most relevant journal• We provide round the clock customer support • Convenient online submission• Thorough peer review• Inclusion in PubMed and all major indexing services • Maximum visibility for your research
Submit your manuscript atwww.biomedcentral.com/submit
Submit your next manuscript to BioMed Central and we will help you at every step:
McCormick et al. Journal of the International Society of Sports Nutrition (2016) 13:41 Page 8 of 8

RESEARCH ARTICLE Open Access
Effects of powdered Montmorencytart cherry supplementation on acuteendurance exercise performance inaerobically trained individualsKyle Levers1, Ryan Dalton1†, Elfego Galvan1†, Abigail O’Connor1†, Chelsea Goodenough1†, Sunday Simbo1,Susanne U. Mertens-Talcott2, Christopher Rasmussen1, Mike Greenwood1, Steven Riechman3, Stephen Crouse4
and Richard B. Kreider1*
Abstract
Background: The purpose of this study was to determine whether short-term supplementation of a powderedtart cherry supplement prior to and following stressful endurance exercise would affect markers of muscle damage,inflammation, oxidative stress, and/or muscle soreness.
Methods: 27 endurance-trained runners or triathlete (21.8 ± 3.9 years, 15.0 ± 6.0 % body fat, 67.4 ± 11.8 kg) men(n = 18) and women (n = 9) were matched based on average reported race pace, age, body mass, and fat free mass.Subjects were randomly assigned to ingest, in a double-blind manner, capsules containing 480 mg of a rice flour placebo(P, n = 16) or powdered tart cherries [CherryPURE®] (TC, n= 11). Subjects supplemented one time daily (480 mg/day) for10-d, including race day, up to 48-hr post-run. Subjects completed a half-marathon run (21.1 km) under 2-hr (111.98 ± 11.9 min). Fasting blood samples and quadriceps muscle soreness ratings using an algometer with a graphic pain ratingscale were taken pre-run, 60-min, 24 and 48-h post-run and analyzed by MANOVA with repeated measures.
Results: Subjects in the TC group averaged 13 % faster half-marathon race finish times (p = 0.001) and tended to havesmaller deviations from predicted race pace (p = 0.091) compared to P. Attenuations in TC muscle catabolic markerswere reported over time for creatinine (p = 0.047), urea/blood urea nitrogen (p = 0.048), total protein (p = 0.081), andcortisol (p = 0.016) compared to P. Despite lower antioxidant activity pre-run in TC compared to P, changes frompre-run levels revealed a linear increase in antioxidant activity at 24 and 48-h of recovery in TC that was statisticallydifferent (16–39 %) from P and pre-run levels. Inflammatory markers were 47 % lower in TC compared to P over time(p = 0.053) coupled with a significant difference between groups (p = 0.017). Soreness perception between the groupswas different over time in the medial quadriceps (p = 0.035) with 34 % lower pre-run soreness in TC compared to P.Over the 48-h recovery period, P changes in medial quadriceps soreness from pre-run measures were smallercompared to TC.
Conclusion: Results revealed that short-term supplementation of Montmorency powdered tart cherries surroundingan endurance challenge attenuated markers of muscle catabolism, reduced immune and inflammatory stress, bettermaintained redox balance, and increased performance in aerobically trained individuals.
Keywords: Recovery, Antioxidants, Anti-inflammatory, Muscle damage
* Correspondence: [email protected]†Equal contributors1Department of Health and Kinesiology, Exercise and Sport NutritionLaboratory, Texas A&M University, College Station, TX 77843-4243, USAFull list of author information is available at the end of the article
© 2016 Levers et al. Open Access This article is distributed under the terms of the Creative Commons Attribution 4.0International License (http://creativecommons.org/licenses/by/4.0/), which permits unrestricted use, distribution, andreproduction in any medium, provided you give appropriate credit to the original author(s) and the source, provide a link tothe Creative Commons license, and indicate if changes were made. The Creative Commons Public Domain Dedication waiver(http://creativecommons.org/publicdomain/zero/1.0/) applies to the data made available in this article, unless otherwise stated.
Levers et al. Journal of the International Society of Sports Nutrition (2016) 13:22 DOI 10.1186/s12970-016-0133-z

BackgroundAcute bouts of strenuous aerobic exercise facilitate astress response characterized by mechanical muscle dam-age, oxidative stress, and inflammation that parallels thephysiological stress response associated with many adversetraumatic cardiovascular events and illnesses [1–3]. As aresult, this type of long duration mechanical muscle stressand high oxidative metabolic demand [4], significantlyincreases free radical production beyond the capacity ofthe endogenous antioxidant systems. Ultimately, this in-crease facilitates excessive cell damage, altered cell signal-ing [5–7], decreased cellular performance [5–8], lipidperoxidation, oxidation of proteins and glutathione, andsubsequent DNA damage [3, 9]. Exercise-induced musclesoreness is indirectly related to inflammation as a productof high nociceptor and mechanoreceptor sensitivity topotent metabolites released during muscular degeneration[10, 11].The use of antioxidant supplements, such as vitamins C
[12–15] and E [4, 14, 15], in athletic applications to helpfortify the body’s endogenous antioxidant response hasspurred some success. However, vitamins C and E (inde-pendently or in combination with N-acetylcysteine, β-carotene, or α-lipoic acid) remain controversial due to con-flicting reports of effectiveness [3, 16–19] with potentialpost-exercise pro-oxidant effects on muscle protein anab-olism [20–22], endogenous antioxidant capacity [22], andmitochondrial biogenesis [23].More recent nutritional research has focused on the
antioxidant effects of functional foods containing highconcentrations of phenolic compounds such as flavonoidsand anthocyanins. It is proposed that these may act syner-gistically with other compounds contained within the foodto provide an overall aerobic exercise recovery benefit [4,24]. A wide variety of antioxidant and polyphenol-containing functional foods such as grape extract [25],chokeberries [26], and blueberries [8] have shownperformance-enhancing and exercise recovery benefits.Exercise-based research with similar functional foodsspurred investigation with tart (e.g. Mortmorency) cherryconcentrate and juice supplementation to help increaseperformance by theoretically attenuating muscle damage,oxidative stress, and inflammation associated with aerobicchallenges [7].There are a few studies that have evaluated the effects of
tart cherry supplementation on responses to endurance-based exercise. The first endurance-based study investi-gated the effects of 8-d tart cherry cultivar-blended juicesupplementation on exercise-induced muscle pain sur-rounding an endurance relay race event (running distance= 22.5–31.4 km) [27]. Exercise-induced muscle pain wasreduced as a result of tart cherry supplementation, butthe findings were not confirmed by subsequent bloodmarker analysis [27]. Following a similar 8-d tart cherry
juice supplementation protocol, a second study reportedgreater lower body isometric strength and quicker restor-ation of muscular function with reduced blood markers ofmuscle damage, oxidative stress, and inflammation in re-sponse to a marathon run [28]. A third endurance studyexamined the effects of 7-d tart cherry concentrate sup-plementation on physiological markers of muscle damage,oxidative stress, and inflammation surrounding 3-d ofsimulated high-intensity road cycling [4]. Similar to thesecond study, reductions of oxidative and inflammatoryresponses were the primary findings, thereby demonstrat-ing a potential acute recovery-enhancing effect betweenbouts of high-intensity aerobic exercise with tart cherrysupplementation [4].The primary objective of this study was to determine
whether short-term (10-d) supplementation with a pow-dered form of tart cherry skins would facilitate greater aer-obic performance through attenuation of oxidative stress,inflammation, muscle damage, and muscle soreness.
MethodsSubjectsTwenty-seven male (n = 18) and female (n = 9) endurance-trained runners or triathletes (21.8 ± 3.9 years, 67.4 ±11.8 kg, 15.0 ± 6.0 % body fat, 51.2 ± 11.4 kg free fat mass)participated as subjects in this study. Subjects were re-cruited through paper and electronically distributed flyersat Texas A&M University. Entrance criteria required therunners or triathletes to have been involved in a consistentrunning program for at-least 1-year and able to run a half-marathon (21.1 km) in less than 2 h. Figure 1 provides abreakdown of the subject population. Subject discontinu-ation of participation was not related to any aspect of thesupplementation or testing protocol.All subjects signed informed consent documents and
the study was approved by the Texas A&M UniversityInstitutional Review Board prior to any data collection.Subjects were not allowed to participate in this study ifthey reported any of the following: 1) metabolic disordersor taking any thyroid, hyperlipidemic, hypoglycemic, anti-hypertensive, anti-inflammatory (e.g. NSAIDs), and/or an-drogenic medications; 2) history of hypertension, hepator-enal, musculoskeletal, autoimmune, and/or neurologicaldisease(s); and 3) allergy to cherries or any cherry compo-nents (e.g. polyphenols, anthocyanins, anthocyanidins).
Experimental designThe study was conducted in a randomized, double-blind,and placebo-controlled manner (see Fig. 2). All subjectscompleted a morning familiarization (FAM) session wherethey were provided detailed information regarding thestudy design, testing procedures, and supplementationprotocols. Informed consent, medical history, and endur-ance training history questionnaires were also completed
Levers et al. Journal of the International Society of Sports Nutrition (2016) 13:22 Page 2 of 23
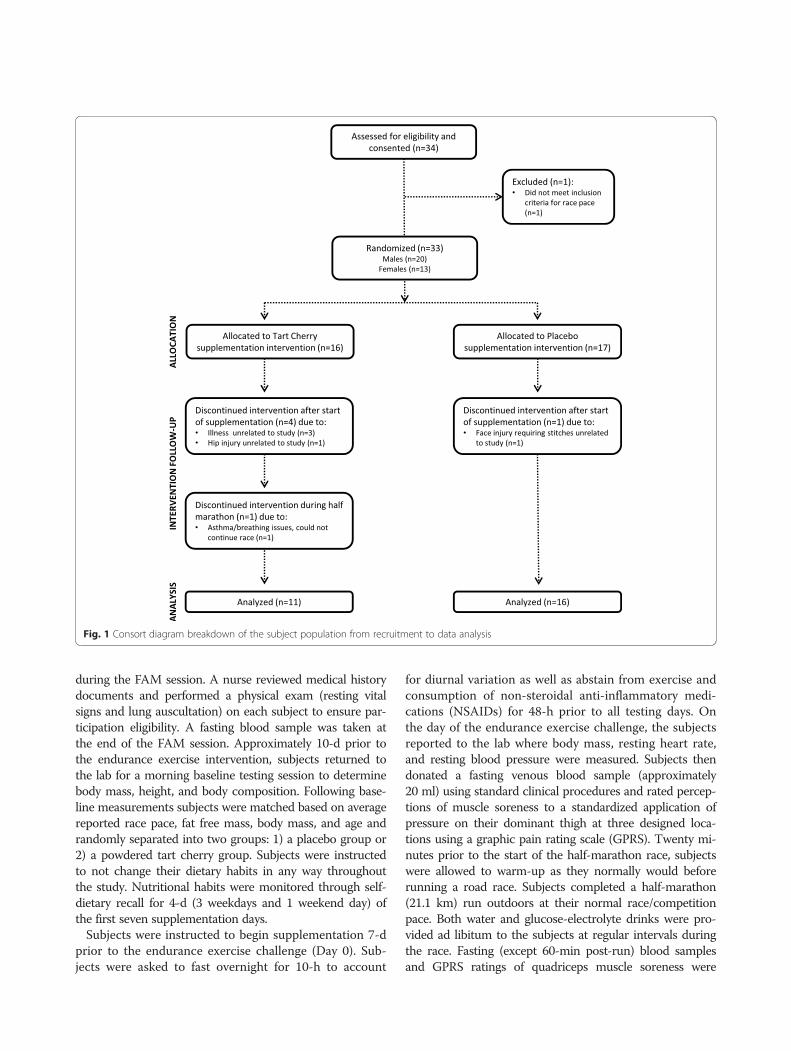
during the FAM session. A nurse reviewed medical historydocuments and performed a physical exam (resting vitalsigns and lung auscultation) on each subject to ensure par-ticipation eligibility. A fasting blood sample was taken atthe end of the FAM session. Approximately 10-d prior tothe endurance exercise intervention, subjects returned tothe lab for a morning baseline testing session to determinebody mass, height, and body composition. Following base-line measurements subjects were matched based on averagereported race pace, fat free mass, body mass, and age andrandomly separated into two groups: 1) a placebo group or2) a powdered tart cherry group. Subjects were instructedto not change their dietary habits in any way throughoutthe study. Nutritional habits were monitored through self-dietary recall for 4-d (3 weekdays and 1 weekend day) ofthe first seven supplementation days.Subjects were instructed to begin supplementation 7-d
prior to the endurance exercise challenge (Day 0). Sub-jects were asked to fast overnight for 10-h to account
for diurnal variation as well as abstain from exercise andconsumption of non-steroidal anti-inflammatory medi-cations (NSAIDs) for 48-h prior to all testing days. Onthe day of the endurance exercise challenge, the subjectsreported to the lab where body mass, resting heart rate,and resting blood pressure were measured. Subjects thendonated a fasting venous blood sample (approximately20 ml) using standard clinical procedures and rated percep-tions of muscle soreness to a standardized application ofpressure on their dominant thigh at three designed loca-tions using a graphic pain rating scale (GPRS). Twenty mi-nutes prior to the start of the half-marathon race, subjectswere allowed to warm-up as they normally would beforerunning a road race. Subjects completed a half-marathon(21.1 km) run outdoors at their normal race/competitionpace. Both water and glucose-electrolyte drinks were pro-vided ad libitum to the subjects at regular intervals duringthe race. Fasting (except 60-min post-run) blood samplesand GPRS ratings of quadriceps muscle soreness were
Fig. 1 Consort diagram breakdown of the subject population from recruitment to data analysis
Levers et al. Journal of the International Society of Sports Nutrition (2016) 13:22 Page 3 of 23

completed at 60-min, 24 and 48-h of post-run recovery.The last or tenth day of supplementation correlated with48-hours post-run recovery.
Exercise protocolHalf-marathon (21.1 km) runOn the morning of supplementation day 8, all subjectsperformed an outdoor half-marathon run (21.1 km) forbest time on a closed course under simulated race dayconditions. Race start (0800) conditions were: ambienttemperature = 22.8 °C, wind = 14.5 kph, humidity = 90 %,dew point = 21.1 °C. Conditions at the race finish (1030)were: ambient temperature = 25.0 °C, wind = 14.5 kph,humidity = 86 %. The race was run completely on con-crete and pavement surfaces. All subjects were given 20-minutes for individual warm-up routines. At regularintervals (4 total locations) throughout the race, fluids(water and/or glucose-electrolyte beverages) were madeavailable ad libitum to the subjects. Each subject hadtheir own water and glucose-electrolyte beverage bottlelabeled with a number that corresponded to their racenumber. All fluid bottles were weighed before and afterthe race to determine fluid consumption for each sub-ject. Official race splits and finish times were recordedby designated lab staff. Following the race, subjects werenot allowed to run to cool down, only stretching andminimal ambulation was permitted until the 60-minpost-run testing session.
Supplementation protocolSubjects were assigned in a double-blinded and random-ized manner to ingest a rice flour placebo (P, n = 16) orpowdered tart cherry (TC, n = 11). Subjects were matched
into one of the two groups according to average reportedrace pace from previous (within the last 1 year) raceevents, fat free mass, body mass, and age. Subjects wereinstructed to ingest one 480 mg supplement capsule onetime daily directly after breakfast at 0800 for 7-d prior to,the day of, and for 2-days following the half-marathonrace for a total supplementation timeline of 10-d. The tartcherry supplements contained 480 mg of freeze driedMontmorency tart cherry skin powder derived from tartcherry skins obtained after juicing (CherryPURE™ FreezeDried Tart Cherry Powder, Shoreline Fruit, LLC, Trans-verse City, MI, USA). Prior analytical testing conducted in2012 by Advanced Laboratories (Salt Lake City, UT, USA)demonstrated that 31 mL (10.5 fl oz) of tart cherry juiceprovides approximately 600 mg of phenolic compoundsand 40 mg of anthocyanins, which is equivalent to consum-ing 290 mg of CherryPURE™. Using the same comparison,the 480 mg CherryPURE™ supplement provided in thecurrent study would be equivalent to 51.3 mL (17.4 fl oz) oftart cherry juice providing 991 mg of phenolic compoundsand 66 mg of anthocyanins. The supplements were pre-pared for distribution by Shoreline Fruit, LLC and sent toAdvanced Laboratories (Salt Lake City, UT, USA) to quan-tify the nutritional contents of the powdered tart cherrysupplements. Both supplements were prepared in capsulesidentical in taste and appearance. The supplements werepackaged in generic bottles by Shoreline Fruit, LLC fordouble blind administration.
ProceduresDietary inventoriesWithin the first 7-d of supplementation, subjects wereinstructed to record all food and fluid intake over a 4-d
Fig. 2 Experimental study design. DEXA dual-energy X-Ray absorptiometer, MVC maximal voluntary contraction, 1-RM 1-repetition maximum, NSAIDnon-steroidal anti-inflammatory drugs, GPRS graphic pain rating scale, 7-d 7-day, 48-h 48-hour
Levers et al. Journal of the International Society of Sports Nutrition (2016) 13:22 Page 4 of 23

period (3 weekdays, 1 weekend day). Dietary inventorieswere then reviewed by a registered dietician and analyzedfor average daily energy (total kilocalories), macronutrient(protein, fat, and carbohydrates), and dietary antioxidant(vitamins C and E, and β-carotene) intake using ESHAFood Processor (Version 8.6) Nutritional Analysis software(ESHA Research Inc., Salem, OR, USA).
Anthropometrics and Body compositionAt the beginning of every testing session, subjects hadtheir height and body mass measured according to stand-ard procedures using a Healthometer Professional 500KL(Pelstar LLC, Alsip, IL, USA) self-calibrating digital scalewith an accuracy of ±0.02 kg. Whole body bone densityand body composition measures (excluding cranium) weredetermined with a Hologic Discovery W Dual-Energy X-ray Absorptiometer (DEXA; Hologic Inc., Waltham, MA,USA) equipped with APEX Software (APEX CorporationSoftware, Pittsburg, PA, USA) by using procedures previ-ously described [29]. Mean test-retest reliability studiesperformed on male athletes in our lab with this DEXAmachine have revealed mean coefficients of variation fortotal bone mineral content and total fat free/soft tissuemass of 0.31–0.45 % with a mean intraclass correlation of0.985 [30]. On the day of each test, the equipment was cal-ibrated following the manufacturer’s guidelines for qualityassurance.
Muscle soreness perception assessmentPressure application to the three specified areas of thequadriceps muscle group on each subject’s dominant legwas standardized to 50 N of pressure using a handheldCommander Algometer (JTECH Medical, Salt Lake City,UT, USA). The standard amount of pressure was appliedto the vastus lateralis at both 25 and 50 % of the distancebetween the superior border of the patella to the greatertrochanter of the femur at the hip and to the vastus medalisat 25 % of the distance between the aforementioned land-marks. These three specific locations were measured andmarked with a permanent marker on each subject duringthe baseline muscle soreness perception measurementbefore the half-marathon race. The subjects were asked tomaintain these three marked locations between testingsessions to avoid error with secondary measurement. Thesubject was seated in a reclined supine position and giventhe algometer GPRS sheet to evaluate the perception ofmuscle soreness at each of the three quadriceps locations.The order of pressure application was standardized acrossall sessions and subjects: 25 % VM, 25 % VL, and 50 % VL.The 50 N of pressure was applied to a relaxed quadricepsat each of the three locations using the algometer for aperiod of 3-sec to give the subject enough time to recordtheir soreness evaluation on the GPRS. Perceptions ofmuscle soreness were recorded by measuring the distance
(centimeters) of the participant mark on the GPRS from0 cm (no pain). Reliability statistical analyses revealed amean intraclass correlation of 0.909.
Blood collectionSubjects donated approximately four teaspoons (20 mL) ofvenous blood after a 10-h fast from an antecubital veinusing standard phlebotomy procedures. Blood sampleswere collected in two 7.5 mL BD Vacutainer® serum separ-ation tubes (Becton, Dickinson and Company, FranklinLakes, NJ, USA), left at room temperature for 15-min, andthen centrifuged at 3500 rpm for 10-min using a standard,refrigerated (4 °C) bench top Thermo Scientific HeraeusMegaFuge 40R Centrifuge (Thermo Electron North AmericaLLC, West Palm Beach, FL, USA). Serum supernatant wasremoved and stored at −80 °C in polypropylene microcen-trifuge tubes for later analysis. The multiple serum micro-centrifuge tubes for each subject was allocated for a specificgroup of assays and thawed only once during analysis.Blood was also collected in a single 3.5 mL BD Vacutainer®containing K2 EDTA (Becton, Dickinson and Company,Franklin Lakes, NJ, USA), left at room temperature for 15-min, and refrigerated for approximately 3–4 h beforecomplete blood count analysis.
Clinical chemistry analysisWhole blood samples were analyzed for complete bloodcount with platelet differentials (hemoglobin, hematocrit,red blood cell counts (RBC), white blood cell counts(WBC), lymphocytes, granulocytes (GRAN), and mid-rangeabsolute count (MID) using a Abbott Cell Dyn 1800 (Ab-bott Laboratories, Abbott Park, IL, USA) automatedhematology analyzer. The internal quality control forAbbott Cell Dyn 1800 was performed using three levels ofmanufacturer control fluids to calibrate acceptable standarddeviation (SD) and coefficients of variation (CV) values forall aforementioned analytes. Samples were re-run if theobserved values were outside control values and/or clinicalnorms according to standard procedures. Reliability statis-tical analyses revealed a mean intraclass correlation of0.729 across all measures. Serum samples were analyzedusing a Cobas c111 (Roche Diagnostics GmbH, Indianapo-lis, IN, USA) automated clinical chemistry analyzer thatwas calibrated according to manufacturer guidelines. Thisanalyzer has been known to be highly valid and reliable inpreviously published reports [31]. Each serum sample wasassayed for a standard partial metabolic panel [(aspartateaminotransferase (AST), alanine aminotransferase (ALT),and total bilirubin)] and clinical markers of protein andfatty acid metabolism [(uric acid, creatinine, blood ureanitrogen (BUN), BUN:creatinine ratio, total protein, andcreatine kinase (CK)]. The internal quality control for theCobas c111 was performed using two levels of manufac-turer control fluids to calibrate acceptable SD and CV
Levers et al. Journal of the International Society of Sports Nutrition (2016) 13:22 Page 5 of 23
values for all aforementioned assays. Samples were re-run ifthe observed values were outside control values and/orclinical norms according to standard procedures. Reliabilitystatistical analyses revealed a mean intraclass correlation of0.793 across all measures.
Markers of anabolic/catabolic hormone statusSerum samples were assayed using standard commerciallyavailable enzyme-linked immunosorbent assay kits (ELI-SAs) for cortisol and testosterone (ALPCO Diagnostics,Salem, NH, USA). Serum concentrations were determinedcalorimetrically using a BioTek ELX-808 Ultramicroplatereader (BioTek Instruments Inc., Winooski, VT, USA) at anoptical density of 450 nm against a known standard curveusing manufacturer recommended procedures. Sampleswere run in duplicate according to standard procedures.Test to test variability of performing these assays yieldedaverage CV values for the aforementioned markers of:CORT (±6.85 %), and TEST (±4.47 %) with a test retestcorrelation for the same markers of: CORT (r = 0.92),TEST (r = 0.98).
Markers of oxidative stressSerum samples were assayed using standard commerciallyavailable ELISA kits for Superoxide Dismutase (SOD Activ-ity Assay kit), Total Antioxidant Status (TAS, AntioxidantAssay kit), Thiobarbituric Acid Reactive Substance (TBARS,Malondialdehyde-MDA, TCA method kit) (Cayman Chem-ical Company, Ann Arbor, MI, USA), and Nitrotyrosine(ALPCO Diagnostics, Salem, NH, USA). Serum concentra-tions for SOD and Nitrotyrosine were determined calori-metrically using a BioTek ELX-808 Ultramicroplate reader(BioTek Instruments Inc., Winooski, VT, USA) at an opticaldensity of 450 nm against a known standard curve usingstandard procedures, while TAS serum concentrations wereanalyzed calorimetrically at 405 nm. Lastly, serum concen-trations for TBARS were determined fluorometrically usinga SpectraMax Gemini multimode plate reader (MolecularDevices LLC, Sunnyvale, CA, USA) at an excitation wave-length of 530 nm and an emission wavelength of 550 nmagainst a known standard curve using standard procedures.Samples were run in duplicate according to standard proce-dures. Test to test variability of performing these assaysyielded average CV values for the aforementioned markersof: SOD (±8.35 %), TAS (±14.24 %), TBARS (±8.30 %),and NT (±10.03 %) with a test retest correlation for thesame markers of: SOD (r = 0.83), TAS (r = 0.85), TBARS(r = 0.94), and NT (r = 0.99).
Cytokine/Chemokine markers of inflammationSerum markers of inflammation [(interleukin-1β (IL-1β),IL-2, IL-4, IL-5, IL-6, IL-7, IL-8, IL-10, IL-12p70, IL-13,tumor necrosis factor-α (TNF-α), interferon-γ (IFN-γ), andgranulocyte-macrophage colony-stimulating factor (GM-
CSF)] were measured by using a commercially availableMilliplex MAP 13-Plex Human High Sensitivity T-CellMagnetic Bead Panel kit (EMD Millipore Corporation, St.Charles, MO, USA). A minimum of 100 positive beads foreach cytokine/chemokine was acquired with a LuminexMagPix instrument (Luminex Corporation, Austin, TX,USA). Samples were run in duplicate according to standardprocedures. Test to test variability of performing these as-says yielded an average CV value range of ±4.26 to ±6.05 %for the aforementioned markers with an average test retestcorrelation of r = 0.99 for the same markers.
Statistical analysisIndividual group and time data are presented throughoutas means (± SD), while group effects are presented asmeans (± SEM). All related variables were grouped andanalyzed using repeated measures MANOVA in IBMSPSS Statistics Software version 22.0 for Windows (IBMCorporation, Armonk, NY, USA). Half-marathon finishtime was also used as a covariate in subsequent ANCOVAanalyses to determine if previously reported statistical out-comes were attributed to running intensity or to supple-mentation. Post-hoc LSD pairwise comparisons were usedto analyze any significance among groups where neededwith Cohen’s d calculations employed to determine effectmagnitude. Data were considered statistically significantwhen the probability of error was less than 0.05 and con-sidered to be trending when the probability of error wasbetween 0.05 and 0.10.
ResultsSubject characteristicsA total of 27 healthy, endurance trained or triathlete men(n = 18) and women (n = 9) completed the study protocol.Participant demographic data are presented in Table 1.One-way ANOVA revealed no significant differences(p >0.05) in baseline demographic or anthropometricmarkers.
Nutritional intake and complianceTable 2 lists relevant nutrition components analyzed in the4-d dietary recall. P tended to consume a smaller amountof average daily calories compared to TC (31.0 kcal/kg vs.37.4 kcal/kg, p = 0.094). This differential is likely duedropped subjects (see Fig. 1) causing a greater proportionof females in P (nf = 3/11, 27.3 %) versus TC (nf = 6/16,37.5 %). When stratifying the statistical dietary analysis bygender within each group, average daily calorie (p = 0.44)and dietary carbohydrate (p = 0.64) consumption was thesame across groups. No other statistically significant inter-actions were observed across groups with respect to dietaryintake.
Levers et al. Journal of the International Society of Sports Nutrition (2016) 13:22 Page 6 of 23
Half-marathon performance measuresTable 3 presents half-marathon split and finish times inaddition to projected versus actual average race paces.There was no difference in projected race finish timesbetween groups (p = 0.304). TC subjects had faster half-marathon split (p = 0.002) and race finish times (p = 0.001)corresponding to a quicker overall race pace compared toP. The actual race pace was slower compared to the pro-jected race pace in both groups (p <0.001), but the differ-ence tended to be smaller (p = 0.091) in TC compared toP. Due to the significant difference in race performance,half-marathon finish time was used as a covariate in sub-sequent ANCOVA analyses to determine if other statis-tical outcomes were attributed to running intensity or tosupplementation.
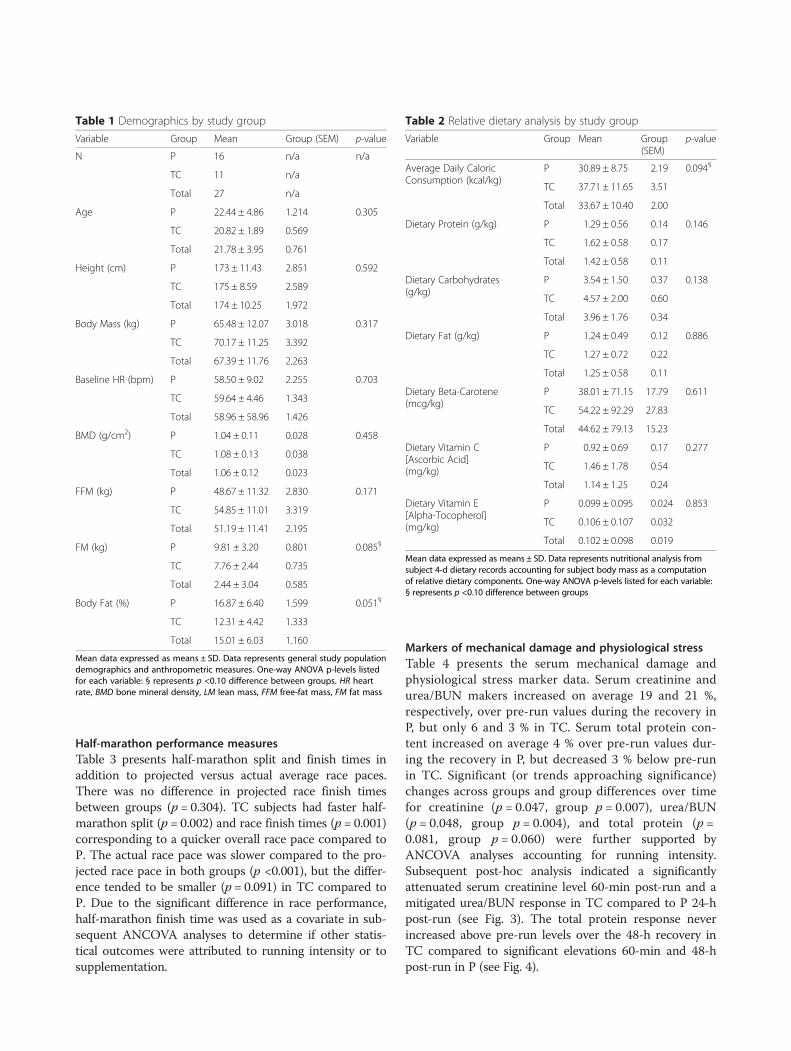
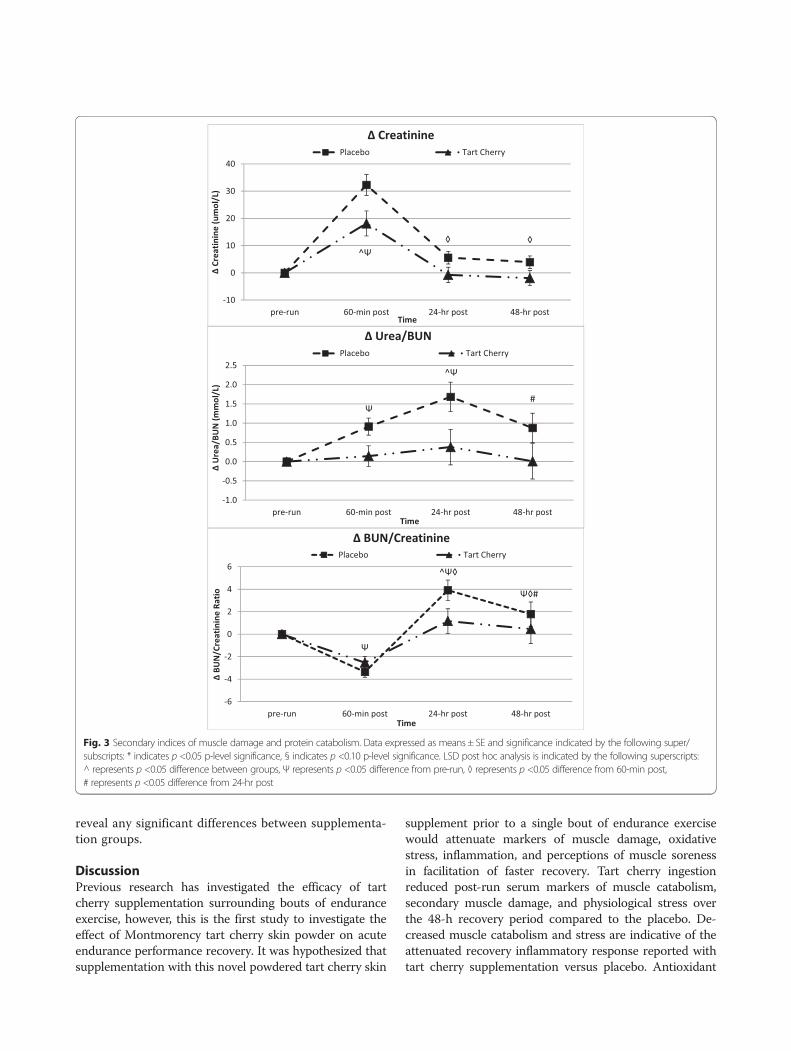
Markers of mechanical damage and physiological stressTable 4 presents the serum mechanical damage andphysiological stress marker data. Serum creatinine andurea/BUN makers increased on average 19 and 21 %,respectively, over pre-run values during the recovery inP, but only 6 and 3 % in TC. Serum total protein con-tent increased on average 4 % over pre-run values dur-ing the recovery in P, but decreased 3 % below pre-runin TC. Significant (or trends approaching significance)changes across groups and group differences over timefor creatinine (p = 0.047, group p = 0.007), urea/BUN(p = 0.048, group p = 0.004), and total protein (p =0.081, group p = 0.060) were further supported byANCOVA analyses accounting for running intensity.Subsequent post-hoc analysis indicated a significantlyattenuated serum creatinine level 60-min post-run and amitigated urea/BUN response in TC compared to P 24-hpost-run (see Fig. 3). The total protein response neverincreased above pre-run levels over the 48-h recovery inTC compared to significant elevations 60-min and 48-hpost-run in P (see Fig. 4).
Table 1 Demographics by study groupVariable Group Mean Group (SEM) p-value
N P 16 n/a n/a
TC 11 n/a
Total 27 n/a
Age P 22.44 ± 4.86 1.214 0.305
TC 20.82 ± 1.89 0.569
Total 21.78 ± 3.95 0.761
Height (cm) P 173 ± 11.43 2.851 0.592
TC 175 ± 8.59 2.589
Total 174 ± 10.25 1.972
Body Mass (kg) P 65.48 ± 12.07 3.018 0.317
TC 70.17 ± 11.25 3.392
Total 67.39 ± 11.76 2.263
Baseline HR (bpm) P 58.50 ± 9.02 2.255 0.703
TC 59.64 ± 4.46 1.343
Total 58.96 ± 58.96 1.426
BMD (g/cm2) P 1.04 ± 0.11 0.028 0.458
TC 1.08 ± 0.13 0.038
Total 1.06 ± 0.12 0.023
FFM (kg) P 48.67 ± 11.32 2.830 0.171
TC 54.85 ± 11.01 3.319
Total 51.19 ± 11.41 2.195
FM (kg) P 9.81 ± 3.20 0.801 0.085§
TC 7.76 ± 2.44 0.735
Total 2.44 ± 3.04 0.585
Body Fat (%) P 16.87 ± 6.40 1.599 0.051§
TC 12.31 ± 4.42 1.333
Total 15.01 ± 6.03 1.160
Mean data expressed as means ± SD. Data represents general study populationdemographics and anthropometric measures. One-way ANOVA p-levels listedfor each variable: § represents p <0.10 difference between groups. HR heartrate, BMD bone mineral density, LM lean mass, FFM free-fat mass, FM fat mass
Table 2 Relative dietary analysis by study groupVariable Group Mean Group
(SEM)p-value
Average Daily CaloricConsumption (kcal/kg)
P 30.89 ± 8.75 2.19 0.094§
TC 37.71 ± 11.65 3.51
Total 33.67 ± 10.40 2.00
Dietary Protein (g/kg) P 1.29 ± 0.56 0.14 0.146
TC 1.62 ± 0.58 0.17
Total 1.42 ± 0.58 0.11
Dietary Carbohydrates(g/kg)
P 3.54 ± 1.50 0.37 0.138
TC 4.57 ± 2.00 0.60
Total 3.96 ± 1.76 0.34
Dietary Fat (g/kg) P 1.24 ± 0.49 0.12 0.886
TC 1.27 ± 0.72 0.22
Total 1.25 ± 0.58 0.11
Dietary Beta-Carotene(mcg/kg)
P 38.01 ± 71.15 17.79 0.611
TC 54.22 ± 92.29 27.83
Total 44.62 ± 79.13 15.23
Dietary Vitamin C[Ascorbic Acid](mg/kg)
P 0.92 ± 0.69 0.17 0.277
TC 1.46 ± 1.78 0.54
Total 1.14 ± 1.25 0.24
Dietary Vitamin E[Alpha-Tocopherol](mg/kg)
P 0.099 ± 0.095 0.024 0.853
TC 0.106 ± 0.107 0.032
Total 0.102 ± 0.098 0.019
Mean data expressed as means ± SD. Data represents nutritional analysis fromsubject 4-d dietary records accounting for subject body mass as a computationof relative dietary components. One-way ANOVA p-levels listed for each variable:§ represents p <0.10 difference between groups
Levers et al. Journal of the International Society of Sports Nutrition (2016) 13:22 Page 7 of 23
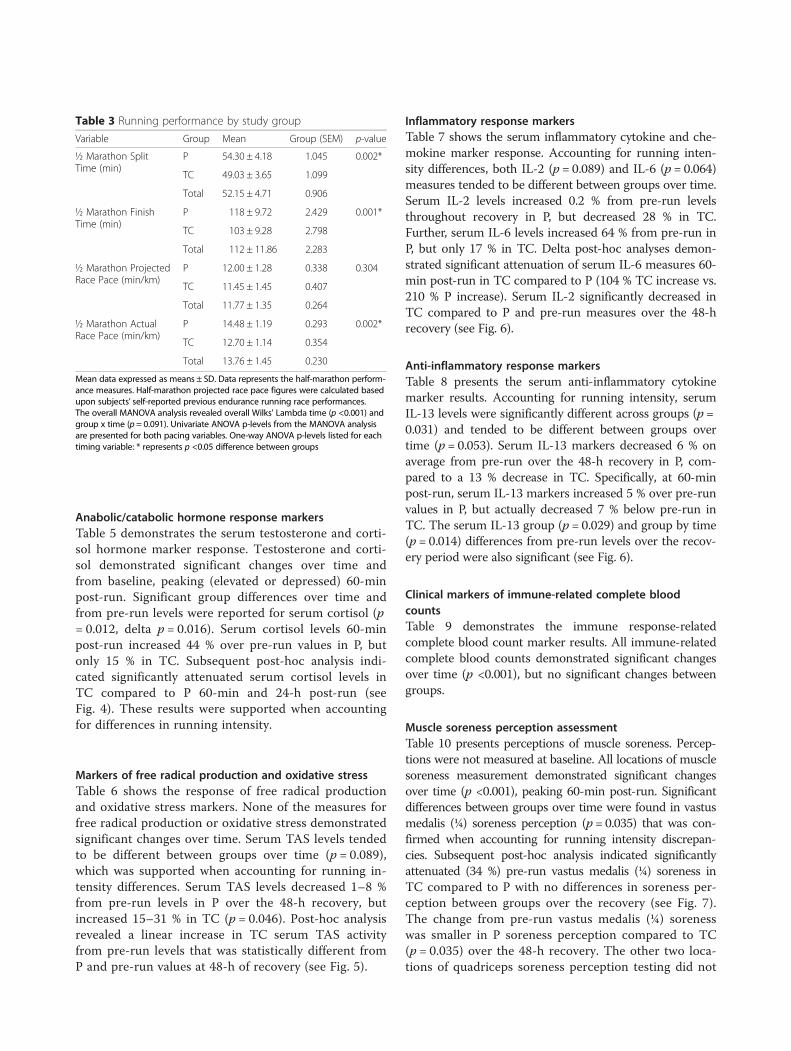
Anabolic/catabolic hormone response markersTable 5 demonstrates the serum testosterone and corti-sol hormone marker response. Testosterone and corti-sol demonstrated significant changes over time andfrom baseline, peaking (elevated or depressed) 60-minpost-run. Significant group differences over time andfrom pre-run levels were reported for serum cortisol (p= 0.012, delta p = 0.016). Serum cortisol levels 60-minpost-run increased 44 % over pre-run values in P, butonly 15 % in TC. Subsequent post-hoc analysis indi-cated significantly attenuated serum cortisol levels inTC compared to P 60-min and 24-h post-run (seeFig. 4). These results were supported when accountingfor differences in running intensity.
Markers of free radical production and oxidative stressTable 6 shows the response of free radical productionand oxidative stress markers. None of the measures forfree radical production or oxidative stress demonstratedsignificant changes over time. Serum TAS levels tendedto be different between groups over time (p = 0.089),which was supported when accounting for running in-tensity differences. Serum TAS levels decreased 1–8 %from pre-run levels in P over the 48-h recovery, butincreased 15–31 % in TC (p = 0.046). Post-hoc analysisrevealed a linear increase in TC serum TAS activityfrom pre-run levels that was statistically different fromP and pre-run values at 48-h of recovery (see Fig. 5).
Inflammatory response markersTable 7 shows the serum inflammatory cytokine and che-mokine marker response. Accounting for running inten-sity differences, both IL-2 (p = 0.089) and IL-6 (p = 0.064)measures tended to be different between groups over time.Serum IL-2 levels increased 0.2 % from pre-run levelsthroughout recovery in P, but decreased 28 % in TC.Further, serum IL-6 levels increased 64 % from pre-run inP, but only 17 % in TC. Delta post-hoc analyses demon-strated significant attenuation of serum IL-6 measures 60-min post-run in TC compared to P (104 % TC increase vs.210 % P increase). Serum IL-2 significantly decreased inTC compared to P and pre-run measures over the 48-hrecovery (see Fig. 6).
Anti-inflammatory response markersTable 8 presents the serum anti-inflammatory cytokinemarker results. Accounting for running intensity, serumIL-13 levels were significantly different across groups (p =0.031) and tended to be different between groups overtime (p = 0.053). Serum IL-13 markers decreased 6 % onaverage from pre-run over the 48-h recovery in P, com-pared to a 13 % decrease in TC. Specifically, at 60-minpost-run, serum IL-13 markers increased 5 % over pre-runvalues in P, but actually decreased 7 % below pre-run inTC. The serum IL-13 group (p = 0.029) and group by time(p = 0.014) differences from pre-run levels over the recov-ery period were also significant (see Fig. 6).
Clinical markers of immune-related complete bloodcountsTable 9 demonstrates the immune response-relatedcomplete blood count marker results. All immune-relatedcomplete blood counts demonstrated significant changesover time (p <0.001), but no significant changes betweengroups.
Muscle soreness perception assessmentTable 10 presents perceptions of muscle soreness. Percep-tions were not measured at baseline. All locations of musclesoreness measurement demonstrated significant changesover time (p <0.001), peaking 60-min post-run. Significantdifferences between groups over time were found in vastusmedalis (¼) soreness perception (p = 0.035) that was con-firmed when accounting for running intensity discrepan-cies. Subsequent post-hoc analysis indicated significantlyattenuated (34 %) pre-run vastus medalis (¼) soreness inTC compared to P with no differences in soreness per-ception between groups over the recovery (see Fig. 7).The change from pre-run vastus medalis (¼) sorenesswas smaller in P soreness perception compared to TC(p = 0.035) over the 48-h recovery. The other two loca-tions of quadriceps soreness perception testing did not
Table 3 Running performance by study groupVariable Group Mean Group (SEM) p-value
½ Marathon SplitTime (min)
P 54.30 ± 4.18 1.045 0.002*
TC 49.03 ± 3.65 1.099
Total 52.15 ± 4.71 0.906
½ Marathon FinishTime (min)
P 118 ± 9.72 2.429 0.001*
TC 103 ± 9.28 2.798
Total 112 ± 11.86 2.283
½ Marathon ProjectedRace Pace (min/km)
P 12.00 ± 1.28 0.338 0.304
TC 11.45 ± 1.45 0.407
Total 11.77 ± 1.35 0.264
½ Marathon ActualRace Pace (min/km)
P 14.48 ± 1.19 0.293 0.002*
TC 12.70 ± 1.14 0.354
Total 13.76 ± 1.45 0.230
Mean data expressed as means ± SD. Data represents the half-marathon perform-ance measures. Half-marathon projected race pace figures were calculated basedupon subjects’ self-reported previous endurance running race performances.The overall MANOVA analysis revealed overall Wilks’ Lambda time (p <0.001) andgroup x time (p = 0.091). Univariate ANOVA p-levels from the MANOVA analysisare presented for both pacing variables. One-way ANOVA p-levels listed for eachtiming variable: * represents p <0.05 difference between groups
Levers et al. Journal of the International Society of Sports Nutrition (2016) 13:22 Page 8 of 23

Table 4 Markers of muscle catabolism, Secondary muscle damage, and Physiological stressVariable Group Baseline Pre-Run 60-min Post 24-hr Post 48-hr Post Group Mean p-value (GG) p-value (WSC) RFT Covariate
p-value (WSC)
AST (U/L) P 32.69 ± 33.67 26.62 ± 14.97 37.20 ± 17.36 50.52 ± 22.96 43.33 ± 16.68 38.07 ± 3.98 G = 0.911 G = 0.402
TC 29.46 ± 10.54 26.30 ± 7.48 36.96 ± 9.68 49.97 ± 31.12 44.14 ± 24.60 37.37 ± 4.80 T = 0.002* TL = 0.005* Tq = 0.593
Time Mean 31.08 ± 5.27 26.46 ± 2.45 37.08 ± 2.89†Ψ 50.25 ± 5.20†Ψ◊ 43.74 ± 3.96†Ψ# G X T = 0.859 G X Tq = 0.740 G X TL = 0.707
ALT (U/L) P 22.09 ± 13.55 20.32 ± 7.15 23.65 ± 8.04 26.42 ± 7.36 28.53 ± 8.02 24.20 ± 2.15 G = 0.576 G = 0.057§
TC 23.06 ± 8.22 23.13 ± 10.39 AM ± 10.22 27.94 ± 14.22 30.07 ± 14.80 26.11 ± 2.59 T = 0.008* TL = 0.006* Tq = 0.677
Time Mean 22.57 ± 2.29 21.73 ± 1.68 25.01 ± 1.76Ψ 27.18 ± 2.09Ψ◊ 29.30 ± 2.20†Ψ◊# G X T = 0.842 G X Tq = 0.603 G X TL = 0.869
Total Billirubin (umol/L) P 9.01 ± 2.87 8.15 ± 3.03 13.03 ± 4.68 8.44 ± 4.06 7.65 ± 3.45 9.25 ± 0.76 G = 0.756 G = 0.614
TC 8.71 ± 4.64 7.60 ± 3.75 11.65 ± 4.50 8.99 ± 4.22 7.46 ± 2.75 8.88 ± 0.91 T <0.001* Tq = 0.001* Tq = 0.484
Time Mean 8.86 ± 0.72 7.88 ± 0.65 12.34 ± 0.90†Ψ 8.71 ± 0.81◊ 7.55 ± 0.62◊ G X T = 0.699 G X TL = 0.694 G X Tq = 0.591
Urea/BUN (mmol/L) P 4.75 ± 1.08 5.45 ± 1.36 6.36 ± 1.14 7.13 ± 1.15 6.33 ± 1.44 6.00 ± 0.21 G = 0.857 G = 0.426
TC 5.11 ± 0.69 6.02 ± 1.17 6.16 ± 1.01 6.40 ± 1.44 6.03 ± 1.58 5.94 ± 0.26 T <0.001* TL <0.001* TL = 0.026*
Time Mean 4.93 ± 0.19 5.74 ± 0.25† 6.26 ± 0.21†Ψ 6.77 ± 0.25†Ψ 6.18 ± 0.29†# G X T = 0.144 G X TL = 0.095§ G X TL = 0.014*
Creatinine (umol/L) P 71.71 ± 15.07 74.29 ± 11.54 106.56 ± 15.45†Ψ 79.85 ± 10.88†◊ 78.20 ± 11.17† 82.12 ± 3.12 G = 0.651 G = 0.522
TC 77.20 ± 15.93 82.29 ± 13.96 100.44 ± 25.52†Ψ 81.54 ± 15.08◊ 80.34 ± 12.72 84.36 ± 3.77 T <0.001* Tq <0.001* TL = 0.007*
Time Mean 74.45 ± 3.02 78.29 ± 2.46 103.50 ± 3.94†Ψ 80.70 ± 2.49†◊ 79.27 ± 2.31◊ G X T = 0.087§ G X TL = 0.246 G X TL = 0.010*
BUN/CreatinineRatio
P 16.60 ± 3.05 18.58 ± 5.58 15.22 ± 4.38 22.49 ± 4.61 20.36 ± 5.29 18.65 ± 0.90 G = 0.589 G = 0.329
TC 16.97 ± 3.87 18.33 ± 3.50 15.80 ± 3.53 19.50 ± 3.61 18.79 ± 5.26 17.88 ± 1.09 T <0.001* TL = 0.001* Tq = 0.240
Time Mean 16.75 ± 3.34 18.48 ± 4.77 15.46 ± 3.99Ψ 21.27 ± 4.41†Ψ◊ 19.72 ± 5.23†◊# G X T = 0.158 G X TL = 0.140 G X TL = 0.103§
Uric Acid (umol/L) P 271 ± 46 292 ± 44 373 ± 48 321 ± 48 308 ± 47 313 ± 11 G = 0.789 G = 0.724
TC 290 ± 50 308 ± 52 364 ± 64 326 ± 82 302 ± 65 318 ± 14 T <0.001* Tq <0.001* TL = 0.014*
Time Mean 280 ± 9 300 ± 9† 369 ± 11†Ψ 324 ± 13†Ψ◊ 305 ± 11†◊# G X T = 0.444 G X TL = 0.188 G X TL = 0.015*
CK (U/L) P 606 ± 1696 276 ± 510 532 ± 627 907 ± 683 593 ± 525 583 ± 144 G = 0.626 G = 0.806
TC 298 ± 317 228 ± 191 474 ± 253 870 ± 771 490 ± 395 472 ± 173 T = 0.036* TL = 0.139 Tq = 0.836
Time Mean 452 ± 260 252 ± 81 503 ± 100Ψ 889 ± 141Ψ◊ 541 ± 93Ψ# G X T = 0.680 G X Tq = 0.416 G X Tq = 0.599
Total Protein (mmol/L) P 67.51 ± 8.56 72.93 ± 5.41† 76.78 ± 4.95† 70.77 ± 5.35◊ 80.21 ± 6.48†Ψ# 73.64 ± 0.87 G = 0.746 G = 0.846
TC 68.70 ± 8.06 76.28 ± 4.78† 74.94 ± 8.85† 67.83 ± 4.52◊ 78.20 ± 6.84†# 73.19 ± 1.05 T < 0.001* TL <0.001* TL = 0.008*
Time Mean 68.11 ± 1.64 74.61 ± 1.01† 75.86 ± 1.33† 69.30 ± 0.99Ψ◊ 79.20 ± 1.30†Ψ◊# G X T = 0.316 G X TL = 0.066§ G X TL = 0.004*
Individual group and time data expressed as means ± SD, while group effects are presented as means ± SEM. Data represents the response to muscle catabolism, mechanical damage, and physiological stress at eachtesting session during the 10 day intervention. MANOVA analysis revealed overall Wilks’ Lambda time (p <0.001) and group x time (p = 0.504). Univariate ANOVA p-levels from MANOVA analysis are presented for eachvariable. Univariate ANOVA p-levels are listed first by the Greenhouse-Geisser (GG) analysis and then by the within-subjects contrasts (WSC) to demonstrate the potential shape of the time or group x time interactionwith significance indicated by the following super/subscripts: *indicates p <0.05 p-level significance, §indicates p <0.10 p-level significance. LSD post hoc analysis is indicated by the following superscripts: † representsp <0.05 difference from baseline value, Ψ represents p <0.05 difference from pre-run, ◊ represents p <0.05 difference from 60-min post, # represents p <0.05 difference from 24-hr post. AST aspartate aminotransferase,ALT alanine aminotransferase, BUN blood urea nitrogen, CK creatine kinase, RFT race finish time, G group p-level, T time p-level, G x T interaction, q quadratic p-level, L linear p-level
Leverset
al.JournaloftheInternationalSociety
ofSportsNutrition
(2016) 13:22 Page
9of23
reveal any significant differences between supplementa-tion groups.
DiscussionPrevious research has investigated the efficacy of tartcherry supplementation surrounding bouts of enduranceexercise, however, this is the first study to investigate theeffect of Montmorency tart cherry skin powder on acuteendurance performance recovery. It was hypothesized thatsupplementation with this novel powdered tart cherry skin
supplement prior to a single bout of endurance exercisewould attenuate markers of muscle damage, oxidativestress, inflammation, and perceptions of muscle sorenessin facilitation of faster recovery. Tart cherry ingestionreduced post-run serum markers of muscle catabolism,secondary muscle damage, and physiological stress overthe 48-h recovery period compared to the placebo. De-creased muscle catabolism and stress are indicative of theattenuated recovery inflammatory response reported withtart cherry supplementation versus placebo. Antioxidant
Fig. 3 Secondary indices of muscle damage and protein catabolism. Data expressed as means ± SE and significance indicated by the following super/subscripts: * indicates p <0.05 p-level significance, § indicates p <0.10 p-level significance. LSD post hoc analysis is indicated by the following superscripts:^ represents p <0.05 difference between groups, Ψ represents p <0.05 difference from pre-run, ◊ represents p <0.05 difference from 60-min post,# represents p <0.05 difference from 24-hr post
Levers et al. Journal of the International Society of Sports Nutrition (2016) 13:22 Page 10 of 23

activity in those who ingested tart cherry was greater thanthe placebo, particularly 24 and 48-h post-run. Despiteincreases in actual over projected race pace times in bothgroups, the tart cherry group demonstrated smaller pacedifferences compared to placebo. Medial quadriceps sore-ness in tart cherry supplementers was significantly lowerpre-run compared to those ingesting the placebo. How-ever, results indicated a smaller change from pre-run med-ial quadriceps soreness in placebo supplementers over the48-h recovery period compared to the tart cherry group.Examining subject endurance performance, the increase
in actual versus projected race pace irrespective of group islikely attributed to the 10-h fast and blood draw on the dayof the endurance exercise challenge that would have notbeen experienced prior to any other race. The apparentbeneficial effect of tart cherry powder supplementation onendurance performance through a decrease in race comple-tion time is consistent with some of the previously pub-lished findings. Nieman et al. conducted a study in young,healthy males with 2-wk of quercetin supplementation(1000 mg/day) versus placebo [32]. Following a 12-mintreadmill running trial at a 15 % grade and self-selectedspeed, Nieman et al. reported a significantly greater pre-
supplementation versus post-supplementation change indistance covered with quercetin supplementation versusplacebo [32]. The polyphenol content of a fruit-derivedsupplement similar to tart cherry was proven beneficialafter extended supplementation in a study conducted byKang et al. on regular endurance exercisers [33]. Kang et al.demonstrated that 30-d supplementation of oligomerizedlychee fruit extract significantly elevated both submaximalrunning time and anaerobic threshold compared to a vita-min C/E mixture and a placebo [33].Attenuation of muscle catabolism and secondary markers
of muscle damage following prolonged endurance exercisephysiologically provides the body optimal conditions forquicker recovery in preparation for subsequent perform-ance bouts. Studying trained endurance runners, Kratzet al. [34] analyzed hemodynamic clinical chemistry makersbefore, 4 and 24-h post-Boston marathon. The results ofdemonstrated significant increases in total CK, AST, ALT,total protein, uric acid, total bilirubin, BUN, and creatinine4-h post-race and confirmed significant elevations in CK,BUN, creatinine, uric acid, ALT, and AST over pre-racevalues 24-h post-race [34]. Bell et al. [35], in an acuteendurance study following a combination of cycling sprints
Fig. 4 Markers of protein catabolism and physiological stress. Data expressed as means ± SE and significance indicated by the following super/subscripts: * indicates p <0.05 p-level significance, § indicates p <0.10 p-level significance. LSD post hoc analysis is indicated by the followingsuperscripts: ^ represents p <0.05 difference between groups, Ψ represents p <0.05 difference from pre-run, ◊ represents p <0.05 difference from60-min post, # represents p <0.05 difference from 24-hr post
Levers et al. Journal of the International Society of Sports Nutrition (2016) 13:22 Page 11 of 23
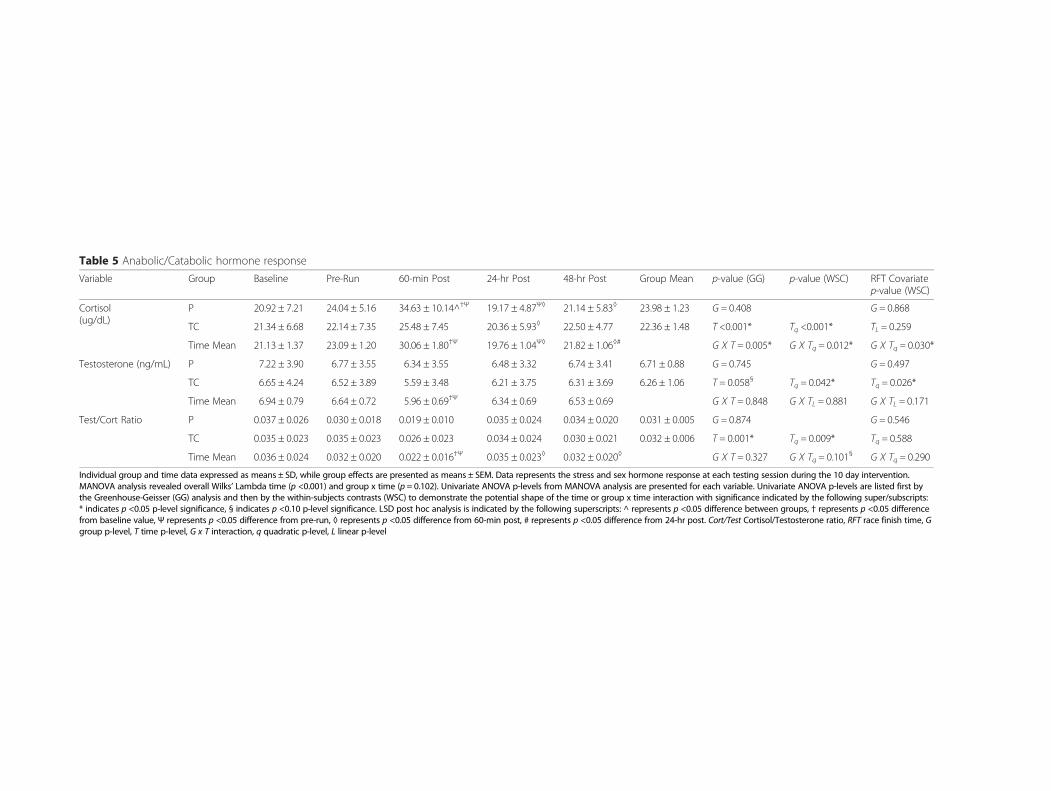
Table 5 Anabolic/Catabolic hormone responseVariable Group Baseline Pre-Run 60-min Post 24-hr Post 48-hr Post Group Mean p-value (GG) p-value (WSC) RFT Covariate
p-value (WSC)
Cortisol(ug/dL)
P 20.92 ± 7.21 24.04 ± 5.16 34.63 ± 10.14^†Ψ 19.17 ± 4.87Ψ◊ 21.14 ± 5.83◊ 23.98 ± 1.23 G = 0.408 G = 0.868
TC 21.34 ± 6.68 22.14 ± 7.35 25.48 ± 7.45 20.36 ± 5.93◊ 22.50 ± 4.77 22.36 ± 1.48 T <0.001* Tq <0.001* TL = 0.259
Time Mean 21.13 ± 1.37 23.09 ± 1.20 30.06 ± 1.80†Ψ 19.76 ± 1.04Ψ◊ 21.82 ± 1.06◊# G X T = 0.005* G X Tq = 0.012* G X Tq = 0.030*
Testosterone (ng/mL) P 7.22 ± 3.90 6.77 ± 3.55 6.34 ± 3.55 6.48 ± 3.32 6.74 ± 3.41 6.71 ± 0.88 G = 0.745 G = 0.497
TC 6.65 ± 4.24 6.52 ± 3.89 5.59 ± 3.48 6.21 ± 3.75 6.31 ± 3.69 6.26 ± 1.06 T = 0.058§ Tq = 0.042* Tq = 0.026*
Time Mean 6.94 ± 0.79 6.64 ± 0.72 5.96 ± 0.69†Ψ 6.34 ± 0.69 6.53 ± 0.69 G X T = 0.848 G X TL = 0.881 G X TL = 0.171
Test/Cort Ratio P 0.037 ± 0.026 0.030 ± 0.018 0.019 ± 0.010 0.035 ± 0.024 0.034 ± 0.020 0.031 ± 0.005 G = 0.874 G = 0.546
TC 0.035 ± 0.023 0.035 ± 0.023 0.026 ± 0.023 0.034 ± 0.024 0.030 ± 0.021 0.032 ± 0.006 T = 0.001* Tq = 0.009* Tq = 0.588
Time Mean 0.036 ± 0.024 0.032 ± 0.020 0.022 ± 0.016†Ψ 0.035 ± 0.023◊ 0.032 ± 0.020◊ G X T = 0.327 G X Tq = 0.101§ G X Tq = 0.290
Individual group and time data expressed as means ± SD, while group effects are presented as means ± SEM. Data represents the stress and sex hormone response at each testing session during the 10 day intervention.MANOVA analysis revealed overall Wilks’ Lambda time (p <0.001) and group x time (p = 0.102). Univariate ANOVA p-levels from MANOVA analysis are presented for each variable. Univariate ANOVA p-levels are listed first bythe Greenhouse-Geisser (GG) analysis and then by the within-subjects contrasts (WSC) to demonstrate the potential shape of the time or group x time interaction with significance indicated by the following super/subscripts:* indicates p <0.05 p-level significance, § indicates p <0.10 p-level significance. LSD post hoc analysis is indicated by the following superscripts: ^ represents p <0.05 difference between groups, † represents p <0.05 differencefrom baseline value, Ψ represents p <0.05 difference from pre-run, ◊ represents p <0.05 difference from 60-min post, # represents p <0.05 difference from 24-hr post. Cort/Test Cortisol/Testosterone ratio, RFT race finish time, Ggroup p-level, T time p-level, G x T interaction, q quadratic p-level, L linear p-level
Leverset
al.JournaloftheInternationalSociety
ofSportsNutrition
(2016) 13:22 Page
12of23
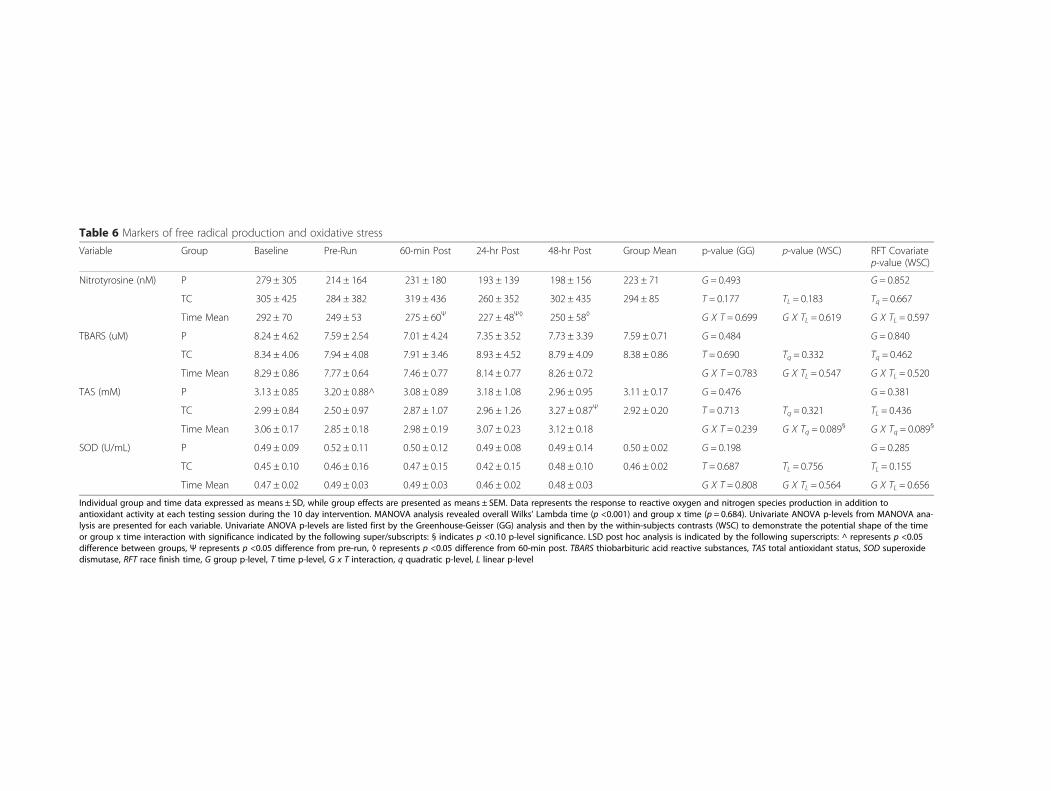
Table 6 Markers of free radical production and oxidative stressVariable Group Baseline Pre-Run 60-min Post 24-hr Post 48-hr Post Group Mean p-value (GG) p-value (WSC) RFT Covariate
p-value (WSC)
Nitrotyrosine (nM) P 279 ± 305 214 ± 164 231 ± 180 193 ± 139 198 ± 156 223 ± 71 G = 0.493 G = 0.852
TC 305 ± 425 284 ± 382 319 ± 436 260 ± 352 302 ± 435 294 ± 85 T = 0.177 TL = 0.183 Tq = 0.667
Time Mean 292 ± 70 249 ± 53 275 ± 60Ψ 227 ± 48Ψ◊ 250 ± 58◊ G X T = 0.699 G X TL = 0.619 G X TL = 0.597
TBARS (uM) P 8.24 ± 4.62 7.59 ± 2.54 7.01 ± 4.24 7.35 ± 3.52 7.73 ± 3.39 7.59 ± 0.71 G = 0.484 G = 0.840
TC 8.34 ± 4.06 7.94 ± 4.08 7.91 ± 3.46 8.93 ± 4.52 8.79 ± 4.09 8.38 ± 0.86 T = 0.690 Tq = 0.332 Tq = 0.462
Time Mean 8.29 ± 0.86 7.77 ± 0.64 7.46 ± 0.77 8.14 ± 0.77 8.26 ± 0.72 G X T = 0.783 G X TL = 0.547 G X TL = 0.520
TAS (mM) P 3.13 ± 0.85 3.20 ± 0.88^ 3.08 ± 0.89 3.18 ± 1.08 2.96 ± 0.95 3.11 ± 0.17 G = 0.476 G = 0.381
TC 2.99 ± 0.84 2.50 ± 0.97 2.87 ± 1.07 2.96 ± 1.26 3.27 ± 0.87Ψ 2.92 ± 0.20 T = 0.713 Tq = 0.321 TL = 0.436
Time Mean 3.06 ± 0.17 2.85 ± 0.18 2.98 ± 0.19 3.07 ± 0.23 3.12 ± 0.18 G X T = 0.239 G X Tq = 0.089§ G X Tq = 0.089§
SOD (U/mL) P 0.49 ± 0.09 0.52 ± 0.11 0.50 ± 0.12 0.49 ± 0.08 0.49 ± 0.14 0.50 ± 0.02 G = 0.198 G = 0.285
TC 0.45 ± 0.10 0.46 ± 0.16 0.47 ± 0.15 0.42 ± 0.15 0.48 ± 0.10 0.46 ± 0.02 T = 0.687 TL = 0.756 TL = 0.155
Time Mean 0.47 ± 0.02 0.49 ± 0.03 0.49 ± 0.03 0.46 ± 0.02 0.48 ± 0.03 G X T = 0.808 G X TL = 0.564 G X TL = 0.656
Individual group and time data expressed as means ± SD, while group effects are presented as means ± SEM. Data represents the response to reactive oxygen and nitrogen species production in addition toantioxidant activity at each testing session during the 10 day intervention. MANOVA analysis revealed overall Wilks’ Lambda time (p <0.001) and group x time (p = 0.684). Univariate ANOVA p-levels from MANOVA ana-lysis are presented for each variable. Univariate ANOVA p-levels are listed first by the Greenhouse-Geisser (GG) analysis and then by the within-subjects contrasts (WSC) to demonstrate the potential shape of the timeor group x time interaction with significance indicated by the following super/subscripts: § indicates p <0.10 p-level significance. LSD post hoc analysis is indicated by the following superscripts: ^ represents p <0.05difference between groups, Ψ represents p <0.05 difference from pre-run, ◊ represents p <0.05 difference from 60-min post. TBARS thiobarbituric acid reactive substances, TAS total antioxidant status, SOD superoxidedismutase, RFT race finish time, G group p-level, T time p-level, G x T interaction, q quadratic p-level, L linear p-level
Leverset
al.JournaloftheInternationalSociety
ofSportsNutrition
(2016) 13:22 Page
13of23
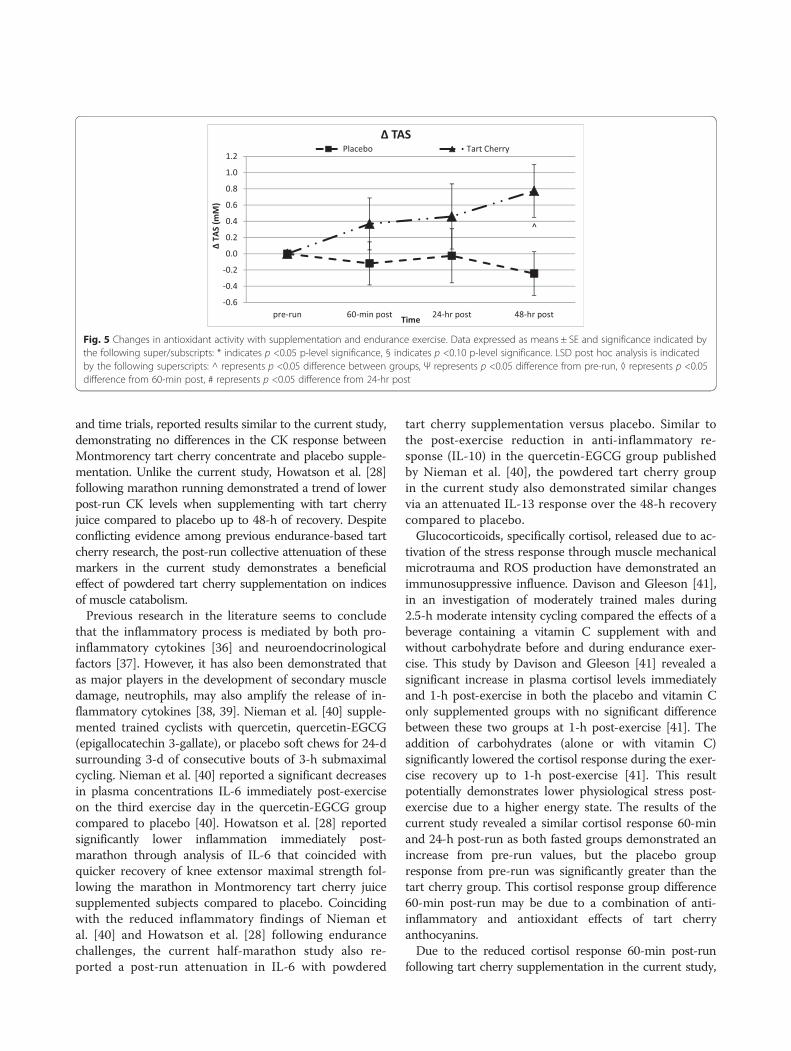
and time trials, reported results similar to the current study,demonstrating no differences in the CK response betweenMontmorency tart cherry concentrate and placebo supple-mentation. Unlike the current study, Howatson et al. [28]following marathon running demonstrated a trend of lowerpost-run CK levels when supplementing with tart cherryjuice compared to placebo up to 48-h of recovery. Despiteconflicting evidence among previous endurance-based tartcherry research, the post-run collective attenuation of thesemarkers in the current study demonstrates a beneficialeffect of powdered tart cherry supplementation on indicesof muscle catabolism.Previous research in the literature seems to conclude
that the inflammatory process is mediated by both pro-inflammatory cytokines [36] and neuroendocrinologicalfactors [37]. However, it has also been demonstrated thatas major players in the development of secondary muscledamage, neutrophils, may also amplify the release of in-flammatory cytokines [38, 39]. Nieman et al. [40] supple-mented trained cyclists with quercetin, quercetin-EGCG(epigallocatechin 3-gallate), or placebo soft chews for 24-dsurrounding 3-d of consecutive bouts of 3-h submaximalcycling. Nieman et al. [40] reported a significant decreasesin plasma concentrations IL-6 immediately post-exerciseon the third exercise day in the quercetin-EGCG groupcompared to placebo [40]. Howatson et al. [28] reportedsignificantly lower inflammation immediately post-marathon through analysis of IL-6 that coincided withquicker recovery of knee extensor maximal strength fol-lowing the marathon in Montmorency tart cherry juicesupplemented subjects compared to placebo. Coincidingwith the reduced inflammatory findings of Nieman etal. [40] and Howatson et al. [28] following endurancechallenges, the current half-marathon study also re-ported a post-run attenuation in IL-6 with powdered
tart cherry supplementation versus placebo. Similar tothe post-exercise reduction in anti-inflammatory re-sponse (IL-10) in the quercetin-EGCG group publishedby Nieman et al. [40], the powdered tart cherry groupin the current study also demonstrated similar changesvia an attenuated IL-13 response over the 48-h recoverycompared to placebo.Glucocorticoids, specifically cortisol, released due to ac-
tivation of the stress response through muscle mechanicalmicrotrauma and ROS production have demonstrated animmunosuppressive influence. Davison and Gleeson [41],in an investigation of moderately trained males during2.5-h moderate intensity cycling compared the effects of abeverage containing a vitamin C supplement with andwithout carbohydrate before and during endurance exer-cise. This study by Davison and Gleeson [41] revealed asignificant increase in plasma cortisol levels immediatelyand 1-h post-exercise in both the placebo and vitamin Conly supplemented groups with no significant differencebetween these two groups at 1-h post-exercise [41]. Theaddition of carbohydrates (alone or with vitamin C)significantly lowered the cortisol response during the exer-cise recovery up to 1-h post-exercise [41]. This resultpotentially demonstrates lower physiological stress post-exercise due to a higher energy state. The results of thecurrent study revealed a similar cortisol response 60-minand 24-h post-run as both fasted groups demonstrated anincrease from pre-run values, but the placebo groupresponse from pre-run was significantly greater than thetart cherry group. This cortisol response group difference60-min post-run may be due to a combination of anti-inflammatory and antioxidant effects of tart cherryanthocyanins.Due to the reduced cortisol response 60-min post-run
following tart cherry supplementation in the current study,
Fig. 5 Changes in antioxidant activity with supplementation and endurance exercise. Data expressed as means ± SE and significance indicated bythe following super/subscripts: * indicates p <0.05 p-level significance, § indicates p <0.10 p-level significance. LSD post hoc analysis is indicatedby the following superscripts: ^ represents p <0.05 difference between groups, Ψ represents p <0.05 difference from pre-run, ◊ represents p <0.05difference from 60-min post, # represents p <0.05 difference from 24-hr post
Levers et al. Journal of the International Society of Sports Nutrition (2016) 13:22 Page 14 of 23

Table 7 Pro-inflammatory cytokines and chemokinesVariable Group Baseline Pre-Run 60-min Post 24-hr Post 48-hr Post Group Mean p-value (GG) p-value (WSC) RFT Covariate
p-value (WSC)
TNF-α (pg/mL) P 2.34 ± 1.23 2.74 ± 1.22 3.02 ± 1.55 2.48 ± 1.04 2.49 ± 0.90 2.61 ± 0.26 G = 0.922 G = 0.654
TC 2.49 ± 0.98 2.82 ± 0.90 2.93 ± 1.36 2.60 ± 0.91 2.42 ± 0.82 2.65 ± 0.31 T = 0.003* Tq = 0.003* TL = 0.156
Time Mean 2.40 ± 1.12 2.77 ± 1.08† 2.98 ± 1.45† 2.53 ± 0.97Ψ◊ 2.46 ± 0.85Ψ◊ G X T = 0.779 G X TL = 0.504 G X TL = 0.151
IFN-γ (pg/mL) P 7.67 ± 6.52 8.02 ± 7.77 8.73 ± 9.49 7.36 ± 7.15 7.75 ± 7.78 7.91 ± 2.55 G = 0.382 G = 0.570
TC 10.96 ± 11.44 10.71 ± 9.14 11.51 ± 12.50 12.47 ± 17.61 11.68 ± 15.42 11.47 ± 3.08 T = 0.604 Tq = 0.184 TL = 0.424
Time Mean 9.01 ± 8.81 9.12 ± 8.29 9.86 ± 10.67 9.44 ± 12.46 9.35 ± 11.41 G X T = 0.388 G X TL = 0.456 G X Tq = 0.461
IL-1β (pg/mL) P 0.67 ± 0.15 0.85 ± 0.21 0.84 ± 0.19 0.75 ± 0.20 0.69 ± 0.16 0.76 ± 0.08 G = 0.059§ G = 0.058§
TC 0.93 ± 0.51 1.12 ± 0.58 1.05 ± 0.39 0.98 ± 0.44 0.93 ± 0.40 1.00 ± 0.09 T <0.001* Tq <0.001* TL = 0.559
Time Mean 0.78 ± 0.36 0.96 ± 0.42† 0.92 ± 0.30† 0.85 ± 0.33Ψ◊ 0.79 ± 0.30Ψ◊ G X T = 0.860 G X Tq = 0.662 G X TL = 0.465
IL-2 (pg/mL) P 1.18 ± 0.96 1.33 ± 1.10 1.51 ± 1.38 1.23 ± 0.85 1.27 ± 0.94 1.30 ± 0.28 G = 0.939 G = 0.786
TC 1.17 ± 1.20 1.64 ± 2.18 1.32 ± 0.99 1.12 ± 1.01 1.11 ± 1.06 1.27 ± 0.34 T = 0.070§ Tq = 0.001* TL = 0.293
Time Mean 1.17 ± 1.04 1.46 ± 1.60† 1.43 ± 1.22† 1.18 ± 0.90◊ 1.21 ± 0.97◊ G X T = 0.290 G X TL = 0.195 G X TL = 0.089§
IL-6 (pg/mL) P 0.63 ± 0.54^ 0.75 ± 0.53^ 2.33 ± 1.38†Ψ 0.69 ± 0.44^◊ 0.68 ± 0.43 1.02 ± 0.19 G = 0.017* G = 0.509
TC 0.94 ± 1.00 1.14 ± 1.27† 2.32 ± 1.69†Ψ 0.89 ± 0.97Ψ◊ 0.79 ± 0.76Ψ 1.21 ± 0.23 T <0.001* Tq <0.001* Tq = 0.648
Time Mean 0.76 ± 0.76 0.91 ± 0.90† 2.33 ± 1.48†Ψ 0.77 ± 0.69Ψ◊ 0.72 ± 0.58Ψ◊ G X T = 0.550 G X TL = 0.053§ G X TL = 0.064§
IL-8 (pg/mL) P 2.74 ± 1.58 2.84 ± 1.29 6.21 ± 3.51 2.94 ± 1.24 2.52 ± 1.01 3.45 ± 0.4 G = 0.002* G = 0.637
TC 3.31 ± 1.87 3.24 ± 1.71 5.39 ± 2.78 3.26 ± 2.08 2.74 ± 1.47 3.59 ± 0.49 T <0.001* Tq <0.001* Tq = 0.185
Time Mean 2.98 ± 1.69 3.00 ± 1.46 5.88 ± 3.20† 3.07 ± 1.61◊ 2.61 ± 1.20Ψ◊# G X T = 0.287 G X Tq = 0.269 G X Tq = 0.166
IL-12p70(pg/mL)
P 1.79 ± 1.83 1.84 ± 1.75 1.95 ± 1.93 1.70 ± 1.56 1.81 ± 1.93 1.82 ± 0.42 G = 0.009* G = 0.706
TC 1.54 ± 1.78 1.59 ± 1.52 1.75 ± 1.93 1.34 ± 1.29 1.27 ± 1.12 1.50 ± 0.51 T = 0.012* Tq = 0.008* Tq = 0.893
Time Mean 1.69 ± 1.78 1.74 ± 1.63 1.87 ± 1.89† 1.55 ± 1.44Ψ◊ 1.59 ± 1.65Ψ◊ G X T = 0.310 G X Tq = 0.124 G X Tq = 0.167
Individual group and time data expressed as means ± SD, while group effects are presented as means ± SEM. Data represents the pro-inflammatory response at each testing session during the 10 day intervention.MANOVA analysis revealed overall Wilks’ Lambda time (p <0.001) and group x time (p = 0.302). Univariate ANOVA p-levels from MANOVA analysis are presented for each variable. Univariate ANOVA p-levels are listedfirst by the Greenhouse-Geisser (GG) analysis and then by the within-subjects contrasts (WSC) to demonstrate the potential shape of the time or group x time interaction with significance indicated by the followingsuper/subscripts: * indicates p <0.05 p-level significance, § indicates p <0.10 p-level significance. LSD post hoc analysis is indicated by the following superscripts: ^ represents p <0.05 difference between groups, †represents p <0.05 difference from baseline value, Ψ represents p <0.05 difference from pre-run, ◊ represents p <0.05 difference from 60-min post, # represents p <0.05 difference from 24-hr post. TNF-α tumor necrosisfactor alpha, IFN-γ interferon gamma, IL interleukin, RFT race finish time, G group p-level, T time p-level, G x T interaction, q quadratic p-level, L linear p-level
Leverset
al.JournaloftheInternationalSociety
ofSportsNutrition
(2016) 13:22 Page
15of23

it is likely that this anthocyanin-rich supplementation maymodulate endogenous cytokine secretion following stressfulexercise challenges. An acute supplementation study pro-viding moderately active subjects with 48 g of anthocyanin-rich black currant extract immediately surrounding a singlebout of high-intensity rowing conducted by Lyall et al. [42]demonstrated a significant post-exercise attenuation of pro-inflammatory cytokine production from LPS-stimulatedcells. Lyall et al. [42] postulated from subsequent in vitroexperimentation that this reduced cytokine production may
have resulted from anthocyanin-based inhibition of NF-κB-mediated mechanisms. In the current study, attenuated IL-6 and serum cortisol levels during post-run recovery in tartcherry supplementers compared to placebo, demonstrates apotential relationship between the perception of physio-logical stress, regulation of anti-inflammatory cytokines,and cortisol release through NF-κB-mediation.The attenuation muscle catabolic indices in the current
study may also be partially attributed to an improvedpost-run redox balance with tart cherry supplementation
Fig. 6 Influence of supplementation and endurance exercise on markers of the inflammatory and anti-inflammatory response. Data expressedas means ± SE and significance indicated by the following super/subscripts: * indicates p <0.05 p-level significance, § indicates p <0.10 p-levelsignificance. LSD post hoc analysis is indicated by the following superscripts: ^ represents p <0.05 difference between groups, Ψ representsp <0.05 difference from pre-run, ◊ represents p <0.05 difference from 60-min post, # represents p <0.05 difference from 24-hr post
Levers et al. Journal of the International Society of Sports Nutrition (2016) 13:22 Page 16 of 23

Table 8 Anti-inflammatory cytokinesVariable Group Baseline Pre-Run 60-min Post 24-hr Post 48-hr Post Group Mean p-value (GG) p-value (WSC) RFT Covariate
p-value (WSC)
IL-4 (pg/mL) P 4.57 ± 2.02 5.51 ± 2.31 5.20 ± 2.15 4.02 ± 1.49 4.21 ± 1.63 4.70 ± 1.28 G = 0.304 G = 0.165
TC 6.93 ± 8.98 8.71 ± 11.72 6.65 ± 6.37 5.41 ± 5.13 6.38 ± 7.03 6.82 ± 1.55 T = 0.012* Tq = 0.012* TL = 0.309
Time Mean 5.53 ± 5.89 6.82 ± 7.64 5.79 ± 4.34 4.59 ± 3.45Ψ◊ 5.09 ± 4.66Ψ◊# G X T = 0.320 G X Tq = 0.189 G X TL = 0.189
IL-5 (pg/mL) P 0.57 ± 0.37 0.63 ± 0.42 0.66 ± 0.47 0.66 ± 0.46 0.61 ± 0.40 0.62 ± 0.14 G = 0.102§ G = 0.013*
TC 0.96 ± 0.75 1.01 ± 0.73 1.07 ± 0.76 1.01 ± 0.80 0.87 ± 0.59 0.98 ± 0.16 T = 0.093§ Tq = 0.013* Tq = 0.452
Time Mean 0.73 ± 0.58 0.78 ± 0.59 0.82 ± 0.62 0.80 ± 0.63 0.71 ± 0.49Ψ◊# G X T = 0.542 G X TL = 0.185 G X TL = 0.205
IL-7 (pg/mL) P 3.75 ± 1.63 3.37 ± 1.57 4.66 ± 2.61 3.72 ± 1.81 3.47 ± 1.15 3.80 ± 0.43 G = 0.295 G = 0.427
TC 4.66 ± 2.54 4.27 ± 1.84 5.12 ± 2.22 4.55 ± 1.69 4.01 ± 1.42 4.52 ± 0.52 T <0.001* Tq = 0.010* TL = 0.845
Time Mean 4.12 ± 2.06 3.74 ± 1.71† 4.85 ± 2.42†Ψ 4.06 ± 1.78◊ 3.69 ± 1.27◊# G X T = 0.708 G X TL = 0.492 G X TL = 0.485
IL-10 (pg/mL) P 2.91 ± 3.13 2.77 ± 1.89 24.17 ± 26.99 2.77 ± 1.78 2.68 ± 1.68 7.06 ± 1.36 G = 0.683 G = 0.948
TC 3.31 ± 2.74 3.99 ± 5.07 17.16 ± 18.60 3.66 ± 3.69 2.79 ± 1.98 6.18 ± 1.64 T = 0.001* Tq = 0.001* Tq = 0.691
Time Mean 3.07 ± 2.93 3.27 ± 3.51 21.31 ± 23.79†Ψ 3.13 ± 2.70◊ 2.72 ± 1.77◊ G X T = 0.421 G X Tq = 0.495 G X TL = 0.509
IL-13 (pg/mL) P 1.52 ± 0.95 1.77 ± 1.14 1.86 ± 1.27 1.55 ± 1.00 1.58 ± 0.86 1.65 ± 0.36 G = 0.091§ G = 0.031*
TC 2.56 ± 2.01 2.96 ± 2.37 2.74 ± 1.75 2.56 ± 2.00 2.40 ± 1.66 2.65 ± 0.43 T = 0.006* Tq = 0.003* Tq = 0.027*
Time Mean 1.94 ± 1.53 2.25 ± 1.80† 2.22 ± 1.52† 1.96 ± 1.54Ψ◊ 1.91 ± 1.29Ψ◊ G X T = 0.538 G X TL = 0.236 G X Tq = 0.053§
Individual group and time data expressed as means ± SD, while group effects are presented as means ± SEM. Data represents the anti-inflammatory response at each testing session during the 10 day intervention.MANOVA analysis revealed overall Wilks’ Lambda time (p <0.001) and group x time (p = 0.447). Univariate ANOVA p-levels from MANOVA analysis are presented for each variable. Univariate ANOVA p-levels are listedfirst by the Greenhouse-Geisser (GG) analysis and then by the within-subjects contrasts (WSC) to demonstrate the potential shape of the time or group x time interaction with significance indicated by the followingsuper/subscripts: * indicates p <0.05 p-level significance, § indicates p <0.10 p-level significance. LSD post hoc analysis is indicated by the following superscripts: † represents p <0.05 difference from baseline value,Ψ represents p <0.05 difference from pre-run, ◊ represents p <0.05 difference from 60-min post, # represents p <0.05 difference from 24-hr post. IL interleukin, RFT race finish time, G group p-level, T time p-level,G x T interaction; q quadratic p-level, L linear p-level
Leverset
al.JournaloftheInternationalSociety
ofSportsNutrition
(2016) 13:22 Page
17of23
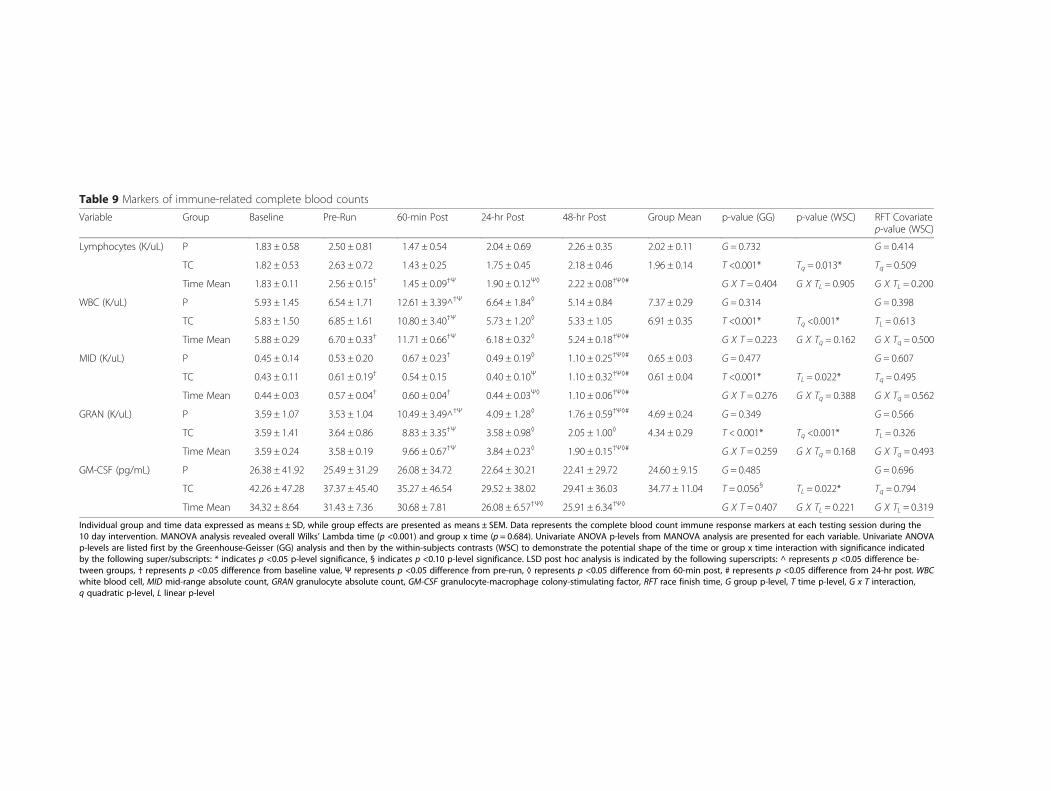
Table 9 Markers of immune-related complete blood countsVariable Group Baseline Pre-Run 60-min Post 24-hr Post 48-hr Post Group Mean p-value (GG) p-value (WSC) RFT Covariate
p-value (WSC)
Lymphocytes (K/uL) P 1.83 ± 0.58 2.50 ± 0.81 1.47 ± 0.54 2.04 ± 0.69 2.26 ± 0.35 2.02 ± 0.11 G = 0.732 G = 0.414
TC 1.82 ± 0.53 2.63 ± 0.72 1.43 ± 0.25 1.75 ± 0.45 2.18 ± 0.46 1.96 ± 0.14 T <0.001* Tq = 0.013* Tq = 0.509
Time Mean 1.83 ± 0.11 2.56 ± 0.15† 1.45 ± 0.09†Ψ 1.90 ± 0.12Ψ◊ 2.22 ± 0.08†Ψ◊# G X T = 0.404 G X TL = 0.905 G X TL = 0.200
WBC (K/uL) P 5.93 ± 1.45 6.54 ± 1.71 12.61 ± 3.39^†Ψ 6.64 ± 1.84◊ 5.14 ± 0.84 7.37 ± 0.29 G = 0.314 G = 0.398
TC 5.83 ± 1.50 6.85 ± 1.61 10.80 ± 3.40†Ψ 5.73 ± 1.20◊ 5.33 ± 1.05 6.91 ± 0.35 T <0.001* Tq <0.001* TL = 0.613
Time Mean 5.88 ± 0.29 6.70 ± 0.33† 11.71 ± 0.66†Ψ 6.18 ± 0.32◊ 5.24 ± 0.18†Ψ◊# G X T = 0.223 G X Tq = 0.162 G X Tq = 0.500
MID (K/uL) P 0.45 ± 0.14 0.53 ± 0.20 0.67 ± 0.23† 0.49 ± 0.19◊ 1.10 ± 0.25†Ψ◊# 0.65 ± 0.03 G = 0.477 G = 0.607
TC 0.43 ± 0.11 0.61 ± 0.19† 0.54 ± 0.15 0.40 ± 0.10Ψ 1.10 ± 0.32†Ψ◊# 0.61 ± 0.04 T <0.001* TL = 0.022* Tq = 0.495
Time Mean 0.44 ± 0.03 0.57 ± 0.04† 0.60 ± 0.04† 0.44 ± 0.03Ψ◊ 1.10 ± 0.06†Ψ◊# G X T = 0.276 G X Tq = 0.388 G X Tq = 0.562
GRAN (K/uL) P 3.59 ± 1.07 3.53 ± 1.04 10.49 ± 3.49^†Ψ 4.09 ± 1.28◊ 1.76 ± 0.59†Ψ◊# 4.69 ± 0.24 G = 0.349 G = 0.566
TC 3.59 ± 1.41 3.64 ± 0.86 8.83 ± 3.35†Ψ 3.58 ± 0.98◊ 2.05 ± 1.00◊ 4.34 ± 0.29 T < 0.001* Tq <0.001* TL = 0.326
Time Mean 3.59 ± 0.24 3.58 ± 0.19 9.66 ± 0.67†Ψ 3.84 ± 0.23◊ 1.90 ± 0.15†Ψ◊# G X T = 0.259 G X Tq = 0.168 G X Tq = 0.493
GM-CSF (pg/mL) P 26.38 ± 41.92 25.49 ± 31.29 26.08 ± 34.72 22.64 ± 30.21 22.41 ± 29.72 24.60 ± 9.15 G = 0.485 G = 0.696
TC 42.26 ± 47.28 37.37 ± 45.40 35.27 ± 46.54 29.52 ± 38.02 29.41 ± 36.03 34.77 ± 11.04 T = 0.056§ TL = 0.022* Tq = 0.794
Time Mean 34.32 ± 8.64 31.43 ± 7.36 30.68 ± 7.81 26.08 ± 6.57†Ψ◊ 25.91 ± 6.34†Ψ◊ G X T = 0.407 G X TL = 0.221 G X TL = 0.319
Individual group and time data expressed as means ± SD, while group effects are presented as means ± SEM. Data represents the complete blood count immune response markers at each testing session during the10 day intervention. MANOVA analysis revealed overall Wilks’ Lambda time (p <0.001) and group x time (p = 0.684). Univariate ANOVA p-levels from MANOVA analysis are presented for each variable. Univariate ANOVAp-levels are listed first by the Greenhouse-Geisser (GG) analysis and then by the within-subjects contrasts (WSC) to demonstrate the potential shape of the time or group x time interaction with significance indicatedby the following super/subscripts: * indicates p <0.05 p-level significance, § indicates p <0.10 p-level significance. LSD post hoc analysis is indicated by the following superscripts: ^ represents p <0.05 difference be-tween groups, † represents p <0.05 difference from baseline value, Ψ represents p <0.05 difference from pre-run, ◊ represents p <0.05 difference from 60-min post, # represents p <0.05 difference from 24-hr post. WBCwhite blood cell, MID mid-range absolute count, GRAN granulocyte absolute count, GM-CSF granulocyte-macrophage colony-stimulating factor, RFT race finish time, G group p-level, T time p-level, G x T interaction,q quadratic p-level, L linear p-level
Leverset
al.JournaloftheInternationalSociety
ofSportsNutrition
(2016) 13:22 Page
18of23

Table 10 Quadriceps muscle soreness perceptionVariable Group Pre-Run 60-min Post 24-hr Post 48-hr Post Group Mean p-value (GG) p-value (WSC) RFT Covariate
p-value (WSC)
Algo I (cm) P 5.99 ± 2.94^ 6.98 ± 3.35 6.44 ± 2.69 5.95 ± 3.01 6.34 ± 0.66 G = 0.523 G = 0.660
TC 3.96 ± 2.15 6.43 ± 3.15Ψ 6.31 ± 3.43Ψ 5.98 ± 3.04Ψ 5.67 ± 0.80 T = 0.003* Tq = 0.002* TL = 0.440
Time Mean 4.98 ± 0.52 6.71 ± 0.64Ψ 6.38 ± 0.59Ψ 5.96 ± 0.59Ψ G X T = 0.110 G X TL = 0.035* G X TL = 0.028*
Algo II (cm) P 5.02 ± 2.55 5.77 ± 2.91 5.58 ± 2.56 4.78 ± 3.02 5.29 ± 0.60 G = 0.393 G = 0.847
TC 4.15 ± 2.66 5.12 ± 3.01 4.51 ± 3.10 4.08 ± 2.30 4.47 ± 0.72 T = 0.122 Tq = 0.013* TL = 0.229
Time Mean 4.59 ± 0.51 5.45 ± 0.58 5.05 ± 0.55 4.43 ± 0.54 G X T = 0.921 G X Tq = 0.889 G X Tq = 0.458
Algo III (cm) P 4.65 ± 3.04^ 6.41 ± 2.91^Ψ 6.04 ± 2.90^Ψ◊ 4.41 ± 2.90◊# 5.38 ± 0.67 G = 0.098§ G = 0.226
TC 2.59 ± 2.45 4.43 ± 2.89Ψ 3.48 ± 2.92 3.84 ± 3.11Ψ 3.58 ± 0.80 T < 0.001* Tq < 0.001* TL = 0.508
Time Mean 3.62 ± 0.55 5.42 ± 0.57Ψ 4.76 ± 0.57Ψ 4.12 ± 0.59◊ G X T = 0.058§ G X Tq = 0.053§ G X Tq = 0.257
Individual group and time data expressed as means ± SD, while group effects are presented as means ± SEM. Data represents the participant soreness perception in the quadriceps muscle group at each testingsession during the 10 day intervention. MANOVA analysis revealed overall Wilks’ Lambda time (p <0.001) and group x time (p = 0.199). Univariate ANOVA p-levels from MANOVA analysis are presented for each variable.Univariate ANOVA p-levels are listed first by the Greenhouse-Geisser (GG) analysis and then by the within-subjects contrasts (WSC) to demonstrate the potential shape of the time or group x time interaction withsignificance indicated by the following super/subscripts: * indicates p <0.05 p-level significance, § indicates p <0.10 p-level significance. LSD post hoc analysis is indicated by the following superscripts: ^ represents p<0.05 difference between groups, Ψ represents p <0.05 difference from pre-run, ◊ represents p <0.05 difference from 60-min post, # represents p <0.05 difference from 24-hr post. Algo I Algometer location #1: VastusMedalis 1/4, Algo II Algometer location #2: Vastus Lateralis 1/4, Algo III Algometer location #3: Vastus Lateralis 1/2, RFT race finish time, G group p-level, T time p-level, G x T interaction, q quadratic p-level, Llinear p-level
Leverset
al.JournaloftheInternationalSociety
ofSportsNutrition
(2016) 13:22 Page
19of23
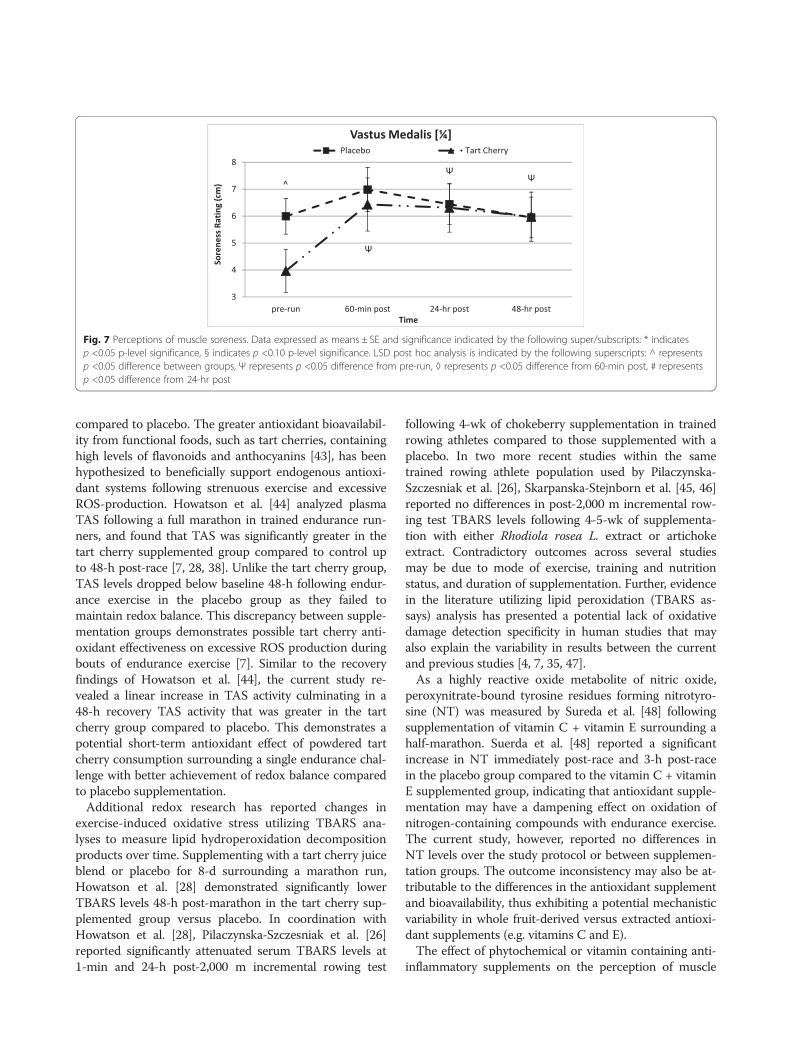
compared to placebo. The greater antioxidant bioavailabil-ity from functional foods, such as tart cherries, containinghigh levels of flavonoids and anthocyanins [43], has beenhypothesized to beneficially support endogenous antioxi-dant systems following strenuous exercise and excessiveROS-production. Howatson et al. [44] analyzed plasmaTAS following a full marathon in trained endurance run-ners, and found that TAS was significantly greater in thetart cherry supplemented group compared to control upto 48-h post-race [7, 28, 38]. Unlike the tart cherry group,TAS levels dropped below baseline 48-h following endur-ance exercise in the placebo group as they failed tomaintain redox balance. This discrepancy between supple-mentation groups demonstrates possible tart cherry anti-oxidant effectiveness on excessive ROS production duringbouts of endurance exercise [7]. Similar to the recoveryfindings of Howatson et al. [44], the current study re-vealed a linear increase in TAS activity culminating in a48-h recovery TAS activity that was greater in the tartcherry group compared to placebo. This demonstrates apotential short-term antioxidant effect of powdered tartcherry consumption surrounding a single endurance chal-lenge with better achievement of redox balance comparedto placebo supplementation.Additional redox research has reported changes in
exercise-induced oxidative stress utilizing TBARS ana-lyses to measure lipid hydroperoxidation decompositionproducts over time. Supplementing with a tart cherry juiceblend or placebo for 8-d surrounding a marathon run,Howatson et al. [28] demonstrated significantly lowerTBARS levels 48-h post-marathon in the tart cherry sup-plemented group versus placebo. In coordination withHowatson et al. [28], Pilaczynska-Szczesniak et al. [26]reported significantly attenuated serum TBARS levels at1-min and 24-h post-2,000 m incremental rowing test
following 4-wk of chokeberry supplementation in trainedrowing athletes compared to those supplemented with aplacebo. In two more recent studies within the sametrained rowing athlete population used by Pilaczynska-Szczesniak et al. [26], Skarpanska-Stejnborn et al. [45, 46]reported no differences in post-2,000 m incremental row-ing test TBARS levels following 4-5-wk of supplementa-tion with either Rhodiola rosea L. extract or artichokeextract. Contradictory outcomes across several studiesmay be due to mode of exercise, training and nutritionstatus, and duration of supplementation. Further, evidencein the literature utilizing lipid peroxidation (TBARS as-says) analysis has presented a potential lack of oxidativedamage detection specificity in human studies that mayalso explain the variability in results between the currentand previous studies [4, 7, 35, 47].As a highly reactive oxide metabolite of nitric oxide,
peroxynitrate-bound tyrosine residues forming nitrotyro-sine (NT) was measured by Sureda et al. [48] followingsupplementation of vitamin C + vitamin E surrounding ahalf-marathon. Suerda et al. [48] reported a significantincrease in NT immediately post-race and 3-h post-racein the placebo group compared to the vitamin C + vitaminE supplemented group, indicating that antioxidant supple-mentation may have a dampening effect on oxidation ofnitrogen-containing compounds with endurance exercise.The current study, however, reported no differences inNT levels over the study protocol or between supplemen-tation groups. The outcome inconsistency may also be at-tributable to the differences in the antioxidant supplementand bioavailability, thus exhibiting a potential mechanisticvariability in whole fruit-derived versus extracted antioxi-dant supplements (e.g. vitamins C and E).The effect of phytochemical or vitamin containing anti-
inflammatory supplements on the perception of muscle
Fig. 7 Perceptions of muscle soreness. Data expressed as means ± SE and significance indicated by the following super/subscripts: * indicatesp <0.05 p-level significance, § indicates p <0.10 p-level significance. LSD post hoc analysis is indicated by the following superscripts: ^ representsp <0.05 difference between groups, Ψ represents p <0.05 difference from pre-run, ◊ represents p <0.05 difference from 60-min post, # representsp <0.05 difference from 24-hr post
Levers et al. Journal of the International Society of Sports Nutrition (2016) 13:22 Page 20 of 23
soreness after an endurance exercise challenge is incon-sistent within the literature. Close et al. [20] acutelysupplemented subjects with either ascorbic acid or a pla-cebo surrounding an eccentrically braked endurance trial,where physically active subjects ran downhill continuouslyfor 30-min. Close et al. [20] reported no significant differ-ences in VAS pain ratings nor pressure algometry betweengroups up to 14-d post-exercise on six lower extremitylocomotion muscle groups. With no effect on post-aerobicexercise delayed onset muscle soreness (DOMS) in additionto previous evidence in the literature, Close et al. [20] sug-gested a dissociation between post-exercise ROS produc-tion and DOMS. Following a marathon running event anda bout of high intensity stochastic cycling using a similar200 mm VAS protocol, Howatson et al. [28] and Bell et al.[35] respectively, reported no difference in DOMS ratingsbetween Montmorency tart cherry juice supplementationand placebo up to 72-h post-exercise. Within the currentstudy, no quadriceps soreness differences were detectedbetween groups over the three recovery time points. Due tothe significant difference in pre-run medial quadriceps sore-ness between supplementation groups, delta changes calcu-lated from pre-run revealed greater recovery medial musclesoreness with tart cherry supplementation compared to pla-cebo. Without a baseline measure of quadriceps sorenessperception and a subject training load record surroundingdata collection, it is difficult to rationalize the pre-runmuscle soreness discrepancy. However, the variability insoreness perceptions across muscle groups within thecurrent study compared to previous research may also bedue to the disparity in measurement protocol, supplements,exercise modality, and/or subject pool training status.Measurement of muscle soreness perception in the presentstudy utilizing both an algometer and a GRPS was imple-mented to help ameliorate the purely subjective nature of aVAS as the only measure of pain or soreness.The strengths of the current study revolve around the
cohort of soreness measures and hemodynamic markersthat contribute a more comprehensive analysis to the exist-ing body of published literature. Some of the more recentendurance-based tart cherry supplementation researchstudies have investigated phytonutrient effectiveness on acomprehensive panel of hemodynamic markers, which willallow for parallels to be drawn to the powdered tart cherrysupplement used in the current study. The current studydid not enter the study cohort into a previously establishedrace competition, but rather created a half-marathon raceexclusively for the study. The utilization of this sup-plement within a trained population demonstrated itseffectiveness under normative training, diet, and perform-ance conditions. Potential limitations and weakness of thecurrent study should also be considered. The placebo-control matched design of this study was effective inequalizing study subject exposure to the conditions of the
half-marathon irrespective of supplement group. However,compared to previous research implementing a cross-overdesign, some variability associated with subject pairingmay have been possible. Differences in aerobic state oftraining beyond the study inclusion/exclusion criteria mayalso have been a source of variability in study cohortrecruitment. Due to the large number of hemodynamicmarkers measured in this study, the five selected timepoints of blood draws over the course of the experimentalperiod may have not fully represented the pharmacoki-netic profile of each marker. The major overridingstrength of the current study is that this is the first studyto be conducted utilizing a powdered form of tart cherriesrather than a juice or concentrate.
ConclusionsThe findings of the current study revealed that consump-tion of a Montmorency powdered tart cherry supplement7-d before, the day of, and 2-d after completing an endur-ance running challenge, appears to be an effective dietarysupplement that may help attenuate post-run markers ofmuscle catabolism and physiological stress in aerobicallytrained individuals. Attenuation of inflammatory markersover the 48-h recovery also demonstrates significant prom-ise with powdered tart cherry supplementation. Coupledwith the dampening of the inflammatory response, thepowdered tart cherry subjects seemed to better maintainpost-run redox balance compared to placebo supplementedsubjects. The initial effectiveness on aerobic performance,serum markers of muscle catabolism, physiological stress,and inflammatory mechanisms coupled with a more stablepost-run redox balance potentially indicates a reduction insecondary muscle damage as a result of powdered tartcherry supplementation. Despite inconclusive evidencesurrounding the perceptions of medial quadriceps soreness,the primary findings of the current study demonstrate thatpowdered tart cherry supplementation in endurance-trained individuals provides similar benefits as previouslystudied tart cherry juices or concentrates following acutebouts of aerobic-based exercise.
AcknowledgementsWe would like to thank the subjects that participated in this study as well as allthe students and laboratory assistants, particularly Nicholas Barringer, JeremyCarter, Yanghoon Peter Jung, Adriana Coletta, Brittany Sanchez, Minye Cho, andMajid Koozehchian, in the Exercise & Sport Nutrition Laboratory at Texas A&MUniversity who assisted with data collection. We would also like to thank MikeVaughn and Katherine Kelly for their valuable assistance in sample analysis.
Authors’ contributionsKL assisted in designing the study, writing the grant, study coordination, datacollection, data analysis, and manuscript preparation. RD, CG, AO, and SS assistedin data collection and sample analysis. EG assisted with data collection, sampleanalysis, and review of dietary inventories as the RD on staff. CR is the director ofthe exercise and sport nutrition lab. MG assisted in research design andconsultation. SMT, SR, and SC assisted in study consultation. RBK (correspondingauthor) assisted in the design of the study, data analysis, manuscript preparation,
Levers et al. Journal of the International Society of Sports Nutrition (2016) 13:22 Page 21 of 23

obtained the grant, and served as study PI. All authors read and approved thefinal manuscript.
Competing interestsThis study was funded by Anderson Global Group, LLC (Irvine, CA, USA) andShoreline Fruit, LLC (Traverse City, MI, USA) through an unrestricted researchgrant to Texas A&M University. All researchers involved independently collected,analyzed, and interpreted the results from this study and have no financialinterests concerning the outcome of this investigation. The results from thisstudy do not constitute endorsement by the authors and/or the institutionconcerning the nutrients investigated.
Author details1Department of Health and Kinesiology, Exercise and Sport NutritionLaboratory, Texas A&M University, College Station, TX 77843-4243, USA.2Department of Nutrition and Food Science, Institute for Obesity Researchand Program Evaluation, Texas A&M University, College Station, TX77843-4243, USA. 3Department of Health and Kinesiology, HumanCountermeasures Laboratory, Texas A&M University, College Station, TX77843-4243, USA. 4Department of Health and Kinesiology, Applied ExerciseScience Laboratory, Texas A&M University, College Station, TX 77843-4243,USA.
Received: 7 March 2016 Accepted: 11 May 2016
References1. Cannonl JG, Blumberg JB. Acute phase immune responses in exercise,
Handbook of Oxidants and Antioxidants in Exercise. 2000. p. 177.2. Vider J, Lehtmaa J, Kullisaar T, Vihalemm T, Zilmer K, Kairane Č, et al. Acute
immune response in respect to exercise-induced oxidative stress.Pathophysiology. 2001;7(4):263–70.
3. Mastaloudis A, Morrow JD, Hopkins DW, Devaraj S, Traber MG. Antioxidantsupplementation prevents exercise-induced lipid peroxidation, but notinflammation, in ultramarathon runners. Free Radic Biol Med. 2004;36(10):1329–41.
4. Bell PG, Walshe IH, Davison GW, Stevenson E, Howatson G. Montmorencycherries reduce the oxidative stress and inflammatory responses torepeated days high-intensity stochastic cycling. Nutrients. 2014;6(2):829–43.
5. Powers SK, Duarte J, Kavazis AN, Talbert EE. Reactive oxygen species aresignalling molecules for skeletal muscle adaptation. Exp Physiol. 2010;95(1):1–9.
6. Powers SK, Jackson MJ. Exercise-induced oxidative stress: cellularmechanisms and impact on muscle force production. Physiol Rev. 2008;88(4):1243–76.
7. Bell PG, McHugh MP, Stevenson E, Howatson G. The role of cherries inexercise and health. Scand J Med Sci Sports. 2014;24(3):477–90.
8. McAnulty LS, Nieman DC, Dumke CL, Shooter LA, Henson DA, Utter AC, et al.Effect of blueberry ingestion on natural killer cell counts, oxidative stress, andinflammation prior to and after 2.5 h of running. Appl Physiol Nutr Metab.2011;36(6):976–84.
9. Moflehi D, Kok L-Y, Tengku-Kamalden T-F, Amri S. Effect of single-sessionaerobic exercise with varying intensities on lipid peroxidation and muscle-damage markers in sedentary males. Glob J Health Sci. 2012;4(4):48.
10. Schoenfeld BJ. The use of Nonsteroidal anti-inflammatory drugs forexercise-induced muscle damage. Sports Med. 2012;42(12):1017–28.
11. Proske U, Morgan D. Muscle damage from eccentric exercise:mechanism, mechanical signs, adaptation and clinical applications. JPhysiol. 2001;537(2):333–45.
12. Thompson D, Williams C, McGregor SJ, Nicholas CW, McArdle F, Jackson MJ,et al. Prolonged vitamin C supplementation and recovery from demandingexercise. Int J Sport Nutr Exerc Metab. 2001;11(4):466.
13. Bryer S, Goldfarb A. Effect of high dose vitamin C supplementation onmuscle soreness, damage, function, and oxidative stress to eccentricexercise. Int J Sport Nutr Exerc Metab. 2006;16(3):270.
14. Fischer CP, Hiscock NJ, Penkowa M, Basu S, Vessby B, Kallner A, et al.Supplementation with vitamins C and E inhibits the release of interleukin-6from contracting human skeletal muscle. J Physiol. 2004;558(2):633–45.
15. McGinley C, Shafat A, Donnelly AE. Does antioxidant vitamin supplementationprotect against muscle damage? Sports Med. 2009;39(12):1011–32.
16. Gomez-Cabrera M-C, Domenech E, Romagnoli M, Arduini A, Borras C,Pallardo FV, et al. Oral administration of vitamin C decreases muscle
mitochondrial biogenesis and hampers training-induced adaptations inendurance performance. Am J Clin Nutr. 2008;87(1):142–9.
17. Yfanti C, Akerström T, Nielsen S, Nielsen AR, Mounier R, Mortensen OH, et al.Antioxidant supplementation does not alter endurance training adaptation.Med Sci Sports Exerc. 2010;42(7):1388–95.
18. Beaton LJ, Allan DA, Tarnopolsky MA, Tiidus PM, Phillips SM. Contraction-induced muscle damage is unaffected by vitamin E supplementation. MedSci Sports Exerc. 2002;34(5):798–805.
19. Theodorou AA, Nikolaidis MG, Paschalis V, Koutsias S, Panayiotou G, FatourosIG, et al. No effect of antioxidant supplementation on muscle performance andblood redox status adaptations to eccentric training. Am J Clin Nutr. 2011;93(6):1373–83.
20. Close GL, Ashton T, Cable T, Doran D, Holloway C, McArdle F, et al. Ascorbicacid supplementation does not attenuate post-exercise muscle sorenessfollowing muscle-damaging exercise but may delay the recovery process.Br J Nutr. 2006;95(05):976–81.
21. Teixeira VH, Valente HF, Casal SI, Marques AF, Moreira PA. Antioxidants donot prevent postexercise peroxidation and may delay muscle recovery. MedSci Sports Exerc. 2009;41(9):1752–60.
22. Ristow M, Zarse K, Oberbach A, Klöting N, Birringer M, Kiehntopf M, et al.Antioxidants prevent health-promoting effects of physical exercise inhumans. Proc Natl Acad Sci. 2009;106(21):8665–70.
23. Strobel NA, Peake JM, Matsumoto A, Marsh SA, Coombes JS, Wadley GD.Antioxidant supplementation reduces skeletal muscle mitochondrialbiogenesis. Med Sci Sports Exerc. 2011;43(6):1017–24.
24. Peternelj T-T, Coombes JS. Antioxidant supplementation during exercisetraining. Sports Med. 2011;41(12):1043–69.
25. Lafay S, Jan C, Nardon K, Lemaire B, Ibarra A, Roller M, et al. Grape extractimproves antioxidant status and physical performance in elite male athletes.J Sports Sci Med. 2009;8(3):468.
26. Pilaczynska-Szczesniak L, Skarpanska-Steinborn A, Deskur E, Basta P,Horoszkiewicz-Hassan M. The influence of chokeberry juice supplementationon the reduction of oxidative stress resulting from an incremental rowingergometer exercise. Int J Sport Nutr Exerc Metab. 2005;15(1):48–58.
27. Kuehl KS, Perrier ET, Elliot DL, Chesnutt JC. Efficacy of tart cherry juice inreducing muscle pain during running: a randomized controlled trial. J IntSoc Sports Nutr. 2010;7:17. doi:10.1186/1550-2783-7-171550-2783-7-17.
28. Howatson G, McHugh MP, Hill JA, Brouner J, Jewell AP, van Someren KA, et al.Influence of tart cherry juice on indices of recovery following marathonrunning. Scand J Med Sci Sports. 2010;20(6):843–52. doi:10.1111/j.1600-0838.2009.01005.xSMS1005.
29. Klesges RC, Ward KD, Shelton ML, Applegate WB, Cantler ED, Palmieri GM,et al. Changes in bone mineral content in male athletes: mechanisms ofaction and intervention effects. JAMA. 1996;276(3):226–30.
30. Almada A, Kreider R, Ransom J, Rasmussen C. Comparison of thereliability of repeated whole body DEXA scans to repeated spine andhip scans. J Bone Miner Res. 1999;14(9):S369.
31. Bowling JL, Katayev A. An evaluation of the Roche Cobas c 111. Lab Med.2010;41(7):398–402.
32. Nieman DC, Williams AS, Shanely RA, Jin F, McAnulty SR, Triplett NT, et al.Quercetin’s influence on exercise performance and muscle mitochondrialbiogenesis. Med Sci Sports Exerc. 2010;42(2):338–45.
33. Kang SW, Hahn S, Kim J-K, Yang S-M, Park B-J, Lee SC. Oligomerizedlychee fruit extract (OLFE) and a mixture of vitamin C and vitamin E forendurance capacity in a double blind randomized controlled trial. J ClinBiochem Nutr. 2012;50(2):106.
34. Kratz A, Lewandrowski KB, Siegel AJ, Chun KY, Flood JG, Van Cott EM, et al.Effect of marathon running on hematologic and biochemical laboratoryparameters, including cardiac markers. Am J Clin Pathol. 2002;118(6):856–63.
35. Bell PG, Walshe IH, Davison GW, Stevenson EJ, Howatson G. Recoveryfacilitation with Montmorency cherries following high-intensity,metabolically challenging exercise. Appl Physiol Nutr Metab. 2015;40(4):414–23.
36. Gleeson M. Immune function in sport and exercise. J Appl Physiol. 2007;103(2):693–9.
37. Pedersen BK, Toft AD. Effects of exercise on lymphocytes and cytokines. Br JSports Med. 2000;34(4):246–51.
38. Sousa M, Teixeira VH, Soares J. Dietary strategies to recover from exercise-induced muscle damage. Int J Food Sci Nutr. 2013;65(2):151–63.
39. Cannon JG, Pierre BAS. Cytokines in exertion-induced skeletal muscle injury.Mol Cell Biochem. 1998;179(1–2):159–68.
Levers et al. Journal of the International Society of Sports Nutrition (2016) 13:22 Page 22 of 23

40. Nieman DC, Henson DA, Maxwell KR, Williams AS, McAnulty SR, Jin F, et al.Effects of quercetin and EGCG on mitochondrial biogenesis and immunity.Med Sci Sports Exerc. 2009;41(7):1467–75.
41. Davison G, Gleeson M. Influence of acute vitamin C and/or carbohydrateingestion on hormonal, cytokine, and immune responses to prolongedexercise. Int J Sport Nutr Exerc Metab. 2005;15(5):465.
42. Lyall KA, Hurst SM, Cooney J, Jensen D, Lo K, Hurst RD, et al. Short-termblackcurrant extract consumption modulates exercise-induced oxidativestress and lipopolysaccharide-stimulated inflammatory responses. Am JPhysiol Regul Integr Comp Physiol. 2009;297(1):R70–81.
43. Wang H, Nair MG, Strasburg GM, Chang Y-C, Booren AM, Gray JI, et al.Antioxidant and antiinflammatory activities of anthocyanins and theiraglycon, cyanidin, from tart cherries. J Nat Prod. 1999;62(2):294–6.
44. Janaszewska A, Bartosz G. Assay of total antioxidant capacity: comparison offour methods as applied to human blood plasma. Scand J Clin Lab Investig.2002;62(3):231–6.
45. Skarpanska-Stejnborn A, Pilaczynska-Szczesniak L, Basta P, Deskur-Smielecka E.The influence of supplementation with Rhodiola rosea L. extract on selectedredox parameters in professional rowers. Int J Sport Nutr. 2009;19(2):186.
46. Skarpanska-Stejnborn A, Pilaczynska-Szczesniak L, Basta P, Deskur-SmieleckaE, Horoszkiewicz-Hassan M. The influence of supplementation withartichoke (Cynara scolymus L.) extract on selected redox parameters inrowers. Int J Sport Nutr Exerc Metab. 2008;18(3):313.
47. Urso ML, Clarkson PM. Oxidative stress, exercise, and antioxidantsupplementation. Toxicology. 2003;189(1):41–54.
48. Sureda A, Ferrer MD, Mestre A, Tur JA, Pons A. Prevention of neutrophilprotein oxidation with vitamins C and e diet supplementation withoutaffecting the adaptive response to exercise. Int J Sport Nutr Exerc Metab.2013;23(1):31–9.
• We accept pre-submission inquiries • Our selector tool helps you to find the most relevant journal• We provide round the clock customer support • Convenient online submission• Thorough peer review• Inclusion in PubMed and all major indexing services • Maximum visibility for your research
Submit your manuscript atwww.biomedcentral.com/submit
Submit your next manuscript to BioMed Central and we will help you at every step:
Levers et al. Journal of the International Society of Sports Nutrition (2016) 13:22 Page 23 of 23

"This course was developed and edited from the open access article: Effect of tart cherry juice on recovery and
next day performance in well-trained Water Polo players, Journal of the International Society of Sports
Nutrition - McCormick et al.(2016) 13:41 (DOI:10.1186/s12970-016-0151-x ), used under the Creative
Commons Attribution License.”
"This course was developed and edited from the open access article: Effects of powdered Montmorency tart
cherry supplementation on acute endurance exercise performance in aerobically trained individuals, Journal
of the International Society of Sports Nutrition - Levers et al. (2016) 13:22 (DOI:10.1186/s12970-016-0133-z),
used under the Creative Commons Attribution License.”