Embed Size (px)
Citation preview

www.sciedu.ca/ijba International Journal of Business Administration Vol. 4, No. 5; 2013
Published by Sciedu Press 51 ISSN 1923-4007 E-ISSN 1923-4015
Effects of Mergers and Acquisitions on Return on Capital Employed and Dividend per Share Indices of Companies in Nigeria
Sergius N. Udeh1 & Nicholas N. Igwe2 1 Department of Accounting/Finance, Godfrey Okoye University, Ogwuomu – Nike, Enugu State, Nigeria 2 Department of Business Management, Godfrey Okoye University, Ugwuomu – Nike, Enugu State, Nigeria
Correspondence: Nicholas N. Igwe, PH.D, JP, MNIM, MIMC, Department of Business Management, Godfrey Okoye University, Ugwuomu – Nike, Enugu State, Nigeria. E-mail: [email protected]
Received: July 15, 2013 Accepted: August 23, 2013 Online Published: September 6, 2013
doi:10.5430/ijba.v4n5p51 URL: http://dx.doi.org/10.5430/ijba.v4n5p51
Abstract
This paper examines the effects of mergers and acquisitions on returns on capital employed and dividend per share of companies in Nigeria. Data were collected from published consolidated financial statements of five of the companies that combined between 1983 and 2003 which had one or two of the companies listed on the floor of the Nigerian Stock Exchange. Data were collected for a period of twenty year, ten years before and ten years after business combination.
Regression analysis and t – test statistic were used to analyze the data. The study reveals that while mergers and acquisitions had significant effect on return on capital employed in 20 percent of the companies, they produced significant effect on dividend per share in 80 percent of the companies studied. The paper concludes that mergers and acquisitions produced varying degrees of effects on some corporate performance indicators. It recommends that mergers and acquisitions could be employed by stakeholders to enhance profitability and dividend per share of their companies in Nigeria.
Keywords: mergers and acquisition, return on capital, divided per share indices, performance indicators, Nigeria
1. Introduction
Corporate entities all over the world exist basically to generate earnings. The higher the earnings the more successful and fulfilling the organization is considered to be, especially to all stakeholders in the organization. Common stakeholders of corporate entities include the shareholders, the employees, the government, debtors, creditors, etc.
However, earnings flows in organizations are not always predictable. The quantity and or the regularity of the earning could be affected by either endogenic or exogenic factors or even both (Adewoyin, 2006). As a result of this, it becomes necessary that as a firm struggles to pass through the various stages of its life cycle, it also contends with internal and external pressures that threaten its earning capacity.
Different organizations adopt different strategies such as internal reorganization, external reconstruction and so on, they consider appropriate to overcome these pressures and meet the stakeholders’ expectations. When the measures fail to produce the desired results, the affected organization may go into business combination, either in the form of merger or acquisition as a way out of the unfavourable situation.
Since profitability, measured as return on capital employed (ROCE) and dividend per share indices appear to be a common area of interest for all stakeholders, it becomes necessary to examine how mergers and acquisitions influence them. This is against the background that some analysts wonder if these strategies impact positively or negatively on corporate performance indices that are of concern to business managers, shareholders and investors of all classes (Udeh, 2012.).
1.1 Statement of the Problem
When the period of economic boom in Nigeria was over, economic downturn and business failures emerged as a result of adverse macro economic conditions. Consequently, business expansion became hindered and operating earnings shrank.

www.sciedu.ca/ijba International Journal of Business Administration Vol. 4, No. 5; 2013
Published by Sciedu Press 52 ISSN 1923-4007 E-ISSN 1923-4015
Consequent upon these challenges, many firms resorted to adoption of various survival strategies such as divestiture of seemingly non profitable lines of businesses, internal and external capital reorganization, recapitalization, mergers and acquisitions and so on. Olabode and Makinde (2003) assert that business combination which is commonly used as one of the last survival options has an edge over the others in terms of optimization of resources.
However, many of the investors, both macro and marginal, express uncertainties over the effects of mergers and acquisitions on return on capital employed and dividend per share of corporate organizations especially in the non banking sectors of the Nigerian economy. This paper therefore, is designed to explore the effects of mergers and acquisitions on return on capital employed (ROCE) and dividend per share (DPS) of companies other than banks in Nigeria.
1.2 Objectives
The objectives of the study are as follows:
a. To find out if mergers and acquisitions have significant effects on return on capital employed of companies in Nigeria.
b. To determine whether mergers and acquisitions have significant effect on dividend per share of companies in Nigeria.
1.3 Research Questions
The following research questions could be discerned:
a. To what extent do mergers and acquisitions have effect on return on capital employed of companies in Nigeria?
b. What is the extent of effect of mergers and acquisitions on dividend per share of companies in Nigeria?
1.4 Hypotheses
In view of the above research questions, the following hypotheses were formulated to guide the study:
a. Mergers and acquisitions do not produce significant effect on return on capital employed of companies in Nigeria.
b. Mergers and acquisitions do not have significant effect on dividend per share of companies in Nigeria.
2. Theoretical Framework and Review of Related Literature
This study was anchored on transaction cost theory developed in 1937 by Ronald Coarse. The theory is concerned with the relative efficiency of different exchange processes. It focuses on costs of acquiring and handling the information about quality inputs, the relevant prices, the supplier’s reputation, and so on. Vannoni (2011), states that firms merge as a way of economizing transaction costs in a world of uncertainty, where contractual arrangements are too expensive. Firms therefore, merge basically to reduce transaction costs and gain economies of large scale.
Mergers and acquisitions are not new corporate strategies. Sapienza (2009) states that combinations of business entities have occurred ever since the corporate form of enterprise came into existence.
Rock, Rock and Sikora (1995) see merger as a business combination in which two or more entities join together, with one being fused into the others while acquisitions are combinations in which little or no effort is made to continue in existence with the identity of the acquired company. Rock, Rock and Sikora (1995) view implies that merger involves total fusion of one entity into another.
This may not always be the case. The Companies and Allied Matters Act (CAMA) of 2004, section 590 lends credence to the contrary. The section describes merger as an amalgamation of the undertaking or any part of undertaking or interest of two or more companies.
Okonkwo (2004) states that an essential difference between a merger and an acquisition is that in a merger, there is no disinvestment of shareholders of the amalgamating companies (expect of course, where there are dissenting shareholders who are paid off while the reverse in the case in an acquisition. He adds that when one company takes over another and clearly establishes itself as the new owner, the purchase is called an acquisition. From a legal point of view, the target company ceases to exist, the buyer swallows the business and the buyer’s stocks continue to be traded in the stock market.
Olabode and Makinde (2003) discover that the commonest expectation of shareholders in merger and acquisition deals is a higher dividend payment. They further note that the expectation was only met in 41.3% of deals

www.sciedu.ca/ijba International Journal of Business Administration Vol. 4, No. 5; 2013
Published by Sciedu Press 53 ISSN 1923-4007 E-ISSN 1923-4015
consummated in the banking sector. The contention is that these findings may not apply to other sectors of the Nigerian economy. In another development, Adewoyin (2006) and Sanni (2009) observe that the banking sector reform in Nigeria which was embraced by many banks through mergers and acquisitions not only produced more stable financial institutions but also had secondary effects that impacted directly on shareholders welfare. Adewoyin (2006) contends that the improvement in shareholders wealth consequent on the reform would predispose them more favourably to future reforms. However, Hagedoorn and Schakenraad (2004) argue that mergers and acquisitions are empire - building strategies that hardly improve shareholders’ welfare defined by profitability and dividend indices.
Furthermore, Kitching (2006) states that there are evidences consistent in suggesting that a high proportion of mergers and acquisitions are financially unsuccessful and fail to meet shareholders’ expectations in terms of bountiful return on capital employed or dividend payments. In a related development, Solow (2005) concludes that shareholders basically approve corporate restructuring in form of mergers and acquisitions to improve their dividend per share index and avoid take-over bids. Mergers and acquisitions try to prevent hostile advances of acquiring companies.
Scherer (2004) states that mergers and acquisitions significantly influence the earning per share when the synergies of business combination are properly managed. He however, notes that persistent low earnings per share is a major indicator for take-over bids in companies in Germany.
Arguing from the view point of systematic risk, Moyer and Chatfield (2006) opine that merger and acquisition activities increase market power of an enterprise and decrease its systematic risk. They state that increase in market power and decrease in systematic risk that result from mergers and acquisitions often lead to increase in profitability of the enterprise.
Michel and Shaked (2007) discover that synergy created by related mergers and acquisitions positively influence the profit streams of the firms. They believe that profit of firms tend to increase in relation to the degree of relatedness of companies in merger and acquisition activities. On the contrary, Mahesh (2007) finds that mergers and acquisitions fail to make positive contributions in respect of return on capital employed. He observes that economy of scale or synergies that result from mergers and amalgamations are often vitiated by limited experience of the managers. The divergence of findings in mergers and acquisitions especially in countries other than Nigeria and similar studies in the banking sector of the Nigerian economy really calls for further studies. Hence, the need for this study in the non-banking sector of the Nigerian economy.
3. Methodology
Data were generated from published consolidated financial statements of five of the companies that combined between 1983 and 2003 (excluding banks) which had one or two of the companies listed on the floor of the Nigerian Stock Exchange. (See Appendix 1). Data were collected for a period of 20 years, 10 years before and 10 years after business combination. (See Appendix 2). Regressional method was used to analyze the data generated. It is represented by
y = a + bx
Where
X = independent variable = Total assets of the merged and acquired companies
Y = predicted value of the dependent variable = Return on capital employed and dividend per share of merged and acquired companies.
The two hypotheses were tested using t - test statistic represented by the formula
tcal = B1 – 0 ~ t (n – 2)
MSE
Sxx Where B1 = Regression coefficient for the total assets of the merged and acquired companies.
MSE = variance component due to error term.
Sxx = Estimated variance of the total assets of the merged and acquired companies. (See Appendix 3 for the details of the analysis)
4. Findings and Discussion
The following findings were made:

www.sciedu.ca/ijba International Journal of Business Administration Vol. 4, No. 5; 2013
Published by Sciedu Press 54 ISSN 1923-4007 E-ISSN 1923-4015
Research Questions One: To what extent do mergers and acquisitions have effect on return on capital employed of companies in Nigeria?
Table 1. Effects of regression of logged return on capital employed on adjusted total assets of merged and acquired companies on the basis of coefficient of determination (R2)
Model Coefficient of
variation
Coefficient of
determination
Adjusted R2
A.G Leventis Plc .502 .252 .210
Nestle Nigeria Plc .637 .406 .373
Oando Plc .487 .237 .193
GlaxoSmithKline Consumer Plc .643 .413 .380
Total Nigeria Plc .026 .001 .055
(Source: Udeh, 2012)
Table 1 shows that mergers and acquisitions accounted for different degrees of variation in the profit index of the companies under investigation. Specifically, while mergers and acquisitions accounted for 25.2 percent variation in the profit in relation to a unit change in total assets of A.G. Leventis Plc, they produced 40.6 percent variation in profit index in response to a unit variation in total assets of Nestle Nigeria Plc. Similarly, mergers and acquisitions accounted for 23.7, 41.3 and 0.1 percent variations in the profit figures of Oando Plc, Glaxosmithkline Consumer Plc and Total Nigeria Plc respectively in relation to a unit variation in the total assets of these companies. The results agree with the findings of Michel and Shaked (2007) that synergy created by related mergers and acquisitions positively influenced profit streams of the firms.
Research Question Two: What is the extent of effect of mergers and acquisitions on dividend per share of companies in Nigeria?
Table 2. Effects of regression of dividend per share on adjusted total asset of merged and acquired companies on basis of co-efficient of determination (R2)
Model Coefficient of variation
Coefficient of determination
Adjusted R2
A.G Leventis Plc .000 .000 -.056
Nestle Nigeria Plc .885 .784 .772
Oando Plc .775 .601 .577
Glaxosmithkline Consumer Plc .408 .219 .176
Total Nigeria Plc .878 .770 .758
(Source: Udeh, 2012)
Table 2 shows that zero percent variation in dividend per share of A.G Leventis Plc was accounted for by a unit variation in total assets.
Furthermore, while 78.4 percent variation in dividend per share could be explained through a unit variation in total assets of Nestle Nigeria Plc, 60.1 percent variation in total assets was accounted for by a unit variation in total assets of Oando Plc. Again, 21.9 and 77.0 percent variations in dividend per share of Glaxosmithkline Consumer Plc and Total Nigeria Plc respectively were accounted for by unit variations in the total assets of the companies. These findings are in consonance with the results of study done by Adewoyin (2006) where he stated that the banking sector reform in Nigeria which was embraced by many banks through mergers and acquisitions did not only produce more stable financial institutions but had secondary effects that impacted directly on shareholders’ welfare as defined by dividend per share.
Test of Hypothesis
Hypothesis One: Mergers and acquisitions do not produce significant effect on return on capital employed of companies in Nigeria.
www.sciedu.ca/ijba International Journal of Business Administration Vol. 4, No. 5; 2013
Published by Sciedu Press 55 ISSN 1923-4007 E-ISSN 1923-4015
Table 3. Results of t-test statistic on whether mergers and acquisitions have significant effects on return on capital employed
Model Mean Std Deviation t-cal t-tab df
A.G Leventis Plc .40048 .294032 -2.459 2.10 18
Nestle Nigeria Plc 1.25990 .210470 3.507 2.10 18
Oando Plc 1.16702 .444617 -2.301 2.11 17
Glaxosmithkline Consumer Plc
1.02541 .346948 -3.68 2.10 18
Total Nigeria Plc 1.72906 .113586 -.112 2.10 18
(Source: Udeh, 2012)
Table 3 shows that t - calculated for A.G Leventis Plc was -2.459 while the t - tabulated was 2.10
In addition, while the t - calculated for Oando Plc was -2.301 and t - tabulated 2.11, the t - calculated for Nestle Nigeria Plc, GlaxoSmithKline Consumer Plc and Total Nigeria Plc were 3.507, -3.558 and -.112 respectively with t - tabulated of 2.10 each.
The t-test results revealed it was only 20% of such variation in profit index accounted for by mergers and acquisitions that was significant. In fact, the results showed that while mergers and acquisitions significantly influenced profitability of Nestle Nigeria Plc, their effects on the profit index of other companies were not significant. The findings of the study are in agreement with the findings of Moyer and Chatfield (2006) that increase in market power and decrease in systematic risk from mergers and acquisitions often lead to increase in profitability of enterprises. Furthermore, these findings are consistent with the submission of Sanni (2009) that consolidation in the banking industry increased profitability of the banks.
Hypothesis Two: Mergers and acquisitions do not have significant effect on dividend per share of companies in Nigeria.
Table 4. Results of t-test statistic on whether mergers and acquisitions have significant effect on dividend per share of companies in Nigeria
Model Mean Std Deviation t-cal t-tab Df
A.G Leventis Plc 6.48500 2.547088 .002 2.10 18
Nestle Nigeria Plc 2.00415 224.030123 8.073 2.10 18
Oando Plc 1.78242 130.013560 5.056 2.11 17
Glaxosmithkline Consumer Plc
1.56300 7.107824 2.249 2.10 18
Total Nigeria Plc 4.99500 353.738183 7.771 2.10 18
(Source: Udeh, 2012)
Table 4 shows t - calculated of .002 for A.G Leventis Plc and 8.073 Nestle Nigeria Plc with t- tabulated of 2.10. It also shows that while Oando Plc had a t- calculated of 5.056 and t - tabulated of 2.11, Glaxosmithkline Consumer Plc and Total Nigeria Plc had T calculated of 2.249 and 7.771 respectively and t - tabulated of 2.10 each.
The t - test results indicate that while mergers and acquisitions had significant effect on the dividend per share of Nestle Nigeria, Oando, Glaxosmithkline Consumer and Total Nigeria Plcs, they did not produce significant effect on dividend per share of A.G. Leventis Plc. This shows that mergers and acquisitions significantly influenced dividend per share of 80 percent of the companies studied.
These findings are consistent with the findings of Olabode and Makinde (2003) in which they concluded that the expectations of shareholders in terms of higher dividend per share are met in 41.3 percent of merger and acquisition deals consummated in the Nigerian banking sector. However, these results are inconsistent with the conclusion of Hagedoorn and Schakenraad (2004) that mergers and acquisitions were empire building strategies that hardly improve shareholders’ welfare interpreted by earnings and dividend indices.
5. Conclusion and Recommendations
In spite of controversies over the impact of mergers and acquisitions on indices of corporate performance in some countries of the world, this study found that mergers and acquisitions had different levels of significant effect on profitability and dividend per share of a cross section of companies in Nigeria. The study specifically showed that the

www.sciedu.ca/ijba International Journal of Business Administration Vol. 4, No. 5; 2013
Published by Sciedu Press 56 ISSN 1923-4007 E-ISSN 1923-4015
mergers and acquisitions produced wider scope of significant effect on dividend per share than on return on capital employed of companies.
The following recommendations are made:
(1) Mergers and acquisitions should no longer be seen as survival strategies that are useful only when companies are sinking or facing economic downturn. They can enhance profitability and dividend per share indices of companies in Nigeria.
(2) Since improvement in welfare of stakeholders of companies is a common area of interest; and mergers and acquisition offer themselves as useful tools for achieving this purpose, appropriate stakeholders can employ these strategies whenever necessary to enhance their welfare.
(3) Government should create the enabling environment to encourage companies use mergers and acquisitions as both survival and performance enhancing strategies.
References
Adewoyin, A.O. (2006). The implications of Reform on Banking Sector. Journal of Business Management, 23(2), 1-13.
Companies and Allied Matters Act. (2004).
Hagedoorn, J., & Schakenraad, J. (2004). The Effect of Strategic Technology Alliances on Company Performance. Strategic Management Journal, 15, 291-305.
Kitching, J. (2006). Why do Mergers Miscarry? Harvard Business Review, 6(45), 84-101.
Mahesh, K.T. (2007). Impact of Mergers and Amalgamations on the Performance of Indian companies. Retrieved from http://ideals.repec.org/p/wpa/wuwpfi/0506007.html
Michel, A., & Shaked, M. (2007). Does Business Diversification Affect Performance? Financial Management Journal, 13(4), 1-15.
Moyer, R.C., & Chatfield, R. (2006). Market Power and Systematic Risk. Journal of Economics and Business, 33, 123-130.
Okonkwo, C.O. (2004). Legal Framework for Mergers and Acquisitions, Retreat on Mergers and Acquisition in the Nigerian Banking Industry, 7th September, 2004.
Olabode, M., & Makinde, J. (2003). Interest of Shareholders in Mergers and Acquisitions in the Banking sector. Journal of Finance, 38(2), 82-96.
Rock, M.I., Rock, R.H., & Sikora, M. (1995). The Merger and Acquisition Handbook. New York, McGraw - Hill.
Sanni, M.R. (2009). Short Term Effect of the 2006 Consolidation of Profitability of Nigerian Banks. Nigerian Research Journal of Accountancy, 1, 177-188.
Sapienza, S.R. (2009). Pooling Theory and Practice in Business Combinations. Retrieved from http://www;stor.org/action/show/articleImage
Scherer, F.M. (2004). Corporate Take-overs: The Efficiency Arguments. Journal of Economic Perspective, 2(1), 69-82.
Solow, R. (2005). A Contribution of Mergers and Acquisitions to the Theory of Economic Growth. Quarterly Journal of Economics, 70(1), 65-94.
Udeh, S.N. (2012). Comparative Analysis of Effects of Pre- and Post-Merger and Acquisition Activities on Corporate Performance: A Study of Selected Companies in Nigeria (1983 - 2011). A Ph.D Thesis, Ebonyi State University, Abakaliki.

www.sciedu.ca/ijba International Journal of Business Administration Vol. 4, No. 5; 2013
Published by Sciedu Press 57 ISSN 1923-4007 E-ISSN 1923-4015
Appendix 1. Business combinations handled by the Nigerian Securities and Exchange Commission between 1983
and 2003
S/N YEAR NO.
COMBINED LISTED
EXISTING COMPANY
1. ITI Plc Henein Shipping Co. Ltd. 1983 None
2. Lever Brothers Nig. Ltd. Lipton Nigeria Co. Ltd. 1984 None
3. Associated Match Ind. Plc. (i) United Company Nig. Ltd. None
(Formerly Niger Match Co. Ltd.) (ii) Star Match Nig. Co. Ltd. 1985
(iii) Safa Nig. Ltd.
4. United Insurance Company Ltd. United Life Assurance Co. Ltd. 1987 None
5. Gas Product Ltd. Gas and Welding Ltd. 1991 None
6. Prudent Merchant Co. Ltd. Prudent Finance Ltd. 1991 None
7. A. G. Leventis Nig. Ltd. Leventis Technical Ltd. and 1995 One
Leventis Motors Ltd.
8. Nestle Nigeria Plc Nestle Foods Plc 1996 One
9. Glaxosmithkline Consumer Plc. Sterling Products Nigeria Plc 1996 Two
10. Union Bank of Nigeria Plc Nal Merchant Bank Plc 1996 One
11. Guaranty Trust Bank Plc Magnum Trust Bank Ltd. 2001 One
12. Total Nig. Plc ELF Oil Ltd. 2001 One
13. Oando Plc Agip (Nig.) Plc 2002 Two
14. Carnud Metal Box Nig. Plc The Crown Work and Seal 2003 None
Company (Nig.) Ltd. and
Cammters Nig. Ltd.
Source: Securities and Exchange Commission’s Statistical Report ,October 2005

www.sciedu.ca/ijba International Journal of Business Administration Vol. 4, No. 5; 2013
Published by Sciedu Press 58 ISSN 1923-4007 E-ISSN 1923-4015
Appendix 2
Pre-Merger Extracts from Financial Statements of A.G Leventis Plc (1985 - 1994)
Source: Financial Statements of A.G Leventis Plc and National Bureau of Statistics Reports from 1985-1994
Post-Merger Extracts from Financial Statements of A.G Leventis Plc (1995 - 2004)
Source: Financial Statements of A.G Leventis Plc and National Bureau of Statistics Reports from 1995 – 2004

www.sciedu.ca/ijba International Journal of Business Administration Vol. 4, No. 5; 2013
Published by Sciedu Press 59 ISSN 1923-4007 E-ISSN 1923-4015
Pre-Merger Extracts from Financial Statements of Nestle Nigeria Plc (1986 - 1995)
Source: Financial Statements of Nestle Nigeria Plc and National Bureau of Statistics Reports from 1986 – 1995
Post-Merger Extracts from Financial Statements of Nestle Nigeria Plc (1996 - 2005)
Source: Financial Statements of Nestle Nigeria Plc and National Bureau of Statistics Reports from 1996 - 2005
www.sciedu.ca/ijba International Journal of Business Administration Vol. 4, No. 5; 2013
Published by Sciedu Press 60 ISSN 1923-4007 E-ISSN 1923-4015
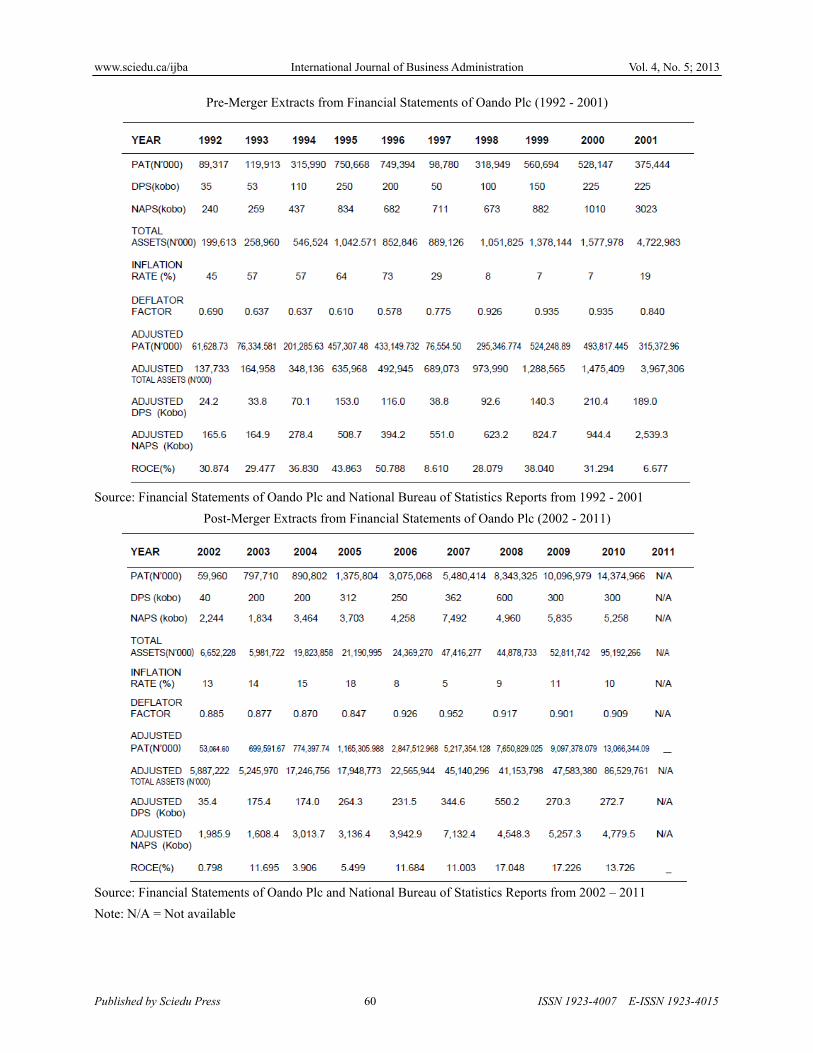
Pre-Merger Extracts from Financial Statements of Oando Plc (1992 - 2001)
Source: Financial Statements of Oando Plc and National Bureau of Statistics Reports from 1992 - 2001
Post-Merger Extracts from Financial Statements of Oando Plc (2002 - 2011)
Source: Financial Statements of Oando Plc and National Bureau of Statistics Reports from 2002 – 2011
Note: N/A = Not available

www.sciedu.ca/ijba International Journal of Business Administration Vol. 4, No. 5; 2013
Published by Sciedu Press 61 ISSN 1923-4007 E-ISSN 1923-4015
Pre- Merger Extracts from Financial Statements of GlaxoSmithKline Consumer Plc (1986 - 1995)
Source: Financial Statements of GlaxoSmithKline Consumer Plc and National Bureau of Statistics Reports from 1986 – 1995
Post- Merger Extracts from Financial Statements of GlaxoSmithKline Consumer Plc (1996 - 2005)
Source: Financial Statements of GlaxoSmithKline Consumer Plc and National Bureau of Statistics Reports from 1996 – 2005

www.sciedu.ca/ijba International Journal of Business Administration Vol. 4, No. 5; 2013
Published by Sciedu Press 62 ISSN 1923-4007 E-ISSN 1923-4015
Pre-Merger Extracts from Financial Statements of Total Nigeria Plc (1991 - 2000)
Source: Financial Statements of Total Nigeria Plc and National Bureau of Statistics Reports from 1991 - 2000
Post-Merger Extracts from Financial Statements of Total Nigeria Plc (2001 - 2010)
Source: Financial Statements of Total Nigeria Plc and National Bureau of Statistics Reports from 2001 – 2010

www.sciedu.ca/ijba International Journal of Business Administration Vol. 4, No. 5; 2013
Published by Sciedu Press 63 ISSN 1923-4007 E-ISSN 1923-4015
Appendix 3
Regression Analysis of ROCE on Total Assets for A. G. Leventis PLC
Descriptive Statistics
Mean Std. Deviation N
LogROCE1 .40048 .294032 20
LogTotalasset1 5.94845 .449623 20
Correlations
LogROCE1 LogTotalasset1
Pearson Correlation LogROCE1 1.000 -.502
LogTotalasset1 -.502 1.000
Sig. (1-tailed) LogROCE1 . .012
LogTotalasset1 .012 .
N LogROCE1 20 20
LogTotalasset1 20 20
Variables Entered/Removedb
Model Variables Entered Variables Removed Method
1 LogTotalasset1a . Enter
a. All requested variables entered.
b. Dependent Variable: LogROCE1
Model Summary
Model R R Square Adjusted R SquareStd. Error of the Estimate
1 .502a .252 .210 .261351
a. Predictors: (Constant), LogTotalasset1
ANOVAb
Model Sum of Squares Df Mean Square F Sig.
1 Regression .413 1 .413 6.049 .024a
Residual 1.229 18 .068
Total 1.643 19
a. Predictors: (Constant), LogTotalasset1
b. Dependent Variable: LogROCE1
Coefficientsa
Model
Unstandardized CoefficientsStandardized Coefficients
t Sig. B Std. Error Beta
1 (Constant) 2.351 .795 2.956 .008
LogTotalasset1 -.328 .133 -.502 -2.459 .024
a. Dependent Variable: LogROCE1

www.sciedu.ca/ijba International Journal of Business Administration Vol. 4, No. 5; 2013
Published by Sciedu Press 64 ISSN 1923-4007 E-ISSN 1923-4015
Regression Analysis of DPS on Total Assets for A. G. Leventis PLC
Descriptive Statistics
Mean Std. Deviation N
AdjustedDPS1 6.46500 2.547088 20
LogTotalasset1 5.94845 .449623 20
Correlations
AdjustedDPS1
LogTotalasset1
Pearson Correlation AdjustedDPS1 1.000 .000
LogTotalasset1 .000 1.000
Sig. (1-tailed) AdjustedDPS1 . .499
LogTotalasset1 .499 .
N AdjustedDPS1 20 20
LogTotalasset1 20 20
Variables Entered/Removedb
Model Variables Entered Variables Removed Method
1 LogTotalasset1a . Enter
a. All requested variables entered.
b. Dependent Variable: AdjustedDPS1
Model Summary
Model R R Square Adjusted R Square Std. Error of the Estimate
1 .000a .000 -.056 2.616884
a. Predictors: (Constant), LogTotalasset1
ANOVAb
Model Sum of Squares df Mean Square F Sig.
1 Regression .000 1 .000 .000 .999a
Residual 123.265 18 6.848
Total 123.266 19
a. Predictors: (Constant), LogTotalasset1
b. Dependent Variable: AdjustedDPS1
Coefficientsa
Model
Unstandardized Coefficients Standardized Coefficients
t Sig. B Std. Error Beta
1 (Constant) 6.453 7.964 .810 .428
LogTotalasset1 .002 1.335 .000 .002 .999
a. Dependent Variable: AdjustedDPS1

www.sciedu.ca/ijba International Journal of Business Administration Vol. 4, No. 5; 2013
Published by Sciedu Press 65 ISSN 1923-4007 E-ISSN 1923-4015
Regression Analysis of ROCE on Total Assets for Nestle Nigeria PLC
Descriptive Statistics
Mean Std. Deviation N
LogROCE2 1.25990 .210470 20
LogTotalasset2 6.11517 .714246 20
Correlations
LogROCE2 LogTotalasset2
Pearson Correlation LogROCE2 1.000 .637
LogTotalasset2 .637 1.000
Sig. (1-tailed) LogROCE2 . .001
LogTotalasset2 .001 .
N LogROCE2 20 20
LogTotalasset2 20 20
Variables Entered/Removedb
Model Variables Entered Variables Removed Method
1 LogTotalasset2a . Enter
a. All requested variables entered.
b. Dependent Variable: LogROCE2
Model Summary
Model R R Square Adjusted R SquareStd. Error of the Estimate
1 .637a .406 .373 .166660
a. Predictors: (Constant), LogTotalasset2
ANOVAb
Model Sum of Squares df Mean Square F Sig.
1 Regression .342 1 .342 12.302 .003a
Residual .500 18 .028
Total .842 19
a. Predictors: (Constant), LogTotalasset2
b. Dependent Variable: LogROCE2
Coefficientsa
Model
Unstandardized Coefficients Standardized Coefficients
t Sig. B Std. Error Beta
1 (Constant) .112 .329 .339 .738
LogTotalasset2 .188 .054 .637 3.507 .003
a. Dependent Variable: LogROCE2

www.sciedu.ca/ijba International Journal of Business Administration Vol. 4, No. 5; 2013
Published by Sciedu Press 66 ISSN 1923-4007 E-ISSN 1923-4015
Regression Analysis of DPS on Total Assets for Nestle Nigeria PLC
Descriptive Statistics
Mean Std. Deviation N
AdjustedDPS2 2.00415E2 224.030123 20
LogTotalasset2 6.11517 .714246 20
Correlations
AdjustedDPS2 LogTotalasset2
Pearson Correlation AdjustedDPS2 1.000 .885
LogTotalasset2 .885 1.000
Sig. (1-tailed) AdjustedDPS2 . .000
LogTotalasset2 .000 .
N AdjustedDPS2 20 20
LogTotalasset2 20 20
Variables Entered/Removedb
Model Variables Entered Variables Removed Method
1 LogTotalasset2a . Enter
a. All requested variables entered.
b. Dependent Variable: AdjustedDPS2
Model Summary
Model R R Square Adjusted R SquareStd. Error of the Estimate
1 .885a .784 .772 107.071964
a. Predictors: (Constant), LogTotalasset2
ANOVAb
Model Sum of Squares df Mean Square F Sig.
1 Regression 747241.127 1 747241.127 65.179 .000a
Residual 206359.298 18 11464.405
Total 953600.426 19
a. Predictors: (Constant), LogTotalasset2
b. Dependent Variable: AdjustedDPS2
Coefficientsa
Model
Unstandardized Coefficients Standardized Coefficients
t Sig.B Std. Error Beta
1 (Constant) -1497.495 211.668 -7.075 .000
LogTotalasset2 277.655 34.392 .885 8.073 .000
a. Dependent Variable: AdjustedDPS2
www.sciedu.ca/ijba International Journal of Business Administration Vol. 4, No. 5; 2013
Published by Sciedu Press 67 ISSN 1923-4007 E-ISSN 1923-4015
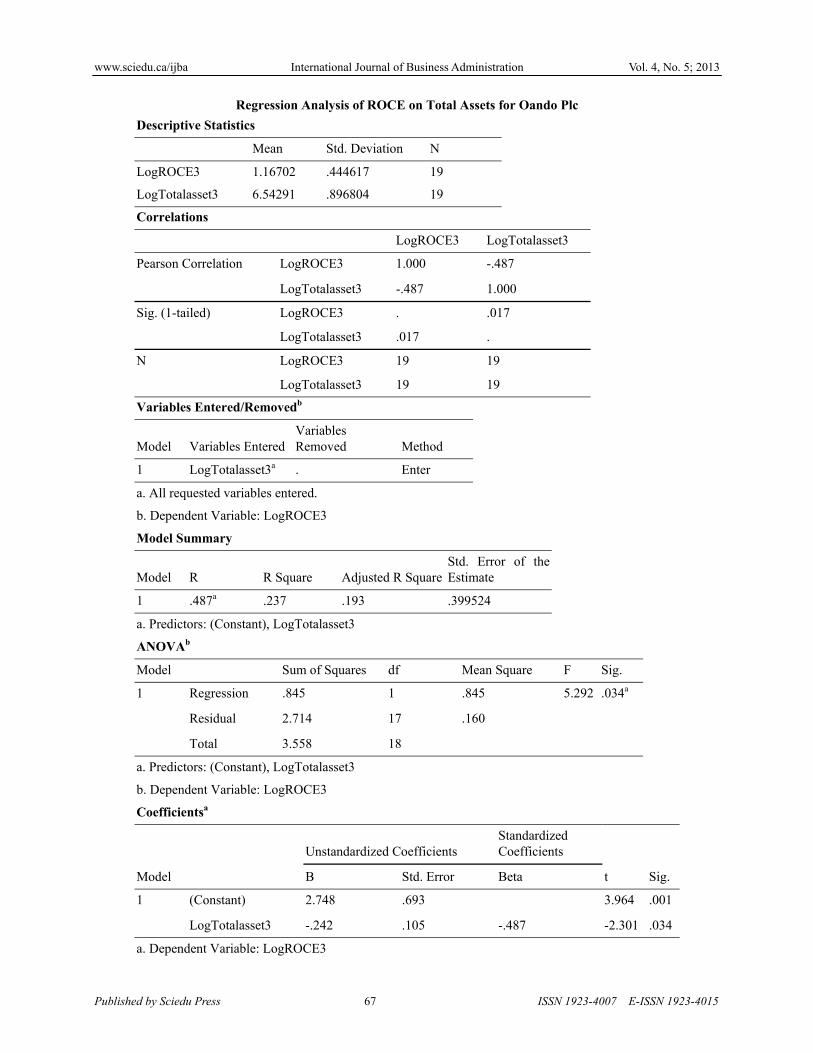
Regression Analysis of ROCE on Total Assets for Oando Plc
Descriptive Statistics
Mean Std. Deviation N
LogROCE3 1.16702 .444617 19
LogTotalasset3 6.54291 .896804 19
Correlations
LogROCE3 LogTotalasset3
Pearson Correlation LogROCE3 1.000 -.487
LogTotalasset3 -.487 1.000
Sig. (1-tailed) LogROCE3 . .017
LogTotalasset3 .017 .
N LogROCE3 19 19
LogTotalasset3 19 19
Variables Entered/Removedb
Model Variables Entered Variables Removed Method
1 LogTotalasset3a . Enter
a. All requested variables entered.
b. Dependent Variable: LogROCE3
Model Summary
Model R R Square Adjusted R SquareStd. Error of the Estimate
1 .487a .237 .193 .399524
a. Predictors: (Constant), LogTotalasset3
ANOVAb
Model Sum of Squares df Mean Square F Sig.
1 Regression .845 1 .845 5.292 .034a
Residual 2.714 17 .160
Total 3.558 18
a. Predictors: (Constant), LogTotalasset3
b. Dependent Variable: LogROCE3
Coefficientsa
Model
Unstandardized Coefficients Standardized Coefficients
t Sig.B Std. Error Beta
1 (Constant) 2.748 .693 3.964 .001
LogTotalasset3 -.242 .105 -.487 -2.301 .034
a. Dependent Variable: LogROCE3

www.sciedu.ca/ijba International Journal of Business Administration Vol. 4, No. 5; 2013
Published by Sciedu Press 68 ISSN 1923-4007 E-ISSN 1923-4015
Regression Analysis of DPS on Total Assets for Oando Plc
Descriptive Statistics
Mean Std. Deviation N
ustedAdjDPS3 1.78242E2 130.013560 19
LogTotalasset3 6.54291 .896804 19
Correlations
ustedAdjDPS3 LogTotalasset3
Pearson Correlation ustedAdjDPS3 1.000 .775
LogTotalasset3 .775 1.000
Sig. (1-tailed) ustedAdjDPS3 . .000
LogTotalasset3 .000 .
N ustedAdjDPS3 19 19
LogTotalasset3 19 19
Variables Entered/Removedb
Model Variables Entered Variables Removed Method
1 LogTotalasset3a . Enter
a. All requested variables entered.
b. Dependent Variable: ustedAdjDPS3
Model Summary
Model R R Square Adjusted R SquareStd. Error of the Estimate
1 .775a .601 .577 84.551193
a. Predictors: (Constant), LogTotalasset3
ANOVAb
Model Sum of Squares df Mean Square F Sig.
1 Regression 182732.093 1 182732.093 25.561 .000a
Residual 121531.373 17 7148.904
Total 304263.466 18
a. Predictors: (Constant), LogTotalasset3
b. Dependent Variable: ustedAdjDPS3
Coefficientsa
Model
Unstandardized Coefficients Standardized Coefficients
t Sig.B Std. Error Beta
1 (Constant) -556.855 146.686 -3.796 .001
LogTotalasset3 112.350 22.222 .775 5.056 .000
a. Dependent Variable: ustedAdjDPS3

www.sciedu.ca/ijba International Journal of Business Administration Vol. 4, No. 5; 2013
Published by Sciedu Press 69 ISSN 1923-4007 E-ISSN 1923-4015
Regression Analysis of ROCE on Total Assets for GlaxoSmithKline Consumer PLC
Descriptive Statistics
Mean Std. Deviation N
LogROCE4 1.02541 .346948 20
LogTotalasset4 5.80372 .782698 20
Correlations
LogROCE4 LogTotalasset4
Pearson Correlation LogROCE4 1.000 -.643
LogTotalasset4 -.643 1.000
Sig. (1-tailed) LogROCE4 . .001
LogTotalasset4 .001 .
N LogROCE4 20 20
LogTotalasset4 20 20
Variables Entered/Removedb
Model Variables Entered Variables Removed Method
1 LogTotalasset4a . Enter
a. All requested variables entered.
b. Dependent Variable: LogROCE4
Model Summary
Model R R Square Adjusted R SquareStd. Error of the Estimate
1 .643a .413 .380 .273125
a. Predictors: (Constant), LogTotalasset4
ANOVAb
Model Sum of Squares df Mean Square F Sig.
1 Regression .944 1 .944 12.659 .002a
Residual 1.343 18 .075
Total 2.287 19
a. Predictors: (Constant), LogTotalasset4
b. Dependent Variable: LogROCE4
Coefficientsa
Model
Unstandardized Coefficients Standardized Coefficients
t Sig. B Std. Error Beta
1 (Constant) 2.679 .469 5.716 .000
LogTotalasset4 -.285 .080 -.643 -3.558 .002
a. Dependent Variable: LogROCE4

www.sciedu.ca/ijba International Journal of Business Administration Vol. 4, No. 5; 2013
Published by Sciedu Press 70 ISSN 1923-4007 E-ISSN 1923-4015
Regression Analysis of DPS on Total Assets for GlaxoSmithKline Consumer PLC
Descriptive Statistics
Mean Std. Deviation N
AdjustedDPS4 1.56300E1 7.107824 20
LogTotalasset4 5.80372 .782698 20
Correlations
AdjustedDPS4 LogTotalasset4
Pearson Correlation AdjustedDPS4 1.000 .468
LogTotalasset4 .468 1.000
Sig. (1-tailed) AdjustedDPS4 . .019
LogTotalasset4 .019 .
N AdjustedDPS4 20 20
LogTotalasset4 20 20
Variables Entered/Removedb
Model Variables Entered Variables Removed Method
1 LogTotalasset4a . Enter
a. All requested variables entered.
b. Dependent Variable: AdjustedDPS4
Model Summary
Model R R Square Adjusted R Square
Std. Error of the Estimate
1 .468a .219 .176 6.452409
a. Predictors: (Constant), LogTotalasset4
ANOVAb
Model Sum of Squares Df Mean Square F Sig.
1 Regression 210.497 1 210.497 5.056 .037a
Residual 749.405 18 41.634
Total 959.902 19
a. Predictors: (Constant), LogTotalasset4
b. Dependent Variable: AdjustedDPS4
Coefficientsa
Model
Unstandardized Coefficients Standardized Coefficients
t Sig. B Std. Error Beta
1 (Constant) -9.051 11.071 -.818 .424
LogTotalasset4 4.253 1.891 .468 2.249 .037
a. Dependent Variable: AdjustedDPS4

www.sciedu.ca/ijba International Journal of Business Administration Vol. 4, No. 5; 2013
Published by Sciedu Press 71 ISSN 1923-4007 E-ISSN 1923-4015
Regression Analysis of ROCE on Total Assets for TOTAL Nigeria PLC
Descriptive Statistics
Mean Std. Deviation N
LogROCE6 1.72906 .113586 20
LogTotalasset6 6.22873 .541650 20
Correlations
LogROCE6 LogTotalasset6
Pearson Correlation LogROCE6 1.000 -.026
LogTotalasset6 -.026 1.000
Sig. (1-tailed) LogROCE6 . .456
LogTotalasset6 .456 .
N LogROCE6 20 20
LogTotalasset6 20 20
Variables Entered/Removedb
Model Variables Entered Variables Removed Method
1 LogTotalasset6a . Enter
a. All requested variables entered.
b. Dependent Variable: LogROCE6
Model Summary
Model R R Square Adjusted R SquareStd. Error of the Estimate
1 .026a .001 -.055 .116657
a. Predictors: (Constant), LogTotalasset6
ANOVAb
Model Sum of Squares df Mean Square F Sig.
1 Regression .000 1 .000 .013 .912a
Residual .245 18 .014
Total .245 19
a. Predictors: (Constant), LogTotalasset6
b. Dependent Variable: LogROCE6
Coefficientsa
Model
Unstandardized Coefficients Standardized Coefficients
t Sig. B Std. Error Beta
1 (Constant) 1.764 .309 5.710 .000
LogTotalasset6 -.006 .049 -.026 -.112 .912
a. Dependent Variable: LogROCE6

www.sciedu.ca/ijba International Journal of Business Administration Vol. 4, No. 5; 2013
Published by Sciedu Press 72 ISSN 1923-4007 E-ISSN 1923-4015
Regression Analysis of DPS on Total Assets for TOTAL Nigeria PLC
Descriptive Statistics
Mean Std. Deviation N
AdjustedDPS6 4.99500E2 353.738183 20
LogTotalasset6 6.22873 .541650 20
Correlations
AdjustedDPS6 LogTotalasset6
Pearson Correlation AdjustedDPS6 1.000 .878
LogTotalasset6 .878 1.000
Sig. (1-tailed) AdjustedDPS6 . .000
LogTotalasset6 .000 .
N AdjustedDPS6 20 20
LogTotalasset6 20 20
Variables Entered/Removedb
Model Variables Entered Variables Removed Method
1 LogTotalasset6a . Enter
a. All requested variables entered.
b. Dependent Variable: AdjustedDPS6
Model Summary
Model R R Square Adjusted R SquareStd. Error of the Estimate
1 .878a .770 .758 174.150582
a. Predictors: (Constant), LogTotalasset6
ANOVAb
Model Sum of Squares df Mean Square F Sig.
1 Regression 1831571.686 1 1831571.686 60.391 .000a
Residual 545911.654 18 30328.425
Total 2377483.340 19
a. Predictors: (Constant), LogTotalasset6
b. Dependent Variable: AdjustedDPS6
Coefficientsa
Model
Unstandardized Coefficients Standardized Coefficients
t Sig.B Std. Error Beta
1 (Constant) -3070.892 461.087 -6.660 .000
LogTotalasset6 573.214 73.761 .878 7.771 .000
a. Dependent Variable: AdjustedDPS6


![STRUCTURING MERGERS & ACQUISITIONS - Willkommen MERGERS & ACQUISITIONS Chapter 3 ... Profitability 29 [1] Analysis of Return on Sales 30 [a] ... Total Invested Capital 137 [2]](https://img.pdfslide.us/doc/110x75/5af4dd857f8b9a4d4d8e4145/structuring-mergers-acquisitions-mergers-acquisitions-chapter-3-profitability.jpg)