Embed Size (px)
Citation preview
University of North Florida University of North Florida
UNF Digital Commons UNF Digital Commons
UNF Graduate Theses and Dissertations Student Scholarship
2013
Effect of Blood Collection Practices on Emergency Department Effect of Blood Collection Practices on Emergency Department
Blood Specimen Rejection Rates Blood Specimen Rejection Rates
Barbara K. Vernoski University of North Florida, [email protected]
Follow this and additional works at: https://digitalcommons.unf.edu/etd
Part of the Emergency Medicine Commons, Nursing Commons, and the Other Medical Sciences
Commons
Suggested Citation Suggested Citation Vernoski, Barbara K., "Effect of Blood Collection Practices on Emergency Department Blood Specimen Rejection Rates" (2013). UNF Graduate Theses and Dissertations. 438. https://digitalcommons.unf.edu/etd/438
This Doctoral Project is brought to you for free and open access by the Student Scholarship at UNF Digital Commons. It has been accepted for inclusion in UNF Graduate Theses and Dissertations by an authorized administrator of UNF Digital Commons. For more information, please contact Digital Projects. © 2013 All Rights Reserved
EFFECT OF BLOOD COLLECTION PRACTICES ON EMERGENCY DEPARTMENT
BLOOD SPECIMEN REJECTION RATES
by
Barbara Klos Vernoski
A project submitted to the School of Nursing
in partial fulfillment of the requirements for the degree of
Doctor of Nursing Practice
UNIVERSITY OF NORTH FLORIDA
BROOKS COLLEGE OF HEALTH
Unpublished work © Barbara Klos Vernoski
March, 2013
Certificate of Approval
The project of Barbara Klos Vernoski is approved: Date:
M. Catherine Hough, Committee Member
Patrick Monaghan, Committee Member,
Kathaleen C. Bloom, Committee Chairperson
Accepted for the School of Nursing:
Lillia Loriz, Director, School of Nursing
Accepted for the College:
Pamela S. Chally, Dean, Brooks College of Health
Accepted for the University:
Len Roberson, Dean of the Graduate School
iii
Dedication
I dedicate this paper to my parents, Jerry and Rosemarie, who viewed education as a life
long investment and taught me anything was possible if I put my mind to it. Thank you for your
love and support all these years; I love you both!
I am extremely thankful to my Chair and mentor, Dr. Kathaleen Bloom, for her guidance
and stamina keeping me on task, and for refocusing me when I got derailed. I sincerely
appreciate the many hours of personal time that Susan Depalma spent manually building the
laboratory rejection rate reports that provided the data central to this study. I will forever be
indebted to her for her unwavering contribution to this project. I am extremely grateful to my
boss, Greg Miller, who supported my doctoral journey every step of the way, and to Patrice
Jones, VP Patient Care Services and CNE, who helped facilitate a smooth and timely project
start. I appreciate the guidance Berta Christopher provided me in navigating the IRB
requirements, editing my submission, and getting my package through the IRB process while
maintaining my sanity! I extend a special thanks to all of the ED staff who made this study
possible; you are an awesome group of professional nurses and EDTs!
My success in this project and throughout all of my program studies is due in a very large
part to my spouse, Ken, who was always coaxing me to refocus when I lost my way. And finally
I thank my children Josh, Katie, and Nick for all of their support and encouragement from both
near and far. You all were the anchor that kept me from drifting too far off course! I love you
all!
iv
Table of Contents
List of Tables .................................................................................................................... vi
Abstract ............................................................................................................................ vii
Chapter 1: Introduction
Problem Statement ........................................................................................................3
Purpose ..........................................................................................................................5
Definition of Terms .......................................................................................................6
Chapter 2: Review of the Literature
The Laboratory Specimen Total Testing Process ........................................................ 9
Pre-Analytic Phase ......................................................................................................10
Consequences of Rejected Specimens and Delayed Test Results ..............................12
Evidence Regarding Blood Collection Processes .......................................................13
IV Catheter Size ....................................................................................................14
Blood Collection Devices .....................................................................................15
Use of a Discard Volume ......................................................................................16
Blood Specimen Transport ...................................................................................18
Reliability of IV Catheters as a Source for Blood Specimens ...............................19
Training in Blood Specimen Collection .....................................................................19
Summary .....................................................................................................................20
Chapter 3: Design and Methodology
Design .........................................................................................................................21
Setting and Sample .....................................................................................................21
Current Blood Collection Practices ............................................................................22
Evidence-based p-VAD Blood Collection Procedure .................................................25
Methods .......................................................................................................................26
Subject Recruitment ..............................................................................................26
Intervention Plan ...................................................................................................27
Laboratory Analysis ..............................................................................................28
Data Collection .....................................................................................................29
Summary .....................................................................................................................30
Chapter 4: Results
Participant Demographics .......................................................................................... 31
Study Intervention Completion ...................................................................................32
Data Analysis ..............................................................................................................34
Results .........................................................................................................................36
Specimen Collection and Rejection ......................................................................36
Differences in Rejection Rates after Intervention .................................................36
v
Summary .....................................................................................................................39
Chapter 5: Conclusions
Post-Intervention Rejection Rates ...............................................................................41
Limitations to the Practice Change Intervention ........................................................42
Implications for Practice ..............................................................................................43
Implications for Future Research ................................................................................44
Summary .....................................................................................................................44
Appendices
Appendix A: Evidence Summary ..............................................................................45
Appendix B: Evidence-based p-VAD Blood Collection Protocol ............................... 49
Appendix C: Participant Demographic Questionnaire ..............................................56
Appendix D: ED Blood Specimen Collection Skill Competency Checklist ............57
References .........................................................................................................................58
Vita ....................................................................................................................................64
vi
List of Tables
Table 4.1 Work Experiences of Participants .....................................................................32
Table 4.2 Education and Certifications of Participants ....................................................33
Table 4.3 Pre- and Post-Intervention Specimen Data .......................................................35
Table 4.4 Total Tests Ordered in the Three ED Areas ......................................................36
Table 4.5 Rejection Data by ED Area and Work Shift ......................................................37
Table 4.6 Specimen Rejection Reasons and Pre- and Post-Intervention Comparisons .....37
Table 4.7 Chi-Square Analysis of Pre- and Post-Intervention Rejection Rates by
ED Area .............................................................................................................38
Table 4.8 Chi-Square Analysis of Pre- and Post-Intervention Rejection Rates by
Week Day...........................................................................................................39
Table 4.9 Comparison of Post-Intervention Total ED and Week Day Rejection Rates ....39
vii
Abstract
The practice of obtaining blood as part of the placement of a new peripheral venous
access device (p-VAD) is a frequent practice in the emergency department (ED). Of the
concerns related to this practice is the possibility of laboratory specimen rejection due to p-VAD
catheter size, use of the wrong collection device, and the absence of a standardized collection
process. The objective of this study, therefore, was to examine the effect of the use of evidence-
based venipuncture and p-VAD blood collection protocols on the rejection rate of blood
specimens drawn by staff in the adult areas of an urban academic medical center ED.
A convenience sample of 28 ED nurses and 39 ED technicians (51.94% of all eligible ED
employees) consented to using these evidence based protocols when they collected blood from
adult ED patients. Blood specimen rejections rates were measured for four consecutive weeks
prior to and at weeks 1-4, 5-8, 9-12, and 1-12 after the evidence-based blood collection practices
training intervention. Laboratory analysis of all specimens was automated with rejection results
provided in the form of computerized reports.
There was a significant decrease in the 12-week rejection rates for two of the three ED
adult care areas, with the overall ED adult area rejection rate significantly decreased from 3.19%
to 2.38% (X2
at Df1, p < .05). The most common reasons for rejection were hemolysis (65.39%)
and clotting (10.68%) followed by specimen mis-labeling, tube missing, insufficient quantity for
testing, incorrect packaging, specimen contamination or dilution, and label missing, Though the
use of theses evidence based blood collection protocols significantly decreased the overall
rejection rate, the high percent of rejections due to hemolysis may further be reduced by having
all ED staff use these protocols, and by exploring other collection techniques in the literature that
have been found to significantly decrease rejection rates.
Chapter 1: Introduction
Blood specimens provide a window into the body’s internal status at the time the sample
is collected, making laboratory blood analysis one of several mechanisms used by Emergency
Department (ED) providers, i.e. physicians, physician assistants and nurse practitioners, to
diagnose and treat patients. With laboratory test results comprising about 80% of the
information base used by clinicians in their treatment decisions (Boone, 2004), correct and
timely blood specimen collection is integral to appropriate patient diagnosis and treatment.
Working in direct opposition to obtaining high quality blood specimens is the over-crowded,
high pressure ED work environment that demands rapid laboratory turnaround times leading to a
“need for speed” atmosphere that fosters errors in blood collection, handling and transport
processes caused by incorrect patient identification, specimen trauma, incorrect order of the
draw, and inadequate mixing of the collected specimen tubes (Smith, 2007). These demands and
errors can result in rejected specimens that require recollection and thus give rise to delayed
treatment, extended ED stays, overcrowding, poor ED patient throughput, and provider, staff and
patient dissatisfaction (Dugan, Leech, Speroni, & Corriher, 2005; Lowe et al., 2008).
The first phase of the laboratory testing cycle, the pre-analytic phase, begins with the
written order for the laboratory test, identification of the patient, specimen collection and
labeling, and ends with specimen transportation to the laboratory (Plebani, 2007). Blood
specimen rejection rates in this phase have been the subject of many studies and remain an issue
of concern with some studies finding up to 68.2% of all errors occurring in this phase (Plebani,
2006). Lippi, Guidi, Mattiuzzi and Plebani (2006) and Smith (2007) identified the absence of
2
standardized blood collection procedures as a key reason for the errors that continue to occur in
the total testing cycle. The greater the number of personnel involved in specimen collection and
the lower their adherence to specimen collection policies, the greater the opportunity for errors to
occur in this phase. The pre-analytic phase, as it occurs in the ED, is the focus of this project.
Specimen rejection can increase staff dissatisfaction with laboratory services, result in
blood specimen recollection, and extend patient ED lengths of stay in some cases up to 60
minutes (Stauss et al., 2012). The ED staff commonly believe the cause of specimen rejection
lies with the laboratory and not with the ED member’s blood collection process (Carraro &
Plebani, 2007). Decreasing the incidence of blood specimen recollection rates can lead to shorter
laboratory specimen turn-around-times (TAT) and ED patients wait-to-be-seen times thus
facilitating more timely diagnosis, treatment and ED patient discharge (Fernandes, Walker,
Price, Marsden & Haley, 1997).
Steindel and Howantiz (2001) reported the majority of ED providers are highly
dissatisfied with laboratory TAT delays, believing these lead to treatment delays and increased
ED lengths of stay. The facility that is the subject of this project has witnessed increased ED
lengths of stay leading to a backlog in patient throughput, increased ED wait-to-be-seen times,
overcrowding, and patients leaving the ED without being seen by a provider resulting in
decreased ED patient volumes and revenue. The Clinical and Laboratory Standards Institute
(CLSI, 2007), an internationally known center for clinical laboratory standards and accreditation,
noted that laboratory TAT delays have been associated with errors occurring in the specimen
collection, handling and transport steps of the laboratory pre-analytic phase, and with post-
analytic phase results reporting. The institute further declared that non-analytic phase errors
could best be prevented through the use of established processes that target error prevention.
3
The Institute of Medicine (IOM, 2000) listed medical errors as the eighth leading cause
of death and proposed they can best be decreased by delivering care that is safe, timely, efficient,
effective, equitable and patient-centered. In response to the Institute of Medicine reports, a
Quality Institute Conference was held in 2003 that focused on improving patient safety. The
attendees included the Centers for Disease Control and Prevention (CDC) and 41 partners in
laboratory services. The conference identified improved pre- and post-analytic testing processes,
development and use of a set of testing process core indicators, improved laboratory-clinician
communication, improved laboratory practice and service surveillance, and the use of evidence-
based best practices as ways to improve laboratory services safety and efficacy (Boone, 2004). In
response to a call by the World Health Organization to provide test results that are timely and
accurate, the Education and Management Division of the International Federation of Clinical
Chemistry and Laboratory Medicine (IFCC, n.d.) established a working group to focus on
laboratory errors and patient safety. In support of the Institute of Medicine’s call to decrease
medical errors and an IFCC work group project to decrease laboratory errors through safer
processes, the focus of this project is to determine if the use of evidence-based blood collection
processes by ED staff will reduce the rejection rate of ED blood specimens.
Problem Statement
The clinical question posed by this study is: “In laboratory blood specimens collected by
emergency department nurses and technician staff, will the use of evidence-based practice
venipuncture and p-VAD blood collection practices by that staff decrease the ED blood
specimen rejection rate?”
The current facility rate of rejected blood specimens is 2% with a rate of 4% in the ED
compared to a 0.3% rate in the critical care units. Rejection rates in the critical care units are
4
hypothesized to be low due to the controlled nurse-to-patient ratio of 1:2 along with a less rushed
patient care setting as compared to the ED. Limited laboratory phlebotomy personnel resources
has restricted the assignment of laboratory technologists to the inpatient non-critical care areas
leaving ED laboratory specimen collection in the hands of the nurses, emergency department
technicians (EDTs), and to emergency medicine residents.
The vast majority of ED blood specimens are obtained as part of the insertion of a newly
placed peripheral venous access device (p-VAD). Despite the higher rejection rates of
specimens obtained from p-VADs as compared to venipuncture acquisition (Grant, 2003;
Kennedy et al., 1996; Lowe et al., 2008), the staff view the p-VAD method as negating the need
for an additional venipuncture, decreasing patient discomfort, and as a time saver for the staff
charged with obtaining the blood specimen. Though all ED clinical staff are licensed to collect
blood samples, the vast majority of laboratory specimens are obtained by the EDTs allowing the
nurses to provide higher levels of patient care in an overcrowded ED.
The ED nurses are trained in blood specimen collection venipuncture and p-VAD
techniques during their orientation by their nurse preceptor. The extent of the training is directly
dependent on the nurse preceptor’s knowledge, skills and experience base. Criteria to become a
preceptor includes two years of emergency nursing experience, evaluation ratings of average or
above average, ability to work well with others and no disciplinary actions within the last 6
months. Currently training is not guided by any specific policy or procedure, and no processes
exist to verify nurse preceptor or staff nurse phlebotomy competency skills on a recurring basis.
The two experienced lead EDTs train and verify the EDT staff in blood specimen
collection venipuncture and p-VAD technique competencies according to a skills competency
checklist based on published blood collection techniques found in national nursing procedure
5
reference books. No process exists to validate the two lead EDTs blood collection skills.
Training is provided to EDT staff during orientation and annually thereafter. Though a laboratory
evidence-based practice venipuncture blood collection policy is available on the hospital’s
electronic information network, it has not been adopted by the ED staff. Neither an established
hospital nor ED policy exists that governs blood specimens obtained via a p-VAD.
The high ED blood specimen rejection rates, the use of p-VADs as the primary source for
obtaining blood samples, the absence of written ED blood collection policies, the failure of ED
staff to follow the hospital’s laboratory venipuncture policy, and the absence of annual skill
competency assessment for all staff has led to exploring the use of evidence-based blood
collection practices as a means to decrease pre-analytic phase blood specimen collection errors in
the ED.
Purpose
The purpose of this study is to examine the effect of the use of two evidence-based
practice blood collection protocols, the existing laboratory venipuncture protocol and the p-VAD
protocol developed for this project, on the rejection rate of blood specimens drawn by staff in an
urban academic tertiary care medical center ED. This study focuses on the ED portion of the
laboratory test cycle pre-analytic phase which extends from the time the specimen is ordered
until it is received in the laboratory for accessioning prior to analysis.
The project will compare blood specimen rejection rates in samples drawn after staff
have been trained in the two evidence-based practice blood collection processes as compared to
specimens collected by ED staff prior to training. The hypothesis to be tested is that there will be
a decrease in the rejection rate of ED blood specimens drawn after ED staff have been trained in
evidence-based practice blood collection practices. This project was approved by the
6
Institutional Review Boards located at the principal investigator’s university and the hospital in
which the study was conducted, and is in compliance with the federal Health Insurance
Portability and Accountability Act (HIPAA) of 1996.
Definition of Terms
ED Staff
For the purposes of this study, ED staff refers to registered nurses, licensed practical
nurses, and emergency department technicians. The registered nurses and licensed practical
nurses are jointly referred to as nurses.
p-VAD
A p-VAD is a peripherally inserted venous access device that is typically placed in the
patient’s hand, forearm or antecubital area. The device may be in the form of an intravenous
catheter with a continuous infusion, or an intravenous catheter saline lock device (SLD) in which
the hub of the catheter has been capped with a port adapter that allows for intermittent infusions
and blood collections. The latter is kept patent by an intermittent flush of normal saline. The
location of p-VAD placement is usually left to the discretion of the staff member inserting it.
For the purpose of this study, the blood collected will only be obtained from the SLD type of p-
VAD as current ED protocol does not allow p-VADs with infusing fluids to be used for the
collection of laboratory blood specimens.
The blood specimens included in this study are limited to those tests resulted through the
main core laboratory information system and include, but are not limited to, hematology studies
such as complete blood counts, coagulation studies including prothrombin time/partial
thromboplastin time, chemistry studies such as basic metabolic panels and troponin levels, and
blood specimens submitted to transfusion services. These tests comprise the bulk of all blood
7
ED collected for laboratory analysis with rejection rates automatically reported on a computer-
generated report.
Order-of-Draw
The order-of-draw refers to the order in which the tubes are filled with blood. This
sequence of blood tube collection was first identified in the late 1970s when the presence of
additive carryovers into collection tubes was found to occur (Ernst & Calam, 2004). Established
to prevent errors caused by the carryover of additives when multiple tubes are collected, it has
been revised over the years to stay current with changes in collection tube additives. The current
Clinical and Laboratory Standards Institute (2007) standard specifies blood tubes be filled in the
following order-of-draw sequence: blood culture tube, light blue top, red top, green top (light or
medium green), lavender, pink or white or royal blue, and gray.
Specimen Rejection
The term specimen rejection refers to specimens that the laboratory determines are unable
to be analyzed or must be recollected due to, but not inclusive of, a wrong or missing patient
label, an incompetent specimen container, inadequate specimen volume, hemolysis, and failure
of the specimen to arrive in the laboratory (Dale & Novis, 2002). Hemolysis causes almost 60%
of all rejected blood specimens (Lippi, Salvagno, Montagnana, Brocco & Guidi, 2006), and is
defined as “the rupture of red blood cells with release of hemoglobin and other intracellular
contents into the plasma that can alter laboratory test results” (Lowe et al., 2008, p. 27). Unless
cancelled by the ordering provider, or found to be an actual duplicate specimen, hospital policy
requires rejected specimens to be recollected. For the purpose of this study, a test specimen is
considered rejected if the automated laboratory rejection report lists it as clotted, contaminated,
diluted, hemolyzed, labeling missing or specimen mislabeled, too old to be analyzed, packaged
8
incorrectly (no on ice, specimens from two different patients in the same zip-lock bag), quantity
not sufficient for testing, questionable results, tube empty or missing, and wrong tube for test
submitted. Though a national hemolysis rate benchmark is available, no national benchmark for
blood specimen rejection rate could be found in the literature. Some authors have identified rates
as low as 0.28% to 0.62% in organizations focused on improving this metric with ED rejection
rates from 2.2% to 27.4%, and as much as twice the rate of inpatient units (Shahangian &
Snyder, 2009; Starke et al., 2007; Zarbo et al., 2002).
Training
Didactic training was the modality used to educate and train consented ED staff in the
evidence-based blood collection practices. Training occurred in the ED conference room and
included a video made by the principal investigator on the blood collection practices that
employed the supplies currently used and available in the ED. Staff who orally consented to
participate were then trained by the principal investigator. Training began with a discussion of
the key blood specimen collection elements and related rationale and reinforced with the video.
The session ended with participants verbalizing the venipuncture and p-VAD blood collection
methods and their rationale to the principal investigator. Participants were determined to be
competent when their responses were consistent with the evidence-based competency checklist.
Every two weeks, for the first eight weeks post-intervention, newly reporting staff were given the
opportunity to meet with the principal investigator and be orally consented to participate in this
study.
9
Chapter 2: Review of the Literature
This chapter provides an overview of the literature related to factors influencing pre-
analytic rejection rates of blood specimens collected from patients. The literature search
strategies will be identified followed by an evaluation and synthesis of the evidence regarding
evidence-based practices for blood collected from p-VADs that have shown to decrease
specimen rejections rates in the pre-analytic laboratory phase. Over half of the literature
reviewed focused on decreasing hemolysis as related to blood specimen rejection rates.
The CLSI is a voluntary consensus standards organization that has grown since its
creation in 1967 to become a World Health Organization Collaborating Center for Clinical
Laboratory Standards and Accreditation dedicated to improving healthcare quality through the
development of best practice based clinical and laboratory standards. A review of the most
current CLSI procedure for collecting blood specimens by venipuncture was obtained from the
hospital microbiology clinical supervisor, reviewed and found to include evidence-based practice
processes aimed at controlling for many of the errors previously mentioned (CLSI, 2007).
The Laboratory Specimen Total Testing Process
The total laboratory specimen testing process is comprised of the pre-analytic, the
analytic and the post-analytic phases. Boone (2004) describes this process as follows. The pre-
analytic phase begins with the treating provider developing the clinical question that leads to the
identification and ordering of laboratory tests followed by specimen collection and transport to
the laboratory. This phase ends in the laboratory after the specimen has been received, processed
and prepared for analysis. The next phase is the analytic phase in which the specimen is
10
analyzed with the results interpreted and verified. The post-analytic phase is the final phase and
is comprised of the formation of the results report, provider or originator results notification,
provider’s interpretation of the results, and subsequent follow-up treatment decisions.
Plebani & Carraro (1997) found the distribution of laboratory errors in these phases to be
68.2% in the pre-analytic phase, 13.3% in the analytic phase, and18.5% in the post-analytic
phase. Thought the overall error rate decreased significantly in the replication study they
conducted 10 years later, the error distribution changed little with rates listed as 61.9%, 15% and
23.1% for the phases respectively (Carraro & Plebani, 2007). Of the errors found, the initial
study revealed 74% were preventable with 6% resulting in inappropriate treatment outcomes
while the latter study revealed 73% preventable errors with 24% having a negative patient care
outcome. Given its consistently high error rate, the pre-analytic phase is the phase most in need
of improvement, and will be the focus of the remainder of this discussion.
Pre-Analytic Phase
Overall responsibility for and quality control of all the intra-ED variables in this phase
lies entirely with the ED member collecting the blood. This phase begins with the written order
for the laboratory test, correct patient identification, specimen collection, specimen container
labeling and handling, and ends with specimen transportation to the laboratory (Plebani, 2007).
Errors may occur anywhere in the pre-analytic phase and often result in rejected specimens -
specimens that are not processed through to test result reporting. Errors in this phase may be
heightened by the absence of an established blood collection policy, the failure of staff to adhere
to one, or the lack of staff refresher training (Burns & Yoshikawa, 2002; Dugan et al., 2005).
Potential pre-analytic phase process errors include duplicate test orders from the same or
multiple clinicians, incorrect patient identification by the person performing the blood specimen
11
collection, or mislabeled or unidentified specimens (Smith, 2007; Wagar, Tamashiro, Bushra,
Lilborne, & Bruckner, 2006). The use of an existing peripheral intravenous line for blood
collection, use of small fragile veins for a direct venipuncture, inappropriate catheter or needle
size, vein trauma due to vigorous needle probing, failure to allow the puncture site skin to dry
after cleansing, and excessive shear force when using a needle-syringe collection system are all
associated with a higher level of rejected specimens (Becan-McBride, 1999; Bush & Mangan,
2003; Lippi, Salvagno, Montagnana, Brocco, & Guidi, 2006; Smith, 2007; Wagar et al., 2006).
Hemolysis of laboratory specimens is the most common cause of rejected specimens,
responsible for 60% of all rejections (Lippi, Salvagno, Montagnana, Brocco, et al., 2006) and is
due primarily to improper specimen collection and handling (Bush & Mangan, 2003). Errors
commonly associated with hemolysis include the use of the wrong collection container,
inappropriate specimen volume, failure to follow the order of draw, failure to adequately rotate
the filled tubes to ensure thorough specimen-additive mixing, specimen trauma through vigorous
shaking, contamination, improper handling, compromised collection container integrity, and
improper transport from the time of draw to arrival in the laboratory (Becan-McBride, 1999;
Bush & Mangan, 2003; Smith, 2007; Wagar. Tamashiro, Bushra, Lilborne & Bruchner, 2006).
Delays in pre-analytic specimen collection and transport to the laboratory may be
attributed to increased patient care loads caused by high ED patient volumes or understaffing, the
temporary absence of the patient who is out of the ED for diagnostic testing or delays in
delivering specimens to the laboratory. The absence of an electronic health record (EHR) system
may contribute to delays in locating paper healthcare records containing the laboratory test
orders resulting in delayed order entry by clerical staff particularly during times of peak patient
volumes. Inattention to detail and multi-tasking by overworked ED staff members may lead to
12
failures in following established blood collection procedures resulting in a variety of errors that
could lead to specimen rejection.
Consequences of Rejected Specimens and Delayed Test Results
Rejected specimens carry with them consequences to the patient, to beside ED staff, to
ED providers, to the laboratory, and to the hospital. This ED has seen the rejection and
subsequent recollection of blood tests result in extending ED patient’s length of stay up to three
hours with the ordering provider having to wait this amount of time to finalize the patient’s
treatment plan. Recollection requires patients to undergo an uncomfortable second venipuncture,
which carries with it the risk of infection inherent to any disruption of the skin’s integrity.
ED staff are faced with having to interrupt their care delivery processes to recollect
rejected blood samples. This additional unplanned workload can delay their care delivery, slow
down ED patient throughput due to delayed discharges pending repeat laboratory analysis, and
increase costs (Ong, Chan, & Lim, 2008). All of these consequences may in turn increase staff
frustration with their workload and the laboratory, and lead to decreased work satisfaction. The
time spent recollecting rejected specimens can leave ED provider staff frustrated and highly
dissatisfied with the laboratory, believing the resultant care delays and longer patient lengths of
stay are the fault solely of the laboratory staff (Steindel & Howantiz, 2001).
The hospital may be affected financially by rejected specimens and specimen collection
inefficiencies that may lead to higher costs (Ong et al., 2008). With the advent of the Centers of
Medicare and Medicaid Services (CMS) mandated Hospital Consumer Assessment of Healthcare
Providers and Systems (HCAHPS®) discharge survey, the facility is concerned that admitted ED
patients may give the hospital low scores based on the recollection of blood specimens and
subsequent prolonged ED stay. At 30 percent of the composite score, HCAHPS® directly
13
contribute to the hospital’s final value-based purchasing score that determines federal healthcare
CMS reimbursement dollars for hospitals (Lehman & Goldstein, 2012). A lower CMS
reimbursement could be financially devastating for non-profit healthcare organizations.
Additionally, the availability of these scores on the Internet enables prospective patients to use
them in selecting where they want to spend their healthcare dollars. For facilities located in a
hospital-rich community environment, low HCAHPS® scores could lead to a decline in their
consumer base resulting in lower revenue generation and leaving the organization scurrying for
ways to recover from these losses and still meet their budgeted bottom line.
Evidence Regarding Blood Collection Processes
An electronic review of the literature was conducted using the university library
composite database of internal documents, ProQuest Health and Medicine, CINAHL, and the
Cochrane Library using the following search terms: blood sample, blood draw, emergency
department, hemolysis, pneumatic tube, phlebotomy, peripheral catheter, peripheral device, and
saline lock. Articles were retained for analysis if they pertained to an ED or ED-like setting, had
a study population limited to adult patients, focused on decreasing specimen rejection rates,
addressed collection devices and methods (p-VADs and venipuncture), explored the use of
discard blood volumes or use of pneumatic tube system specimen transport, and demonstrated
sound statistical analysis. The strength of the evidence cited was rated according to the evidence
hierarchy identified by Melnyk and Fineout-Overholt (2005) with the selected articles
summarized in Appendix A. Following is a synthesis of the evidence-based best practices used to
develop the resultant p-VAD blood collection policy.
14
IV Catheter Size
Several studies identified catheter size as a factor that significantly affected the viability
of blood specimens submitted for laboratory analysis. Kennedy et al. (1996) conducted a
randomized prospective study comparing the effect of various factors on blood hemolysis in
specimens obtained two groups of adult ED patients. They compared hemolysis rates between
blood specimens collected via direct venipuncture with a 21-gauge needle, the control group A,
to those collected from peripheral intravenous catheters with a 12-ml syringe and an 18-gauge
syringe-to-tube transfer needle, group B. The catheter gauges used in the study were 14, 16, 18,
20, 22, and 24, and were found to have respective hemolysis rates of 0%, 0%, 10%, 15%, 25%
and 100%. A data regression analysis revealed a significant inverse correlation between the
degree of hemolysis and catheter size. This study was categorized as a level-2 study as it
contained a well-designed randomized control trial.
Burns and Yoshikawa (2002) conducted a concurrent observational study of 204 ED
blood specimens collected by ED staff and was a weaker level-6 body of evidence due to its
descriptive nature. Specimen hemolysis was found to be statistically higher in samples collected
from 22-gauge peripheral intravenous (IV) catheters as compared to 20g catheters regardless of
the collection device used or presence of extension tubing. Dugan et al. (2005) conducted a
prospective observational study that examined blood collected by ED staff from newly inserted
peripheral IV catheters in ED patients and revealed a level-6 hierarchy of evidence. A total of
100 observations were done that yielded 382 specimens. The findings revealed that blood
obtained from peripherally inserted IV catheters 22-guage and smaller significantly contributed
to hemolysis rates. The majority of these findings support eliminating blood collection through
22-gauge or smaller IV catheters as a means of decreasing rejection rates due to hemolysis.
15
The findings of these studies suggests that ED phlebotomists could experience lower
hemolysis rates by obtaining blood samples through 18- to 21-gauge needles and IV catheters.
Employing this evidence-based practice should lead to fewer specimen rejections.
Blood Collection Devices
Blood specimens are commonly collected from peripheral IV catheters using either a
vacuum collection system, the most common being the Vacutainer® product, or a syringe-
needless adapter or a syringe-needle collection system. Sharp and Mohammad (1998) estimated
the former system contains a preset pressure vacuum of about 70kPa that allows the blood to
flow directly into the blood collection tube. The latter system requires the phlebotomist to apply
negative pressure to the syringe plunger to first draw the blood into the syringe and then inject
the blood into the collection tube thus subjecting the blood to a second transfer.
Grant (2003) studied factors contributing to hemolysis in an academic medical center ED
with staff being asked to submit a completed questionnaire with each specimen identifying the
collection method and devices used to obtain the blood. This body of evidence is classified as a
level-6 due to its descriptive observational nature. A total of 454 competed questionnaires and
blood specimens were analyzed with samples obtained from an existing peripheral IV catheters
(77) or a central lines (5), or new sites (372) via a newly place peripheral IV catheter (255) or
direct venipuncture (117). Collection devices included peripheral IV catheter sizes of 14-gauge
to 20-gauge, 21-gauge and 23-gauge venipuncture needles, 5-ml, 10-ml and 20ml syringes, and a
Vacutainer® collection holder. The statistical analysis revealed a significantly higher hemolysis
rate in blood obtained via a Vacutainer® device than from a syringe in newly placed peripheral
IV catheters (p < .02). No analysis was done to determine if there was a relationship between
syringe size and hemolysis.

16
Ong et al. (2008) conducted a level-6 evidence-based observational study of ED staff
consultants, registrars, medical officers, nurses and medical/nursing students to determine factors
associated with hemolysis of collected laboratory blood urea and electrolyte blood specimens
obtained from ED patients. Staff were asked to complete questionnaires with each blood draw
that addressed seven blood sampling related factors (staff type, draw method, collection system
used, needle size, blood flow speed, difficulty of cannulation or venipuncture, and specimen
source). A syringe of unspecified size was the collection system of choice for 146 (64%) draws
with a Vacutainer® used for 81 (36%) draws. Of the 227 blood collections studied, staff
overwhelmingly chose the IV cannula method (74%) over the direct venipuncture method (26%)
to obtain blood specimens. The findings revealed a significant number of Vacutainer® draws
hemolyzed (35.8%) compared to 11% of the syringe draws as evidenced by an OR 4.5, CI (2.3,
9.0).
The statistical significance of these studies indicate that hemolysis, which has previously
been identified as a major cause of blood specimen rejection by the laboratory, was found to be
higher in samples obtained from a peripheral IV catheter with a vacuum collection device as
compared to a syringe-needle transfer system. Based on this, ED staff phlebotomists should use a
syringe-needle system over a vacuum collection system when obtaining blood from an IV
catheter.
Use of a Discard Volume
The practice of first collecting a discard volume of blood before obtaining specimens for
analysis is strongly recommended by Lippi, Salvagno, Montagnana, Franchini, and Guidi (2006)
as a method for improving laboratory test results. They contend that a discard volume, which is
17
an amount of blood evacuated from the catheter unit prior to sampling, decreases contamination
of blood specimens by venipuncture-induced tissue and intravascular elements.
Himberger and Himberger (2001) studied blood specimens obtained from adult ED
patients with peripheral intravenous lines as an alternate site to venipuncture that could produce
viable laboratory results. This study was a well-designed non-randomized controlled trial and
was consistent with a level-3 rating in the evidence hierarchy as defined by Melnyk and Fineout-
Overholt (2005). Following an infusion of 100-ml of intravenous fluid, the infusion was stopped
for 30-seconds, a tourniquet applied, and a 5-ml discard blood volume obtained. A 10-ml blood
specimen was then collected with an 18-gauge needle adapter and 10-ml syringe device from the
IV tubing port closest to the catheter hub. A second 10-ml sample was drawn with a 20-gauge
needle and 10-ml syringe device via direct venipuncture from the opposite arm. All blood was
transferred from the syringe to the collection tubes using an18-gauge needle. The findings
revealed no significant statistical differences between the paired peripheral intravenous line and
venipuncture blood specimen results.
Corbo, Fu, Silver, Atallah, and Bijur (2007) explored the use of a saline lock device as a
viable alternate source for laboratory blood samples as compared to specimens obtained via
venipuncture. Using each adult ED patient as their own control, a discard blood volume of 5-ml
was aspirated from an existing saline lock device followed by three vacuum tubes collected via
Vacutainer®. Three identical blood tubes were collected by venipuncture from the opposite arm
with a Vacutainer® device. The analysis revealed no significant statistical differences in lab
values collected from the saline lock as compared to the direct venipuncture method. This study
was a non-randomized control trial that produced a level-3 hierarchy of evidence.
18
These study findings demonstrate that accurate laboratory results can be obtained from
peripheral IV catheters by withdrawing discard blood prior to specimen collection for laboratory
analysis. Based on these findings, and considering the variety of peripheral IV catheters in use,
the design of saline locks, and IV tubing lengths that comprise the peripheral IV collection unit,
the a universal discard volume of one 4.7-ml red vacuum tube, or 5-ml syringe volume, was
selected as the standardized discard volume for the evidence-based p-VAD catheter blood
collection protocol developed for this study.
Blood Specimen Transport
Transport of ED specimens to the laboratory can be accomplished either by hand carrying
the samples or sending them by way of a pneumatic tube system. Fernandes, Worster, Eva, Hill,
and McCallum (2006) examined the effect of two delivery systems, human couriers and the
Translogic CTS-20 pneumatic tube system, on serum hemoglobin and potassium test result
turnaround times. The test was conducted over eight days in two emergency departments in
different locations within a multi-site tertiary care academic medical center. Using specimen
hemolysis as the transport method outcome measure, no significant difference was found in
hemolysis rates of specimens transported to the laboratory by human couriers as compared to
those sent by the pneumatic tube system. Additionally, the turn-around time for the pneumatic
tube system was found to be significantly less as compared to the human courier.
Wallin, Soderberg, Grankvist, Jonsson, and Hultdin (2008) studied the effect of a
pneumatic tube system on blood specimens collected for hematology and coagulation studies
from subjects who were given 75 mg of acetylsalicylic acid daily for 1 week. Comparing paired
samples collected prior to and after one week of treatment, they found the transport of blood
using a pneumatic tube system produced no analytical errors in 21 commonly ordered chemistry
19
and coagulation tests. Their analysis of global coagulation revealed a significant difference
between pneumatic tube system blood specimen transport and the non- pneumatic tube system
transported blood leading to the investigators recommending manual transport for blood
requiring thromboelastographic analysis to ensure valid laboratory results.
Both of these studies were consistent with a level-3 hierarchy of evidence as they were
well-designed non-randomized control trials. These studies suggest that pneumatic tube transport
of blood specimens to the laboratory has a negligible effect on commonly ordered chemistry and
coagulation test rejection rates.
Reliability of IV Catheters as a Source for Blood Specimens
Though the Clinical and Laboratory Standards Institute (2007) lists venipuncture as the
current standard for collecting blood specimens due to related low specimen rejection rates, the
studies presented above indicate that obtaining blood specimens from peripheral IV catheters can
produce viable laboratory specimens when the evidence-based practices presented are followed.
These include collecting or transferring blood through a needle or p-VAD catheter size of 18- to
21-gauge, using a syringe-needle rather than a vacuum collection system device, and obtaining a
5-ml discard volume prior to obtaining the blood sample. The transport of collected blood
specimens via a pneumatic tube system has a negligible effect on specimen rejection rates.
Training in Blood Specimen Collection
Burns and Yoshikawa (2002) conducted a retrospective study to identify hemolysis rates
in blood specimens obtained by ED staff as compared to laboratory phlebotomists. Their
findings revealed hemolysis rates were significantly higher at 12.4% for trained but uncertified
ED staff as compared to 1.6% for trained and certified laboratory phlebotomists who obtained
blood from inpatient medical unit patients. Unfortunately no operational definitions were
20
provided for phlebotomists who were trained and those who were certified. Dugan et al. (2005)
revealed that 36 months prior to their study, all ED staff had been trained in a revised blood
collection policy in an effort to decrease the 25.7% ED blood speciment rejection rate. This
training initiative led to the rate falling to 10.7%. However, over the course of 16 months it had
increased to 19.5%. The authors attributed this to staff turnover, the absence of an annual
training requirement, and no routine training of new staff. During the second phase of the study
all participating ED staff followed a strict blod collection protocol resulting in the post-study
rejection rate significanlty dropping to 12.4%. Based on this, the authors stressed that mandatory
staff annual retraining and quarterly new staff training in established blood collection techniques,
and consistent staff adherence to those protocols was key to achieving and maintaining low
specimen rejection rates.
The results of studies on the effect of blood collection techniques on ED laboratory test
hemolysis rates have led several authors to identify the use an evidence-based practice blood
collection protocol by trained staff and regular checks of this skill competency as ways to
decrease hemolysis and thus overall rejection rates (Dugan et al., 2005; Lowe et al., 2008).
Summary
The intent of the study is to examine the use of evidence-based blood collection practices.
Given that no formal ED policy or procedure exists for the collection of blood specimens,
consented ED staff will be trained to collect blood according to the hospital’s existing laboratory
department’s evidence-based practice venipuncture procedure, and a newly developed p-VAD
collection technique that is based on the evidence presented in this chapter (see Appendix B).
21
Chapter 3: Design and Methodology
This chapter provides a description of the design, setting and sample for the project. This
is followed by an overview of the current blood collection processes and a new evidence-based
p-VAD blood collection procedure and ends with a discussion of the methods and procedures for
the study.
Design
The study design is a single group pretest-posttest with the study group comprised of a
single group of consented ED nurses and EDT staff members. The intervention is the education
of all study group members in the hospital’s existing evidence-based venipuncture and a new p-
VAD evidence-based blood collection techniques, the latter that was developed by the principle
investigator specifically for this project. The design allows for the comparison of a 4-week pre-
intervention rejection rate to three consecutive 4-week post-intervention rejection rate intervals
and a total 1-12 week post-intervention rejection rate interval as noted in the following design
description:
NR O1 X O2 O3 O4 O5 Non-Random pretest intervention post-test
Setting and Sample
The setting for this project is a combined 69-bed adult ED comprised of a 22-bed critical
care area, and a 14-bed clinical decision unit (ECC), a 15-bed flex care unit area inclusive of 2
single isolation rooms (EFX), and a 16-bed adult admission holding area (EIA) located on the
ground floor of a 695-licensed bed urban academic medical center in the Southeastern United
22
States. Situated in the lower socioeconomic area of the city, the combined adult ED sees an
average of 63,000 patients annually and is staffed by 83 nurses and 46 EDTs.
The sample is comprised of blood specimens, excluding blood cultures, ordered by
emergency department providers as part of the patient’s normal course of treatment and reported
out by the main core laboratory information system. Blood obtained either by peripheral
venipuncture or from a p-VAD in adult patients over the age of 18 years served as the study
specimens. On average 13,688 blood specimens are collected monthly from adult ED patients,
with the vast majority obtained for hematology, coagulation, and chemistry testing.
Blood specimens collected from patients located in the Pediatric ED and the Trauma
Center are excluded from this study. This study did not target any specific patient population for
blood specimen collection.
Current Blood Collection Practices
Adult ED blood specimens are collected primarily by the EDT staff, with a lesser number
collected by nurses and even fewer by emergency medicine residents. Though there are no
written procedures or specified blood collection procedures that guide blood collection in the
ED, the nurses and EDTs undergo training as outlined in chapter one. Since the vast majority of
patients in the adult ED are ordered to have a p-VAD placed, common practice is to obtain
ordered blood specimens through newly placed p-VADs. The venipuncture collection technique
is used mainly for patients who are not ordered to have a p-VAD, when attempts at placement
and obtaining blood from an established one are unsuccessful, for specimen recollection due to
initial specimen rejection, or for blood culture studies.
The anatomical sites commonly used by staff to obtain blood from adult patients are the
back of the hands, the forearms, and the antecubital fossa. The venipuncture technique employs
23
the use of a 21-gauge winged butterfly needle with pre-attached 12-inch tubing connected either
to a Vacutainer® holder, into which blood collection tubes are placed, or to a 12-ml syringe that
requires the operator to manually withdraw the blood and then transfer it into the collection tubes
using a 20-gauge blunt transfer needle. The tubes are collected in an ED specified order-of-draw
which differs from the long established order of draw identified by the CLSI. Each collection
tube is removed once the internal vacuum has ceased drawing blood into it. Based on the ED
staff phlebotomist’s assessment of the patient’s vasculature, a 23- or 25-gauge butterfly needle
may be used to access smaller veins.
The p-VAD blood collection technique used begins with the placement of an 18-gauge
1.25-inch long, a 20-gauge 1-inch long, or 20-gauge 1.25-inch long polyurethane peripheral IV
catheter with staff encouraged to place an 18-gauge catheter whenever possible. Once the
catheter is positioned securely in the vein the majority of staff attach a 10- or 12-ml syringe
directly to the catheter to collect the blood samples. Some staff elect to first place a luer-lock port
on the end of the catheter and then aspirate the blood into a 10-or 12-ml syringe using a 17-gauge
plastic cannula needless adaptor and then transferring the blood into the collection tubes using a
20-gauge blunt transfer needle. Most staff prefer not to use a vacuum collection system citing
that the veins appear to collapse under the vacuum suction exerted by the collection tube making
it more difficult to obtain the blood sample. Once all specimens are obtained, a luer-lock port is
attached to those catheters without one, the port is flushed with 5-ml of sterile normal saline, and
the p-VAD is dressed. The draw volumes for the majority of the blood tubes used for non-
specialized blood study specimens range from 2.7 ml to 4.0 ml. The principal investigator was
informed by consented staff during the training sessions that it was common practice for staff to
collect a rainbow series of blood tubes from newly placed p-VADs prior to laboratory orders
24
being written. Staff then held the specimens until the orders were written, which averaged 60-90
minutes, before sending them to the laboratory for analysis.
In cases where blood is collected from an existing p-VAD, the device is first flushed with
5-ml of normal saline to check for patency and followed immediately by the withdrawal of 10-ml
of blood with the same syringe prior to blood sample collection for laboratory analysis. The
samples are then collected as mentioned above. All p-VADs are routinely flushed with 5-ml of
normal saline once every 12-hour shift, and whenever blood is obtained or medications are
administered through them.
Discussions with senior EDTs who either instruct new EDT staff in blood collection
techniques or have over 10 years blood collection experience, identified that current collection
techniques do not address the need to limit tourniquet time to less than one minute, to allow the
cleansed skin to dry prior to puncture, to limit the size of catheters and needles used to 18- to 21-
gauge, to limit the size of blood collection syringes to no larger than 10- to 12-ml, to rotate the
filled blood tubes 8-10 times to mix the blood and tube additives, and to follow the correct order-
of-draw specified by the Clinical and Laboratory Standards Institute (2007).
The commonalities among the venipuncture techniques currently taught to ED staff and
the hospital’s evidence-based venipuncture process include verification of the provider ordered
test(s), bedside patient identification using two patient identifiers, appropriate skin cleansing
with an antimicrobial agent, use of universal precautions and gloves, application of pressure to
and bandaging of the puncture site post venipuncture, proper bedside labeling of collected blood
tubes inclusive of the time and date drawn and the phlebotomist’s initials, placement of the
specimens in a biohazard bag, and the placement of the bag into a cushioned pneumatic system
transport tube.
25
Laboratory specimens are commonly transported to the laboratory accession area via the
TransLogic CTS pneumatic tube system with a small number being hand delivered by a staff
member. The ED staff report using rolled towels or other linen rather than the foam liners
available from the PTS vendor to cushion the specimens placed in the PTS tubes because the
foam liners are missing from the returned tubes within days of their being delivered to the ED.
All laboratory studies ordered on ED specimens are of a STAT priority requiring tests results to
be available within one-hour of the specimen being received in the laboratory. The laboratory
employs auto-verification for all of the test results studied for this project.
Though the residents receive no formal blood collection technique training, they do
receive training from the ED attending physicians or other residents at the bedside as they are
collecting the blood. The content of the training is unknown.
Evidence-based p-VAD Blood Collection Procedure
Currently no written policy exists for the ED, the laboratory, or the hospital to guide the
collection of blood from a p-VAD. The ED staff use p-VADs as the source of blood collection
regardless of the catheter size, do not routinely obtain a discard volume from p-VADs, aspirate
blood using either vacuum collection or syringe-needle transfer systems, commonly use 20-ml
syringes to withdraw laboratory blood specimens, do not follow the correct blood tube order-of-
draw as specified in the hospital venipuncture policy, and transport blood in un-cushioned tubes
when cushioning is not available. Over the time of this project, there was great emphasis by the
ED to correct their high blood culture contamination rates by following an existing laboratory
blood culture collection protocol. This initiative originated in the ED-Laboratory Nurse Council
and led to the addition of a discard volume and a shift to using syringe-needle collection devices
about six months prior to the start of this study. These changes may have contributed to the
26
decrease in the original 4% ED rejection rate mentioned in chapter one to the 3.19% rate
identified in this study’s pre-intervention period.
Based on the absence of a p-VAD blood collection policy for the ED and the evidence
presented in the previous chapter, the policy described in Appendix B was developed.
Emergency Department p-VAD blood specimens obtained following this policy are less likely to
be rejected if the phlebotomist collects the blood only from an 18-guage to 21-gauge size p-VAD
by withdrawing an initial 5-ml discard volume, then collecting the blood specimen using a 10- to
12-ml syringe, and transporting the specimen in a pneumatic tube with internal cushioning in a
timely manner.
Methods
Subject Recruitment
The principal investigator met with the ED nurse director and nurse managers to explain
the project, ED staff participation, and answer questions to ensure they have a clear
understanding of this study. Two weeks prior to the start of the training, flyers announcing the
study project and information sessions further explaining it, were posted throughout the staff
only ED areas. Staff were verbally informed by the nursing director, nurse manager or the shift
charge nurse of the study project during the daily day and night shift change-of-shift huddles.
The nurse manager or shift charge nurse assigned staff members to attend the information
sessions to ensure all nurses and EDTs had an opportunity to learn about the study. The
information sessions were scheduled for 5:30 a.m. and 8 a.m. with attendance contingent on
workload acuity. Once in the study information session, the principal investigator explained the
study specifics by reading from the informed oral consent form and answering questions.
27
Staff desiring to participate were consented, asked to anonymously complete the
Participant Demographic Questionnaire for the purpose of identifying the participant group’s
characteristics (see Appendix C), and personally placed their completed form in a sealable
collection device prior to the start of training. Participants who declined to complete the form
were asked to strike through the form and place it in the collection device. The participants then
underwent the training as outlined below with the collection device carried back to the office by
the PI for data entry and placement in locked cabinet. Staff members not consenting to
participate were excused and asked to leave all study related documents behind before they left
the room.
Intervention Plan
All training was provided by the principal investigator for the purpose of maintaining
consistency in the information presented. Training occurred in the ED conference room using
the same blood specimen collection and IV supplies available in the clinical setting. An ED
Competency Checklist was developed and listed key evidence-based venipuncture and p-VAD
blood collection practices that were central to the collection of healthy blood specimens (see
Appendix D). The principal investigator first reviewed it with each group of participants and
explained the rationale for each competency listed. This was followed with a review of a
training video made by the principal investigator and ended with the participants’ correctly
verbalizing the key evidence-based practice collection steps for each collection technique. Once
this step was finished and all participant questions were answered, the principal investigator
provided each participant with a full and downsized competency checklist to use as a reference.
New staff would also be offered the opportunity to participate in this study during their ED
orientation. Their recruitment and training mirrored that outlined above.
28
Laboratory Analysis
The ED blood specimen tubes arrived in the laboratory accession area primarily by
pneumatic tube transport with a small number being hand delivered. Upon arrival a laboratory
technician removed the specimens and related documents from the pneumatic tube, inspected
specimen container integrity, and verified the presence of a patient identification label. The
laboratory staff then validated the labeled specimens matched the test orders found in the
electronic medical record to ensure the specimen patient label matched the patient for whom the
test was ordered, the correct tubes were submitted, and that tubes arrived correctly packaged.
Specimen tubes not meeting accession requirements were removed from further analysis and
listed as rejected with the ED notified of the rejection and the need to recollect the specimen.
The remaining blood tubes were placed in an accession bin from which a laboratory technician
entered label information into the electronic laboratory information system database. All
specimens were placed in staging racks and delivered to their respective analysis stations.
Hematology specimens were analyzed on the Sysmex® HST Line with two XE-5000
analyzers obtained from Sysmex America, INC in Mundelein, IL. A laboratory technologist
loaded the specimens into sample racks and then into the analyzer. Equipment quality control
checks were conducted every eight hours. Specimens for coagulation testing were analyzed on
the STA Compact® Hemostasis and STA-R Evolution® Systems obtained from Diagnostica
Stago Inc. The laboratory technician visually inspected each tube for the correct blood volume
and rejected those that were under-filled. The technician then removed the tube stopper and
rimed the interior of each tube with two side-by-side thin wooden applicator sticks to visually
check for clots. Specimens that were positive for clots were rejected with all others recapped,
centrifuged, and then placed into the analyzer for testing.
29
Based on the chemistry test ordered, these specimens were placed into either the Roche
Modular Cobas® 6000 or Roche Modular Cobas® 8000 analyzer modular pre-analytic system
(MPA) rack obtained from the Roche Diagnostics Corporation of Indianapolis, Indiana. Once
filled each MPA rack was placed onto the MPA machine’s core transport conveyor belt where it
automatically and sequentially moved through a test selection sorter, an automatic centrifuge, a
de-stopper to remove the tube cap, an online aliquoter, an automatic labeler for secondary sample
tubes if ordered, and placed into sample sorting trays based on tests ordered prior to being sent
on for final test analysis. This process took anywhere from five to fifteen minutes depending on
the volume of chemistry specimens arriving for analysis. Test values within the normal pre-
established ranges were automatically sent from the analyzer to the laboratory information
technology interface system. Test results outside of the accepted range were automatically rerun
and auto-verified by the analyzer.
Quality control checks were performed as required on all laboratory analyzers with
results within acceptable ranges. All test results for this study were automatically uploaded by
respective analyzers into the laboratory interface system data base that pushed the data to a
laboratory-to-electronic medical record interface for viewing in the respective patient’s health
record by ED staff. Results analyzed as rejected or outside of the normal ranges were reported as
abnormal and immediately called to the ordering ED provider or nurse by a laboratory
technologist.
Data Collection
All study results data were manually extracted by the core laboratory manager and
provided to the principal investigator either semi-monthly or monthly based on the supervisor’s
workload requirements. The ED rejection reports were broken down by 24-hour period
30
extending from 00:01 a.m. to 24:00 p.m. and listed the area of the ED from which the specimen
was obtained, the laboratory specimen identification number, the test name, the rejection code
and reason, and the date and time the specimen was analyzed as rejected. These reports were sent
electronically to the principal investigator who moved them into a designated project file on the
hospital’s secure IRB research drive. The PI then quantified the data and entered it into a
separate spreadsheet for final data analysis.
Summary
The study flowed as planned over a 19-week period and was completed on time. The
support of the ED nurse managers and shift charge nurses in ensuring staff attended the study
information sessions was commendable and contributed to the number of staff who consented to
be study participants. The core laboratory manager and technical support staff team created and
delivered rejection rate reports within two weeks of the end of the previous month thus enabling
the principle investigator to maintain a steady flow of data input into the master data analysis
spreadsheet.
31
Chapter 4: Results
This chapter provides the findings of this study to determine if the use of an evidence-
based practice p-VAD blood collection process by staff would decrease ED blood specimen
rejection rates. A description of the participant demographics, the study intervention and data
analysis is followed by the study results.
Participant Demographics
A total of 83 nurses and 46 EDTs working in the adult ED care areas were eligible to
participate in this study. Forty-two nurses (50.60%) and 45 EDTs (97.83%) with a total of 87
(67.44%) eligible staff attending the study information sessions. The final participant group was
comprised of 28 nurses (41.79%), and 39 EDTs (58.21%) for a total eligible staff participation
rate of 51.94%. One reason for the lower numbers among the nurses may be attributed to a
frequently heard comment from nurses that EDTs collected their patients’ blood so they saw no
reason to participate. The EDT participants were very engaged during the training sessions and
voiced an eagerness to adopt practices that could decrease rejection rates. Collectively 34.33%
of the participants had been in their profession for less than 2 years with 41.79% employed in the
current ED for that same time period (see Table 4.1).
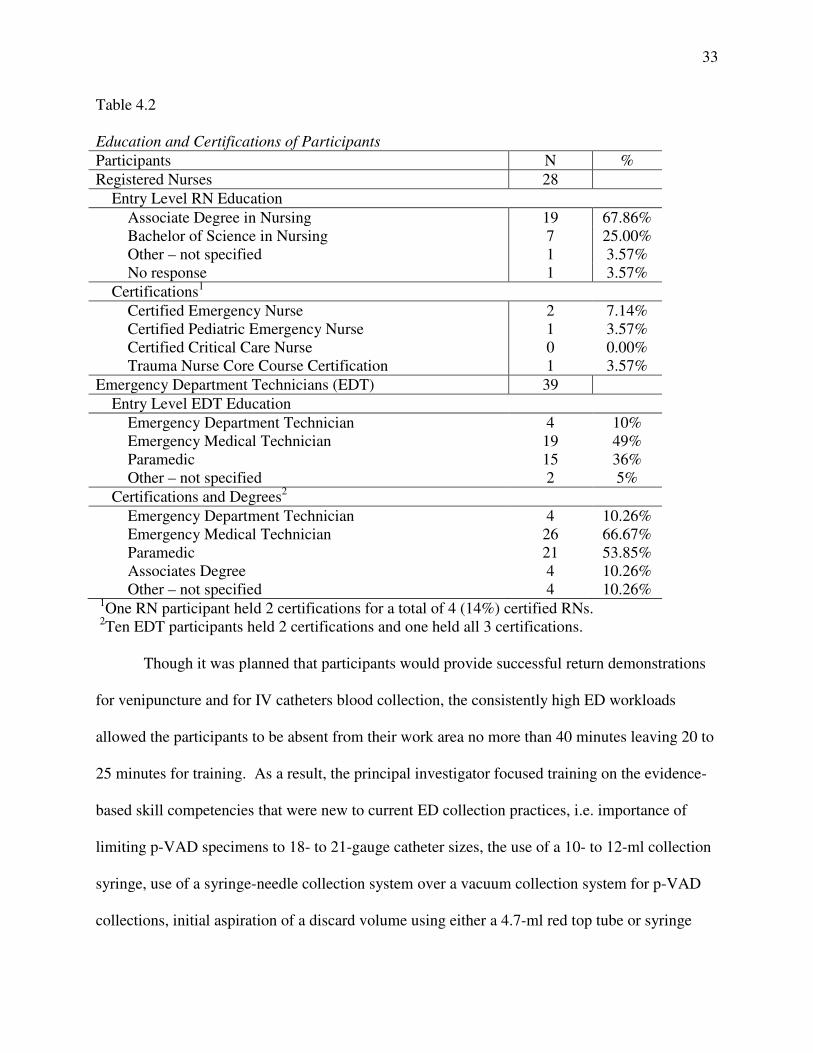
The majority (67.86%) of the nurses entered nursing with an associate degree in nursing
and four (14.29%) held nursing practice certifications relevant to emergency nursing. Thirty-four
(87.18%) EDTs were educated as either emergency medical technicians or paramedics. All
EDTs are required to hold certification as a pre-requisite to hire. Ten EDTs (25.64%) held dual
certifications while one held three (see Table 4.2).
Table 4.1

32
Work Experience of Participants
Category Total
Participants
# RN
(N = 28)
% RN
# EDT (N
= 39)
% EDT
Time in
Current
Profession
< 2 yrs 17 1 1.49% 16 23.88%
2-4 yrs 19 7 10.45% 12 17.91%
5-10 yrs 19 12 17.91% 7 10.45%
11-15 3 2 2.99% 1 1.49%
> 15 yrs 9 6 8.96% 3 4.48%
Time
worked in
EDs
< 2 yrs 23 7 10.45% 16 23.88%
2-4 yrs 20 7 10.45% 13 19.40%
5-10 yrs 16 8 11.94% 8 11.94%
11-15 6 5 7.46% 1 1.49%
> 15 yrs 2 1 1.49% 1 1.49%
Time
worked in
current ED
< 2 yrs 28 11 16.42% 17 25.37%
2-4 yrs 20 9 13.43% 11 16.42%
5-10 yrs 14 5 7.46% 9 13.43%
11-15 5 3 4.48% 2 2.99%
> 15 yrs 0 0 0.00% 0 0.00%
Note: RN = Registered Nurse; EDT = Emergency Department Technician
Study Intervention Completion
Based on the recommendations of the ED nurse director, a consecutive 18-day training
period was set aside during which a one-hour study introduction and training session was
scheduled twice daily at 5:45 a.m. and 8:00 a.m. These times were determined best for the staff
who worked 12-hour shifts that began at either at 6:45 a.m. or 6:45 p.m. The principal
investigator flexed start times by up to 60 minutes at the request of the shift charge nurses based
on patient care workload demands. Shift charge nurses requested 11 of the total 36 sessions be
cancelled due to high workloads that would not allow staff to attend. Though each shift patient
care assignment sheet identified staff to attend study sessions, no staff members reported to four
of the remaining 25 sessions resulting in a total of 21 staff sessions provided. Two additional
sessions were offered to four new staff members, one in week six and the other in week eight.
None of the new staff hires elected to participate.
33
Table 4.2
Education and Certifications of Participants
Participants N %
Registered Nurses 28
Entry Level RN Education
Associate Degree in Nursing 19 67.86%
Bachelor of Science in Nursing 7 25.00%
Other – not specified 1 3.57%
No response 1 3.57%
Certifications1
Certified Emergency Nurse 2 7.14%
Certified Pediatric Emergency Nurse 1 3.57%
Certified Critical Care Nurse 0 0.00%
Trauma Nurse Core Course Certification 1 3.57%
Emergency Department Technicians (EDT) 39
Entry Level EDT Education
Emergency Department Technician 4 10%
Emergency Medical Technician 19 49%
Paramedic 15 36%
Other – not specified 2 5%
Certifications and Degrees2
Emergency Department Technician 4 10.26%
Emergency Medical Technician 26 66.67%
Paramedic 21 53.85%
Associates Degree 4 10.26%
Other – not specified 4 10.26%
1One RN participant held 2 certifications for a total of 4 (14%) certified RNs.
2Ten EDT participants held 2 certifications and one held all 3 certifications.
Though it was planned that participants would provide successful return demonstrations
for venipuncture and for IV catheters blood collection, the consistently high ED workloads
allowed the participants to be absent from their work area no more than 40 minutes leaving 20 to
25 minutes for training. As a result, the principal investigator focused training on the evidence-
based skill competencies that were new to current ED collection practices, i.e. importance of
limiting p-VAD specimens to 18- to 21-gauge catheter sizes, the use of a 10- to 12-ml collection
syringe, use of a syringe-needle collection system over a vacuum collection system for p-VAD
collections, initial aspiration of a discard volume using either a 4.7-ml red top tube or syringe
34
withdrawal of 5-ml of blood, and the placement of interior pneumatic tube cushioning for the
blood tubes. Additional emphasis was placed on adhering to the correct order-of-draw as
specified in the hospital’s existing evidence-based practice venipuncture blood collection policy.
The ED Skill Competency Checklist form (see Appendix D) was used to ensure the participants
correctly verbalized the evidence-based collection processes with portions of the training video
shown to reinforce key evidence-based practice points. Upon completion of the training, each
participant was given a copy of the checklist as a reference and asked not to share it with non-
participants as a means of maintaining study integrity. All participants were directed to begin
using the evidence-based blood collection techniques immediately. Since no identifiable
participant data was collected for this study, it is unknown how many participants may have left
the ED during the study period.
Data Analysis
Pre-intervention and post-intervention data were compared using the chi-square method
and the Microsoft©
Excel 2008 program. To reach the goal of rejecting the null hypothesis with
a probability level of .95 and a p < .05, the chi-square was calculated at one degree of freedom
and had to be greater than 3.841 to reach significance.
The minmum sample size of analyzed tests needed to detect a significant change in the
rejection rate of ED blood tests and reach a power level of 95% for any of the three post-
intervenion periods as compared to the pre-intervention period, was determined to be 1,900
analyzed tests per 4-week period for a total of 7,600 tests. The final sample size of ED tests
analyzed ranged from 16,490 to 17,279 per 4-week period for a total of 67,691 ED tests. Of the
17,279 pre-intervention test ordered for 225 patients, 552 (3.19%) were rejected while 1199
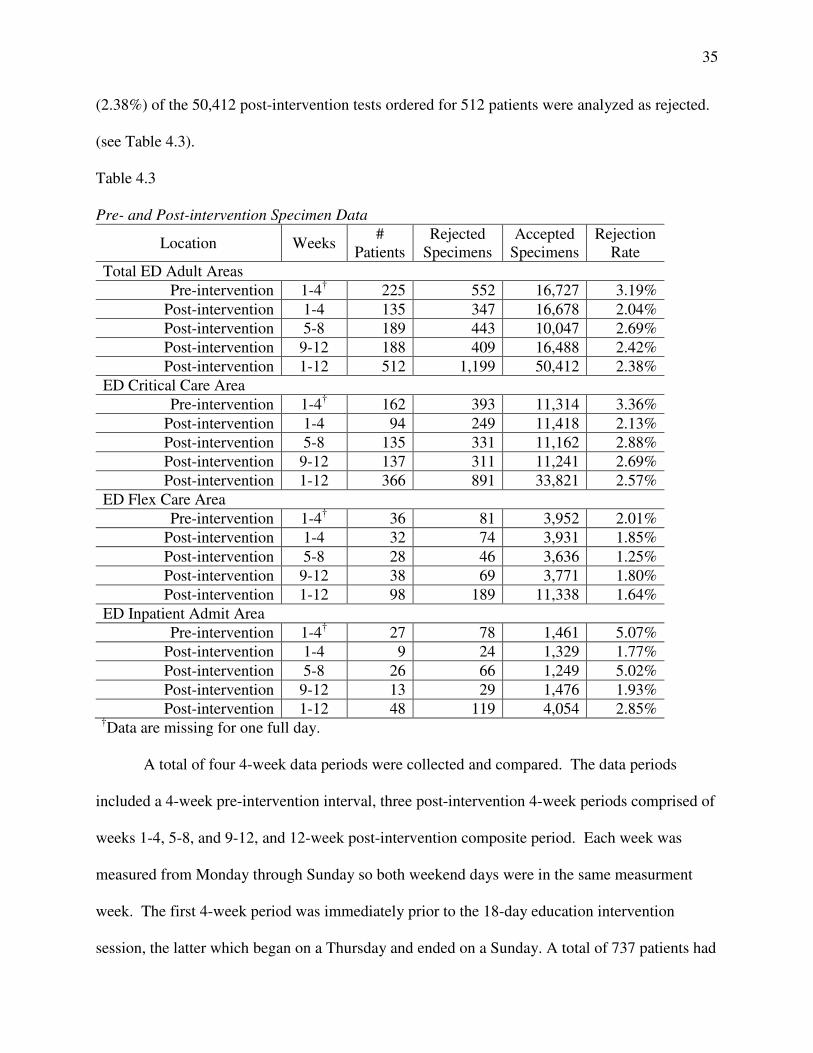
35
(2.38%) of the 50,412 post-intervention tests ordered for 512 patients were analyzed as rejected.
(see Table 4.3).
Table 4.3
Pre- and Post-intervention Specimen Data
Location Weeks #
Patients
Rejected
Specimens
Accepted
Specimens
Rejection
Rate
Total ED Adult Areas
Pre-intervention 1-4† 225 552 16,727 3.19%
Post-intervention 1-4 135 347 16,678 2.04%
Post-intervention 5-8 189 443 10,047 2.69%
Post-intervention 9-12 188 409 16,488 2.42%
Post-intervention 1-12 512 1,199 50,412 2.38%
ED Critical Care Area
Pre-intervention 1-4† 162 393 11,314 3.36%
Post-intervention 1-4 94 249 11,418 2.13%
Post-intervention 5-8 135 331 11,162 2.88%
Post-intervention 9-12 137 311 11,241 2.69%
Post-intervention 1-12 366 891 33,821 2.57%
ED Flex Care Area
Pre-intervention 1-4† 36 81 3,952 2.01%
Post-intervention 1-4 32 74 3,931 1.85%
Post-intervention 5-8 28 46 3,636 1.25%
Post-intervention 9-12 38 69 3,771 1.80%
Post-intervention 1-12 98 189 11,338 1.64%
ED Inpatient Admit Area
Pre-intervention 1-4† 27 78 1,461 5.07%
Post-intervention 1-4 9 24 1,329 1.77%
Post-intervention 5-8 26 66 1,249 5.02%
Post-intervention 9-12 13 29 1,476 1.93%
Post-intervention 1-12 48 119 4,054 2.85% †
Data are missing for one full day.
A total of four 4-week data periods were collected and compared. The data periods
included a 4-week pre-intervention interval, three post-intervention 4-week periods comprised of
weeks 1-4, 5-8, and 9-12, and 12-week post-intervention composite period. Each week was
measured from Monday through Sunday so both weekend days were in the same measurment
week. The first 4-week period was immediately prior to the 18-day education intervention
session, the latter which began on a Thursday and ended on a Sunday. A total of 737 patients had
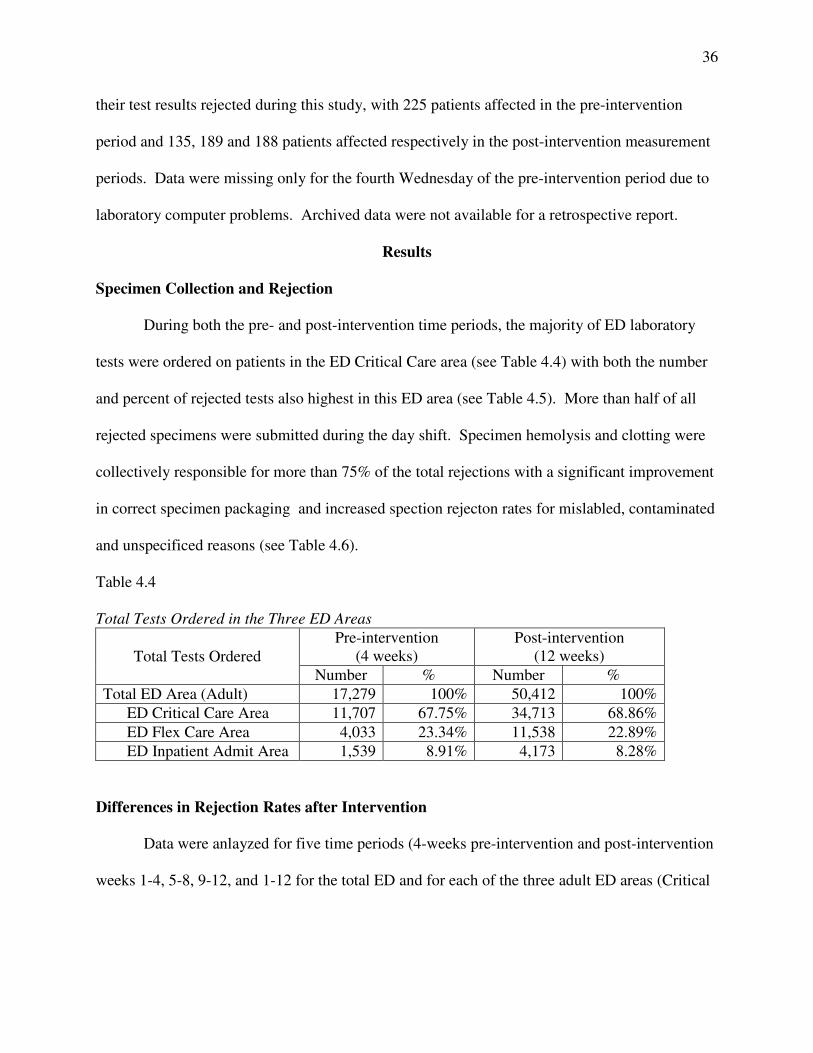
36
their test results rejected during this study, with 225 patients affected in the pre-intervention
period and 135, 189 and 188 patients affected respectively in the post-intervention measurement
periods. Data were missing only for the fourth Wednesday of the pre-intervention period due to
laboratory computer problems. Archived data were not available for a retrospective report.
Results
Specimen Collection and Rejection
During both the pre- and post-intervention time periods, the majority of ED laboratory
tests were ordered on patients in the ED Critical Care area (see Table 4.4) with both the number
and percent of rejected tests also highest in this ED area (see Table 4.5). More than half of all
rejected specimens were submitted during the day shift. Specimen hemolysis and clotting were
collectively responsible for more than 75% of the total rejections with a significant improvement
in correct specimen packaging and increased spection rejecton rates for mislabled, contaminated
and unspecificed reasons (see Table 4.6).
Table 4.4
Total Tests Ordered in the Three ED Areas
Total Tests Ordered
Pre-intervention
(4 weeks)
Post-intervention
(12 weeks)
Number % Number %
Total ED Area (Adult) 17,279 100% 50,412 100%
ED Critical Care Area 11,707 67.75% 34,713 68.86%
ED Flex Care Area 4,033 23.34% 11,538 22.89%
ED Inpatient Admit Area 1,539 8.91% 4,173 8.28%
Differences in Rejection Rates after Intervention
Data were anlayzed for five time periods (4-weeks pre-intervention and post-intervention
weeks 1-4, 5-8, 9-12, and 1-12 for the total ED and for each of the three adult ED areas (Critical
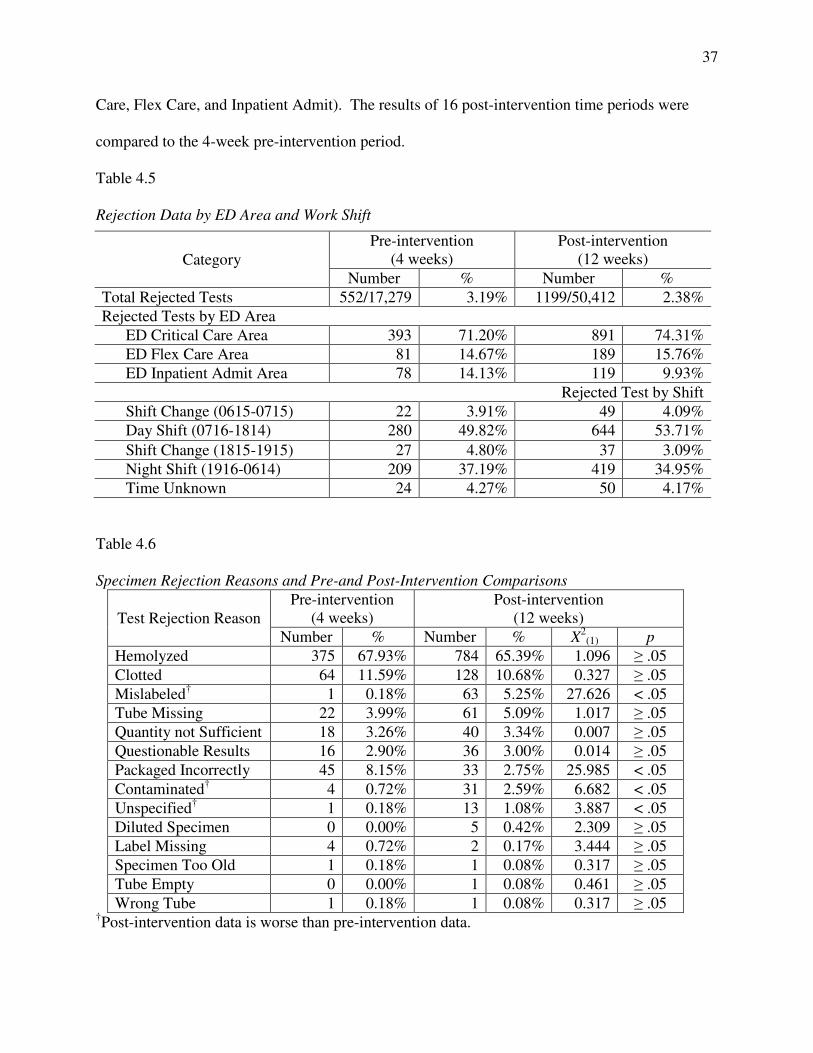
37
Care, Flex Care, and Inpatient Admit). The results of 16 post-intervention time periods were
compared to the 4-week pre-intervention period.
Table 4.5
Rejection Data by ED Area and Work Shift
Table 4.6
Specimen Rejection Reasons and Pre-and Post-Intervention Comparisons
Test Rejection Reason
Pre-intervention
(4 weeks)
Post-intervention
(12 weeks)
Number % Number % X2
(1) p
Hemolyzed 375 67.93% 784 65.39% 1.096 ≥ .05
Clotted 64 11.59% 128 10.68% 0.327 ≥ .05
Mislabeled† 1 0.18% 63 5.25% 27.626 < .05
Tube Missing 22 3.99% 61 5.09% 1.017 ≥ .05
Quantity not Sufficient 18 3.26% 40 3.34% 0.007 ≥ .05
Questionable Results 16 2.90% 36 3.00% 0.014 ≥ .05
Packaged Incorrectly 45 8.15% 33 2.75% 25.985 < .05
Contaminated† 4 0.72% 31 2.59% 6.682 < .05
Unspecified† 1 0.18% 13 1.08% 3.887 < .05
Diluted Specimen 0 0.00% 5 0.42% 2.309 ≥ .05
Label Missing 4 0.72% 2 0.17% 3.444 ≥ .05
Specimen Too Old 1 0.18% 1 0.08% 0.317 ≥ .05
Tube Empty 0 0.00% 1 0.08% 0.461 ≥ .05
Wrong Tube 1 0.18% 1 0.08% 0.317 ≥ .05 †Post-intervention data is worse than pre-intervention data.
Category
Pre-intervention
(4 weeks)
Post-intervention
(12 weeks)
Number % Number %
Total Rejected Tests 552/17,279 3.19% 1199/50,412 2.38%
Rejected Tests by ED Area
ED Critical Care Area 393 71.20% 891 74.31%
ED Flex Care Area 81 14.67% 189 15.76%
ED Inpatient Admit Area 78 14.13% 119 9.93%
Rejected Test by Shift
Shift Change (0615-0715) 22 3.91% 49 4.09%
Day Shift (0716-1814) 280 49.82% 644 53.71%
Shift Change (1815-1915) 27 4.80% 37 3.09%
Night Shift (1916-0614) 209 37.19% 419 34.95%
Time Unknown 24 4.27% 50 4.17%
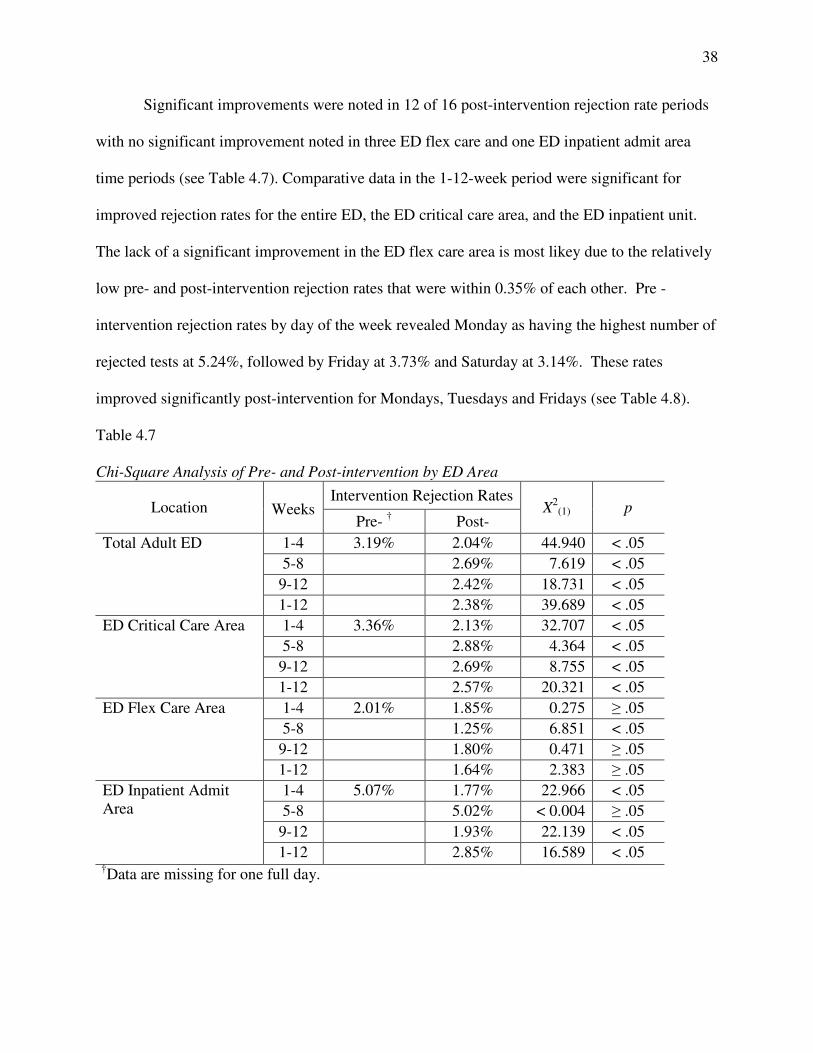
38
Significant improvements were noted in 12 of 16 post-intervention rejection rate periods
with no significant improvement noted in three ED flex care and one ED inpatient admit area
time periods (see Table 4.7). Comparative data in the 1-12-week period were significant for
improved rejection rates for the entire ED, the ED critical care area, and the ED inpatient unit.
The lack of a significant improvement in the ED flex care area is most likey due to the relatively
low pre- and post-intervention rejection rates that were within 0.35% of each other. Pre -
intervention rejection rates by day of the week revealed Monday as having the highest number of
rejected tests at 5.24%, followed by Friday at 3.73% and Saturday at 3.14%. These rates
improved significantly post-intervention for Mondays, Tuesdays and Fridays (see Table 4.8).
Table 4.7
Chi-Square Analysis of Pre- and Post-intervention by ED Area
Location
Weeks Intervention Rejection Rates
X2
(1) p Pre-
† Post-
Total Adult ED 1-4 3.19% 2.04% 44.940 < .05
5-8 2.69% 7.619 < .05
9-12 2.42% 18.731 < .05
1-12 2.38% 39.689 < .05
ED Critical Care Area 1-4 3.36% 2.13% 32.707 < .05
5-8 2.88% 4.364 < .05
9-12 2.69% 8.755 < .05
1-12 2.57% 20.321 < .05
ED Flex Care Area 1-4 2.01% 1.85% 0.275 ≥ .05
5-8 1.25% 6.851 < .05
9-12 1.80% 0.471 ≥ .05
1-12 1.64% 2.383 ≥ .05
ED Inpatient Admit
Area
1-4 5.07% 1.77% 22.966 < .05
5-8 5.02% < 0.004 ≥ .05
9-12 1.93% 22.139 < .05
1-12 2.85% 16.589 < .05 †
Data are missing for one full day.
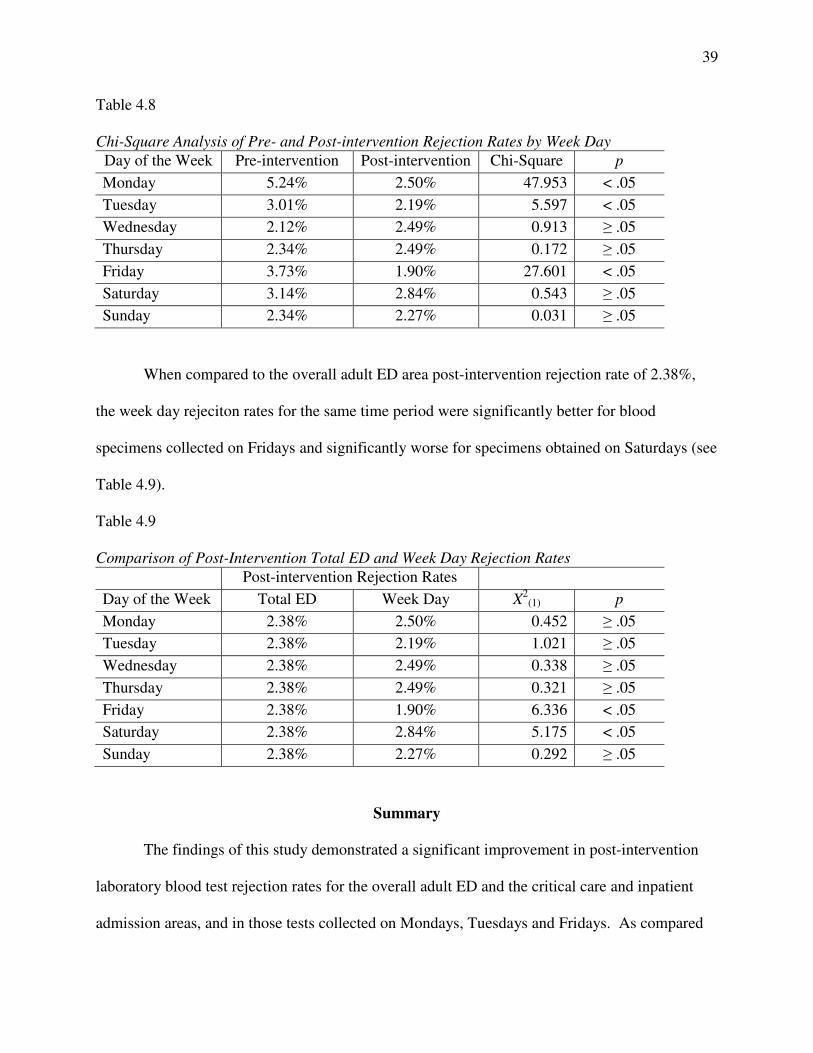
39
Table 4.8
Chi-Square Analysis of Pre- and Post-intervention Rejection Rates by Week Day
Day of the Week Pre-intervention Post-intervention Chi-Square p
Monday 5.24% 2.50% 47.953 < .05
Tuesday 3.01% 2.19% 5.597 < .05
Wednesday 2.12% 2.49% 0.913 ≥ .05
Thursday 2.34% 2.49% 0.172 ≥ .05
Friday 3.73% 1.90% 27.601 < .05
Saturday 3.14% 2.84% 0.543 ≥ .05
Sunday 2.34% 2.27% 0.031 ≥ .05
When compared to the overall adult ED area post-intervention rejection rate of 2.38%,
the week day rejeciton rates for the same time period were significantly better for blood
specimens collected on Fridays and significantly worse for specimens obtained on Saturdays (see
Table 4.9).
Table 4.9
Comparison of Post-Intervention Total ED and Week Day Rejection Rates
Post-intervention Rejection Rates
Day of the Week Total ED Week Day X2
(1) p
Monday 2.38% 2.50% 0.452 ≥ .05
Tuesday 2.38% 2.19% 1.021 ≥ .05
Wednesday 2.38% 2.49% 0.338 ≥ .05
Thursday 2.38% 2.49% 0.321 ≥ .05
Friday 2.38% 1.90% 6.336 < .05
Saturday 2.38% 2.84% 5.175 < .05
Sunday 2.38% 2.27% 0.292 ≥ .05
Summary
The findings of this study demonstrated a significant improvement in post-intervention
laboratory blood test rejection rates for the overall adult ED and the critical care and inpatient
admission areas, and in those tests collected on Mondays, Tuesdays and Fridays. As compared

40
to the total adult ED rejection rate, specimens collected on Friday were significantly better while
those collected on Saturday were significantly worse. The majority of tests ordered originated
from the ED critical care area, with the highest number of all tests collected on the day shift
followed by the night shift. Less than 10% of all tests were drawn at change of shift times.
Hemolysis (65.39%) and clotting (10.68%) were the primary reasons for 76.07% of all rejected
specimens.

41
Chapter 5: Conclusions
This chapter includes a discussion of the findings of an evidence-based practice change
on laboratory rejection rates in an emergency department. This is followed by a discussion of
limtations to the practice change implementation, implications for practice, implications for
future research, and a summary.
Post-Intervention Rejection Rates
The study results demonstrated a significant decrease in the overall adult ED laboratory
test rejection rate from 3.19% to 2.38% and represents a two-fold improvement of 25.61% made
by just over half of all eligible bedside staff trained in a standardized evidence-based protocols
for collecting blood via venipuncture and from a p-VAD. These findings are similar to those of
Burns and Yoshikawa (2002) who discovered a seven-fold decrease in rejected specimens
collected by phlebotomists formally trained and certified in blood collection techniques.
Himberger and Himberger (2001) suggested that the strict adherence to a standard p-VAD
protocol was central to obtaining healthy blood specimens through infusing intravenous lines
while the Quality Institute Conference of 2003 recommended the use of evidence-based best
practices as a means to improving patient safety (Boone, 2004).
Hemolysis was the primary cause of rejected specimens and found to be responsible for
65.39% (784) of all post-intervention rejected specimens in this study. This finding is consistent
with Lippi, Salvagno, Montagnana, Brocco, et al. (2006) who identified hemolysis as the cause
of 60% of all laboratory blood specimen rejections.
42
Limitations to the Practice Change Intervention
The ED medical leadership, though initially supportive of mandating the use of the
evidence-based p-VAD practice protocol, decided against adopting this new evidence-based p-
VAD protocol shortly before the study began for reasons unknown. As a result, participation in
this study was voluntary with 51.94% of the total staff consenting to participate. The voluntary
nature of the participation resulted in a lower participation rate of nurses, with many of them
declining to participate because the EDTs were the individuals who drew their patients’ blood for
laboratory testing.
Though the original plan was to include the ED residents in this study, because they may
collect blood from the patients in the resuscitation beds of the ED critical care area, their
academic and clinical schedules did not allow for this. As a result, not all staff members who
collected blood specimens from patients were provided the opportunity to participate in this
study. Of note is that none of the newly reporting nurse and EDT staff elected to participate
citing they were too busy with their ED orientation. Additionally, the confidential nature of the
participation made it impossible to monitor participants’ bedside use of the p-VAD and offer
real-time corrective retraining.
Since the outcome variable measured for this study was the laboratory blood test
rejection rate, data pertaining to the p-VAD catheter size, the collection device used, the amount
and collection of an initial discard volume, and the use of a cushioned pneumatic transport
system tube were not obtained and analyzed to determine their relationship to laboratory test
rejection rates. As a result it is unknown which parts of the protocol the participants adhered to
throughout the study, how each independent evidence-based practice affected the rejection rate,
and the collection technique used, i.e. venipuncture or p-VAD collection.
43
The number of staff who matured out of the study due to termination or reassignment,
who adopted the evidence-based blood collection practices though they were not study
participants, or who stopped following the study protocol prematurely is unknown. This study
was begun about six months after the ED started an initiative to decrease their blood culture
rejection rates and may have been a confounding variable that contributed to the low rejection
rates found during the pre-intervention period. The laboratory microbiology section reported the
7% blood culture contamination rate remained constant for the six months prior to and during
this study.
Implications for Practice
The significantly decreased rejection rates support the training all ED staff in the use of
evidence-based blood collection practices for their adult patients. To best hardwire these
practices, consideration should be given to requiring all staff to use these practices daily and
undergo some form of periodic refresher training. A comparison of rejection rates for the total
adult ED to the day of the week revealed a significantly higher rejection rate in blood specimens
collected on Saturdays. This finding suggests the weekend staff may need targeted retraining in
blood collection techniques. With no significant improvement in the post-intervention hemolysis
rate, the need for consistently following evidence-based practice blood collection protocols is
central to decreasing specimen rejection.
Based on the reasons listed for specimen rejection, staff members can personally reduce
their rejection rates by ensuring the samples are correctly labeled, are submitted using the correct
tube that is appropriately filled to the required volume level, avoid submitting empty tubes,
deliver tubes to the laboratory correctly packaged, and provide timely specimen delivery to the
laboratory.
44
Implications for Future Research
With the preference of this ED staff to obtain blood through existing or new p-VADs,
further study on the use evidence-based collection via p-VADs is needed. Consideration should
be given to using matched pairs comparing both the venipuncture and p-VAD evidence-based
collection processes so as to determine the blood collection practice with the lowest rejection
rates.
Other areas for future research include the effect of rejected ED specimens on the
equipment and reagent costs, on time lost and care delays, on the outcomes of treatment delays,
and on patient and laboratory test throughput. With the federal government enacting value based
purchasing as part of the Affordable Care Act of 2010, future research should also examine the
cost of rejected specimens as it relates to direct costs, increased patient disposition times, and its
effect on overall hospital patient throughput. These studies should be conducted within busy
emergency departments and include patient volumes to determine the effect of workload on
rejection rates.
Summary
Though evidence-based practice meta-analyses and systematic reviews by Halm and
Gleaves (2009) and Heyer et al. (2012) did not support the use of p-VADs for blood specimen
collection because the method was associated with hemolysis rates as high as 77%, this study
demonstrated a significant decrease in blood specimen rejection rates when over half of an ED
staff who routinely drew blood from a newly placed p-VAD were trained in evidence-based
venipuncture and p-VAD blood collection techniques. The high hemolysis rate of 65.39%
among rejected specimens in light of a low adult ED rejection rate of 2.38% invites further study
and consideration for mandating venipuncture as the primary blood collection technique.
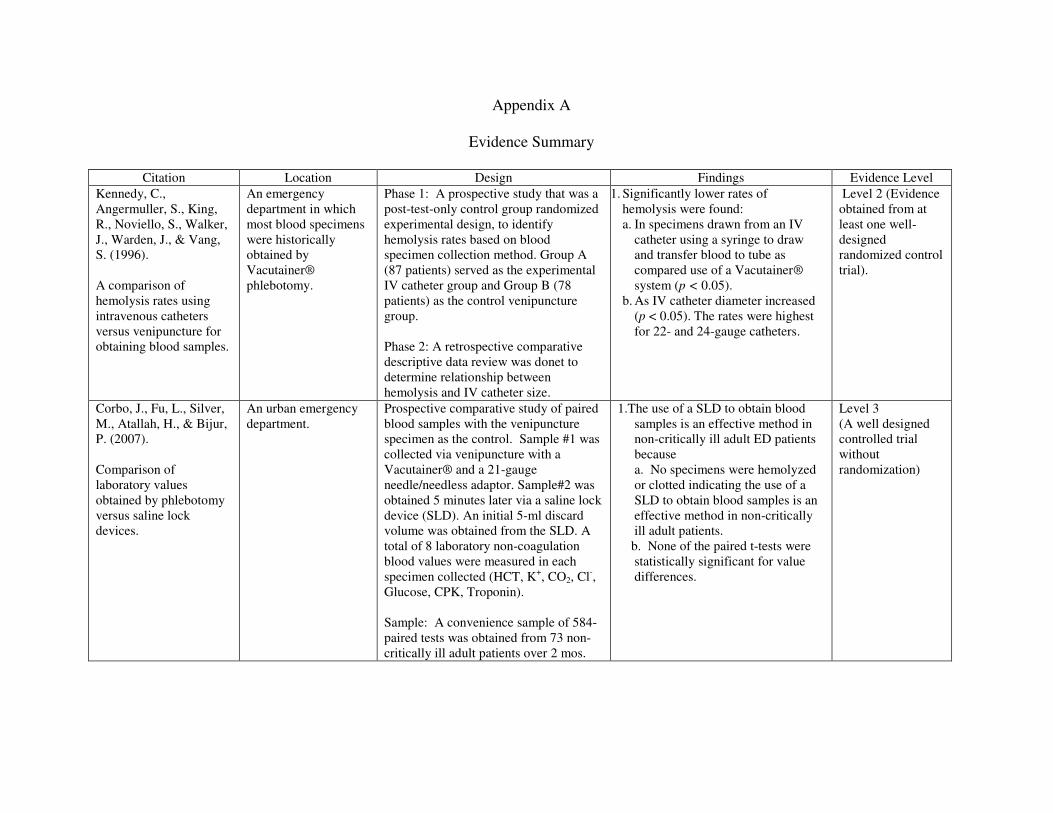
Appendix A
Evidence Summary
Citation Location Design Findings Evidence Level
Kennedy, C.,
Angermuller, S., King,
R., Noviello, S., Walker,
J., Warden, J., & Vang,
S. (1996).
A comparison of
hemolysis rates using
intravenous catheters
versus venipuncture for
obtaining blood samples.
An emergency
department in which
most blood specimens
were historically
obtained by
Vacutainer®
phlebotomy.
Phase 1: A prospective study that was a
post-test-only control group randomized
experimental design, to identify
hemolysis rates based on blood
specimen collection method. Group A
(87 patients) served as the experimental
IV catheter group and Group B (78
patients) as the control venipuncture
group.
Phase 2: A retrospective comparative
descriptive data review was donet to
determine relationship between
hemolysis and IV catheter size.
1. Significantly lower rates of
hemolysis were found:
a. In specimens drawn from an IV
catheter using a syringe to draw
and transfer blood to tube as
compared use of a Vacutainer®
system (p < 0.05).
b. As IV catheter diameter increased
(p < 0.05). The rates were highest
for 22- and 24-gauge catheters.
Level 2 (Evidence
obtained from at
least one well-
designed
randomized control
trial).
Corbo, J., Fu, L., Silver,
M., Atallah, H., & Bijur,
P. (2007).
Comparison of
laboratory values
obtained by phlebotomy
versus saline lock
devices.
An urban emergency
department.
Prospective comparative study of paired
blood samples with the venipuncture
specimen as the control. Sample #1 was
collected via venipuncture with a
Vacutainer® and a 21-gauge
needle/needless adaptor. Sample#2 was
obtained 5 minutes later via a saline lock
device (SLD). An initial 5-ml discard
volume was obtained from the SLD. A
total of 8 laboratory non-coagulation
blood values were measured in each
specimen collected (HCT, K+, CO2, Cl
-,
Glucose, CPK, Troponin).
Sample: A convenience sample of 584-
paired tests was obtained from 73 non-
critically ill adult patients over 2 mos.
1.The use of a SLD to obtain blood
samples is an effective method in
non-critically ill adult ED patients
because
a. No specimens were hemolyzed
or clotted indicating the use of a
SLD to obtain blood samples is an
effective method in non-critically
ill adult patients.
b. None of the paired t-tests were
statistically significant for value
differences.
Level 3
(A well designed
controlled trial
without
randomization)
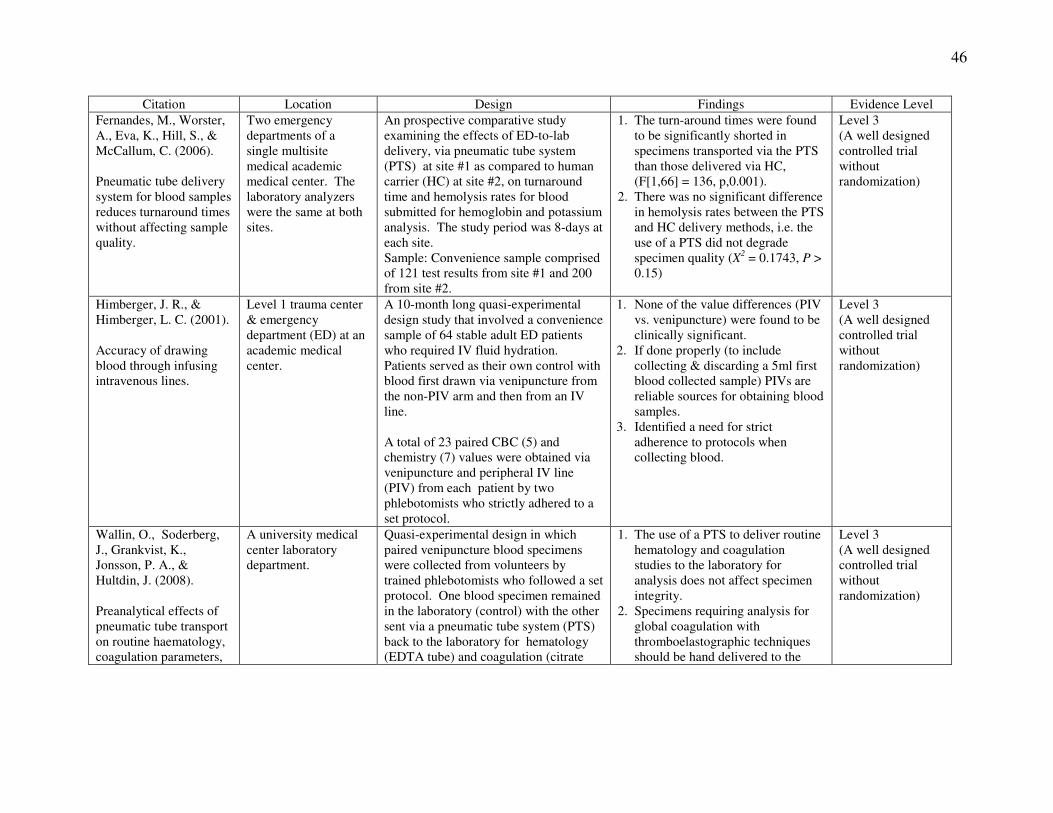
46
Citation Location Design Findings Evidence Level
Fernandes, M., Worster,
A., Eva, K., Hill, S., &
McCallum, C. (2006).
Pneumatic tube delivery
system for blood samples
reduces turnaround times
without affecting sample
quality.
Two emergency
departments of a
single multisite
medical academic
medical center. The
laboratory analyzers
were the same at both
sites.
An prospective comparative study
examining the effects of ED-to-lab
delivery, via pneumatic tube system
(PTS) at site #1 as compared to human
carrier (HC) at site #2, on turnaround
time and hemolysis rates for blood
submitted for hemoglobin and potassium
analysis. The study period was 8-days at
each site.
Sample: Convenience sample comprised
of 121 test results from site #1 and 200
from site #2.
1. The turn-around times were found
to be significantly shorted in
specimens transported via the PTS
than those delivered via HC,
(F[1,66] = 136, p,0.001).
2. There was no significant difference
in hemolysis rates between the PTS
and HC delivery methods, i.e. the
use of a PTS did not degrade
specimen quality (X2 = 0.1743, P >
0.15)
Level 3
(A well designed
controlled trial
without
randomization)
Himberger, J. R., &
Himberger, L. C. (2001).
Accuracy of drawing
blood through infusing
intravenous lines.
Level 1 trauma center
& emergency
department (ED) at an
academic medical
center.
A 10-month long quasi-experimental
design study that involved a convenience
sample of 64 stable adult ED patients
who required IV fluid hydration.
Patients served as their own control with
blood first drawn via venipuncture from
the non-PIV arm and then from an IV
line.
A total of 23 paired CBC (5) and
chemistry (7) values were obtained via
venipuncture and peripheral IV line
(PIV) from each patient by two
phlebotomists who strictly adhered to a
set protocol.
1. None of the value differences (PIV
vs. venipuncture) were found to be
clinically significant.
2. If done properly (to include
collecting & discarding a 5ml first
blood collected sample) PIVs are
reliable sources for obtaining blood
samples.
3. Identified a need for strict
adherence to protocols when
collecting blood.
Level 3
(A well designed
controlled trial
without
randomization)
Wallin, O., Soderberg,
J., Grankvist, K.,
Jonsson, P. A., &
Hultdin, J. (2008).
Preanalytical effects of
pneumatic tube transport
on routine haematology,
coagulation parameters,
A university medical
center laboratory
department.
Quasi-experimental design in which
paired venipuncture blood specimens
were collected from volunteers by
trained phlebotomists who followed a set
protocol. One blood specimen remained
in the laboratory (control) with the other
sent via a pneumatic tube system (PTS)
back to the laboratory for hematology
(EDTA tube) and coagulation (citrate
1. The use of a PTS to deliver routine
hematology and coagulation
studies to the laboratory for
analysis does not affect specimen
integrity.
2. Specimens requiring analysis for
global coagulation with
thromboelastographic techniques
should be hand delivered to the
Level 3
(A well designed
controlled trial
without
randomization)
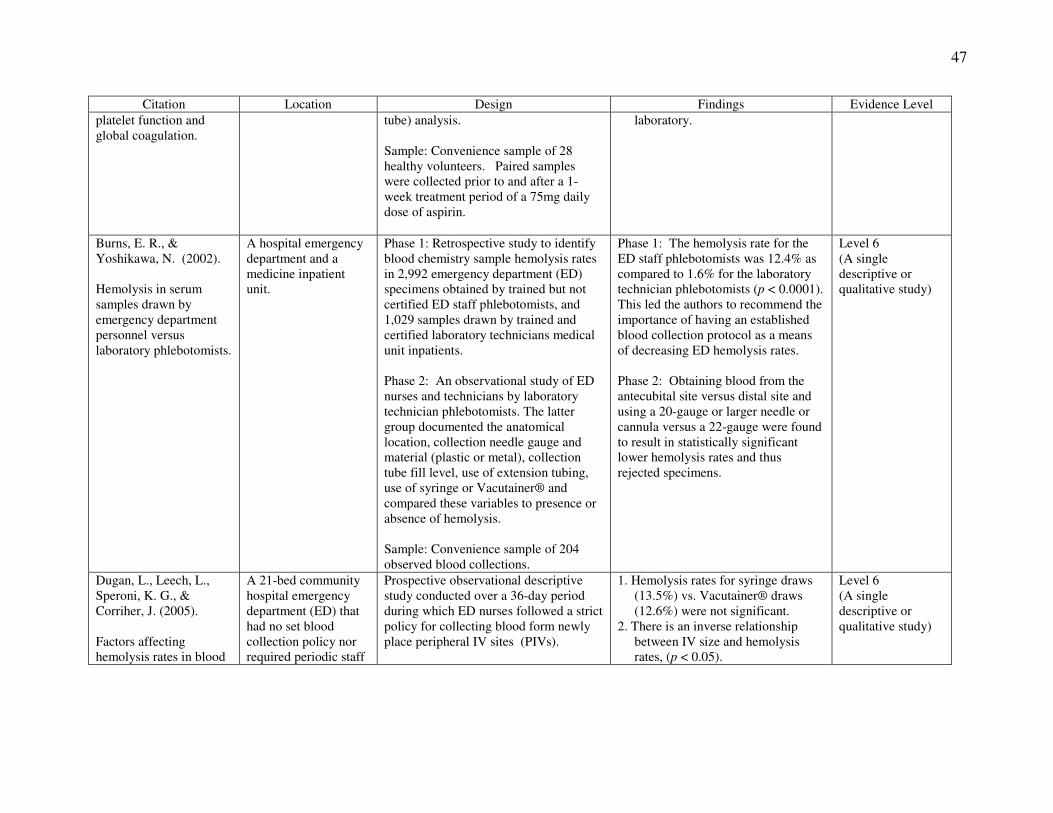
47
Citation Location Design Findings Evidence Level
platelet function and
global coagulation.
tube) analysis.
Sample: Convenience sample of 28
healthy volunteers. Paired samples
were collected prior to and after a 1-
week treatment period of a 75mg daily
dose of aspirin.
laboratory.
Burns, E. R., &
Yoshikawa, N. (2002).
Hemolysis in serum
samples drawn by
emergency department
personnel versus
laboratory phlebotomists.
A hospital emergency
department and a
medicine inpatient
unit.
Phase 1: Retrospective study to identify
blood chemistry sample hemolysis rates
in 2,992 emergency department (ED)
specimens obtained by trained but not
certified ED staff phlebotomists, and
1,029 samples drawn by trained and
certified laboratory technicians medical
unit inpatients.
Phase 2: An observational study of ED
nurses and technicians by laboratory
technician phlebotomists. The latter
group documented the anatomical
location, collection needle gauge and
material (plastic or metal), collection
tube fill level, use of extension tubing,
use of syringe or Vacutainer® and
compared these variables to presence or
absence of hemolysis.
Sample: Convenience sample of 204
observed blood collections.
Phase 1: The hemolysis rate for the
ED staff phlebotomists was 12.4% as
compared to 1.6% for the laboratory
technician phlebotomists (p < 0.0001).
This led the authors to recommend the
importance of having an established
blood collection protocol as a means
of decreasing ED hemolysis rates.
Phase 2: Obtaining blood from the
antecubital site versus distal site and
using a 20-gauge or larger needle or
cannula versus a 22-gauge were found
to result in statistically significant
lower hemolysis rates and thus
rejected specimens.
Level 6
(A single
descriptive or
qualitative study)
Dugan, L., Leech, L.,
Speroni, K. G., &
Corriher, J. (2005).
Factors affecting
hemolysis rates in blood
A 21-bed community
hospital emergency
department (ED) that
had no set blood
collection policy nor
required periodic staff
Prospective observational descriptive
study conducted over a 36-day period
during which ED nurses followed a strict
policy for collecting blood form newly
place peripheral IV sites (PIVs).
1. Hemolysis rates for syringe draws
(13.5%) vs. Vacutainer® draws
(12.6%) were not significant.
2. There is an inverse relationship
between IV size and hemolysis
rates, (p < 0.05).
Level 6
(A single
descriptive or
qualitative study)
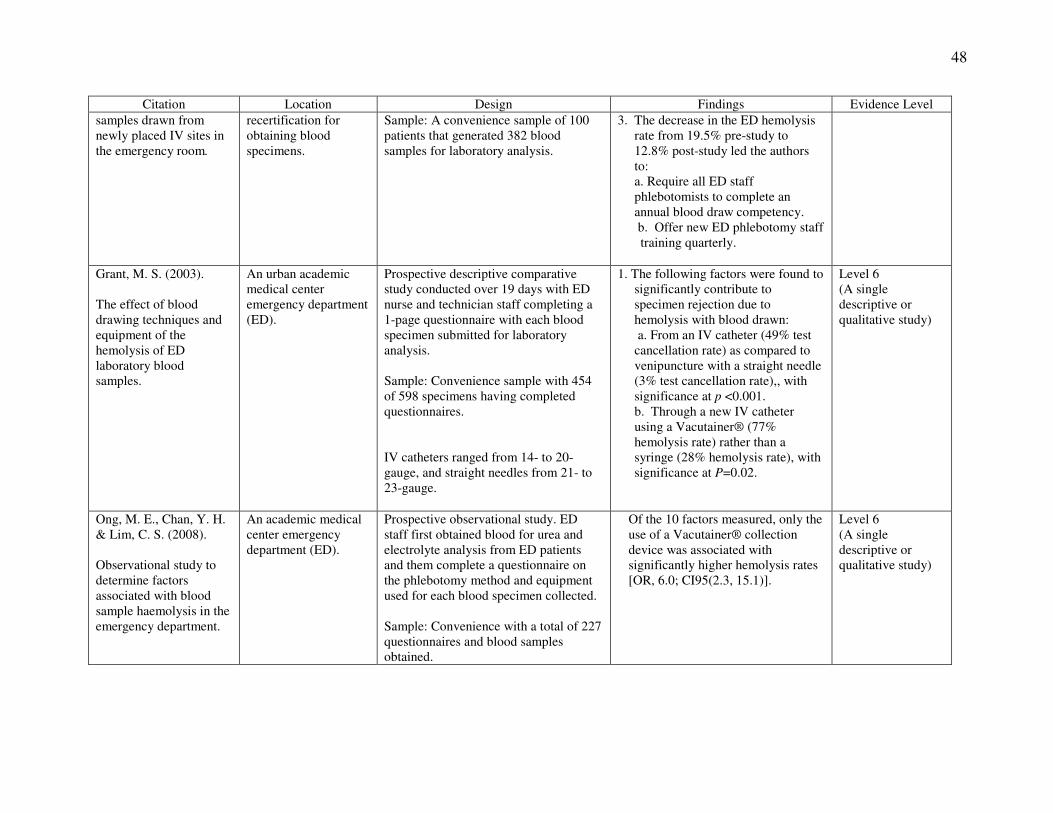
48
Citation Location Design Findings Evidence Level
samples drawn from
newly placed IV sites in
the emergency room.
recertification for
obtaining blood
specimens.
Sample: A convenience sample of 100
patients that generated 382 blood
samples for laboratory analysis.
3. The decrease in the ED hemolysis
rate from 19.5% pre-study to
12.8% post-study led the authors
to:
a. Require all ED staff
phlebotomists to complete an
annual blood draw competency.
b. Offer new ED phlebotomy staff
training quarterly.
Grant, M. S. (2003).
The effect of blood
drawing techniques and
equipment of the
hemolysis of ED
laboratory blood
samples.
An urban academic
medical center
emergency department
(ED).
Prospective descriptive comparative
study conducted over 19 days with ED
nurse and technician staff completing a
1-page questionnaire with each blood
specimen submitted for laboratory
analysis.
Sample: Convenience sample with 454
of 598 specimens having completed
questionnaires.
IV catheters ranged from 14- to 20-
gauge, and straight needles from 21- to
23-gauge.
1. The following factors were found to
significantly contribute to
specimen rejection due to
hemolysis with blood drawn:
a. From an IV catheter (49% test
cancellation rate) as compared to
venipuncture with a straight needle
(3% test cancellation rate),, with
significance at p <0.001.
b. Through a new IV catheter
using a Vacutainer® (77%
hemolysis rate) rather than a
syringe (28% hemolysis rate), with
significance at P=0.02.
Level 6
(A single
descriptive or
qualitative study)
Ong, M. E., Chan, Y. H.
& Lim, C. S. (2008).
Observational study to
determine factors
associated with blood
sample haemolysis in the
emergency department.
An academic medical
center emergency
department (ED).
Prospective observational study. ED
staff first obtained blood for urea and
electrolyte analysis from ED patients
and them complete a questionnaire on
the phlebotomy method and equipment
used for each blood specimen collected.
Sample: Convenience with a total of 227
questionnaires and blood samples
obtained.
Of the 10 factors measured, only the
use of a Vacutainer® collection
device was associated with
significantly higher hemolysis rates
[OR, 6.0; CI95(2.3, 15.1)].
Level 6
(A single
descriptive or
qualitative study)
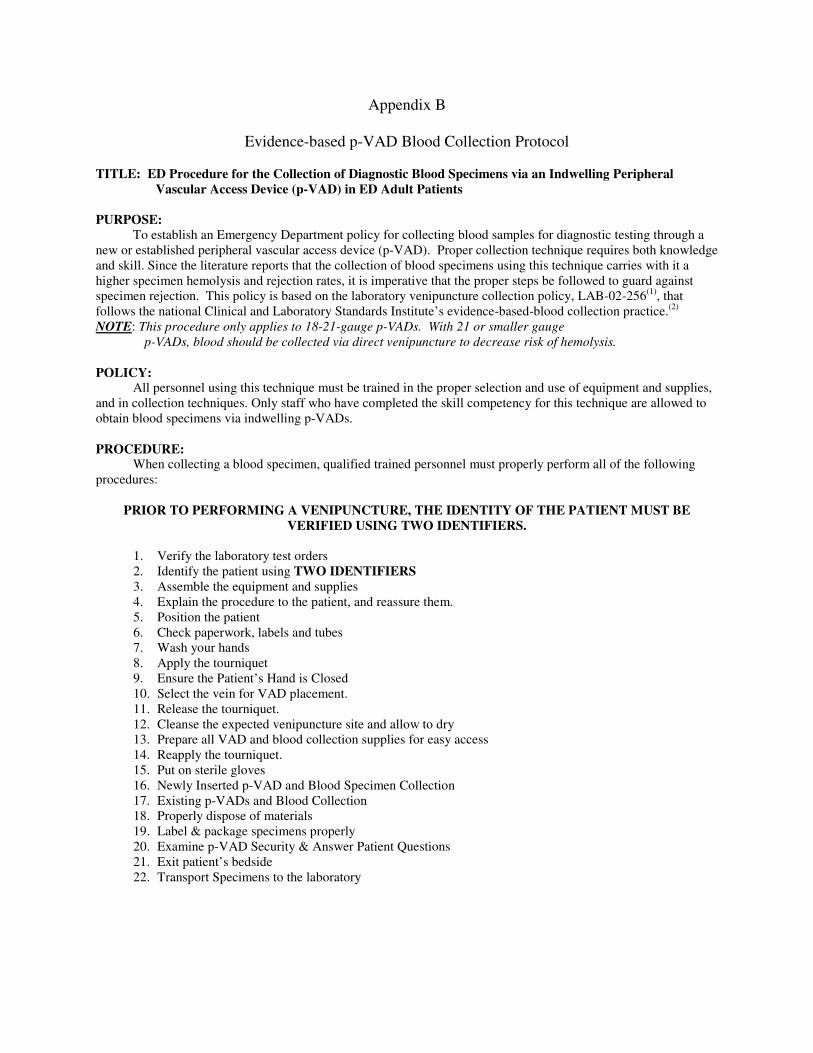
Appendix B
Evidence-based p-VAD Blood Collection Protocol TITLE: ED Procedure for the Collection of Diagnostic Blood Specimens via an Indwelling Peripheral
Vascular Access Device (p-VAD) in ED Adult Patients
PURPOSE:
To establish an Emergency Department policy for collecting blood samples for diagnostic testing through a
new or established peripheral vascular access device (p-VAD). Proper collection technique requires both knowledge
and skill. Since the literature reports that the collection of blood specimens using this technique carries with it a
higher specimen hemolysis and rejection rates, it is imperative that the proper steps be followed to guard against
specimen rejection. This policy is based on the laboratory venipuncture collection policy, LAB-02-256(1)
, that
follows the national Clinical and Laboratory Standards Institute’s evidence-based-blood collection practice.(2)
NOTE: This procedure only applies to 18-21-gauge p-VADs. With 21 or smaller gauge
p-VADs, blood should be collected via direct venipuncture to decrease risk of hemolysis.
POLICY: All personnel using this technique must be trained in the proper selection and use of equipment and supplies,
and in collection techniques. Only staff who have completed the skill competency for this technique are allowed to
obtain blood specimens via indwelling p-VADs.
PROCEDURE: When collecting a blood specimen, qualified trained personnel must properly perform all of the following
procedures:
PRIOR TO PERFORMING A VENIPUNCTURE, THE IDENTITY OF THE PATIENT MUST BE
VERIFIED USING TWO IDENTIFIERS.
1. Verify the laboratory test orders
2. Identify the patient using TWO IDENTIFIERS
3. Assemble the equipment and supplies
4. Explain the procedure to the patient, and reassure them.
5. Position the patient
6. Check paperwork, labels and tubes
7. Wash your hands
8. Apply the tourniquet
9. Ensure the Patient’s Hand is Closed
10. Select the vein for VAD placement.
11. Release the tourniquet.
12. Cleanse the expected venipuncture site and allow to dry
13. Prepare all VAD and blood collection supplies for easy access
14. Reapply the tourniquet.
15. Put on sterile gloves
16. Newly Inserted p-VAD and Blood Specimen Collection
17. Existing p-VADs and Blood Collection
18. Properly dispose of materials
19. Label & package specimens properly
20. Examine p-VAD Security & Answer Patient Questions
21. Exit patient’s bedside
22. Transport Specimens to the laboratory
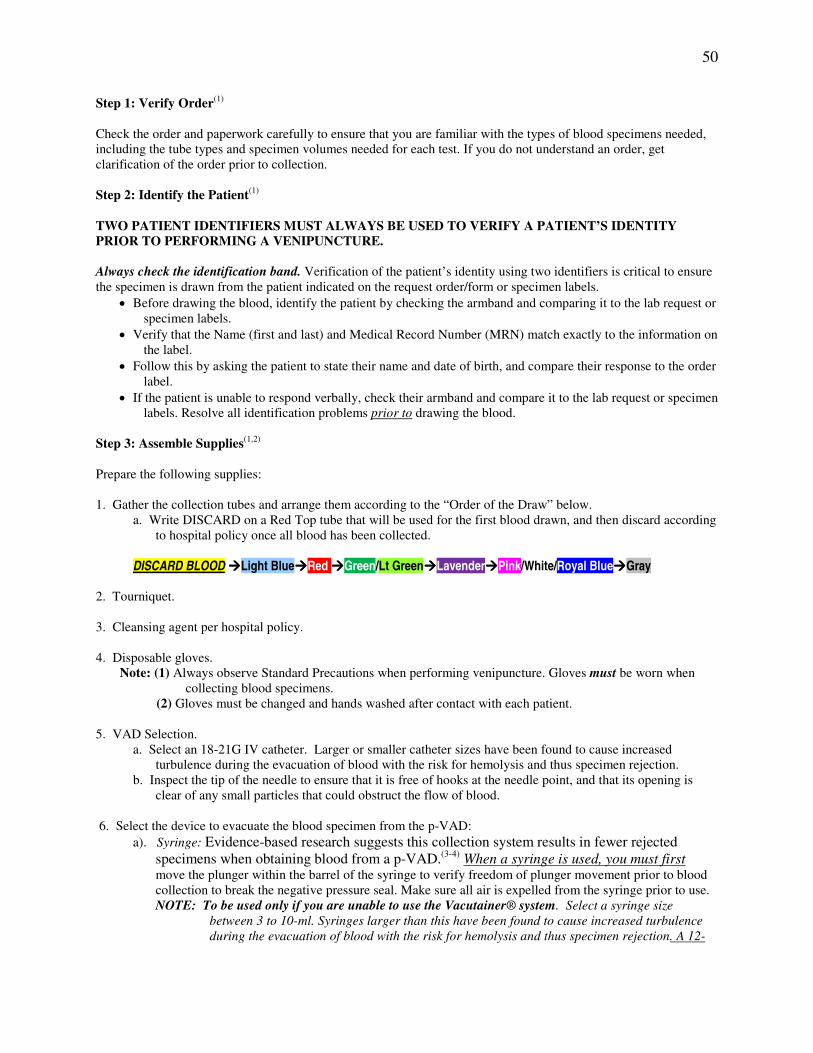
50
Step 1: Verify Order(1)
Check the order and paperwork carefully to ensure that you are familiar with the types of blood specimens needed,
including the tube types and specimen volumes needed for each test. If you do not understand an order, get
clarification of the order prior to collection.
Step 2: Identify the Patient(1)
TWO PATIENT IDENTIFIERS MUST ALWAYS BE USED TO VERIFY A PATIENT’S IDENTITY
PRIOR TO PERFORMING A VENIPUNCTURE.
Always check the identification band. Verification of the patient’s identity using two identifiers is critical to ensure
the specimen is drawn from the patient indicated on the request order/form or specimen labels.
• Before drawing the blood, identify the patient by checking the armband and comparing it to the lab request or
specimen labels.
• Verify that the Name (first and last) and Medical Record Number (MRN) match exactly to the information on
the label.
• Follow this by asking the patient to state their name and date of birth, and compare their response to the order
label.
• If the patient is unable to respond verbally, check their armband and compare it to the lab request or specimen
labels. Resolve all identification problems prior to drawing the blood.
Step 3: Assemble Supplies(1,2)
Prepare the following supplies:
1. Gather the collection tubes and arrange them according to the “Order of the Draw” below.
a. Write DISCARD on a Red Top tube that will be used for the first blood drawn, and then discard according
to hospital policy once all blood has been collected.
DISCARD BLOOD ����Light Blue����Red ����Green/Lt Green����Lavender����Pink/White/Royal Blue����Gray
2. Tourniquet.
3. Cleansing agent per hospital policy.
4. Disposable gloves.
Note: (1) Always observe Standard Precautions when performing venipuncture. Gloves must be worn when
collecting blood specimens.
(2) Gloves must be changed and hands washed after contact with each patient.
5. VAD Selection.
a. Select an 18-21G IV catheter. Larger or smaller catheter sizes have been found to cause increased
turbulence during the evacuation of blood with the risk for hemolysis and thus specimen rejection.
b. Inspect the tip of the needle to ensure that it is free of hooks at the needle point, and that its opening is
clear of any small particles that could obstruct the flow of blood.
6. Select the device to evacuate the blood specimen from the p-VAD:
a). Syringe: Evidence-based research suggests this collection system results in fewer rejected
specimens when obtaining blood from a p-VAD.(3-4)
When a syringe is used, you must first move the plunger within the barrel of the syringe to verify freedom of plunger movement prior to blood
collection to break the negative pressure seal. Make sure all air is expelled from the syringe prior to use.
NOTE: To be used only if you are unable to use the Vacutainer® system. Select a syringe size
between 3 to 10-ml. Syringes larger than this have been found to cause increased turbulence
during the evacuation of blood with the risk for hemolysis and thus specimen rejection. A 12-
51
ml syringe may be used if the dept does not stock a 10ml syringe.(5)
b). Evacuated system: This device is preferable to needle and syringe because it is a low-pressure system and
allows blood transfer directly from the vein into the evacuated tube. The evacuated system is composed
of a sterile blood collection needle, a holder to secure the needle, and the evacuated (Vacutainer®)
tube(s) with some containing a pre-measured additive.(6)
Step 4: Explain the Procedure and Reassure the Patient(1)
Introduce yourself to the patient and explain the venipuncture procedure. Assure the patient that although the p-
VAD placement will be slightly painful, it will be of short duration. Remember to warn the patient before the needle
pierces the skin so the patient is not surprised.
Step 5: Position the Patient(1,2)
Position the patient so the vein is readily accessible and you are able to work in a comfortable position. Ordinarily,
the patient will either be sitting or lying down.
NOTE: Ensure that the patient is not eating, chewing gum, or using an oral thermometer during the
procedure to prevent their chance of choking.
Step 6: Check the Paperwork, Labels and Collection Tubes(1)
Review the blood order/request form and the computer generated specimen labels for the laboratory tests ordered to
ensure they are all for the same person. Select the appropriate collection tubes based on the requested tests. (Refer to
the color coded stoppers on the tubes, the tube labels, and the tube/ test chart.) Do NOT apply any computer-
generated labels to, or write any information on the collection tubes at this time.
Step 7: Wash your hands. (1)
Step 8: Apply the Tourniquet (1,2)
A tourniquet is used to increase venous pressure. The increased venous pressure causes the veins to become more
prominent and easier to visualize and cleanly pierce with the needle.
Procedure for Applying Tourniquet
Apply the tourniquet 3-4 inches above the anticipated puncture site with enough tension to compress the vein and
not the artery.
1. Wrap the tourniquet around the arm 3-4 inches above the venipuncture site.
2. Tuck the end around the last round
Precautions When Using a Tourniquet
Do not allow the tourniquet to be applied for more than 1 minute. Extended application of the tourniquet may result
in local stasis and the possible hematoma formation (If the patient has a skin disease or sensitivity, the tourniquet
should be applied over the patient’s gown or a piece of gauze so that the tourniquet does not contact the skin.
NOTE: If a tourniquet must be applied for the preliminary vein selection, it should be released and
reapplied after a 2-minute rest period.
Step 9: Ensure the Patient’s Hand is Closed(1,2)
The veins become more prominent and easier to enter when the patient forms a fist. Discourage the patient from
“pumping” the fist.

52
Step 10: Select the Vein for VAD Placement(1,2)
The superficial veins of the anterior surface of the arm are the preferred sites for peripheral IV catheter placement as
this area provides better anatomical stability than does placement in the hand or antecubital fossa area. The hand
veins are also acceptable for venipuncture (see Figure).
NOTE: DO NOT use the radial veins (wrist area). If the patient has had a mastectomy, select the arm
opposite the mastectomy side. For patients with bilateral mastectomies, consult a physician
prior to starting the p-VAD.(2)
Step 11: Release the Tourniquet(2)
Release the tourniquet once the vein for p-VAD placement has been identified, ensuring that it is not left tied
beyond 1-minute. The tourniquet can be reapplied only after a 2-minute period has passed.
Step 12: Cleanse the Venipuncture Site & Allow to Dry(2)
1. Remove the skin-cleansing agent from its sterile package.
a. If using alcohol, cleanse site with a circular motion from the center to the periphery.
b. If using a different cleansing agent, cleanse the skin according to manufacturer’s directions.
2. Allow the area to dry to prevent hemolysis of the specimen, and to prevent the patient discomfort due to
alcohol contamination of the wound
Note: If the vein cannot be seen well and must be palpated again before venipuncture, re-cleanse the site
before proceeding.
Step 13: Prepare all p-VAD and blood collection supplies for easy access. (See Step 3)
Step 14: Reapply the Tourniquet(2)
1. Reapply the tourniquet as outlined in Step 8.
2. Instruct the patient to unclench the hand.
3. Ensure the patient’s hand is open as this reduces the amount of venous pressure as muscles relax.
Step 15: Put on sterile latex-free gloves(1,2)
Step 16: Newly Inserted p-VAD and Blood Specimen Collection
1. Insert an 18-21gauge p-VAD per hospital policy, attach the injection site port and secure.
2. Do NOT infuse anything through the newly placed p-VAD until the blood samples are obtained.
3. If using a non-syringe evacuation-type collection system, i.e. Vacutainer®:
a. Cleanse the p-VAD IV port and allow to air dry.
b. Using a needless adapter, insert it through the IV port and attach the red 4.7 ml Discard Blood
tube. Release the tourniquet as soon as possible once the blood begins to flow into the tube(1)
.
c. Remove the discard blood tube once it is filled to capacity and discard.(6,7)
NOTE:
(1) This guards against contaminants that can result in rejected specimens for analysis.
(2) Patients who present on anticoagulant therapy, need only have 4 ml of blood discarded
prior to collecting blood for coagulation studies.(7,8)
d. Once the discard blood has been obtained, collect the blood following the order of the draw as
noted below.
DISCARD BLOOD����Light Blue����Red ����Green/Lt Green����Lavender����Pink/White/Royal Blue����Gray (Tube Inversions) 3-4 5 8-10 8-10 8-10 8-10
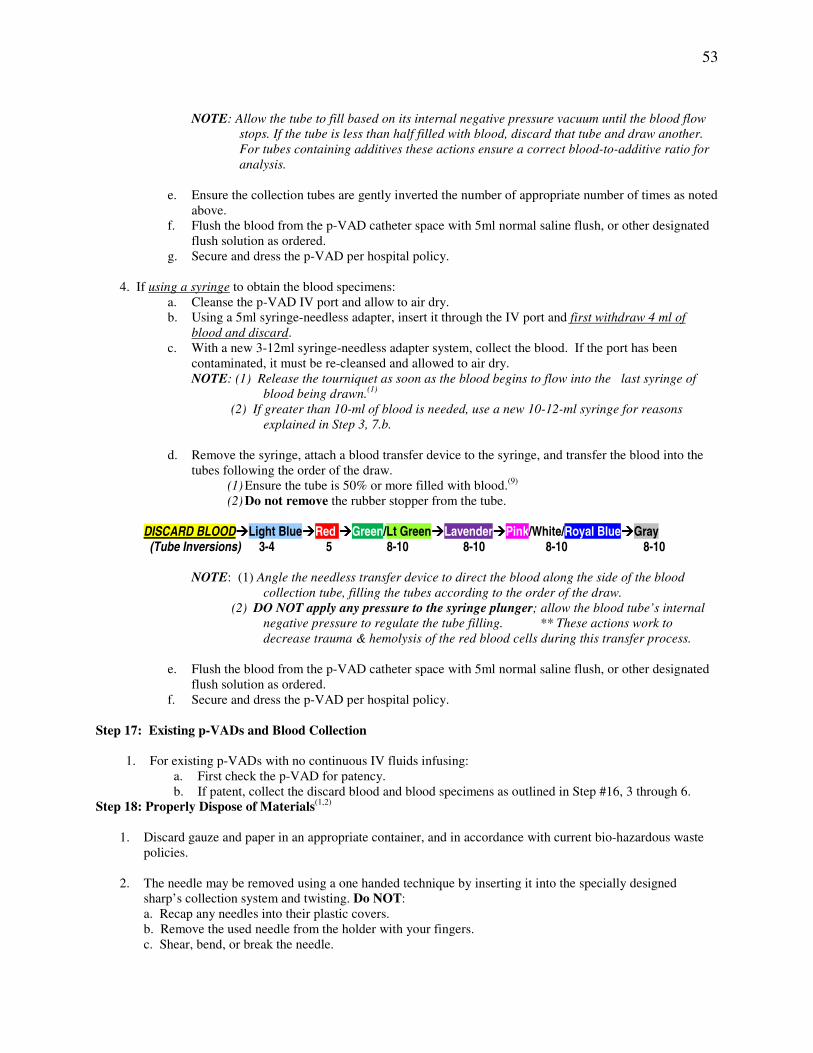
53
NOTE: Allow the tube to fill based on its internal negative pressure vacuum until the blood flow
stops. If the tube is less than half filled with blood, discard that tube and draw another.
For tubes containing additives these actions ensure a correct blood-to-additive ratio for
analysis.
e. Ensure the collection tubes are gently inverted the number of appropriate number of times as noted
above.
f. Flush the blood from the p-VAD catheter space with 5ml normal saline flush, or other designated
flush solution as ordered.
g. Secure and dress the p-VAD per hospital policy.
4. If using a syringe to obtain the blood specimens:
a. Cleanse the p-VAD IV port and allow to air dry.
b. Using a 5ml syringe-needless adapter, insert it through the IV port and first withdraw 4 ml of
blood and discard.
c. With a new 3-12ml syringe-needless adapter system, collect the blood. If the port has been
contaminated, it must be re-cleansed and allowed to air dry.
NOTE: (1) Release the tourniquet as soon as the blood begins to flow into the last syringe of
blood being drawn.(1)
(2) If greater than 10-ml of blood is needed, use a new 10-12-ml syringe for reasons
explained in Step 3, 7.b.
d. Remove the syringe, attach a blood transfer device to the syringe, and transfer the blood into the
tubes following the order of the draw.
(1) Ensure the tube is 50% or more filled with blood.(9)
(2) Do not remove the rubber stopper from the tube.
DISCARD BLOOD����Light Blue����Red ����Green/Lt Green����Lavender����Pink/White/Royal Blue����Gray (Tube Inversions) 3-4 5 8-10 8-10 8-10 8-10
NOTE: (1) Angle the needless transfer device to direct the blood along the side of the blood
collection tube, filling the tubes according to the order of the draw.
(2) DO NOT apply any pressure to the syringe plunger; allow the blood tube’s internal
negative pressure to regulate the tube filling. ** These actions work to
decrease trauma & hemolysis of the red blood cells during this transfer process.
e. Flush the blood from the p-VAD catheter space with 5ml normal saline flush, or other designated
flush solution as ordered.
f. Secure and dress the p-VAD per hospital policy.
Step 17: Existing p-VADs and Blood Collection
1. For existing p-VADs with no continuous IV fluids infusing:
a. First check the p-VAD for patency.
b. If patent, collect the discard blood and blood specimens as outlined in Step #16, 3 through 6.
Step 18: Properly Dispose of Materials(1,2)
1. Discard gauze and paper in an appropriate container, and in accordance with current bio-hazardous waste
policies.
2. The needle may be removed using a one handed technique by inserting it into the specially designed
sharp’s collection system and twisting. Do NOT:
a. Recap any needles into their plastic covers.
b. Remove the used needle from the holder with your fingers.
c. Shear, bend, or break the needle.
54
d. Force any item into the container.
Step 19: Label & Package Specimens (do NOT pre-label tubes) (10)
1. Label the tubes at the patient’s bedside after blood collection has been completed and legibly write the
date and time of the collection, and the phlebotomist’s initials on the label
a. If labels are not available, legibly write the full name and medical record number of the patient on the
tube, and include the date, time of collection, and your initials.
2. Place labeled tubes and paperwork in a Biohazard plastic bag for delivery to the laboratory. All specimens
from one patient should be placed in the same single bag.
Step 20: Examine p-VAD Security & Answer Patient Questions(1)
1. Inspect the p-VAD site to ensure it is secured properly.
2. Instruct the patient on the need to guard the integrity of the site, and to call staff for any questions
regarding the p-VAD.
3. Thank the patient and answer any questions they may have prior to leaving the room.
4. Ensure the call bell is within reach and side rails are in the up position, if needed, to ensure the patient’s
safety.
Step 21: Exit Room(1)
1. Do not leave any specimens or venipuncture supplies in the patient’s room.
2. Remove your gloves and wash hands.
Step 22: Transport Specimens to the Laboratory(10)
1. Place the ‘bagged’ collected specimens and related paperwork into a cushioned pneumatic tube, place the
tube into the pneumatic tube system, and send to the laboratory.
2. Specimens may also be hand delivered to the laboratory.
References:
1. Shands Jacksonville Medical Center. Procedure for the Collection of Diagnostic Blood Specimens by
Venipuncture (LAB-02-256).
2. Clinical and Laboratory Standards Institute (2007). Procedures for the collection of diagnostic blood specimens
by venipuncture: Approved standard – Sixth Edition (CLSI Document H3-A6). Wayne, PA: Clinical and
Laboratory Standards Institute.
3. Ong, M. E., Chan, Y. H. & Lim, C. S. (2008). Observational study to determine factors associated with blood
sample haemolysis in the emergency department. Annals of Academic Medicine Singapore, 37, 745-748.
Retrieved from http://www.annals.edu.sg/pdf/37volno9sep2008/v37n9p745.pdf
4. Grant, M. S. (2003). The effect of blood drawing techniques and equipment of the hemolysis of ED laboratory
blood samples. . Journal of Emergency Nursing, 29(2), 116-121. doi: 10.1067/men.2003.66
5. Burns, E. & Yoshikawa, N. (2002). Hemolysis in serum samples drawn by emergency department personnel
versus laboratory phlebotomists. Laboratory Medicine, 5(33), 378-380. Retrieved from
http://labmed.ascpjournals.org/content/33/5/378.full.pdf+html
6. Dugan, L., Leech, L., Speroni, K. G., & Corriher, J. (2005). Factors affecting hemolysis rates in blood samples
drawn from newly placed IV sites in the emergency room. Journal of Emergency Nursing, 31(4), 338-345. doi:
10.1016/j.jen.2005.05.004
7. Himberger, J. & Himberger, L. (2001). Accuracy of drawing blood through infusing intravenous lines. Heart &
Lung, 30, 66-73. doi: 10.1067/mhl.2001.110535
55
8. Prue-Owens, K. K. (2006). Use of peripheral venous access devices to obtain blood samples for measurement
of activated partial thromboplastin times. Critical Care Nurse, 26, 30-38. Retrieved from
http://ccn.aacnjournals.org/content/26/1/30.full.pdf+html
9. Arrants, J., Willis, M., Stevens, B., Gripkey, L., Herman, J., Hernandez-Brooks, L., and Eaker, j. (1999).
Reliability of an intravenous intermittent access port (saline lock) for obtaining blood samples for coagulation
studies. American Journal of Critical Care, 8(5), 344-348. Retrieved from the ProQuest Medical Library
10. Shands Jacksonville Medical Center. Specimen Receipt and Transport (LAB-02-215).
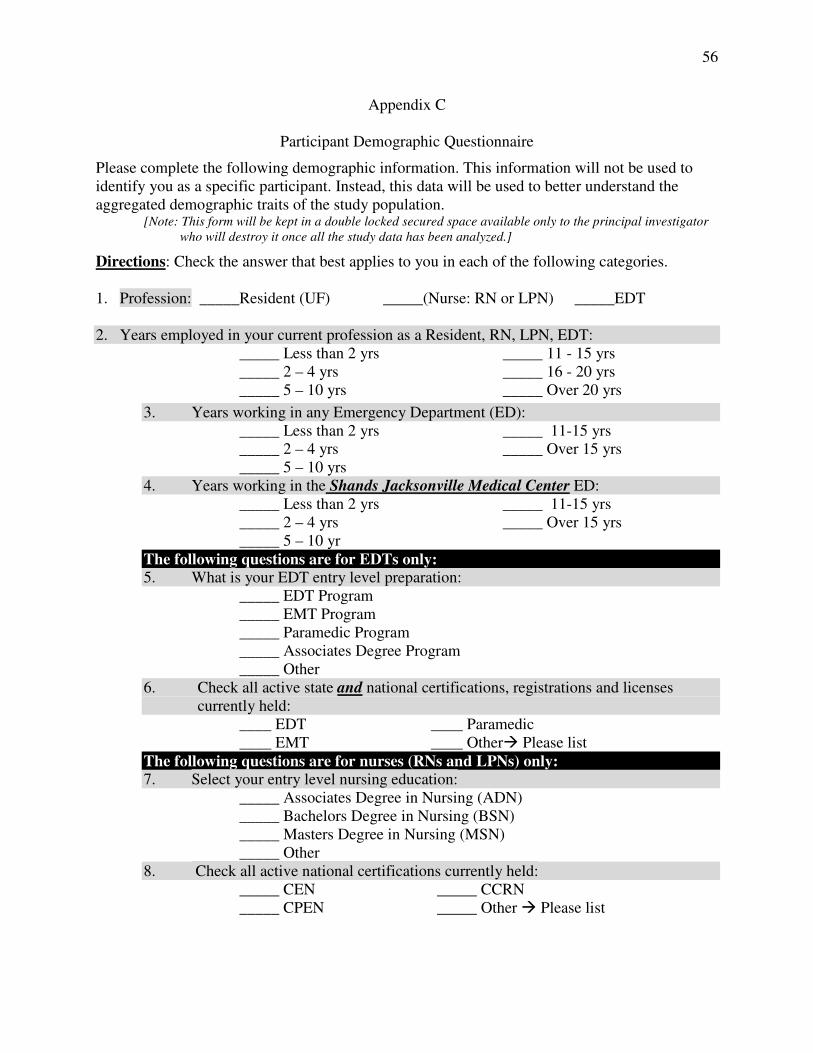
56
Appendix C
Participant Demographic Questionnaire
Please complete the following demographic information. This information will not be used to
identify you as a specific participant. Instead, this data will be used to better understand the
aggregated demographic traits of the study population. [Note: This form will be kept in a double locked secured space available only to the principal investigator
who will destroy it once all the study data has been analyzed.]
Directions: Check the answer that best applies to you in each of the following categories.
1. Profession: _____Resident (UF) _____(Nurse: RN or LPN) _____EDT
2. Years employed in your current profession as a Resident, RN, LPN, EDT:
_____ Less than 2 yrs
_____ 2 – 4 yrs
_____ 5 – 10 yrs
_____ 11 - 15 yrs
_____ 16 - 20 yrs
_____ Over 20 yrs
3. Years working in any Emergency Department (ED):
_____ Less than 2 yrs
_____ 2 – 4 yrs
_____ 5 – 10 yrs
_____ 11-15 yrs
_____ Over 15 yrs
4. Years working in the Shands Jacksonville Medical Center ED:
_____ Less than 2 yrs
_____ 2 – 4 yrs
_____ 5 – 10 yr
_____ 11-15 yrs
_____ Over 15 yrs
The following questions are for EDTs only:
5. What is your EDT entry level preparation:
_____ EDT Program
_____ EMT Program
_____ Paramedic Program
_____ Associates Degree Program
_____ Other
6. Check all active state and national certifications, registrations and licenses
currently held:
____ EDT ____ Paramedic
____ EMT ____ Other� Please list
The following questions are for nurses (RNs and LPNs) only:
7. Select your entry level nursing education:
_____ Associates Degree in Nursing (ADN)
_____ Bachelors Degree in Nursing (BSN)
_____ Masters Degree in Nursing (MSN)
_____ Other
8. Check all active national certifications currently held:
_____ CEN
_____ CPEN
_____ CCRN
_____ Other � Please list
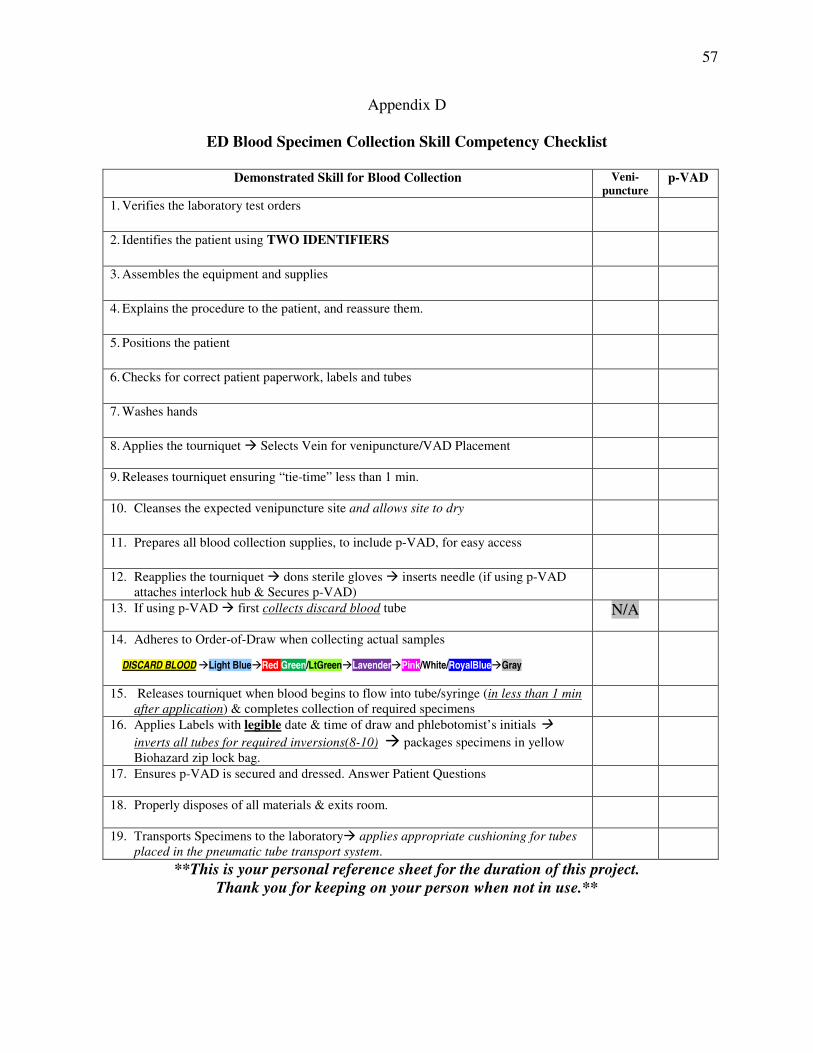
57
Appendix D
ED Blood Specimen Collection Skill Competency Checklist
Demonstrated Skill for Blood Collection Veni-
puncture p-VAD
1. Verifies the laboratory test orders
2. Identifies the patient using TWO IDENTIFIERS
3. Assembles the equipment and supplies
4. Explains the procedure to the patient, and reassure them.
5. Positions the patient
6. Checks for correct patient paperwork, labels and tubes
7. Washes hands
8. Applies the tourniquet � Selects Vein for venipuncture/VAD Placement
9. Releases tourniquet ensuring “tie-time” less than 1 min.
10. Cleanses the expected venipuncture site and allows site to dry
11. Prepares all blood collection supplies, to include p-VAD, for easy access
12. Reapplies the tourniquet � dons sterile gloves � inserts needle (if using p-VAD
attaches interlock hub & Secures p-VAD)
13. If using p-VAD � first collects discard blood tube
N/A
14. Adheres to Order-of-Draw when collecting actual samples
DISCARD BLOOD �Light Blue�Red Green/LtGreen�Lavender�Pink/White/RoyalBlue�Gray
15. Releases tourniquet when blood begins to flow into tube/syringe (in less than 1 min
after application) & completes collection of required specimens
16. Applies Labels with legible date & time of draw and phlebotomist’s initials �
inverts all tubes for required inversions(8-10) � packages specimens in yellow
Biohazard zip lock bag.
17. Ensures p-VAD is secured and dressed. Answer Patient Questions
18. Properly disposes of all materials & exits room.
19. Transports Specimens to the laboratory� applies appropriate cushioning for tubes
placed in the pneumatic tube transport system.
**This is your personal reference sheet for the duration of this project.
Thank you for keeping on your person when not in use.**
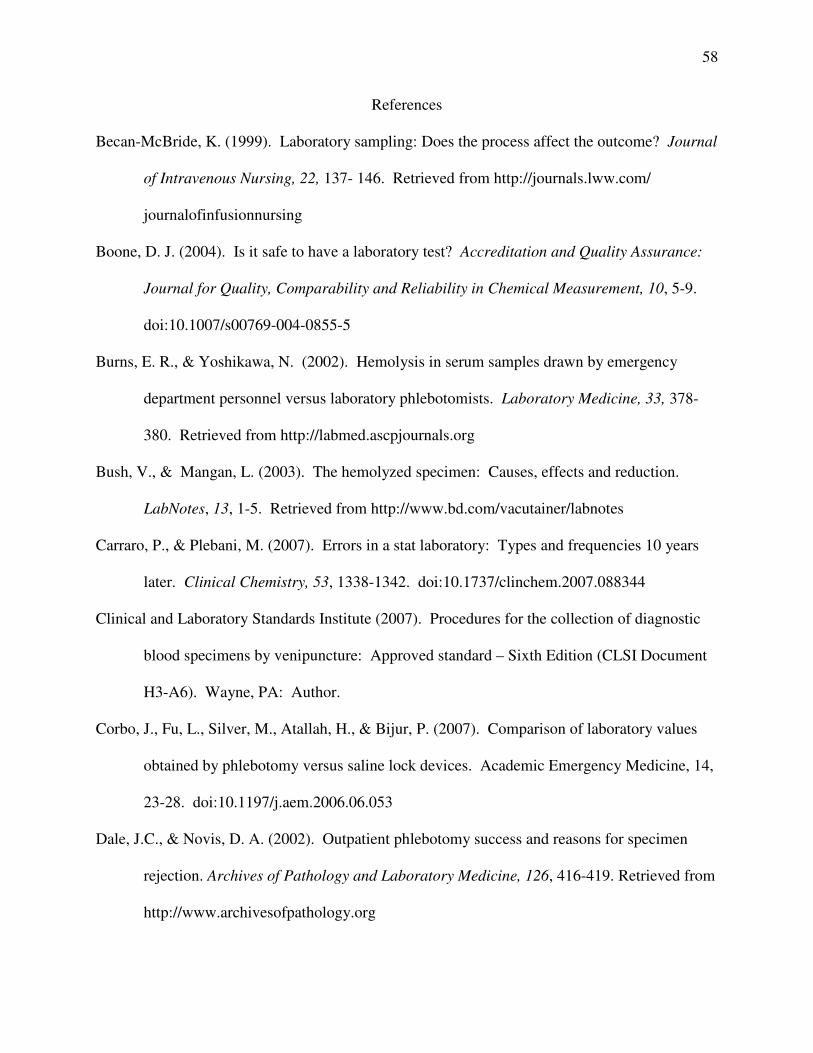
58
References
Becan-McBride, K. (1999). Laboratory sampling: Does the process affect the outcome? Journal
of Intravenous Nursing, 22, 137- 146. Retrieved from http://journals.lww.com/
journalofinfusionnursing
Boone, D. J. (2004). Is it safe to have a laboratory test? Accreditation and Quality Assurance:
Journal for Quality, Comparability and Reliability in Chemical Measurement, 10, 5-9.
doi:10.1007/s00769-004-0855-5
Burns, E. R., & Yoshikawa, N. (2002). Hemolysis in serum samples drawn by emergency
department personnel versus laboratory phlebotomists. Laboratory Medicine, 33, 378-
380. Retrieved from http://labmed.ascpjournals.org
Bush, V., & Mangan, L. (2003). The hemolyzed specimen: Causes, effects and reduction.
LabNotes, 13, 1-5. Retrieved from http://www.bd.com/vacutainer/labnotes
Carraro, P., & Plebani, M. (2007). Errors in a stat laboratory: Types and frequencies 10 years
later. Clinical Chemistry, 53, 1338-1342. doi:10.1737/clinchem.2007.088344
Clinical and Laboratory Standards Institute (2007). Procedures for the collection of diagnostic
blood specimens by venipuncture: Approved standard – Sixth Edition (CLSI Document
H3-A6). Wayne, PA: Author.
Corbo, J., Fu, L., Silver, M., Atallah, H., & Bijur, P. (2007). Comparison of laboratory values
obtained by phlebotomy versus saline lock devices. Academic Emergency Medicine, 14,
23-28. doi:10.1197/j.aem.2006.06.053
Dale, J.C., & Novis, D. A. (2002). Outpatient phlebotomy success and reasons for specimen
rejection. Archives of Pathology and Laboratory Medicine, 126, 416-419. Retrieved from
http://www.archivesofpathology.org
59
Dugan, L., Leech, L., Speroni, K. G., & Corriher, J. (2005). Factors affecting hemolysis rates in
blood samples drawn from newly placed IV sites in the emergency room. Journal of
Emergency Nursing, 31, 338-345. doi:10.1016/j.jen.2005.05.004
Ernst, D. J. & Calam, R. (2004). NCCLS simplifies the order of draw: A brief history. Medical
Laboratory Observer, May 2004, 26-27. Retrieved from http://www.mlo-online.com
Fernandes, C. M. B., Walker, R., Price, A., Marsden, J., & Haley, L. (1997). Root cause analysis
of laboratory delays in an emergency department. Journal of Emergency Medicine, 15,
735-739. Retrieved from http://www.jem-journal.com
Fernandes, M., Worster, A., Eva, K., Hill, S., & McCallum, C. (2006). Pneumatic tube delivery
system for blood samples reduces turnaround times without affecting sample quality.
Journal of Emergency Nursing, 32, 139-143. doi:10.1016/j.jen.2005.11.013
Grant, M. S. (2003). The effect of blood drawing techniques and equipment of the hemolysis of
ED laboratory blood samples. Journal of Emergency Nursing, 29, 116-121.
doi:10.1067/men.2003.66
Halm, M. A., & Gleaves, M. (2009). Obtaining blood samples from peripheral intravenous
catheters: Best practice? American Journal of Critical Care, 18, 474-478.
doi:10.4037/ajcc2009686
Heyer, N. J., Derzon, J. H., Winges, L., Shaw, C., Mass, D., Snyder, S. R., ... & Liebow, E. B.
(2012). Effectiveness of practices to reduce blood sample hemolysis in EDs: A laboratory
medicine best practices systematic review and meta-analysis. Clinical Biochemistry, 45,
1012-1023. doi.org/10.1016/j.clinbiochem.2012.08.002
60
Himberger, J. R., & Himberger, L. C. (2001). Accuracy of drawing blood through infusing
intravenous lines. Heart & Lung, 30, 66-73. doi:10.1067/mhl.2001.110535
Institute of Medicine (2000). In L. T. Kohn, J. M. Corrigan & M. S. Donaldson (Eds.). To err is
human: Building a safer health system. Washington DC: National Academy Press.
International Federation of Clinical Chemistry and Laboratory Medicine (IFCC), Education and
Management Division, Working Group: Laboratory Errors and Patient Safety (n.d.).
Model of Quality Indicator 9.3.8. Laboratory Errors and Patient Safety (WG-LEPS).
Retrieved from http://www2.csinet.it/mqiweb/
Kennedy, C., Angermuller, S., King, R., Noviello, S., Walker, J., Warden, J., & Van, S. (1996).
A comparison of hemolysis rates using intravenous catheters versus venipuncture for
obtaining blood samples. Journal of Emergency Nursing, 22, 566-569. Retrieved from
http://www.jenonline.org
Lehman, B. & Goldstein, L. (Eds.) (2012). HCAHPS Executive Insight Letter, (2012,
Summer). Retrieved from http://www.hcahpsonline.org/executive_insight/
Lippi, G., Guidi, G. C., Mattiuzzi, C., & Plebani, M. (2006). Preanalytical variability: The dark
side of the moon in laboratory testing. Clinical Chemistry and Laboratory Medicine, 44,
358-365. doi:10.1515/CCLM.2006.07
Lippi, G., Salvagno, G. L., Montagnana, M., Brocco, G., & Guidi, G. C. (2006). Influence of
hemolysis on routine clinical chemistry testing. Clinical Chemistry and Laboratory
Medicine, 44, 311-316. doi:10.1515/CCLM.2006.054
Lippi, G., Salvagno, G. L., Montagnana, M., Franchini, M., & Guidi, G. C. (2006). Phlebotomy
issues and quality improvement in results of laboratory testing. Clinical Laboratory, 52,
217-230. Retrieved from http://www.clin-lab-publications.com
61
Lowe, G., Stike, R., Pollack, M., Bosley, J., O’Brien, P., Hake, A., …& Stover, T. (2008).
Nursing blood collection techniques and hemolysis rates in an emergency department:
Analysis of venipuncture versus intravenous catheter collection techniques. Journal of
Emergency Nursing, 34, 26-32. doi:10.1016/j.jen.2007.02.006
Melnyk, B. M. & Fineout-Overholt, E. (2005). Evidence-based practice in nursing and
healthcare. Philadelphia, PA: Lippincott Williams & Wilkins.
Ong, M. E., Chan, Y. H. & Lim, C. S. (2008). Observational study to determine factors
associated with blood sample haemolysis in the emergency department. Annals of
Academic Medicine Singapore, 37, 745-748. Retrieved from
http://www.annals.edu.sg/pdf/37volno9sep2008/v37n9p745.pdf
Plebani, M. (2006). Errors in clinical laboratories or errors in laboratory medicine? Clinical
Chemistry and Laboratory Medicine, 44, 750-759. doi:10.1515/CCLM.2006.123
Plebani, M. (2007). Laboratory medicine: Value for patients is the goal [Letter to the Editor].
Clinical Chemistry, 53, 1873-1874. doi:10.1373/clinchem.2007.090563
Plebani, M., & Carraro, P. (1997). Mistakes made in a stat laboratory: Types and frequency.
Clinical Chemistry, 43, 1348-1351. Retrieved from http://www.clinchem.org
Sharp, M. K., & Mohammad, S. F. (1998). Scaling hemolysis in needles and catheters. Annals
of Biomedical Engineering, 26, 788-797. doi:10.1114/1.65
Shahangian, S., & Snyder, S. R. (2009). Laboratory medicine quality indicators A Review of the
literature. American Journal of Clinical Pathology, 131, 418-431. doi:
10.1309/AJCPJF8JI4ZLDQU
62
Smith, B. (2007). Preanalytical errors in the emergency department. BD LabNotes, 17(1), 1-7.
Retrieved from http://www.bd.com/vacutainer/labnotes
Stark, A., Jones, B. A., Chapman, D., Well, K., Krajenta, R., Meier, F. A., & Zarbo, R. J. (2007).
Clinical laboratory specimen rejection: Association with the site of patient care and
patient’s characteristics: Findings from a single health care organization. Archives of
Pathology and Laboratory Medicine, 131, 588-592. Retrieved from
http://www.archivesofpathology.org/doi/pdf/10.1043/1543-
2165%282007%29131%5B588%3ACLSRWT%5D2.0.CO%3B2
Strauss, M., Sherman, B., Pugh, L., Prone, D., Lobby-Rodriquez, K., Bell, A., & Reed, C.
(2012). Hemolysis of coagulation specimens: A comparative study of intravenous draw
methods. Journal of Emergency Nursing, 38, 15-21. doi:10.1016/j.jen.2010.08.011
Steindel, S., & Howanitz, P. (2001). Physician satisfaction and emergency department
laboratory test turnaround time. Archives of Pathology and Laboratory Medicine, 125,
863-872. Retrieved from http://www.archivesofpathology.org
Wagar, E. A., Tamashiro, L., Bushra, Y., Lilborne, L., & Bruckner, D. A. (2006). Patient safety
in the clinical laboratory: A longitudinal analysis of specimen identification errors.
Archives of Pathology and Laboratory Medicine, 130, 1662-1668. Retrieved from
http://www.archivesofpathology.org
Wallin, O., Soderberg, J., Grankvist, K., Jonsson, P. A., & Hultdin, J. (2008). Preanalytical
effects of pneumatic tube transport on routine haematology, coagulation parameters,
platelet function and global coagulation. Clinical Chemistry and Laboratory Medicine,
46, 1443-1449. doi:10.1515/CCLM.2008.288
63
Zarbo, R. J., Jones, B. A., Friedberg, R. C., Wallenstein, P. N., Renner, S. W., Schuman, R. B.,
... & Howanitz, P. J. (2002). Q-Tracks: A College of American Pathologists program of
continuous laboratory monitoring and longitudinal performance tracking. Archives of
Pathology and Laboratory Medicine, 126(9), 1036-1044. Retrieved from
http://www.archivesofpathology.org
64
Vita
Barbara Klos Vernoski was born . She was awarded a bachelors
of science in nursing from Niagara University and earned a masters of science in trauma and
critical care nursing from the University of Maryland in 1989.
The first part of her healthcare career was spent in the United States Navy as a Nurse
Corps officer stationed throughout America and Europe. Beginning her military career as a
critical care nurse, she expanded her practice to ambulatory care and healthcare administration
and became the first nurse corps officer to serve as the commanding officer of a naval hospital
with a graduate medical education program. Additional assignments included the Casualty
Reception Division Officer aboard the hospital ship USNS Comfort during Desert Shield and
Desert Storm, commanding officer of a1000-bed Fleet Hospital, Deputy Director of TRICARE
Europe, and leader of a Department of Defense/Veterans Affairs healthcare delegation to
Romania.
Upon her transition from the military, she settled in Jacksonville, Florida and worked for
The Joint Commission as a hospital accreditation program surveyor. She is currently employed
at the Shands Jacksonville Medical Center as the Vice President for Specialty Care Services and
the Division Director for Ancillary and Clinical Services.
Chernow, B., Vernoski, B. K., Zaloga, G. P., Cook, D., D’Angona, D. Jr., VanNess, M., and
Fletcher, J. R. (1984). Dexamethasone causes less steroid-induced alkalemia than
methlyprednisilone or hydrocortisone. Critical Care Medicine, 12(4), 384-386.
Vernoski, B. K. and Chernow, B. (1983). Steroids: Use and abuse. Critical Care Quarterly,
6(3), 28-38.