Embed Size (px)
Citation preview

EDDY COUNTY, NEW MEXICO AND INCORPORATED AREAS
Community Name
Community Number
ARTESIA, CITY OF 350016
CARLSBAD, CITY OF 350017
EDDY COUNTY,
UNINCORPORATED AREAS 350120
* HOPE, VILLAGE OF 350120
LOVING, VILLAGE OF 350114
* Non-floodprone Community
EFFECTIVE: June 4, 2010
Federal Emergency Management Agency
FLOOD INSURANCE STUDY NUMBER 35015CV000A

NOTICE TO FLOOD INSURANCE STUDY USERS
Communities participating in the National Flood Insurance Program have established repositories of flood hazard data for floodplain management and flood insurance purposes. This flood insurance study may not contain all data available within the repository. It is advisable to contact the community for any additional data. Selected Flood Insurance Rate Map panels for the community contain information that was previously shown separately on the corresponding Flood Boundary and Floodway Map panels (e.g., floodways, cross sections). In addition, former flood hazard zone designations have been changed as follows: Old Zone New Zone A1 through A30 AE V1 through V30 VE B X C X Part or all of this Flood Insurance study may be revised and republished at any time. In addition, part of this Flood Insurance Study may be revised by the Letter of Map Revision process, which does not involve republication or redistribution of the Flood Insurance Study. It is, therefore, the responsibility of the user to consult with community officials and to check the community repository to obtain the most current Flood Insurance Study components. Initial Countywide FIS Effective Date: June 4, 2010

i
TABLE OF CONTENTS
Page
1.0 INTRODUCTION ............................................................................................................................. 1
1.1 Purpose of Study ................................................................................................................................ 1 1.2 Authority and Acknowledgments .................................................................................................... 1 1.3 Coordination ....................................................................................................................................... 2
2.0 AREA STUDIED ............................................................................................................................... 4
2.1 Scope of Study ................................................................................................................................... 4 2.2 Community Description .................................................................................................................... 5 2.3 Principal Flood Problems ................................................................................................................. 8 2.4 Flood Protection Measures ............................................................................................................. 10
3.0 ENGINEERING METHODS ........................................................................................................ 11
3.1 Hydrologic Analyses ....................................................................................................................... 11 3.2 Hydraulic Analyses ......................................................................................................................... 14 3.3 Vertical Datum ................................................................................................................................. 17
4.0 FLOODPLAIN MANAGEMENT APPLICATIONS .................................................................. 18
4.1 Floodplain Boundaries .................................................................................................................... 18 4.2 Floodways ......................................................................................................................................... 18
5.0 INSURANCE APPLICATION ...................................................................................................... 22
6.0 FLOOD INSURANCE RATE MAP .............................................................................................. 22
7.0 OTHER STUDIES .......................................................................................................................... 24
8.0 LOCATION OF DATA .................................................................................................................. 24
9.0 BIBLIOGRAPHY AND REFERENCES ...................................................................................... 24
FIGURES
Figure 1. Floodway Schematic ...........................................................................................................................19
TABLES
Table 1. Streams Studied by Detailed Methods ................................................................................................... 5 Table 2. Summary of Discharges ........................................................................................................................13 Table 3. Manning's 'n' Values .............................................................................................................................17 Table 4. Floodway Data Tables ..........................................................................................................................20 Table 5. Community Map History ......................................................................................................................23

ii
TABLE OF CONTENTS (cont.)
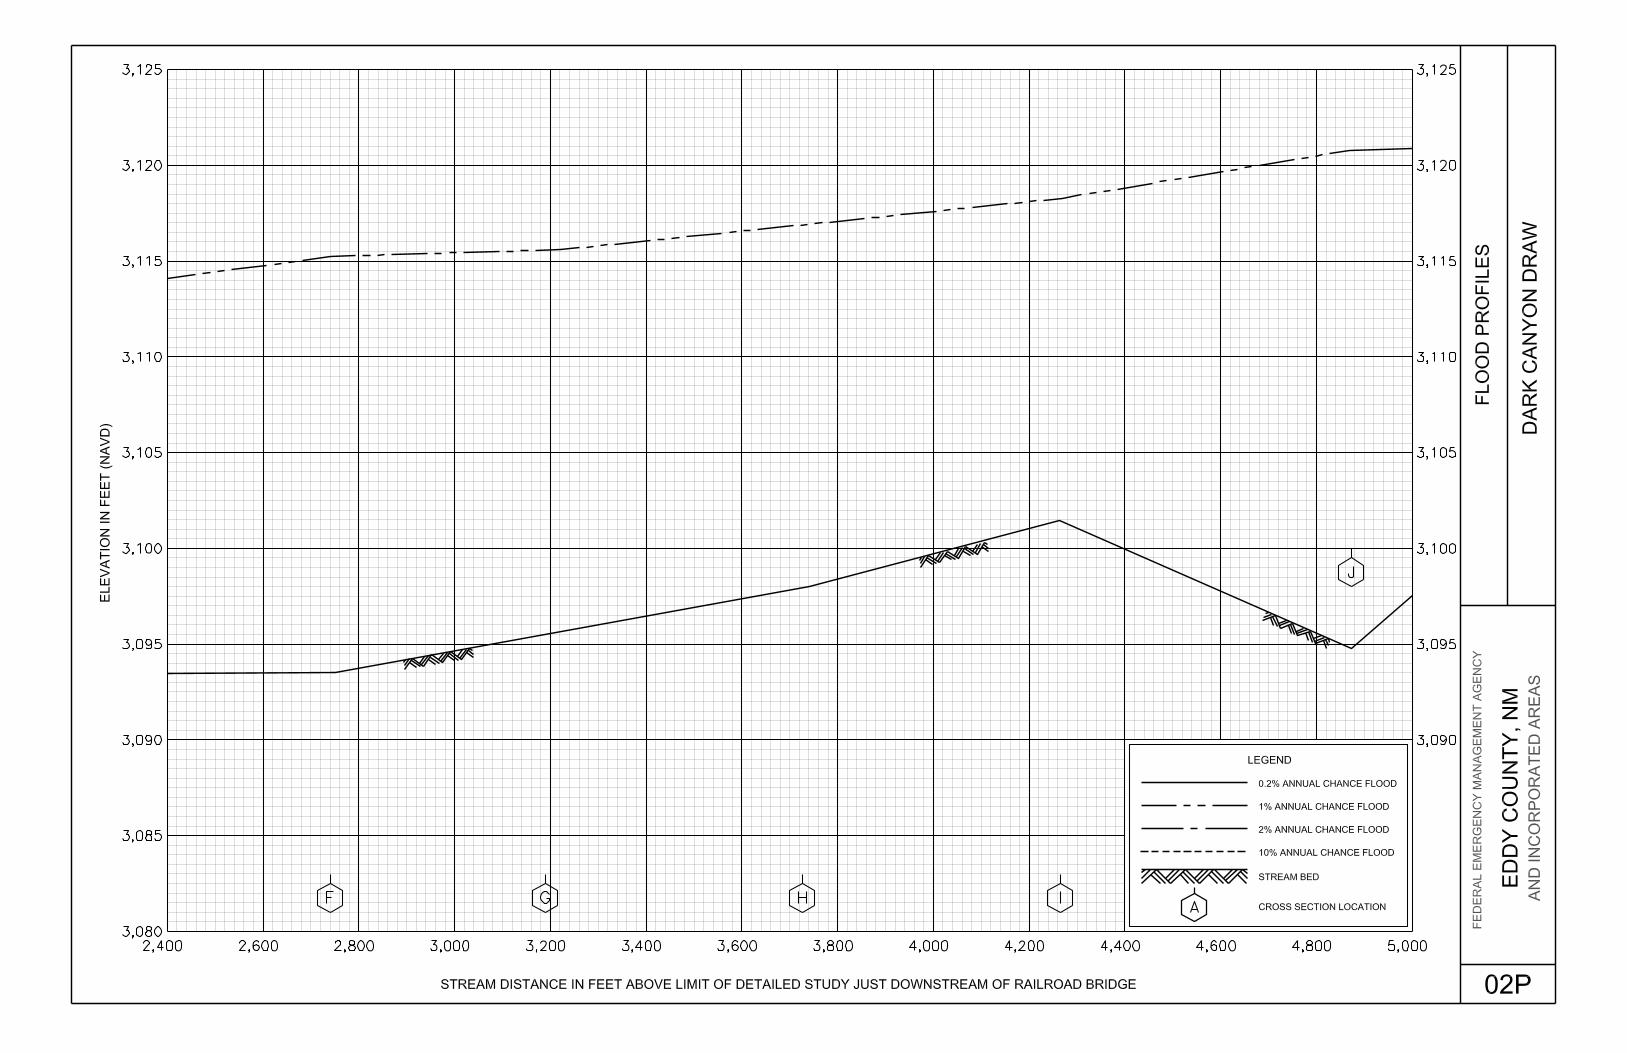
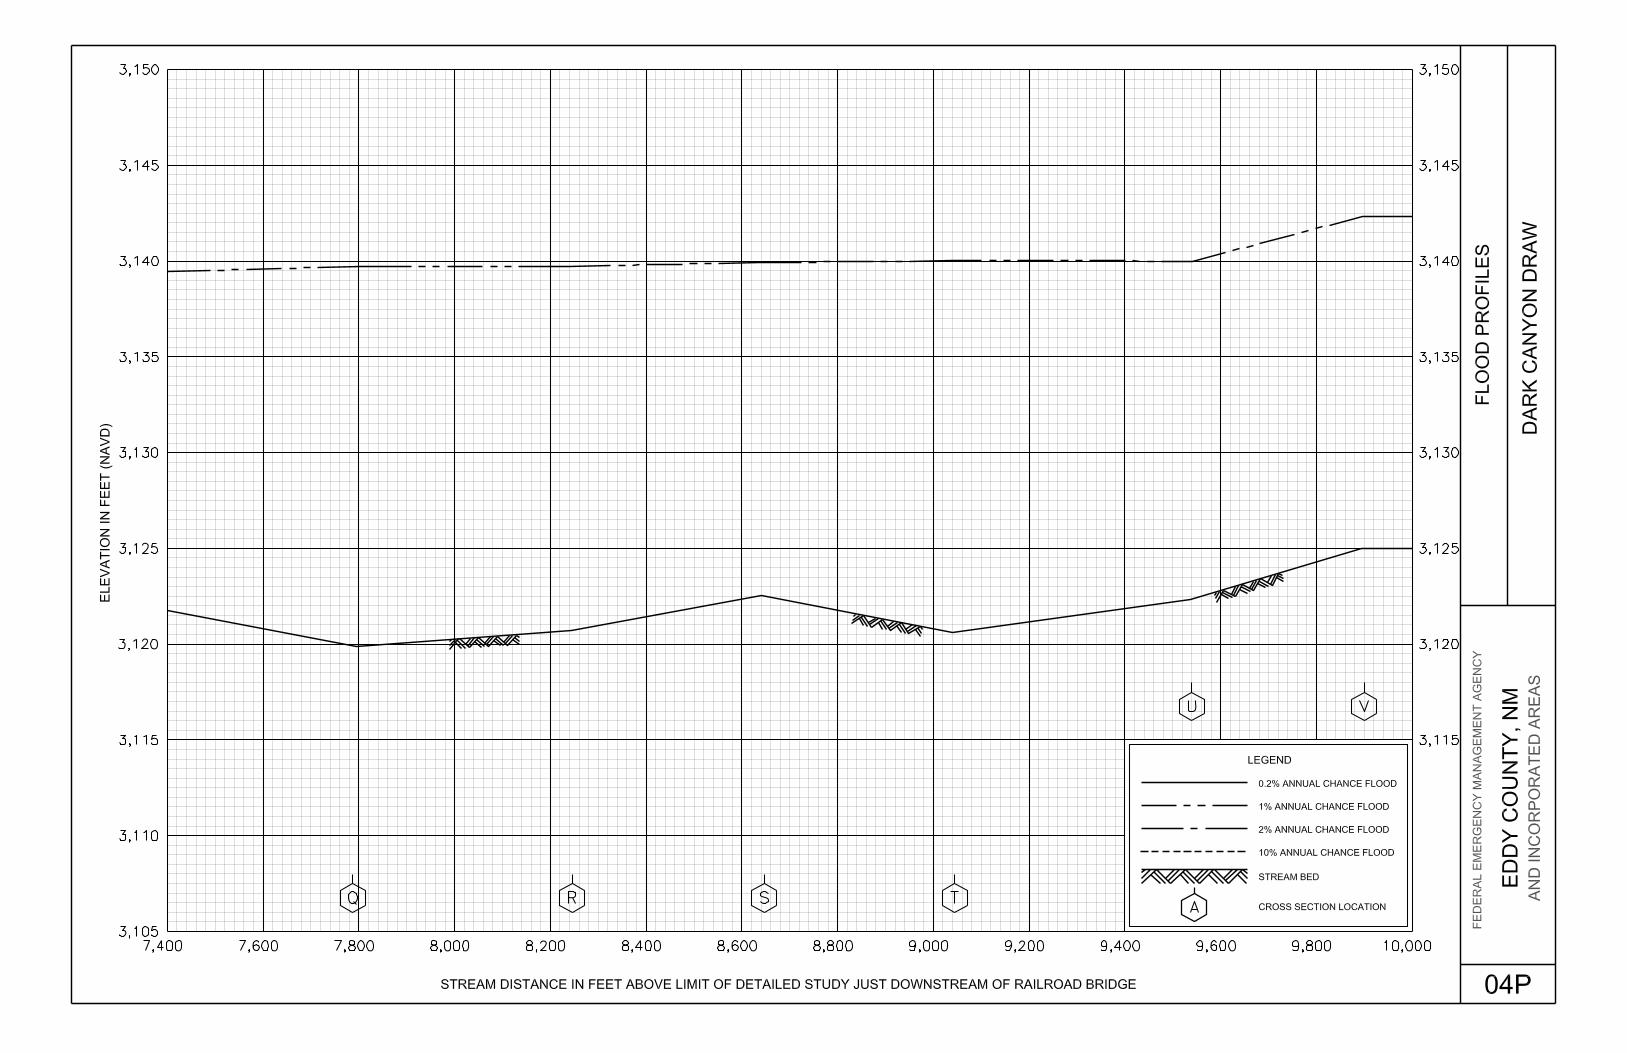
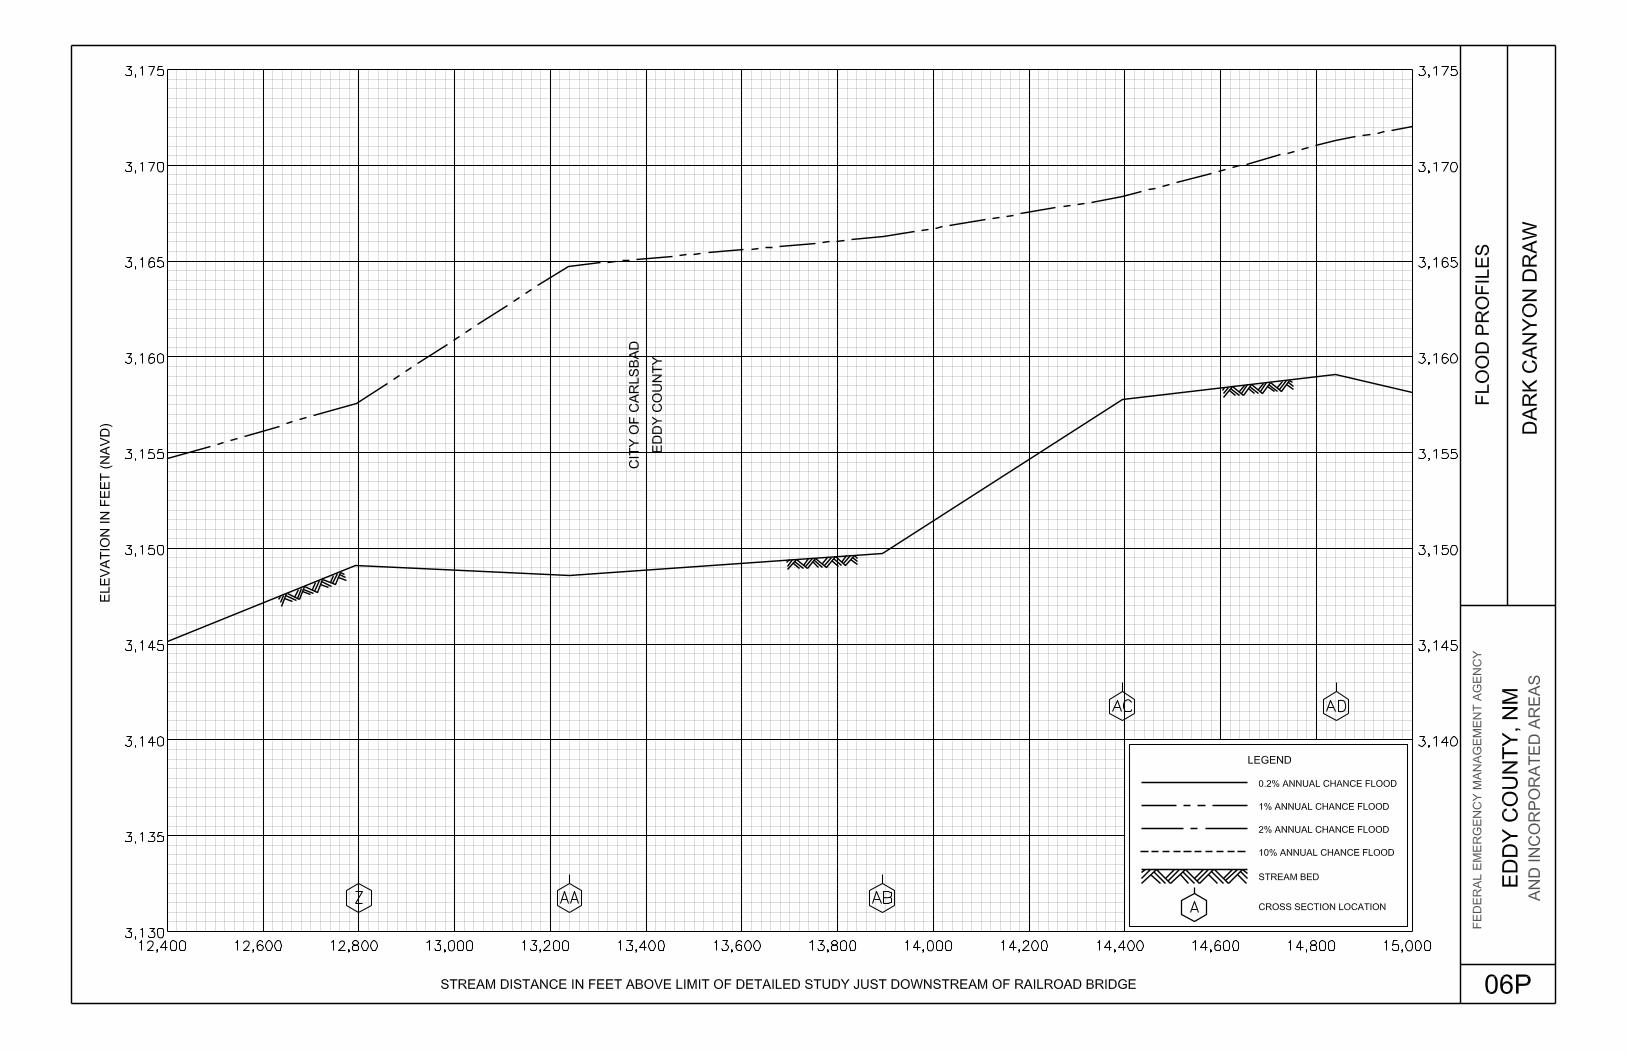
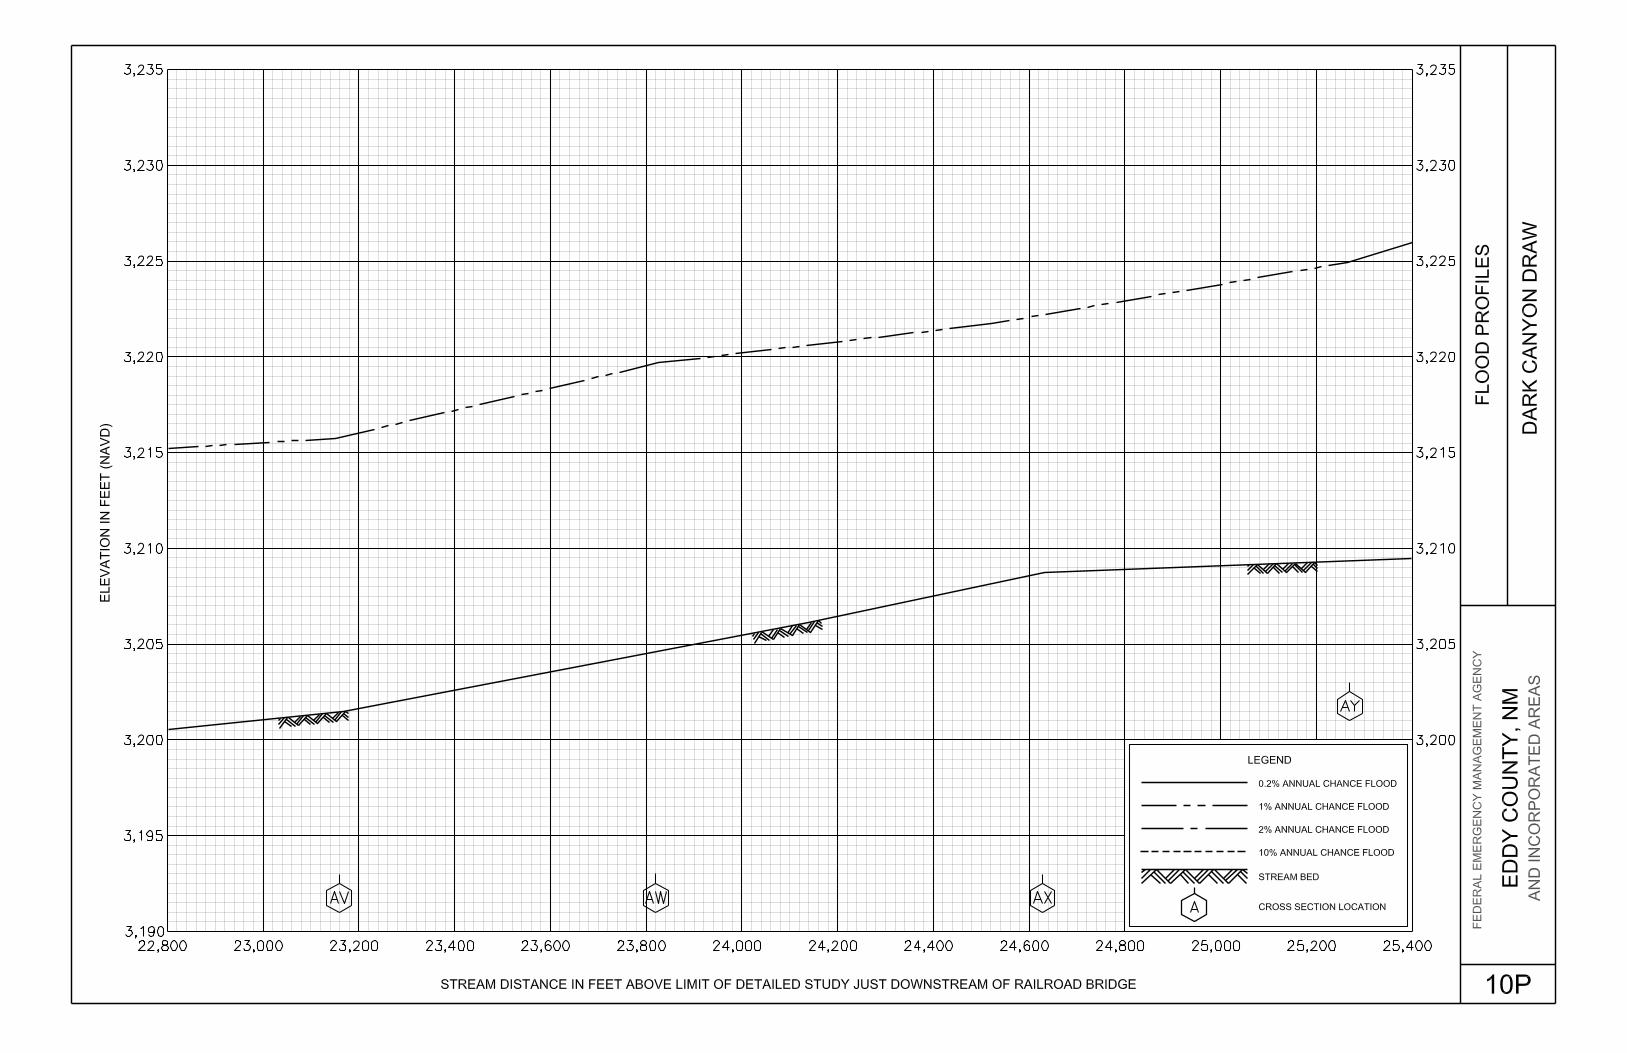
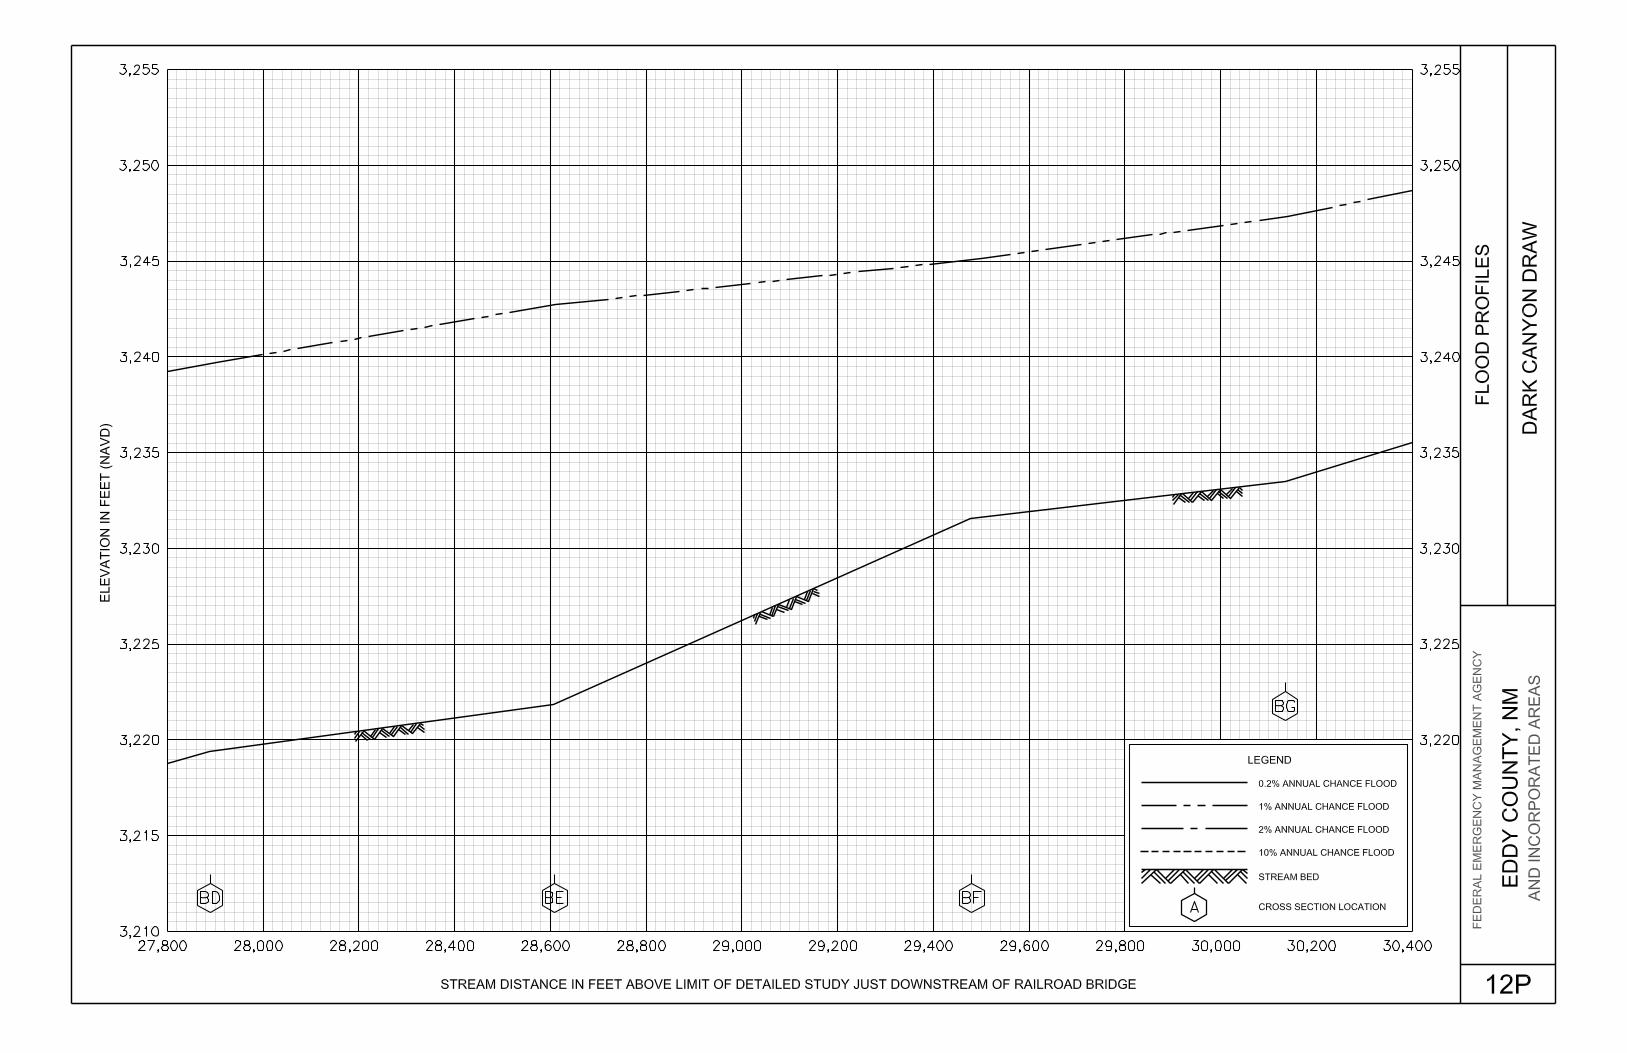
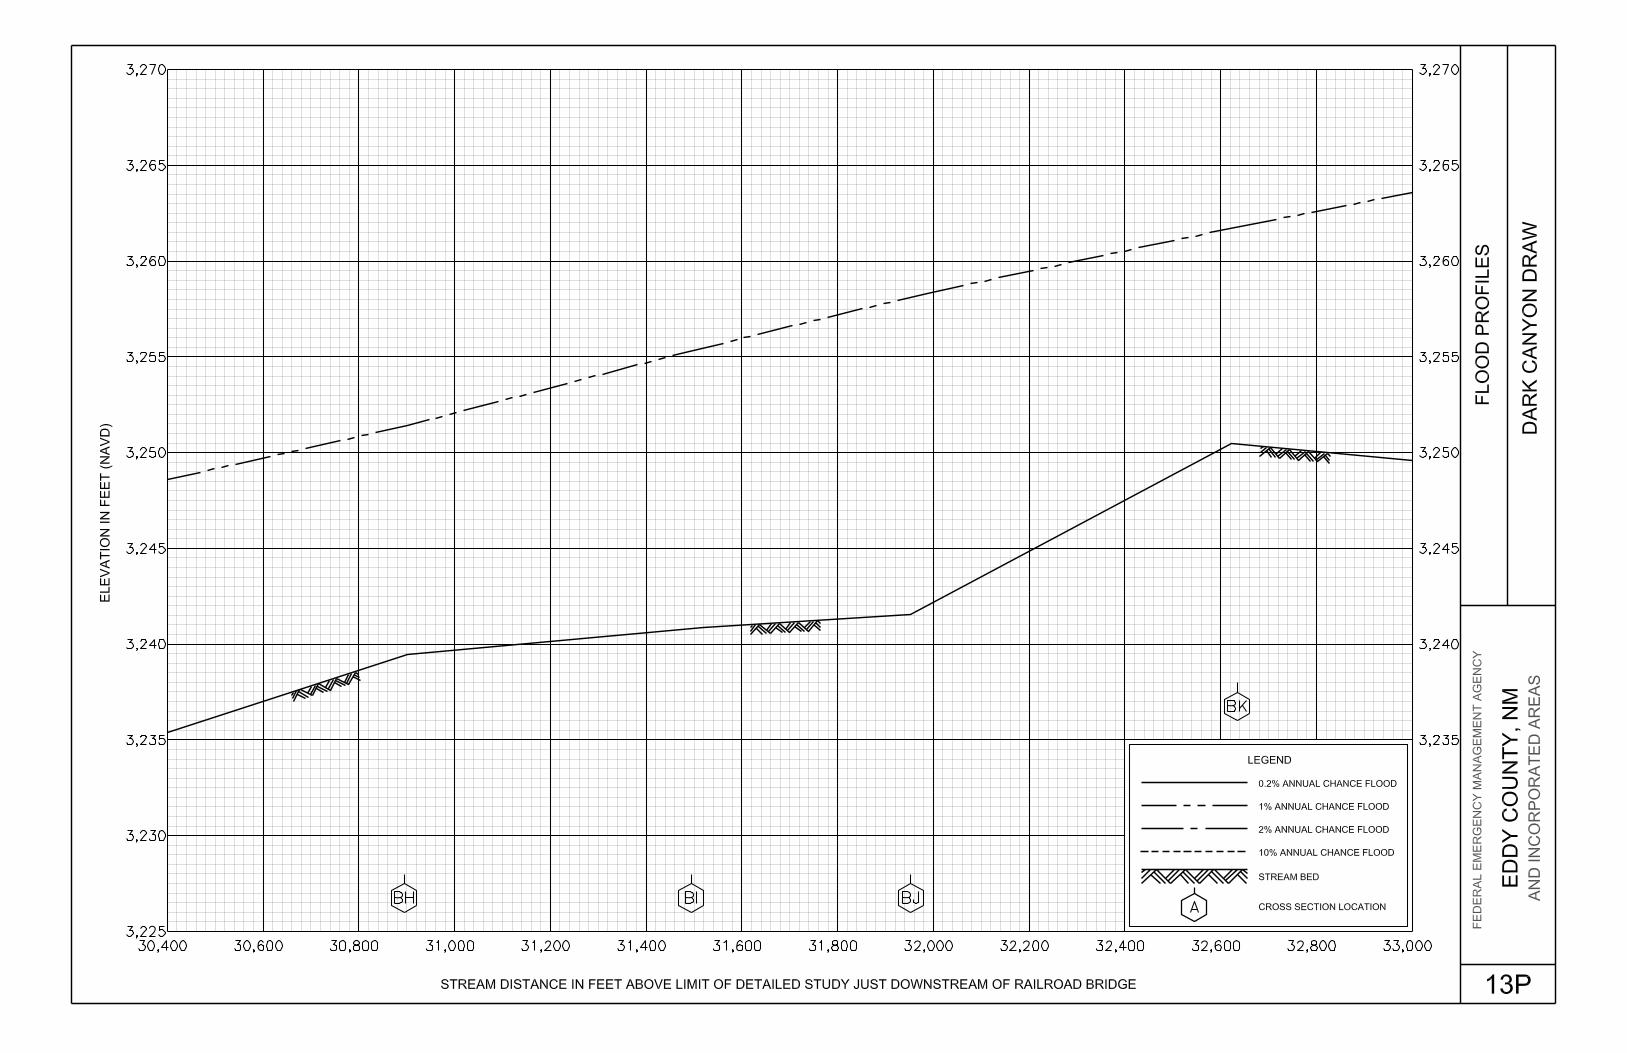
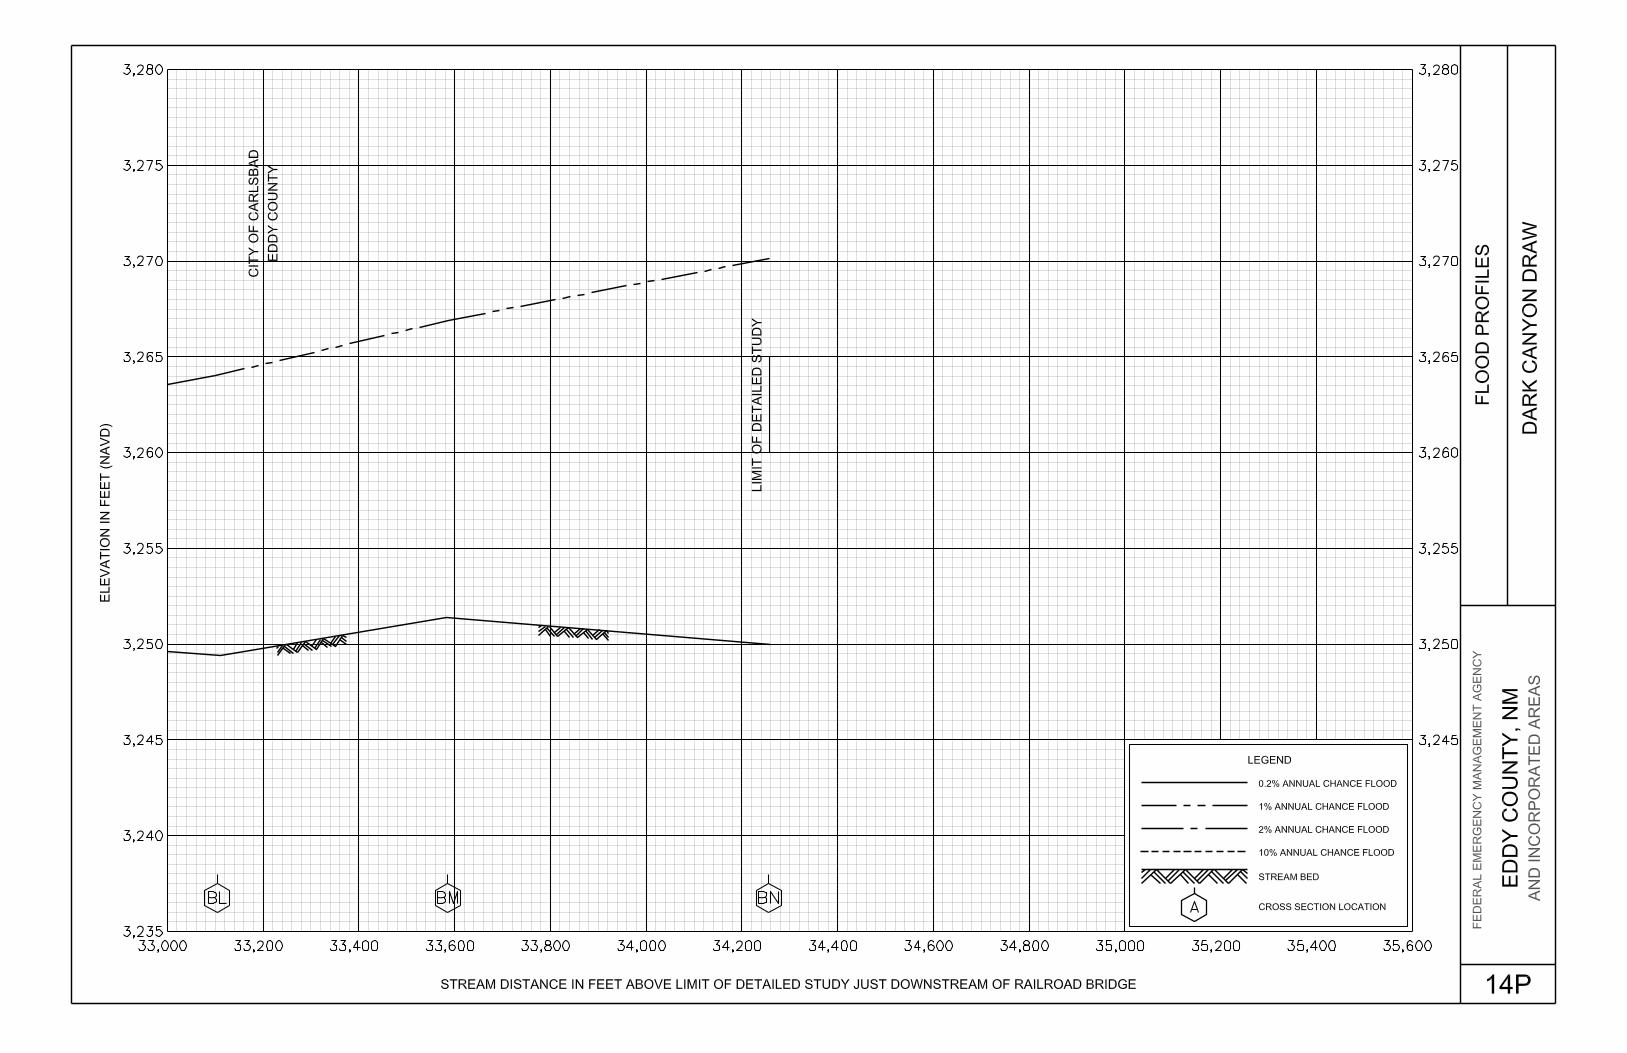
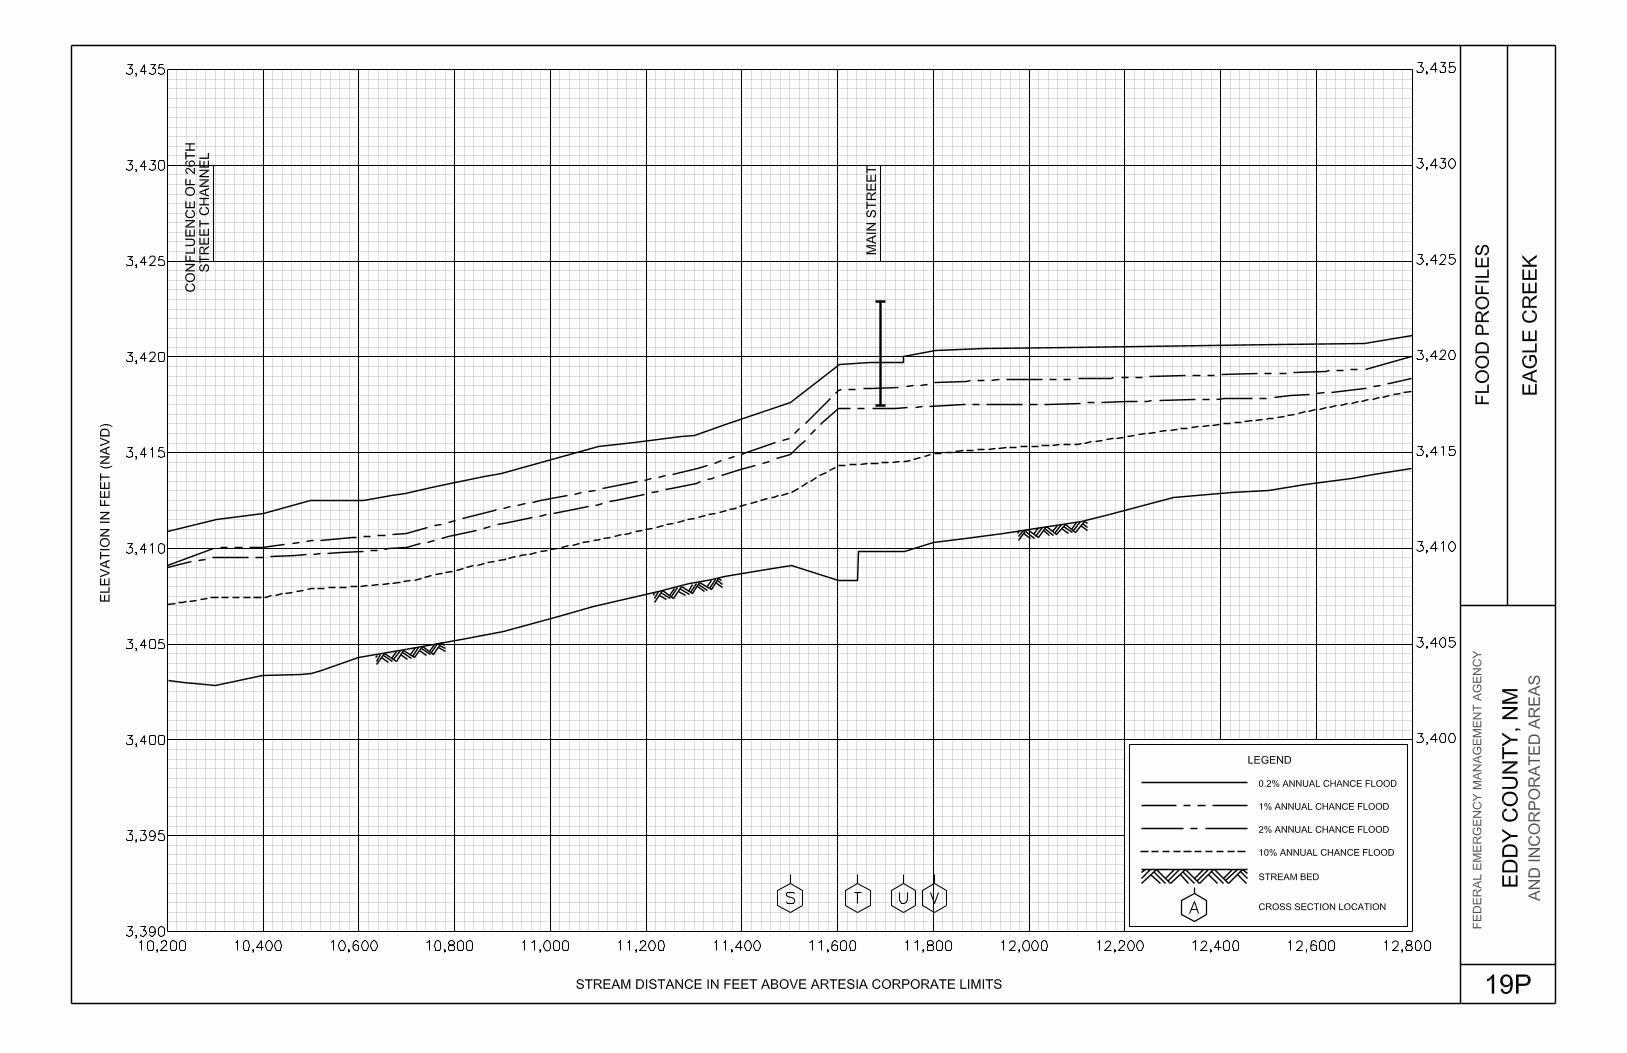
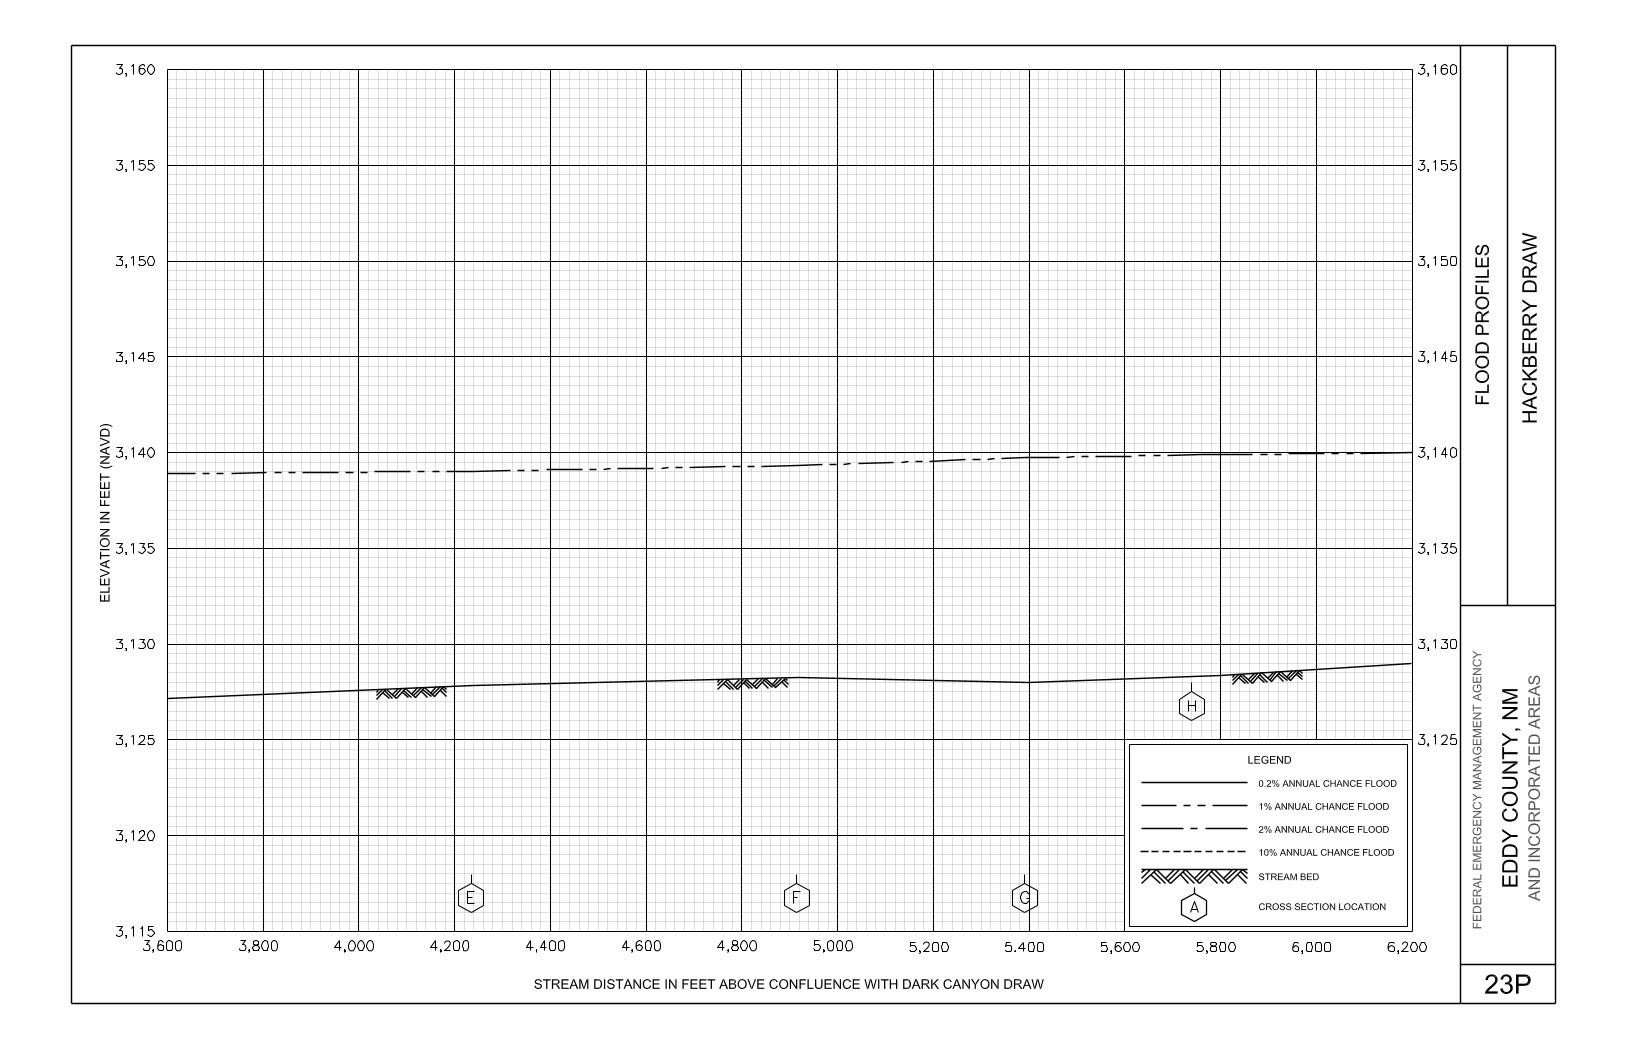
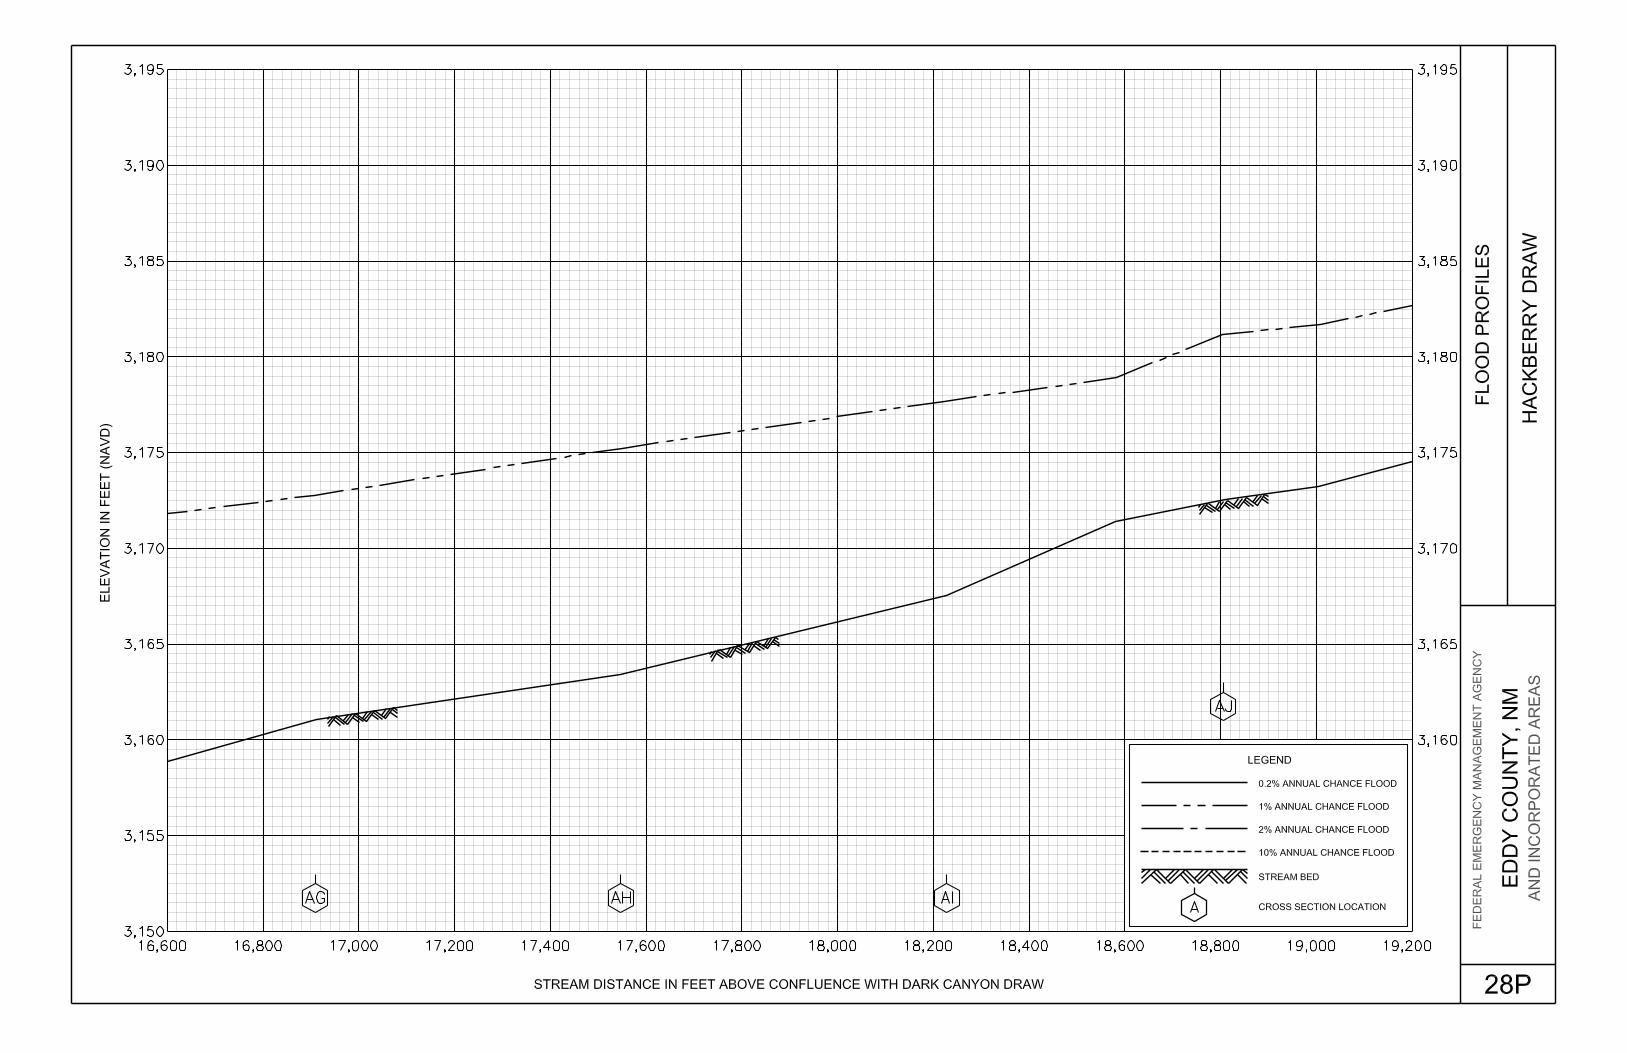
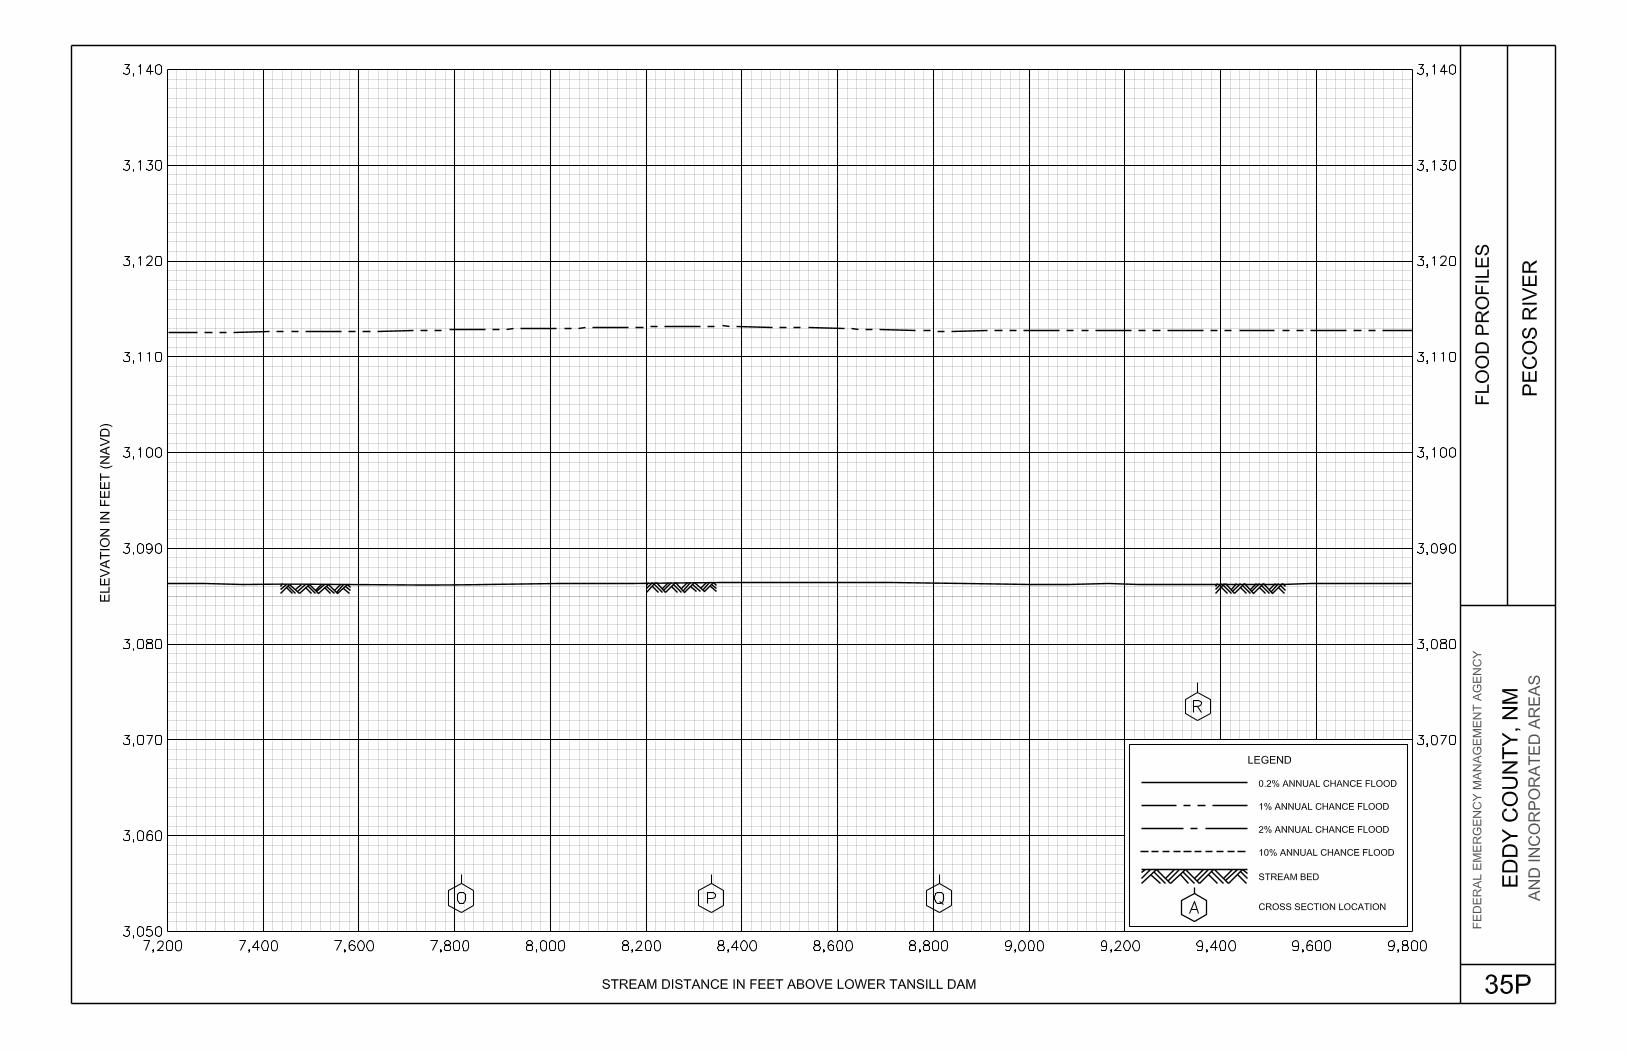
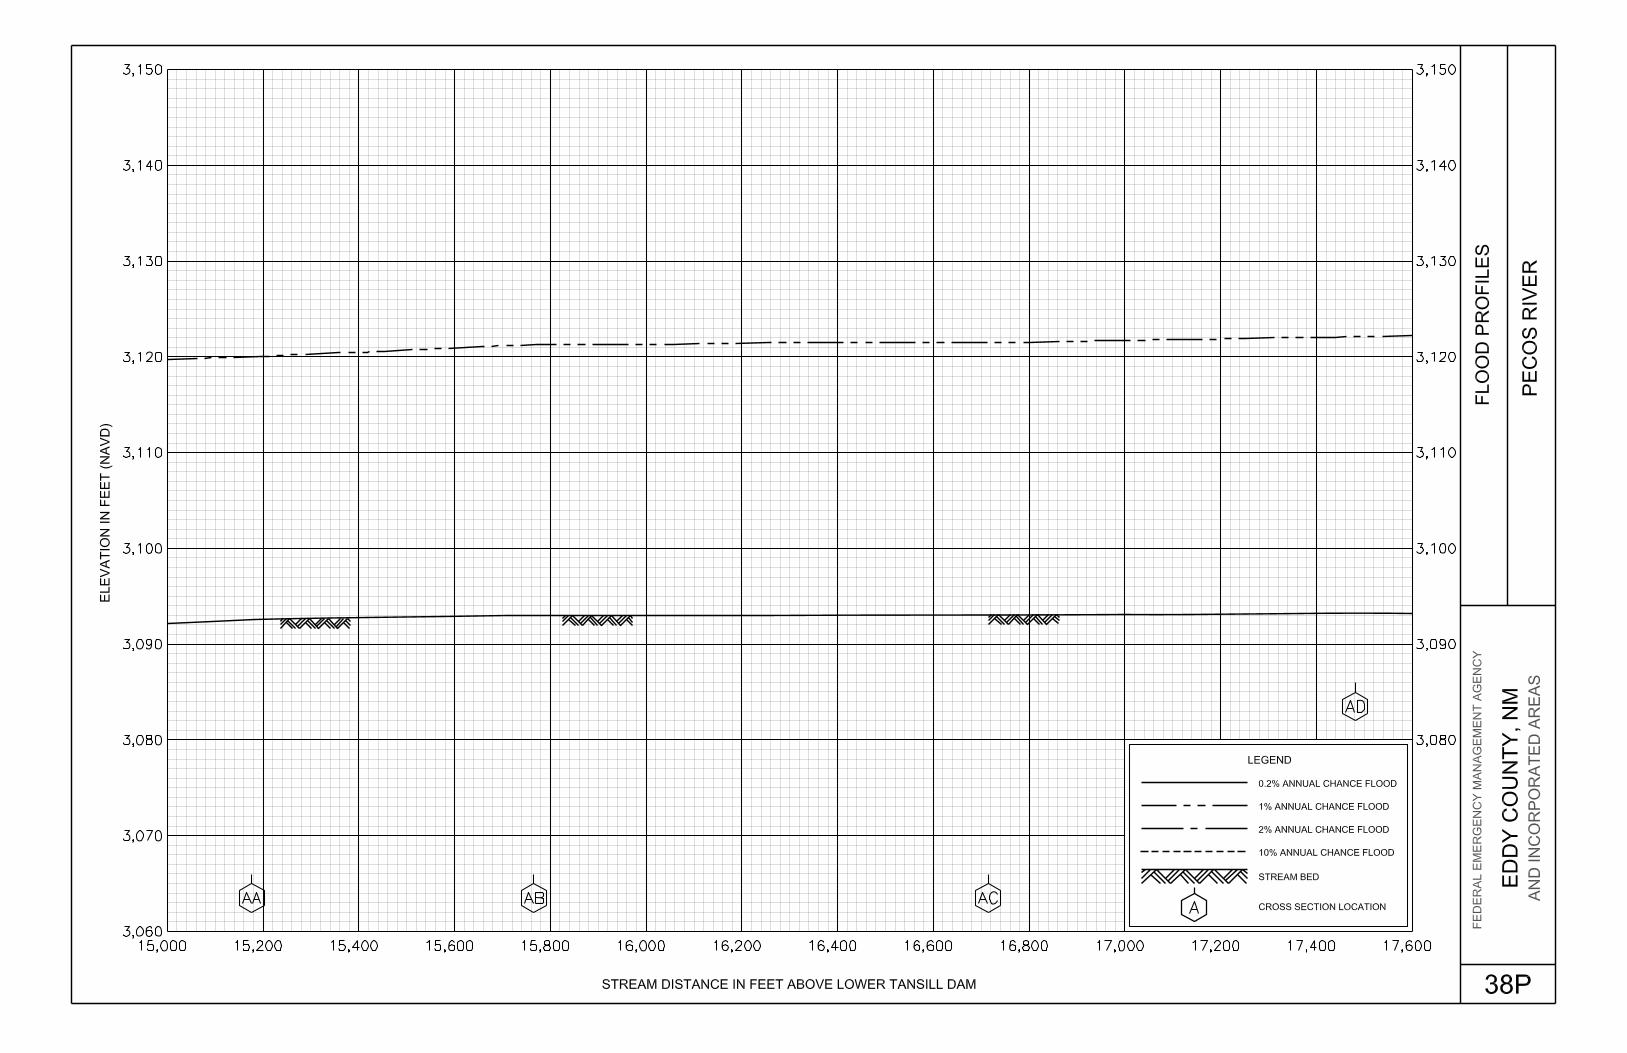
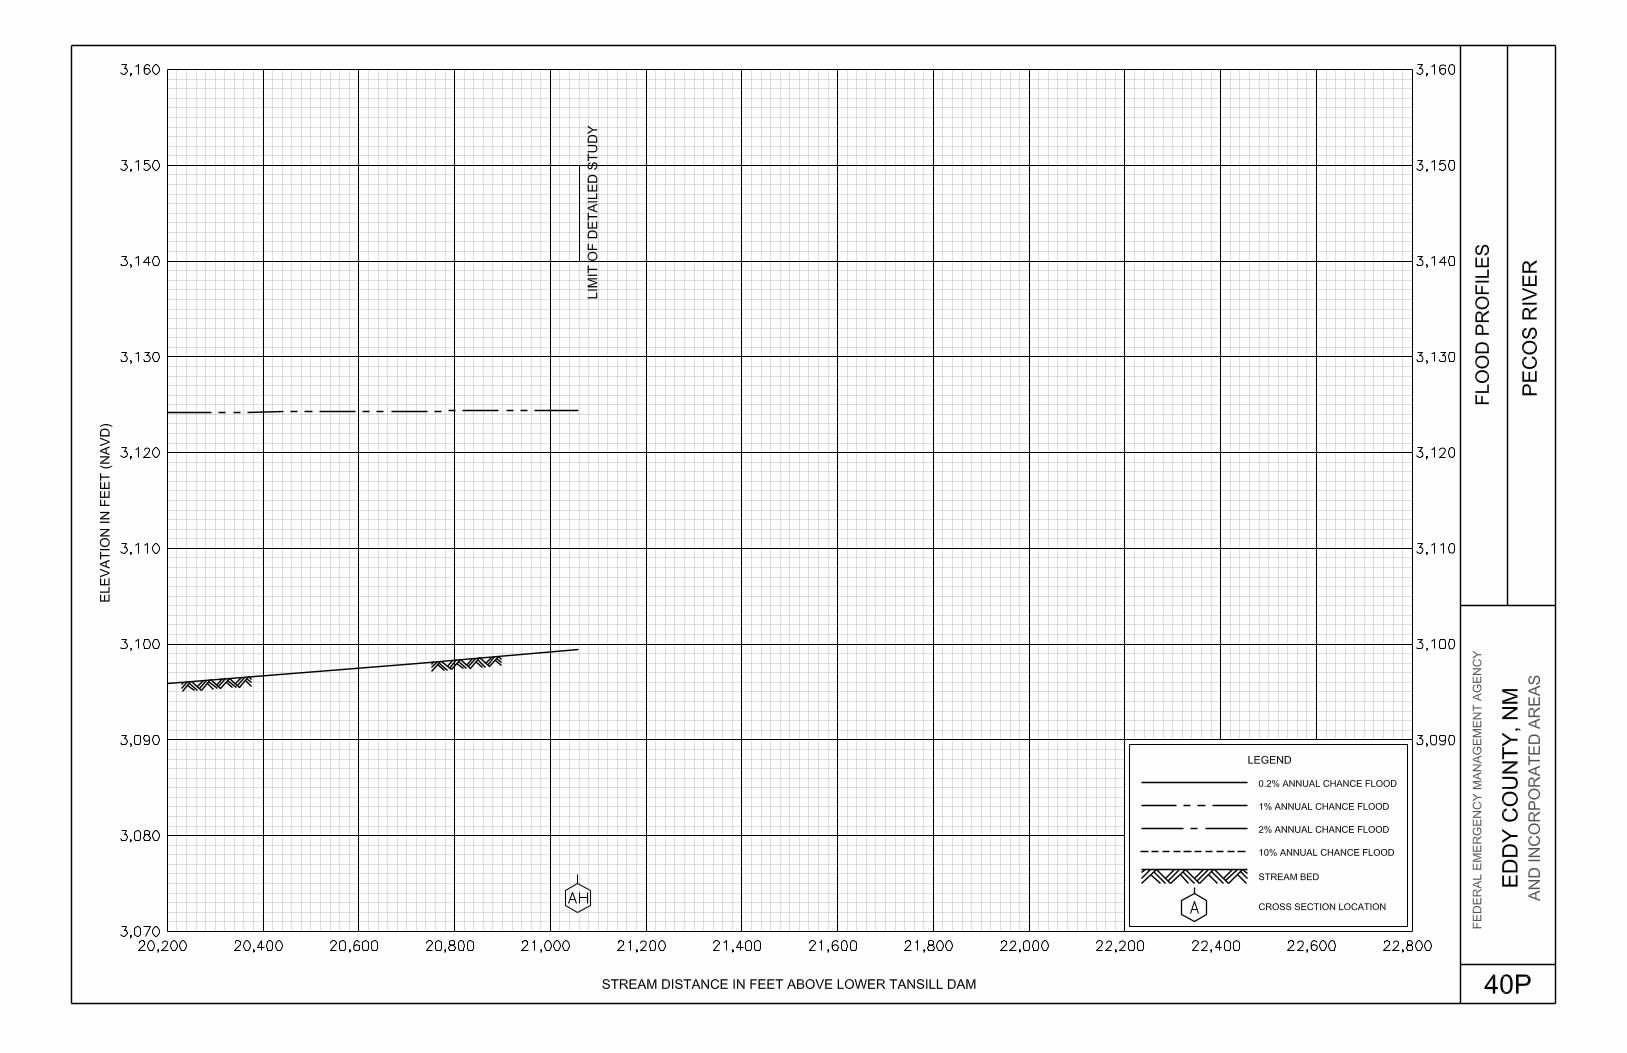
Exhibit 1 - Flood Profiles Dark Canyon Draw Panels 01P-14PEagle Creek Panels 15P-21P Hackberry Draw Panels 22P-31P Pecos River Panels 32P-40P
Exhibit 2 - Flood Insurance Rate Map (published separately)

1
FLOOD INSURANCE STUDY EDDY COUNTY, NEW MEXICO, AND INCORPORATED AREAS
1.0 INTRODUCTION
1.1 Purpose of Study
This Flood Insurance Study (FIS) revises and updates information on the existence and severity of flood hazards in the geographic area of Eddy County, including the Cities of Artesia and Carlsbad; the Villages of Hope and Loving; and the unincorporated areas of Eddy County (referred to collectively herein as Eddy County), and aids in the administration of the National Flood Insurance Act of 1968 and the Flood Disaster Protection Act of 1973. This study has developed flood-risk data for various areas of the community that will be used to establish actuarial flood insurance rates and to assist the community in its efforts to promote sound floodplain management. Minimum floodplain management requirements for participation in the National Flood Insurance Program (NFIP) are set forth in the Code of Federal Regulations at 44 CFR, 60.3. Please note that the Village of Hope is non-floodprone.
The Village of Loving does not participate in the NFIP. In some states or communities, floodplain management criteria or regulations may exist that are more restrictive or comprehensive than the minimum Federal requirements. In such cases, the more restrictive criteria take precedence and the State (or other jurisdictional agency) will be able to explain them.
1.2 Authority and Acknowledgments The sources of authority for this FIS are the National Flood Insurance Act of 1968 and the Flood Disaster Protection Act of 1973. Under Contract No. EMT-2002-CO-0048, Task Order HSTO043 for the Federal Emergency Management Agency (FEMA), Watershed VI Alliance combined communities within Eddy County, as well as the unincorporated areas, into a countywide FIS, as compiled from previously published FIS report narratives (References 1-3). The revised maps were completed in August 2008. Information on the authority and acknowledgments for each of the previously printed FISs and Flood Insurance Rate Maps (FIRMs) for communities within the county, compiled from their respective narratives, is listed below. City of Artesia The hydrologic and hydraulic analyses for the FIS dated March 9, 1999 were performed by Boyle Engineering Corporation, for FEMA, under Contract No. H-4602. This work was completed in June 1979. This study was revised to incorporate revised hydrologic and hydraulic analyses for North and South Eagle Creeks, the 26th Street Channel, Flood Diversion Channel 1, and shallow flooding along Washington Avenue, performed by Smith Engineering Company. This work was completed in February 1997.

2
City of Carlsbad The hydrologic and hydraulic analyses for the FIS dated April 3, 1996 were performed by U.S. Army Corps of Engineers (USACE), Albuquerque District, for FEMA, under Interagency Agreement Nos. H-2-73, H-19-74, and H-16-75, Project Order No. 4, 16, and 18, respectively. This work, which was completed in September 1975, covered all significant flooding sources affecting the City of Carlsbad. This FIS was revised on April 3, 1996, as a result of an investigation into the existence and severity of flood hazards in the City of Carlsbad, Eddy County, New Mexico. The hydrologic and hydraulic analyses for this revision were prepared by the USACE, Albuquerque District, the study contractor, for FEMA. The work was completed in November 1992, under Contract No. EMW-91-E-3525. Eddy County Unincorporated Areas The hydrologic and hydraulic analyses for FIS dated June 4, 1996 were prepared by the U.S. Geological Survey (USGS) for FEMA, under Interagency Agreement No. EMW-86-E-2224, Project Order No. 4. This work was completed in June 1988. This FIS was revised on June 4, 1996, as the result of an investigation into the existence and severity of flood hazards in Eddy County, New Mexico. The hydrologic and hydraulic analyses for this revision were prepared by the USACE, Albuquerque District, the study contractor for FEMA. The work was completed in November 1992, under contract No. EMW-91-E-3525. The hydrologic and hydraulic analyses of Hackberry Draw, including the sheetflow analysis east of the Southern Canal and the floodway analysis along the Pecos River, were revised by Michael Baker Jr., Inc. (MBJ), the Technical Evaluation Contractor for FEMA.
1.3 Coordination The initial Consultation Coordination Officer (CCO) meeting was held in May 2007 and attended by representatives of FEMA, the Cities of Artesia and Carlsbad, Eddy County, and the study contractor. The results of the study were reviewed at the final CCO meeting held on February 4, 2009 and attended by representatives of Eddy County, the Cities of Artesia and Carlsbad, the Village of Hope, and the study contractor. All problems raised in that meeting have been addressed in this study. The history of the FISs coordination activities for the individual communities before this countywide study are presented below. City of Artesia The original FIS for the City of Artesia was coordinated with the City of Artesia Mayor’s office, FEMA, the New Mexico State Highway Department, the Natural Resource Conservation Service (NRCS) (formerly the Soil Conservation Service (SCS)), the U.S. Bureau of Reclamation (USBR), the USGS, the USACE, and T.E. Scanlon and Associates. A meeting was held on August 2, 1977, and attended by members of the City of Artesia; FEMA; and the study contractor, Boyle Engineering Corporation. The purpose of the meeting was to identify streams to be studied by detailed methods.

3
Representatives of Boyle Engineering Corporation met with the NRCS on August 8, 1978. The NRCS provided Boyle Engineering Corporation with back-up information for the Eagle-Tumbleweed Draw Watershed Work Plan. The NRCS was not able to provide information on the flow-split analysis for Eagle Draw west of the City of Artesia. Boyle Engineering Corporation contacted Mr. Richard Thomas of the USGS on August 14, 1978, to request that he send records of 39 stream-gaging stations to be used in the hydrologic analyses for the City of Artesia. The requested records were sent on August 22, 1978. A meeting was held at Boyle Engineering Corporation on November 14, 1978. In attendance were representatives of Boyle Engineering Corporation and FEMA. The flow-split on Eagle Draw east of the City of Artesia was discussed and it was decided that the analysis would be based on available data assuming reasonable hydraulic conditions. A meeting was held on June 13, 1979, and attended by representatives of the City of Artesia, FEMA, Boyle Engineering Corporation, and T.E. Scanlon and Associates. The purpose of the meeting was to present preliminary study results. The results of the original study were reviewed at a meeting held on February 21, 1980, and attended by representative of the City of Artesia, FEMA, and Boyle Engineering Corporation. The study was accepted by the City of Artesia. City of Carlsbad The City Engineer was contacted concerning the availability of maps. The purpose and objectives of the NFIP were explained in a public meeting with Carlsbad officials on August 11, 1972. A public meeting was conducted on September 8, 1975, to explain the preliminary floodplains and floodways and to answer questions. City officials had been furnished copies of the draft report prior to this meeting. The floodway presented for the Pecos River was unacceptable to local officials, and they requested further study of the floodway to exclude the highly developed business area. A final coordination meeting was held at Carlsbad on January 13, 1976. There were no objections to the final report. Eddy County Unincorporated Areas On December 13, 1986, an initial CCO meeting was held with representatives of FEMA, the USGS (the study contractor) and Eddy County to determine the streams to be studied by detailed methods. On March 15, 1990, a final CCO meeting was held with representative of FEMA, the study contractor, and Eddy County to review the results of the study. Identification of the streams and corresponding reaches requiring detailed restudy was done during a CCO meeting held on June 29, 1990, and attended by officials from the City of Carlsbad and representatives of the FEMA Region VI office and the USACE, Albuquerque District. The results of the study were reviewed at a final CCO meeting held on August 10, 1994, and attended by representatives of Eddy County, FEMA, and the study contractor.
4
2.0 AREA STUDIED
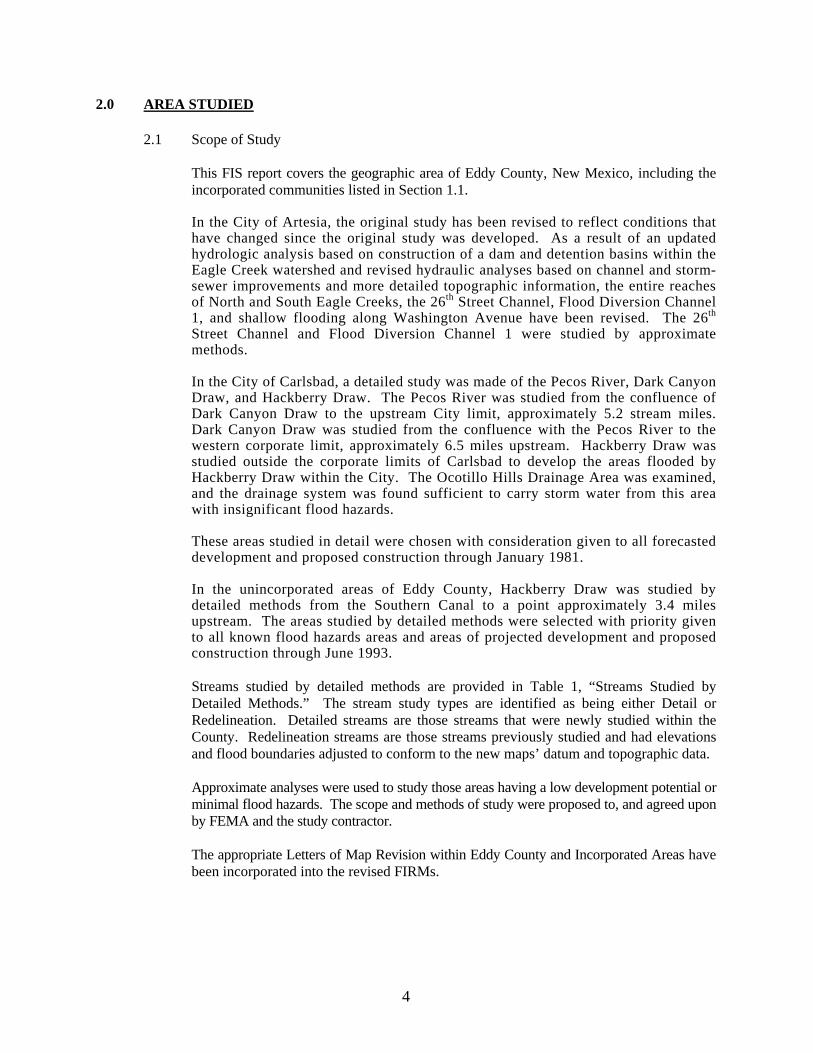
2.1 Scope of Study This FIS report covers the geographic area of Eddy County, New Mexico, including the incorporated communities listed in Section 1.1. In the City of Artesia, the original study has been revised to reflect conditions that have changed since the original study was developed. As a result of an updated hydrologic analysis based on construction of a dam and detention basins within the Eagle Creek watershed and revised hydraulic analyses based on channel and storm-sewer improvements and more detailed topographic information, the entire reaches of North and South Eagle Creeks, the 26th Street Channel, Flood Diversion Channel 1, and shallow flooding along Washington Avenue have been revised. The 26th Street Channel and Flood Diversion Channel 1 were studied by approximate methods. In the City of Carlsbad, a detailed study was made of the Pecos River, Dark Canyon Draw, and Hackberry Draw. The Pecos River was studied from the confluence of Dark Canyon Draw to the upstream City limit, approximately 5.2 stream miles. Dark Canyon Draw was studied from the confluence with the Pecos River to the western corporate limit, approximately 6.5 miles upstream. Hackberry Draw was studied outside the corporate limits of Carlsbad to develop the areas flooded by Hackberry Draw within the City. The Ocotillo Hills Drainage Area was examined, and the drainage system was found sufficient to carry storm water from this area with insignificant flood hazards. These areas studied in detail were chosen with consideration given to all forecasted development and proposed construction through January 1981. In the unincorporated areas of Eddy County, Hackberry Draw was studied by detailed methods from the Southern Canal to a point approximately 3.4 miles upstream. The areas studied by detailed methods were selected with priority given to all known flood hazards areas and areas of projected development and proposed construction through June 1993. Streams studied by detailed methods are provided in Table 1, “Streams Studied by Detailed Methods.” The stream study types are identified as being either Detail or Redelineation. Detailed streams are those streams that were newly studied within the County. Redelineation streams are those streams previously studied and had elevations and flood boundaries adjusted to conform to the new maps’ datum and topographic data. Approximate analyses were used to study those areas having a low development potential or minimal flood hazards. The scope and methods of study were proposed to, and agreed upon by FEMA and the study contractor. The appropriate Letters of Map Revision within Eddy County and Incorporated Areas have been incorporated into the revised FIRMs.

5
Table 1. Streams Studied by Detailed Methods Stream Study Type Reach Length
(miles) Study Area
Dark Canyon Draw Redelineation 6.82 From the confluence with the Pecos River to approximately 2.08 miles upstream of Corrales Drive
Eagle Creek Redelineation 3.08 From approximately 0.19 miles downstream of Navajo Road to S. 26th Street
Hackberry Draw Redelineation 5.10 From the confluence with Dark Canyon Draw to approximately 1.02 miles upstream of Jones Street
Pecos River Redelineation 4.00
From approximately 0.23 miles upstream of the confluence with Dark Canyon Draw to approximately 0.10 miles downstream of Callaway Drive
2.2 Community Description
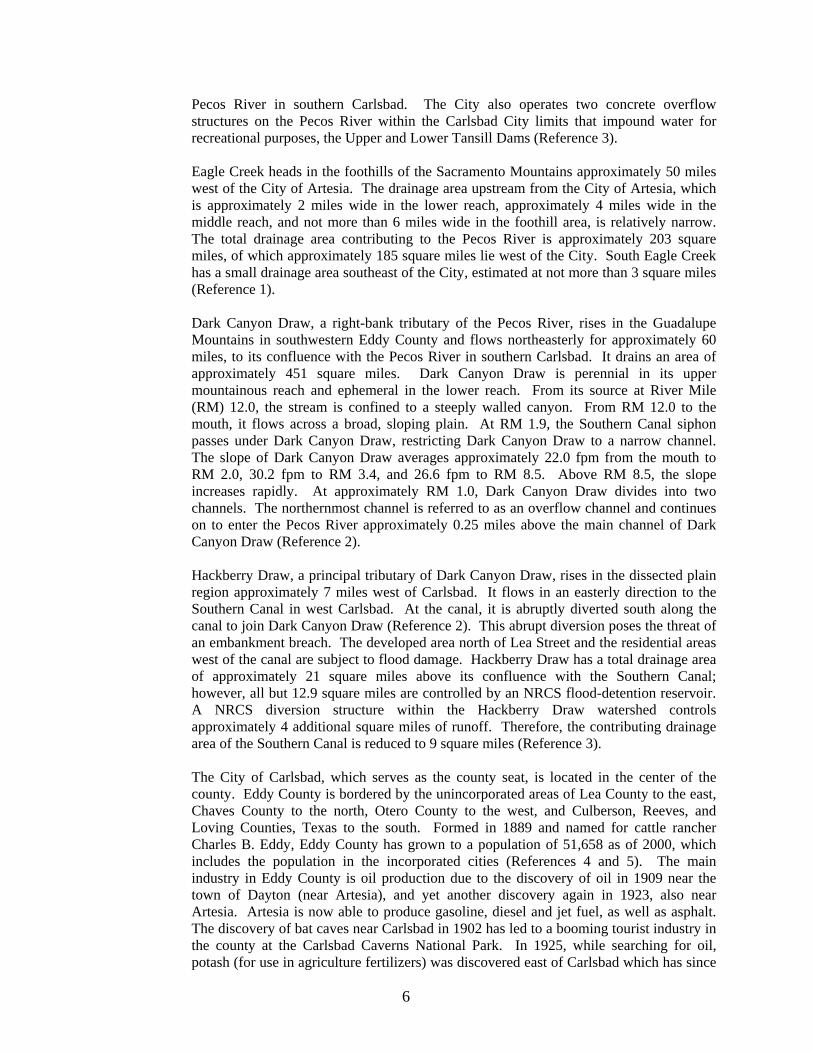
Eddy County is located in the southeast portion of New Mexico. It has a land area of approximately 4,198 square miles, with 16 square miles of water and 4,182 square miles of land (Reference 4). The major roads in the county are U.S. Highways 62-180, 82, and 285, and the major railroad is the Atchison, Topeka, and Santa Fe Railroad. Eddy County is part of the Pecos River basin, and the major streams flowing through the county are the Pecos River, which cuts a line north and south through the center of the county, Eagle Creek, which flows east through the northwest corner of the county, Hackberry Draw, which flows east through the central portion of the county, and Dark Canyon Draw, which flows northeast through the southern portion of the county. The Pecos River originates in the Sangre de Cristo Mountains in northern New Mexico. From its source, the river flows in a southeasterly direction for approximately 925 miles through eastern New Mexico and western Texas. At this point, it joins the Rio Grande at the International Boundary of the United States and Mexico, approximately 10 miles north of the Amistad Reservoir. The drainage area of the Pecos River, above Dark Canyon Draw in Carlsbad, amounts to approximately 18,099 square miles. Elevations range from approximately 13,000 feet in the headwater region to 3,100 feet at Carlsbad. The streambed slope of the Pecos River through Carlsbad averages approximately 5.8 feet per mile (fpm), and the channel width is approximately 450 feet (Reference 2). Floods on the Pecos River in the vicinity of Carlsbad are caused primarily by high discharges originating from the west bank tributaries that flow into the Pecos River below Brantley Dam. The largest of these tributaries are Dark Canyon Draw, with a watershed of 451 square miles measured at the site of the USGS stream gage 0.6 miles upstream from the mouth of the draw, and Rocky Arroyo, with a watershed of 285 square miles at the USGS stream gage 2.1 miles upstream from the mouth of the arroyo. Rocky Arroyo originates in the Guadalupe Mountains and flows in an easterly direction to its confluence with the Pecos River immediately downstream of Brantley Dam (Reference 3). Brantley Dam, a flood-control structure constructed by the U.S. Department of Reclamation, is located 13 miles upstream from Carlsbad on the Pecos River and began operation in August 1988. The uncontrolled intervening area between Brantley Dam and Carlsbad is 846 square miles. Brantley Dam has significantly reduced the 1-percent-annual-chance floodplain and floodway. The Southern Canal crosses Dark Canyon Draw at a siphon under the arroyo approximately 2 miles upstream of its confluence with the
6
Pecos River in southern Carlsbad. The City also operates two concrete overflow structures on the Pecos River within the Carlsbad City limits that impound water for recreational purposes, the Upper and Lower Tansill Dams (Reference 3). Eagle Creek heads in the foothills of the Sacramento Mountains approximately 50 miles west of the City of Artesia. The drainage area upstream from the City of Artesia, which is approximately 2 miles wide in the lower reach, approximately 4 miles wide in the middle reach, and not more than 6 miles wide in the foothill area, is relatively narrow. The total drainage area contributing to the Pecos River is approximately 203 square miles, of which approximately 185 square miles lie west of the City. South Eagle Creek has a small drainage area southeast of the City, estimated at not more than 3 square miles (Reference 1). Dark Canyon Draw, a right-bank tributary of the Pecos River, rises in the Guadalupe Mountains in southwestern Eddy County and flows northeasterly for approximately 60 miles, to its confluence with the Pecos River in southern Carlsbad. It drains an area of approximately 451 square miles. Dark Canyon Draw is perennial in its upper mountainous reach and ephemeral in the lower reach. From its source at River Mile (RM) 12.0, the stream is confined to a steeply walled canyon. From RM 12.0 to the mouth, it flows across a broad, sloping plain. At RM 1.9, the Southern Canal siphon passes under Dark Canyon Draw, restricting Dark Canyon Draw to a narrow channel. The slope of Dark Canyon Draw averages approximately 22.0 fpm from the mouth to RM 2.0, 30.2 fpm to RM 3.4, and 26.6 fpm to RM 8.5. Above RM 8.5, the slope increases rapidly. At approximately RM 1.0, Dark Canyon Draw divides into two channels. The northernmost channel is referred to as an overflow channel and continues on to enter the Pecos River approximately 0.25 miles above the main channel of Dark Canyon Draw (Reference 2). Hackberry Draw, a principal tributary of Dark Canyon Draw, rises in the dissected plain region approximately 7 miles west of Carlsbad. It flows in an easterly direction to the Southern Canal in west Carlsbad. At the canal, it is abruptly diverted south along the canal to join Dark Canyon Draw (Reference 2). This abrupt diversion poses the threat of an embankment breach. The developed area north of Lea Street and the residential areas west of the canal are subject to flood damage. Hackberry Draw has a total drainage area of approximately 21 square miles above its confluence with the Southern Canal; however, all but 12.9 square miles are controlled by an NRCS flood-detention reservoir. A NRCS diversion structure within the Hackberry Draw watershed controls approximately 4 additional square miles of runoff. Therefore, the contributing drainage area of the Southern Canal is reduced to 9 square miles (Reference 3). The City of Carlsbad, which serves as the county seat, is located in the center of the county. Eddy County is bordered by the unincorporated areas of Lea County to the east, Chaves County to the north, Otero County to the west, and Culberson, Reeves, and Loving Counties, Texas to the south. Formed in 1889 and named for cattle rancher Charles B. Eddy, Eddy County has grown to a population of 51,658 as of 2000, which includes the population in the incorporated cities (References 4 and 5). The main industry in Eddy County is oil production due to the discovery of oil in 1909 near the town of Dayton (near Artesia), and yet another discovery again in 1923, also near Artesia. Artesia is now able to produce gasoline, diesel and jet fuel, as well as asphalt. The discovery of bat caves near Carlsbad in 1902 has led to a booming tourist industry in the county at the Carlsbad Caverns National Park. In 1925, while searching for oil, potash (for use in agriculture fertilizers) was discovered east of Carlsbad which has since
7
turned into a large potash mining industry, supplying much of the United States (Reference 5). Eddy County is characterized by flat topography, with primarily sandy loam soil with a few small areas of clay loam soil. The vegetation cover in the area includes a partial layer of ocotillo, creosote bush, chamise, yucca, and some mesquite. Grasses have been identified by the NRCS as consisting of blue, black, sideoats, and hairy grama, in addition to tobosa and three awn (Reference 3). The climate in Eddy County is semi-arid with characteristic seasonal temperature changes and large annual and diurnal temperature ranges typical of a continental location. The average annual temperature is about 63º F, with ranges of 28º F in January to 96º F in July; average annual precipitation of the region is 14 inches, and snowfall is about 5 inches (Reference 6). The moderate relative humidity and the usual clear skies favor radiational cooling after sundown, so that most summer nights are comfortably cool. Two-thirds of the yearly precipitation normally falls from May through September, most of it brought by brief afternoon and evening thundershowers, which tend to alleviate the summer heat; these storms are caused by unstable air masses from the Gulf of Mexico. Occasionally, the more severe thundershowers are accompanied by hail and brief, strong winds. Small tornadoes have been observed in the area, but damage from them is usually light (Reference 3). Winds are generally light, averaging less than 10 miles per hour for the year. Spring months are somewhat windier. At the same time, the average hourly velocity is approximately 12 miles per hour. Wind velocities exceeding 24 miles per hour can be expected only 3 percent of the time. The growing season extends for 206 days – from the average date of the last spring freeze on April 7 to the first freezing temperature in the fall around October 30 (Reference 3). City of Artesia The City of Artesia is located in the north-central part of Eddy County, in the middle of the Pecos River basin. The present name of Artesia was assumed in 1903 after the discovery of an artesian aquifer in the area, and the city was officially incorporated in 1905 (Reference 7). After the artesian wells dwindled in the 1920’s, the city’s industry became based on agriculture and oil. Today, Artesia thrives on oil and gas, farming, ranching, dairies, small businesses, and the Federal Law Enforcement Training Center (Reference 7). The population of Artesia is 10,692 and the total land area is 8 square miles (Reference 4). City of Carlsbad Carlsbad, the county seat of Eddy County, is located on the banks of the Pecos River in the central portion of the county. It was organized in 1893 as the Town of Eddy to serve as a trading center for the surrounding ranching area and the newly developed irrigation farming section. The name was changed to Carlsbad in 1899, and the City was incorporated in 1918 (Reference 2). Mining and refining of potash is the major industry in the Carlsbad area. This industry ranks second to oil in mineral production for the State of New Mexico. Oil and gas fields are also found nearby. Agriculture is an important industry in the Carlsbad area, with irrigated farmland producing cotton, alfalfa, and sorghum. Carlsbad Caverns National Park is approximately 28 miles southwest of the City (Reference 2).
8
Extensive commercial, industrial, and residential developments, as well as public utilities, encroach on the floodplain, including practically the entire downtown business area of Carlsbad. Transportation facilities that cross the floodplains include portions of U.S. Highways 62-180 and 285, and the Atchison, Topeka, and Santa Fe Railroad (Reference 2). Carlsbad is also home to the U.S. Department of Energy’s Waste Isolation Pilot Plant. The population of Carlsbad is 25,410 and the total land area is 28 square miles (Reference 4). Other Incorporated and Unincorporated Areas of Eddy County The Village of Hope, located in the northwest corner of Eddy County west of the City of Artesia, has a population of 107 and a total land area of approximately 1 square mile (Reference 4). The Village of Loving, located in the southeastern portion of the county near the City of Carlsbad, has a population of 1,326 and a total land area of approximately 1 square mile (Reference 4). The athletic program at Loving High School has a very successful history, with ten state softball titles, three football titles, one basketball title, four baseball titles, and three track titles (Reference 8).
2.3 Principal Flood Problems City of Artesia Flooding is caused by large flows in Eagle Creek, normally a dry arroyo. In the past, the 185-square-mile watershed of Eagle Creek would produce major flooding problems in the City of Artesia. During these historic floods, a flow split could occur 3 miles west of the City, causing widespread shallow flooding along South Eagle Creek, which borders the southern edge of the City. Second, near the western edge of the City, Eagle Creek can overflow and cause shallow flooding along Washington Avenue. Flooding problems were aggravated by road and railroad crossings that constricted flow. In the early 1990’s, the NRCS constructed the Eagle-Tumbleweed Draw Dam and a number of flood control channels to supplement the City’s drainage system. The combined flood control system eliminated the two splits discussed above. It also reduced the uncontrolled watershed producing peak flows in Eagle Creek from a total drainage area of 194 square miles (at the eastern City limits) to 12 square miles. The reduction in the drainage area resulted in a reduction in peak flow and extent of the floodplain. Therefore, the principal flooding that remains in the City of Artesia is a result of local drainage problems only. The history of flooding in the City of Artesia is composed principally of vivid memories and little analytical data. Major floods occurred in the City of Artesia area from September 26 through 30, 1904; July 20 through 26, 1905; July 24, 1911; April 28 through May 1, 1914; July 19 through 28, 1915; August 6 through 9, 1916; September 14 through 17, 1919; May 22 through June 4, 1937; May 20 through 27, 1941; September 20 through 24 and 27 through 30, 1941; and August 29 through September 2, 1942 (Reference 1). Press clippings record floods on Eagle Creek on October 7, 1954; June 16, 1964; July 29, 1965; July 24, 1966; August 24, 1966; May 26, 1969; March 26, 1972; September 10, 1972; and September 29, 1974 (Reference 9). The peak flow rate of the 1911 flood on Eagle Creek has been estimated at 26,000 cubic feet per second (cfs) (Reference 10). This corresponds to between a 1- and 0.2-percent-annual-chance flow rate.

9
Based on available records, the 1954 and 1964 floods would have 2.5- and 3.33-percent-annual-chance recurrence intervals, respectively (Reference 11). The 1954 flood was caused by a general-type storm covering most of the watershed, while the 1964 flood was caused by a high-density thunderstorm covering approximately 50 square miles of the Eagle Draw Watershed located just west of the City of Artesia. The storm also covered 30 square miles of the Cottonwood-Walnut Creek Watershed just northwest of the City of Artesia (Reference 1). City of Carlsbad Analyses of rainfall records show that large-magnitude storms occur generally during the period of April through October. General precipitation may produce large volumes of runoff and high-peak discharges. Thunderstorms may cause local floods with comparatively small volumes and high-peak discharges. Floods on Dark Canyon Draw and tributaries are characterized by an extremely high ratio of peak discharges to total flood volume. Due to the high velocities produced by the steep slope and narrow channel of Dark Canyon Draw, major floods descend in waves or walls of water. Historical records refer to at least five major floods on the Pecos River at Carlsbad prior to 1904. Accounts beginning in 1865 indicate that major floods occurred in 1871, 1874, 1886, 1893, and 1900. The flood of August 1893 was particularly severe in the vicinity of Carlsbad, perhaps the worst in 50 years. Several bridges were damaged or destroyed during the 1893 flood. Floodwater was 1-foot deep at Greene and Canyon Streets. Since 1904, six floods have occurred on the Pecos River that exceeded the channel capacity through Carlsbad. These floods occurred in 1904, 1905, 1915, 1916, 1941, and 1966. During the flood of August 7, 1916, the Pecos River attained an estimated peak discharge of 85,700 cfs, the largest discharge ever recorded at Carlsbad. Information obtained from historical records and interviews with local residents indicates that at least nine floods with peak discharges exceeding channel capacity have occurred on Dark Canyon Draw since 1906. These floods occurred in 1906, 1908, 1911, 1915, 1916, 1919, 1925 and May and September 1941. The September 1941 flood was estimated at 100,000 cfs, the worst the older residents remembered. The May 1941 flood is reported to have moved in as a wave, or wall, of water, which swept lightly constructed buildings off their foundations. Twenty deaths were attributed to the May and September 1941 floods. There are no recorded flooding events on Dark Canyon Draw since the September 1941 flood. Flood problems in the Dark Canyon Draw floodplains are caused by encroachment and the Southern Canal siphon. Commercial interests have encroached on the floodplains, even though the City and county acquired title to part of the floodplain to discourage occupation of the area. The Southern Canal siphon, which crosses under Dark Canyon Draw approximately 2 miles above its mouth, is too short to provide sufficient waterway for Dark Canyon Draw floodflows and, as a result, floodwaters are temporarily impounded by the Southern Canal embankment. In addition, there is usually flow in Hackberry Draw coincident with floods on Dark Canyon Draw, which increases the impoundage. During past floods, water impounded by the Southern Canal embankment has entered the developed area north of Lea Street (Reference 2). Eddy County Unincorporated Areas Concern over stream flooding in Eddy County centers on the portion of Hackberry Draw west of the corporate limits of Carlsbad. This concern stems from the current and planned development along Hackberry Draw (Reference 3).

10
2.4 Flood Protection Measures City of Artesia In addition to the Eagle-Tumbleweed Draw Dam, other flood protection measures built after the original FIS include the Eagle Draw Floodwater Retarding Structure, Channel 200, Flood Diversion Channels 1 and 2, the Southeast Artesia Detention Basin, the 26th Street Channel, and the Bullock Avenue Storm Drain (Reference 1). City of Carlsbad There are several existing improvements on the Pecos River and its tributaries. The Los Esteros Lake and Modification of Alamogordo (now Sumner) Dam Projects, as recommended by the USACE to Congress, are multi-purpose projects including flood control, sediment retention, irrigation, and the conversion of the existing Sumner Dam and Lake to flood control (Reference 12). Sumner Dam was modified by the USBR in 1956, and Santa Rosa Lake and Dam (formerly Los Esteros Lake and Dam) was completed in 1981. The combined project provides complete control of all floods up to 125,000 cfs (1-percent-annual-chance flood), while a high degree of control is provided for the area between the dams (References 2 and 13). Santa Rosa Lake is approximately 7 miles above Santa Rosa, New Mexico. It is used for flood control (167,000 acre-feet), sediment control (80,000 acre-feet), and irrigation storage (200,000 acre-feet), which includes a transfer of irrigation storage from Sumner Lake (Reference 13). Sumner Lake, 15 miles northwest of Fort Sumner, New Mexico, provides 48,000 acre-feet for flood control, 20,000 acre-feet for irrigation, and 64,000 acre-feet for sediment reserve. As of 1996, Sumner Lake reduces an inflow of 125,000 cfs (0.4-percent-annual-chance storm) to an outflow of 51,300 cfs (0.5-percent-annual-chance storm) (References 2 and 13). The comparatively large natural channel of the Pecos River through Carlsbad is restricted by the Upper and Lower Tansill Dams; however, these dams do not have any significant effects on flooding in Carlsbad. The Upper Tansill Dam is a concrete overflow structure, approximately 25 feet high and 500 feet long, flanked by a low-earth dike on the right bank. The Lower Tansill Dam is above the mouth of Dark Canyon Draw and below the mouth of the Dark Canyon Draw overflow channel. It is a concrete gravity overflow dam, which is 14 feet high and 430 feet long (Reference 2). The NRCS has constructed three floodwater-retarding structures, four diversions, and an outlet channel on the Hackberry Dam Watershed (Reference 14). The detention capacity of the three structures is equal to the runoff from a 6-hour, 2-percent-annual-chance storm. The USBR built the Brantley Dam and Reservoir on the Pecos River approximately 20 miles upstream from Carlsbad. The project was authorized in October 1972 and was completed in August 1988. The dam and reservoir is designed to provide storage space for irrigation water and flood control. It is designed to regulate a maximum inflow of 187,000 cfs (0.5-percent-annual-chance storm) and a maximum discharge of 50,000 cfs (5-percent-annual-chance storm), the estimated channel capacity of the Pecos River in the reach between the dam and the mouth of Dark Canyon. Brantley Dam and Reservoir is not intended to provide total protection for Carlsbad, but rather reduces the frequency of flooding along the Pecos River (Reference 15).
11
After the flood of May 1941 of Dark Canyon Draw, the county obtained and subdivided a tract of land outside the channel area and offered lots in this new subdivision in exchange for lots in the flooded area. In this manner, a large part of the floodplain was evacuated and the land passed into public control (Reference 2). Eddy County Unincorporated Areas The NRCS has constructed a flood detention reservoir in the headwaters of Hackberry Draw to control the runoff from approximately six square miles. Levees have also been constructed to divert and control the direction of surface runoff in portions of the Hackberry Draw Watershed (Reference 3). However, these levees do not meet the standards of the NFIP 44 CFR Part 65.10, and therefore do not provide protection from the 1-percent-annual-chance flood.
3.0 ENGINEERING METHODS For the flooding sources studied by detailed methods in the community, standard hydrologic and hydraulic study methods were used to determine the flood-hazard data required for this study. Flood events of a magnitude that is expected to be equaled or exceeded once on the average during any 10-, 50-, 100-, or 500-year period (recurrence interval) have been selected as having special significance for floodplain management and for flood insurance rates. These events, commonly termed the 10-, 50-, 100-, and 500-year floods, have a 10-, 2-, 1-, and 0.2-percent chance, respectively, of being equaled or exceeded during any year. Although the recurrence interval represents the long-term, average period between floods of a specific magnitude, rare floods could occur at short intervals or even within the same year. The risk of experiencing a rare flood increases when periods greater than 1 year are considered. For example, the risk of having a flood that equals or exceeds the 1-percent-annual-chance flood in any 50-year period is approximately 40 percent (4 in 10); for any 90-year period, the risk increases to approximately 60 percent (6 in 10). The analyses reported herein reflect flooding potentials based on conditions existing in the community at the time of completion of this study. Maps and flood elevations will be amended periodically to reflect future changes. 3.1 Hydrologic Analyses
Hydrologic analyses were carried out to establish peak discharge-frequency relationships for each flooding source studied by detailed methods affecting the community. Peak discharges for streams in the City of Artesia were computed using NRCS Technical Release No. 20, “Computer Program, Project Formulation, Hydrology” and the USACE HEC-1 computer program (References 16 and 17). The updated hydrologic analyses are contained in the report entitled “LOMR, City of Artesia, New Mexico, and Vicinity” (Reference 18). In the City of Carlsbad, the magnitudes of floods on Dark Canyon Draw and Hackberry Draw were computed using a regional frequency analysis to develop basic discharge-frequency relationships (Reference 19). Mean and standard deviation and skew coefficients were computed by methods outlined in Water Resources Council Bulletin No. 15 for 11 regional stations (Reference 20). A graphical correlation indicated that the mean and standard deviations of the annual peak discharges of hydrologically homogenous basins correlated reasonably well with the drainage areas. Using these graphical correlation-plotting positions, peak discharges were computed and plotted on semi-log probability paper. A smooth curve was then fit to the points to represent the discharge-frequency relationships used in this study.

12
Flood-frequency discharge values for the portion of Hackberry Draw downstream of the NRCS flood-detention reservoir were taken from the previously effective Flood Insurance Study for the unincorporated areas of Eddy County, New Mexico (Reference 21). The values were estimated using the Region 4 equations of USGS Water Resources Investigations Report (WRIR) 86-4104 and a contributing drainage area of 12.9 square miles (Reference 22). Although Hackberry Draw is located within Region 3, the equation for Region 4 was used because of the similarity in topography and drainage-area size between Hackberry Draw and gaging stations within Region 4. Based on information provided in USGS WRIR 84-4358, runoff above the reservoir was assumed not to contribute to the peak 1-percent-annual-chance discharge below the reservoir (Reference 23). This assumption was made based on the fact that runoff above the dam would be almost totally contained within the reservoir; any portion of the runoff that overflowed the reservoir would arrive after the 1-percent-annual-chance peak had passed through the portion of the basin being studied. Levees within the basin were assumed to have no effect on the peak discharge in the lower portion of the basin and thus were not considered in this analysis. At the request of the City of Carlsbad and Eddy County, the peak discharges for Hackberry Draw were reevaluated to account for the recently constructed NRCS diversion structure that diverts approximately 4 square miles of runoff from the Hackberry Draw watershed downstream of the Hackberry Draw Dam to the McKittrick Draw watershed. The discharges were recomputed by MBJ using the USGS regression equation and a contributing drainage area of 9 square miles. For the Dark Canyon Draw restudy, the 1-percent-annual-chance discharge was obtained by using the South Central New Mexico (SCNM) regional analysis (1990) (Reference 24). The database of stream gages used to develop the SCNM regional equations included gages located within the Pecos River in the vicinity of Carlsbad; therefore, the SCNM equations were considered applicable to the area under study. The SCNM equation for the 1-percent-annual-chance flood peak is as follows: Log Q100 = 0.72*Log(DA) – 0.22*Log(S) + 2.69*Log(BR) + 2.05
DA = Drainage area in square miles S = Basin slope in feet per mile BR = 6-hour, 2-percent-annual-chance rainfall at basin centroid in inches For the Pecos River, peak discharges for floods were based on data previously developed by the USACE for preproject conditions of the Brantley Dam and Reservoir in the 1964 report entitled “Flood Control, Brantley Dam and Reservoir, Pecos River, New Mexico” (Reference 25). For the Pecos River restudy, the HEC-1 hydrologic model was used (Reference 17). The model was calibrated using the SCNM equation. Peak discharge-drainage area relationships for the streams studied by detailed methods are shown in Table 2, “Summary of Discharges.”
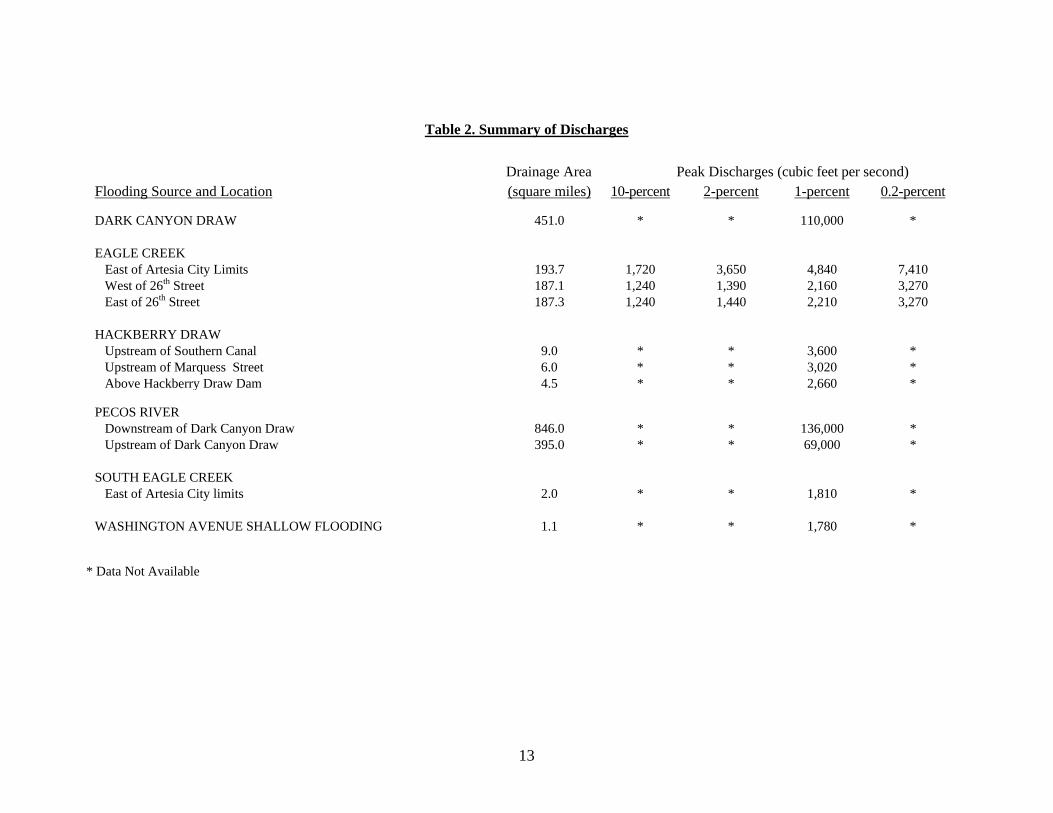
Table 2. Summary of Discharges
Drainage Area Peak Discharges (cubic feet per second)Flooding Source and Location (square miles) 10-percent 2-percent 1-percent 0.2-percent
DARK CANYON DRAW 451.0 * * 110,000 * EAGLE CREEK East of Artesia City Limits 193.7 1,720 3,650 4,840 7,410 West of 26th Street 187.1 1,240 1,390 2,160 3,270 East of 26th Street 187.3 1,240 1,440 2,210 3,270 HACKBERRY DRAW Upstream of Southern Canal 9.0 * * 3,600 * Upstream of Marquess Street 6.0 * * 3,020 * Above Hackberry Draw Dam 4.5 * * 2,660 * PECOS RIVER Downstream of Dark Canyon Draw 846.0 * * 136,000 * Upstream of Dark Canyon Draw 395.0 * * 69,000 * SOUTH EAGLE CREEK East of Artesia City limits 2.0 * * 1,810 * WASHINGTON AVENUE SHALLOW FLOODING 1.1 * * 1,780 *
* Data Not Available
13
14
3.2 Hydraulic Analyses
Analyses of the hydraulic characteristics of flooding from the sources studied were carried out to provide estimates of the elevations of floods of the selected recurrence intervals. Users should be aware that flood elevations shown on the FIRM represent rounded whole-foot elevations and may not exactly reflect the elevations shown on the Flood Profiles or in the Floodway Data tables in the FIS report. Flood elevations shown on the FIRM are primarily intended for flood insurance rating purposes. For construction and/or floodplain management purposes, users are cautioned to use the flood elevation data presented in this FIS in conjunction with the data shown on the FIRM. In the City of Artesia, water-surface elevations were computed for Eagle Creek using the USACE HEC-2 computer program (Reference 26). The updated hydraulic analyses are contained in the report entitled “LOMR, City of Artesia, New Mexico, and Vicinity” (Reference 18). Flood profiles were drawn showing computed water-surface elevations and locations of selected cross sections for North Eagle Creek (Exhibit 1). Starting water-surface elevations were based on the slope-area method. North Eagle Creek flows in an improved trapezoidal channel from 26th Street downstream to the easterly Artesia City limits. During the passage of the 1- and 0.2-percent-annual-chance floods, the channel capacity is exceeded at certain locations between Main Street and the eastern City limits. In the past, flow from North Eagle Creek would spill into Washington Avenue. As a result of the construction of flood control structures, Washington and Bullock Avenues experience some shallow flooding from local drainage only. Cross sections for the hydraulic analyses were taken from 1-foot-contour-interval maps provided by John D. Jaquess & Associates (Reference 27). Digitized cross sections from the previous FIS for the City of Carlsbad, dated June 1977, were utilized when they represented current geometric conditions (Reference 28). New field surveys were made to augment reaches where it was felt conditions had changed or previous data was not available. In the City of Carlsbad, water-surface elevations, reaches, and flooded areas were determined by using the USACE HEC-2 step-backwater computer program with field surveys (Reference 29). Cross section representing channel and overbank conditions were obtained at locations of changing topography and at structures that affect water-surface elevations significantly. A rating curve for the Pecos River was established at RM 458.40, a relatively uniform reach. Two irrigation diversion dams are at RMs 459.29 and 460.28. A relatively large, left overbank area between RMs 460.95 and 461.70 is not an effective flow area and was considered basically a ponding area. On the Pecos River, split flow occurs around the railroad tracks between Church Street and Luckey Street. The railroad tracks sit higher than the surrounding terrain, causing 800 cfs to flow west of the tracks. This value is determined by flow distribution at the cross section just upstream of the split flow.
15
Above RM 1.0, the Dark Canyon Draw channel resembles a flat-bottomed U, with many channels interweaving across the entire width of the 1-percent-annual-chance floodplain. Dark Canyon Draw divides into a main channel and an overflow channel at approximately RM 1.0. Each continues separately to the Pecos River. The HEC-2 backwater and bridge routine was used to run a series of flows for backwater rating curves on each channel (Reference 29). The resulting curves were then added to obtain a more true approximation of the actual water-surface elevation. In the vicinity of RM 1.0, where the channels have diverged, a common elevation was obtained and the study of Dark Canyon Draw continued upstream. Studies of the flood potential of Dark Canyon and Hackberry Draws indicate that large flows could breach the Southern Canal banks and flood the urban area east of the canal. During floods of 1-percent-annual-chance magnitude, water will overtop the canal banks at a few low points between Lea and Church Streets. The 0.2-percent-annual-chance flood will overtop and breach the canal embankment. It is impossible to determine the exact point or extent of a breach in the canal bank, but it is expected to be breached north of Lea Street. To arrive at an estimate of the flow range expected across the area below the breach, a canal breach elevation was established. All flow exceeding this elevation was routed through the area. After examination of the topography east of the canal, it was concluded that the flow would rapidly dissipate laterally into a relatively wide area with hazardous velocities and relatively shallow depths. Areal distribution would be nonuniform, and flow paths would be unpredictable. No attempts were made to reduce the water-surface elevation along the canal because of the unknown factors in timing and location of the breach. For the Pecos River restudy, water-surface profiles for the 1-percent-annual-chance flood were computed using the USACE HEC-2 backwater computer program (Reference 30). Water-surface profiles for the Hackberry Draw restudy were recomputed by MBJ using the USACE HEC-2 model. The existing cross-section stationing and stream alignments from the previously effective FISs were used for the Pecos River models. Where necessary, because of changes in conditions from the previous FIS or lack of existing data, additional cross sections were included. These additional sections were either field surveys performed during site investigations or digitized from the 1976 work maps. Because of extensive gravel mining within Dark Canyon Draw, a large portion of this reach was reflown in March 1992. New digitized cross sections were used for this reflown area. The existing cross section stationing and stream alignments from the previous FIS were used for the Hackberry Draw models, with the exception of a few new cross sections digitized from the work map. Water-surface elevations predicted at the Southern Canal diversion were at or above the top of the embankment, suggesting the likelihood of a failure of the canal embankment. Cross sections of the area east of the Southern Canal were digitized from the work map from Dark Canyon Draw to Church Street and a sheetflow analysis using the HEC-2 hydraulic model was performed (Reference 30). The sheetflow analysis was revised by MBJ based on a review of available topographic mapping, normal-depth computations, and engineering judgment. The starting water-surface elevation for the Pecos River was based on the normal-depth elevation of the upstream cross section of a hydraulic computer model extending from downstream of the Pecos River, Dark Canyon Draw confluence, to the Lower Tansill Dam. The Dark Canyon Draw hydraulic model was broken down into two sections. The downstream section starting water-surface elevation was based on the slope-area method.

16
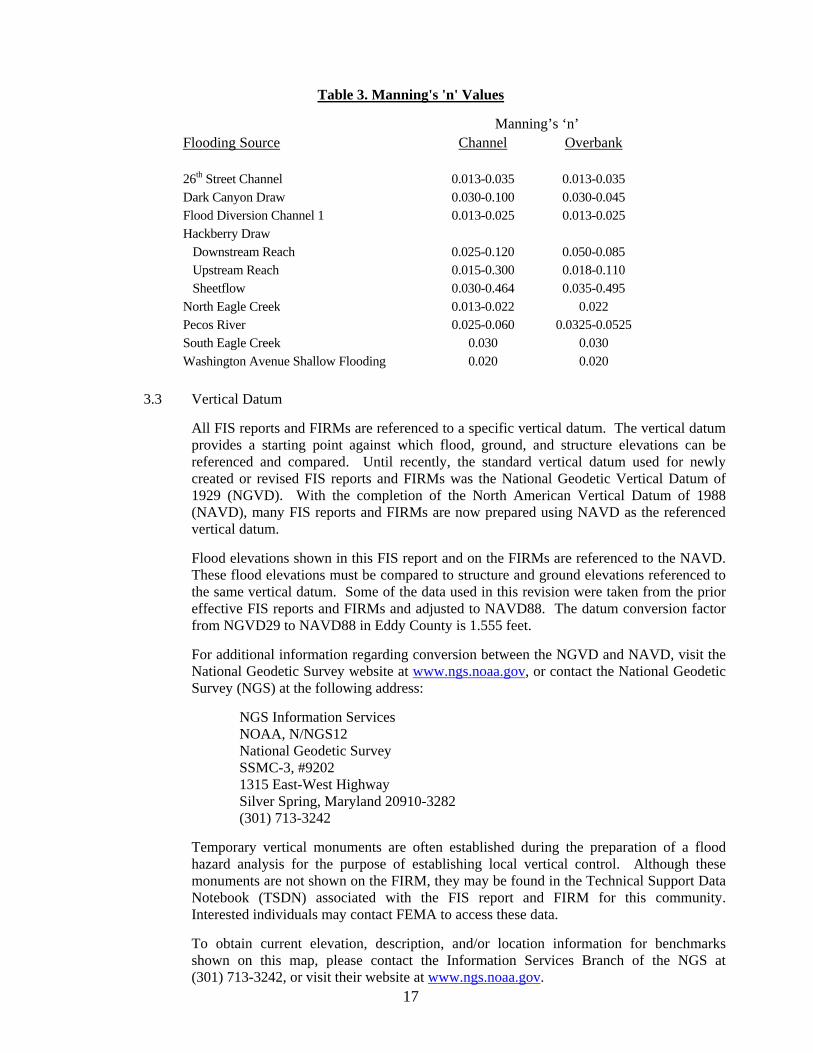
The upstream section starting water-surface elevation was based on the normal depth elevation at the upstream cross section of the downstream reach. The Hackberry Draw hydraulic model was also broken into two sections. The downstream section extends from the confluence of the Hackberry Draw diversion channel with Dark Canyon Draw upstream to the convergence of Hackberry Draw with the Southern Canal. The downstream section of this model was started at critical depth where weir flow occurs across a roadway. The upstream section was begun at the ending normal-depth elevation of the downstream section. Flood profiles (Exhibit 1) were drawn showing computed water-surface elevations to an accuracy of 0.5 foot for floods of the selected recurrence intervals. In the unincorporated areas of Eddy County, cross sections for the backwater analyses were obtained by field survey or were synthesized. Structural geometry and elevation data for one bridge at Standpipe Road were obtained by field survey. Additional cross sections were located above and below the bridge to compute the backwater effects of that structure. Road crossings, other than the one at Standpipe Road, were either low-water fords or bridges that had no appreciable effect on the conveyance of discharge; therefore, no other bridges were surveyed. Water-surface elevations of floods of the selected recurrence interval were computed using the USGS WSPRO step-backwater computer program (Reference 31). Slope-conveyance computations, using one synthetic cross section, were made below the bridge at Standpipe Road. This was done in order to arrive at a starting water-surface elevation at the exit cross section of the bridge. In addition, a series of synthetic cross sections were added below the bridge and a starting water-surface elevation was computed at the bridge exit. That starting elevation did not differ appreciably from the slope-conveyance computations. The flood profile was subsequently reviewed to ensure that the starting elevation used did not overtop the bridge embankment and was consistent with the flood elevations computed farther upstream. Flood profiles were drawn showing computed water-surface elevations for floods of the selected recurrence interval. Locations of selected cross sections used in the hydraulic analyses are shown on the Flood Profiles (Exhibit 1). For stream segments for which a floodway was computed (Section 4.2), selected cross-section locations are also shown on the FIRM (Exhibit 2). Channel roughness factors (Manning’s “n” values) used in the hydraulic computations were chosen by engineering judgment and based on field observations of the channel and floodplain areas. For the restudied streams, heavily urbanized area “n” values were calculated utilizing an area-weighted method developed by the USACE, Los Angeles District. Manning’s “n” values used for this study are shown in Table 3, “Manning’s “n” Values.” The hydraulic analyses for this study were based on unobstructed flow. The flood elevations shown on the profiles are thus considered valid only if hydraulic structures remain unobstructed, operate properly, and do not fail.
17
Table 3. Manning's 'n' Values
Manning’s ‘n’ Flooding Source Channel Overbank 26th Street Channel 0.013-0.035 0.013-0.035 Dark Canyon Draw 0.030-0.100 0.030-0.045 Flood Diversion Channel 1 0.013-0.025 0.013-0.025 Hackberry Draw Downstream Reach 0.025-0.120 0.050-0.085 Upstream Reach 0.015-0.300 0.018-0.110 Sheetflow 0.030-0.464 0.035-0.495 North Eagle Creek 0.013-0.022 0.022 Pecos River 0.025-0.060 0.0325-0.0525 South Eagle Creek 0.030 0.030 Washington Avenue Shallow Flooding 0.020 0.020
3.3 Vertical Datum
All FIS reports and FIRMs are referenced to a specific vertical datum. The vertical datum provides a starting point against which flood, ground, and structure elevations can be referenced and compared. Until recently, the standard vertical datum used for newly created or revised FIS reports and FIRMs was the National Geodetic Vertical Datum of 1929 (NGVD). With the completion of the North American Vertical Datum of 1988 (NAVD), many FIS reports and FIRMs are now prepared using NAVD as the referenced vertical datum. Flood elevations shown in this FIS report and on the FIRMs are referenced to the NAVD. These flood elevations must be compared to structure and ground elevations referenced to the same vertical datum. Some of the data used in this revision were taken from the prior effective FIS reports and FIRMs and adjusted to NAVD88. The datum conversion factor from NGVD29 to NAVD88 in Eddy County is 1.555 feet. For additional information regarding conversion between the NGVD and NAVD, visit the National Geodetic Survey website at www.ngs.noaa.gov, or contact the National Geodetic Survey (NGS) at the following address: NGS Information Services NOAA, N/NGS12 National Geodetic Survey SSMC-3, #9202
1315 East-West Highway Silver Spring, Maryland 20910-3282 (301) 713-3242 Temporary vertical monuments are often established during the preparation of a flood hazard analysis for the purpose of establishing local vertical control. Although these monuments are not shown on the FIRM, they may be found in the Technical Support Data Notebook (TSDN) associated with the FIS report and FIRM for this community. Interested individuals may contact FEMA to access these data. To obtain current elevation, description, and/or location information for benchmarks shown on this map, please contact the Information Services Branch of the NGS at (301) 713-3242, or visit their website at www.ngs.noaa.gov.

18
4.0 FLOODPLAIN MANAGEMENT APPLICATIONS The NFIP encourages State and local governments to adopt sound floodplain management programs. To assist in this endeavor, each FIS report provides 1-percent-annual-chance floodplain data, which may include a combination of the following: 10-, 2-, 1-, and 0.2-percent-annual-chance flood elevations; delineations of the 1- and 0.2-percent-annual-chance floodplains; and a 1-percent-annual-chance floodway. This information is presented on the FIRM and in many components of the FIS report, including Flood Profiles, Floodway Data tables, and Summary of Stillwater Elevation tables. Users should reference the data presented in the FIS report as well as additional information that may be available at the local community map repository before making flood elevation and/or floodplain boundary determinations. 4.1 Floodplain Boundaries
To provide a national standard without regional discrimination, the 1-percent-annual-chance flood has been adopted by FEMA as the base flood for floodplain management purposes. The 0.2-percent-annual-chance flood is employed to indicate areas of flood risk in the community. For each stream studied by detailed methods, the 1- and 0.2-percent-annual-chance floodplain boundaries have been delineated using the flood elevations determined at each cross section. Between cross sections, the boundaries in the unincorporated areas of Eddy County were interpolated using topographic maps at a scale of 1:24,000 with a contour interval of 5 feet and 10 feet (Reference 32). In the City of Artesia, the boundaries between cross sections were interpolated using topographic maps at a scale of 1:2,400, with a contour interval of 4 foot (Reference 33). In the City of Carlsbad, boundaries between cross sections were interpolated using topographic maps at a scale of 1:2,400, with a contour interval of 4 feet (Reference 34). Small areas within the flood boundaries in the City of Carlsbad may lie above the flood elevations, and therefore, not be subject to flooding; owing to limitations of the map scale, such areas are not shown. The 1- and 0.2-percent-annual-chance floodplain boundaries are shown on the FIRM. On this map, the 1-percent-annual-chance floodplain corresponds to the boundary of the areas of special flood hazards (Zones A, AE, AO, and AH), and the 0.2-percent-annual-chance floodplain boundary corresponds to the boundary of areas of moderate flood hazards. In cases where the 1- and 0.2-percent-annual-chance floodplain boundaries are close together, only the 1-percent-annual-chance floodplain boundary has been shown. Small areas within the floodplain boundaries may lie above the flood elevations, but cannot be shown due to limitations of the map scale and/or lack of detailed topographic data. For the streams studied by approximate methods, only the 1-percent-annual-chance floodplain boundary is shown on the FIRM. Approximate 1-percent-annual-chance floodplain boundaries in some portions of the study area were taken directly from the Flood Hazard Boundary Map for Eddy County (Reference 35). The approximate floodplain boundaries upstream of the Brantley Dam along the Pecos River were adjusted to follow a contour elevation of 3,280 feet. These boundaries were interpolated using engineering judgment and topographic maps (Reference 35).
4.2 Floodways Encroachment on floodplains, such as structures and fill, reduces flood-carrying capacity, increases flood heights and velocities, and increases flood hazards in areas beyond the encroachment itself. One aspect of floodplain management involves balancing the economic gain from floodplain development against the resulting increase in flood hazard.

19
For purposes of the NFIP, a floodway is used as a tool to assist local communities in this aspect of floodplain management. Under this concept, the area of the 1-percent-annual-chance floodplain is divided into a floodway and a floodway fringe. The floodway is the channel of a stream, plus any adjacent floodplain areas, that must be kept free of encroachment so that the base flood can be carried without substantial increases in flood heights. Minimum Federal standards limit such increases to 1 foot, provided that hazardous velocities are not produced. The floodways in this study are presented to local agencies as minimum standards that can be adopted directly or that can be used as a basis for additional floodway studies. The floodways presented in this study were computed for certain stream segments on the basis of equal-conveyance reduction from each side of the floodplain. Floodway widths were computed at cross sections. Between cross sections, the floodway boundaries were interpolated. The results of the floodway computations are tabulated for selected cross sections (see Table 4, Floodway Data). In cases where the floodway and 1-percent-annual-chance floodplain boundaries are either close together or collinear, only the floodway boundary is shown. The area between the floodway and 1-percent-annual-chance floodplain boundaries is termed the floodway fringe. The floodway fringe encompasses the portion of the floodplain that could be completely obstructed without increasing the water-surface elevation (WSEL) of the base flood more than 1 foot at any point. Typical relationships between the floodway and the floodway fringe and their significance to floodplain development are shown in Figure 1, “Floodway Schematic.”
Figure 1. Floodway Schematic
In the City of Artesia, no floodway was computed for Eagle Creek. In the City of Carlsbad, the floodway presented in this study for the Pecos River was computed on the basis of equal conveyance reduction from each side of the floodplain. Floodway analyses were attempted Dark Canyon Draw and Hackberry Draw but, because of steep slopes and high velocities, any encroachment in the 1-percent-annual-chance floodplain was found to exceed the accepted criteria. Therefore, the natural 1-percent-annual-chance floodplains of Dark Canyon and Hackberry Draws are designated as floodways. No floodways were calculated as a part of the study completed in the unincorporated areas of Eddy County. In the restudy, floodway computations were performed for the Pecos River reach only.

FLOODING SOURCE FLOODWAY BASE FLOOD WATER-SURFACE ELEVATION
CROSS SECTION DISTANCE1 WIDTH (FEET)
SECTION AREA
(SQUARE FEET)
MEAN VELOCITY (FEET PER SECOND)
REGULATORY (FEET NAVD 88)
WITHOUT FLOODWAY (FEET NAVD 88)
WITH FLOODWAY (FEET NAVD 88)
INCREASE (FEET)
Pecos River
A 0 1,180 15,768 4.4 3,105.0 3,105.0 3,106.0 1.0 B 970 891 11,574 6.0 3,105.3 3,105.3 3,106.2 0.9 C 1,520 692 9,344 7.4 3,105.4 3,105.4 3,106.2 0.8 D 2,040 680 9,614 7.2 3,105.7 3,105.7 3,106.6 0.9 E 2,585 472 9.223 7.5 3,106.2 3,106.2 3,107.1 0.9 F 2,818 420 9,070 7.6 3,106.9 3,106.9 3,107.6 0.7 G 3,338 425 8,409 8.2 3,107.0 3,107.0 3,107.8 0.8 H 3,788 660 9,756 7.1 3,107.5 3,107.5 3,108.3 0.8 I 4,778 665 12,274 5.6 3,108.3 3,108.3 3,109.0 0.7 J 5,128 655 14,547 4.7 3,108.7 3,108.7 3,109.4 0.7 K 5,303 982 6,500 10.6 3,109.8 3,109.8 3,110.8 1.0 L 5,759 1,203 14,328 4.8 3,111.8 3,111.8 3,112.8 1.0 M 6,229 840 12,965 5.3 3,111.9 3,111.9 3,112.8 0.9 N 7,149 1,213 13,541 5.1 3,112.6 3,112.6 3,113.6 1.0 O 7,814 1,075 14,003 4.9 3,112.9 3,112.9 3,113.9 1.0 P 8,344 1,415 13,488 5.1 3,113.3 3,113.3 3,114.3 1.0 Q 8,814 1,174 9,447 7.3 3,112.8 3,112.8 3,113.6 0.8 R 9,354 1,260 10,242 6.7 3,112.9 3,112.9 3,113.9 1.0
FEDERAL EMERGENCY MANAGEMENT AGENCY
PECOS RIVEREDDY COUNTY, NM
AND INCORPORATED AREAS
1 Feet above Lower Tansill Dam.
TAB
LE 4
FLOODWAY DATA

FLOODING SOURCE FLOODWAY BASE FLOOD WATER-SURFACE ELEVATION
CROSS SECTION DISTANCE1 WIDTH (FEET)
SECTION AREA
(SQUARE FEET)
MEAN VELOCITY (FEET PER SECOND)
REGULATORY (FEET NAVD 88)
WITHOUT FLOODWAY (FEET NAVD 88)
WITH FLOODWAY (FEET NAVD 88)
INCREASE (FEET)
Pecos River (cont.)
S 9,874 1,214 8,697 7.9 3,112.9 3,112.9 3,113.9 1.0 T 10,394 390 8,767 7.9 3114.0 3,114.0 3,115.0 1.0 U 11,430 415 7,482 9.2 3,114.8 3,114.8 3115.6 0.8 V 12,180 387 7,294 9.5 3,115.3 3,115.3 3,116.1 0.8 W 12,290 362 7,431 9.3 3,115.9 3,115.9 3,116.7 0.8 X 12,790 470 8,807 7.8 3,117.4 3,117.4 3118.0 0.6 Y 13,630 400 8,397 8.2 3,118.6 3,118.6 3,119.2 0.6 Z 14,520 435 8,442 8.2 3,119.1 3,119.1 3,119.7 0.6
AA 15,175 365 7,826 8.8 3,120.1 3,120.1 3,120.6 0.5 AB 15,765 430 10,101 6.8 3,121.3 3,121.3 3,121.9 0.6 AC 16,715 405 9,395 8.2 3,121.7 3,121.7 3,122.4 0.7 AD 17,480 300 7,471 9.2 3,122.1 3,122.1 3,122.7 0.6 AE 18,130 424 8,265 8.3 3,122.8 3,122.8 3,123.5 0.7 AF 18,855 410 8,289 8.3 3,123.4 3,123.4 3,123.9 0.5 AG 19,785 415 9,255 7.5 3,124.0 3,124.0 3,124.6 0.6 AH 21,055 350 7,559 9.1 3,124.5 3,124.5 3,125.1 0.6
FEDERAL EMERGENCY MANAGEMENT AGENCY
PECOS RIVEREDDY COUNTY, NM
AND INCORPORATED AREAS
1 Feet above Lower Tansill Dam.
TAB
LE 4
FLOODWAY DATA

22
5.0 INSURANCE APPLICATION For flood insurance rating purposes, flood insurance zone designations are assigned to a community based on the results of the engineering analysis. These zones are as follows:
Zone A
Zone A is the flood insurance rate zone that corresponds to the 1-percent-annual-chance floodplains that are determined in the FIS report by approximate methods. Because detailed hydraulic analyses are not performed for such areas, no base (1-percent-annual-chance) flood elevations (BFEs) or depths are shown within this zone.
Zone AE
Zone AE is the flood insurance rate zone that corresponds to the 1-percent-annual-chance floodplains that are determined in the FIS report by detailed methods. Whole-foot BFEs derived from the detailed hydraulic analyses are shown at selected intervals within this zone.
Zone AH
Zone AH is the flood insurance rate zone that corresponds to the areas of 1-percent-annual-chance shallow flooding (usually areas of ponding) where average depths are between 1 and 3 feet. Whole-foot base flood elevations derived from the detailed hydraulic analyses are shown at selected intervals within this zone.
Zone AO
Zone AO is the flood insurance rate zone that corresponds to the areas of 1-percent-annual-chance shallow flooding (usually sheet flow on sloping terrain) where average depths are between 1 and 3 feet. Average whole-foot depths derived from the detailed hydraulic analyses are shown within this zone.
Zone X
Zone X is the flood insurance rate zone that corresponds to areas outside the 0.2-percent-annual-chance floodplain, areas within the 0.2-percent-annual-chance floodplain, areas of 1-percent-annual-chance flooding where average depths are less than 1 foot, areas of 1-percent-annual-chance flooding where the contributing drainage area is less than 1 square mile (sq. mi.), and areas protected from the base flood by levees. No BFEs or depths are shown within this zone.
6.0 FLOOD INSURANCE RATE MAP The FIRM is designed for flood insurance and floodplain management applications. For flood insurance applications, the map designates flood insurance rate zones as described in Section 5.0 and, in the 1-percent-annual-chance floodplains that were studied by detailed methods, shows selected whole-foot base flood elevations or average depths. Insurance agents use the zones and base flood elevations in conjunction with information on structures and their contents to assign premium rates for flood insurance policies. For floodplain management applications, the map shows by tints, screens, and symbols, the 1- and 0.2-percent-annual-chance floodplains, floodways, and the locations of selected cross sections used in the hydraulic analyses and floodway computations. The countywide FIRM presents flooding information for the entire geographic area of Eddy County. Previously, FIRMs were prepared for each incorporated community and the unincorporated areas of the County identified as flood-prone. This countywide FIRM also includes flood-hazard information that was presented separately on Flood Boundary and Floodway Maps (FBFMs), where applicable. Historical data relating to the maps prepared for each community are presented in Table 5, “Community Map History.”
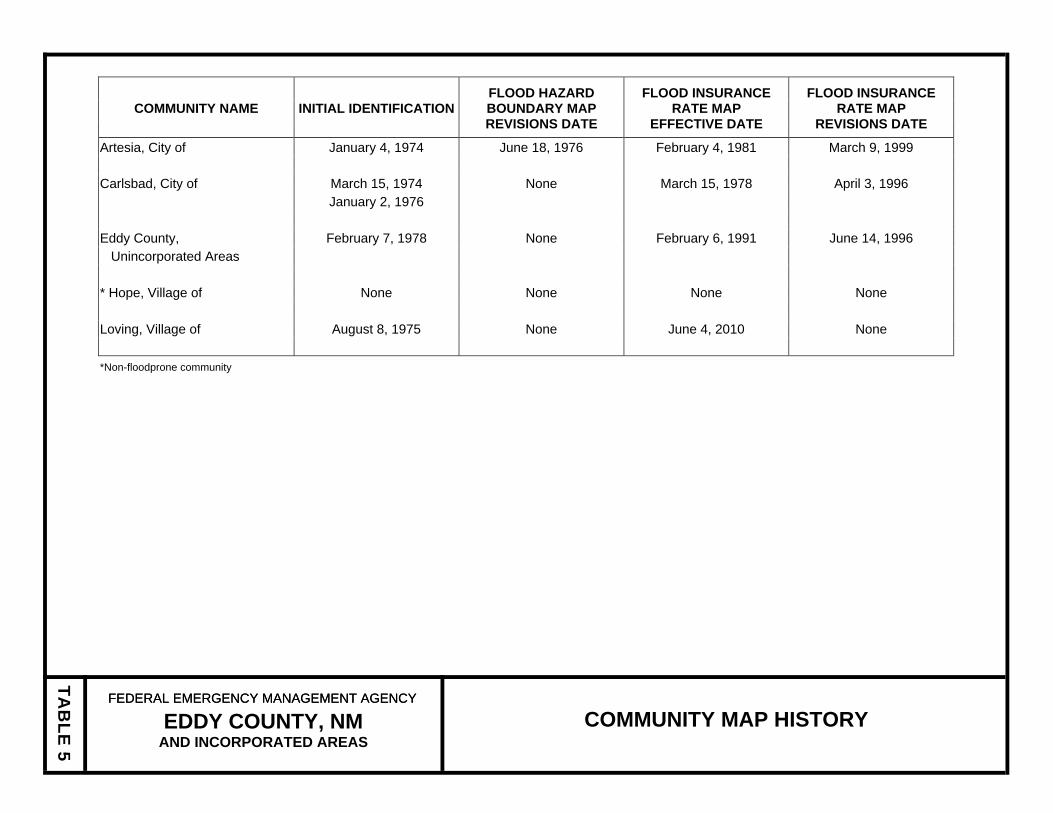
COMMUNITY NAME INITIAL IDENTIFICATIONFLOOD HAZARD BOUNDARY MAP REVISIONS DATE
FLOOD INSURANCE RATE MAP
EFFECTIVE DATE
FLOOD INSURANCE RATE MAP
REVISIONS DATE
Artesia, City of January 4, 1974 June 18, 1976 February 4, 1981 March 9, 1999 Carlsbad, City of March 15, 1974 None March 15, 1978 April 3, 1996 January 2, 1976 Eddy County, February 7, 1978 None February 6, 1991 June 14, 1996 Unincorporated Areas * Hope, Village of None None None None Loving, Village of August 8, 1975 None June 4, 2010 None *Non-floodprone community
TAB
LE 5
FEDERAL EMERGENCY MANAGEMENT AGENCY FEDERAL EMERGENCY MANAGEMENT AGENCY
COMMUNITY MAP HISTORY EDDY COUNTY, NM AND INCORPORATED AREAS
7.0 OTHER STUDIES Scanlon & Associates, Inc., produced a storm-drainage study for the City of Artesia (Reference 36). Peak discharges for tributaries to the Pecos River appeared in the Appendix for House Document No. 339, 84th Congress, Second Session, but were never published (Reference 10). A restudy was prepared by Smith Engineering Company containing revised data for all of the streams in the City of Artesia (Reference 18). A flood control for the Pecos River in the City of Carlsbad was prepared by the USACE for the USBR in 1964 (Reference 25). Hydrology from the flood control report was used to develop hydraulics for Carlsbad’s FIS. A Survey Report for Flood Control was prepared by the USACE for Carlsbad and vicinity (Reference 37). FISs have been prepared for the unincorporated areas of Culberson County, Texas and Chaves County, New Mexico (References 38 and 39). Because of the differences in methodologies used to delineate approximate floodplain boundaries in Culberson County, discrepancies exist between the studies for Eddy and Culberson Counties. However, restudies are currently underway for Chaves and Otero Counties that will allow for accuracy in the approximate floodplain boundaries between Eddy, Otero, and Chaves Counties. In addition, a study was recently completed in Lea County, New Mexico with full agreement, that will be fully compatible with Eddy County (Reference 40). This FIS report either supersedes or is compatible with all previous studies published on streams studied in this report and should be considered authoritative for the purposes of the NFIP.
8.0 LOCATION OF DATA Information concerning the pertinent data used in preparation of this study can be obtained by contacting FEMA Region VI, Federal Insurance and Mitigation Division, 800 North Loop 288, Denton, Texas 76209.
9.0 BIBLIOGRAPHY AND REFERENCES
1. Federal Emergency Management Agency, Flood Insurance Study, City of Artesia, Eddy County, New Mexico, Washington, D.C., March 9, 1999.
2. Federal Emergency Management Agency, Flood Insurance Study, City of Carlsbad, Eddy County, New Mexico, Washington, D.C., April 3, 1996.
3. Federal Emergency Management Agency, Flood Insurance Study, Eddy County and Unincorporated Areas, New Mexico, Washington, D.C., June 4, 1996.
4. U.S. Department of Commerce, Bureau of the Census, Census 2000 Data for the State of New Mexico, July 12, 2003, http://www.census.gov/census2000/states/nm.html.
5. Official Eddy County, New Mexico Website, http://www.co.eddy.nm.us/.
6. U.S. Department of Commerce, National Oceanic and Atmospheric Administration, National Climatic Data Center, Climatography of the United States No. 20, 1971-2000, February 2004.
24

7. Artesia Chamber of Commerce, Visitor Information, History & Culture, http://www.artesiachamber.com/vi/his.htm.
8. Loving Municipal Schools, http://www.lovingschools.com/index.htm.
9. Artesia Daily Press, Artesia, New Mexico.
10. House Document No. 339, 84th Congress, Second Session.
11. U.S. Department of Agriculture, Soil Conservation Service, Water Work Plan, Eagle-Tumbleweed Draw Watershed, Eddy and Chaves Counties, February 1971.
12. U.S. Congress, 84th Congress, Second Session, Survey Report on Pecos River and Tributaries, Texas and New Mexico, U.S. Department of the Army, Corps of Engineers, 1957.
13. New Mexico Bureau of Geology and Mineral Resources, New Mexico Tech, NMBGMR Geologic Tour, http://geoinfo.nmt.edu/index.html.
14. U.S. Department of Agriculture, Soil Conservation Service, Work Plan for Watershed Protection and Flood Control, Hackberry Draw Watershed, Eddy County, New Mexico, December 1961.
15. U.S. Department of the Interior, Bureau of Reclamation, Brantley Project, New Mexico, http://www.usbr.gov/dataweb/html/brantley.html.
16. U.S. Department of Agriculture, Soil Conservation Service, Technical Release No. 20, Computer Program, Project Formulation, Hydrology, Washington, D.C., 1965.
17. U.S. Department of the Army, Corps of Engineers, Hydrologic Engineering Center, HEC-1 Flood Hydrograph Package, Generalized Computer Program, Davis, California, September 1990.
18. Smith Engineering Company, LOMR, City of Artesia, New Mexico, and Vicinity, February 1997.
19. U.S. Department of the Interior, Geological Survey, Water Resources Data for New Mexico, Part I, Surface Water Records.
20. Water Resources Council, A Uniform Technique for Determining Flood Flow Frequencies, Bulletin 15, December 1967.
21. Federal Emergency Management Agency, Flood Insurance Study, Eddy County and Unincorporated Areas, New Mexico, Washington, D.C., February 1991.
22. U.S. Department of the Interior, Geological Survey, Water Resources Investigations Report 86-4104, Techniques for Estimating Flood-Flow Frequency for Unregulated Streams in New Mexico, S.D. Waltemeyer, Washington, D.C., 1986.
23. U.S. Department of the Interior, Geological Survey, Water Resources Investigations Report 84-4358, Techniques for Estimating Flood Peak Discharges for Unregulated Streams and Streams Regulated by Small Floodwater Retarding Structures in Oklahoma, R.L. Tortorelli and D.L. Bergman, Washington, D.C., 1985.
24. U.S. Department of the Army, Corps of Engineers, Albuquerque District, South Central New Mexico Regional Frequency Study, 1990.
25

25. U.S. Bureau of Reclamation, Flood Control, Brantley Dam and Reservoir, Pecos River, New Mexico, May 1964.
26. U.S. Department of the Army, Corps of Engineers, Hydrologic Engineering Center, HEC-2 Water-Surface Profiles, Generalized Computer Program, Version 4.6.2, Davis, California, May 1991.
27. John D. Jaquess & Associates, Artesia LOMR, Workmap of Post-Project, Scale 1:1,200, Contour Interval 1 Foot, November 1997.
28. U.S. Department of Housing and Urban Development, Federal Insurance Administration, Flood Insurance Study, City of Carlsbad, Eddy County, New Mexico, Washington, D.C., June 15, 1977 (Flood Insurance Rate Map effective March 15, 1978).
29. U.S. Department of the Army, Corps of Engineers, Hydrologic Engineering Center, HEC-2 Water Surface Profiles, Generalized Computer Program, Davis, California, October 1973.
30. U.S. Department of the Army, Corps of Engineers, Hydrologic Engineering Center, HEC-2 Water-Surface Profiles, Generalized Computer Program, Version 4.6.0, Davis, California, February 1991.
31. U.S. Department of the Interior, Geological Survey, WSPRO, A Computer Model for Water-Surface PROfile Computations, Washington, D.C., 1986, revised 1990.
32. Eddy County, New Mexico, Eddy County Digital Elevation Data, 2007.
33. City of Artesia, New Mexico, City of Artesia Digital Elevation Data, 2007.
34. City of Carlsbad, New Mexico, City of Carlsbad Digital Elevation Data, 2007.
35. U.S. Department of Housing and Urban Development, Federal Insurance Administration, Flood Hazard Boundary Map, Eddy County, New Mexico (Unincorporated Areas), February 7, 1978.
36. Scanlon & Associates, Inc., City of Artesia, New Mexico, Storm Drainage Study, 1977.
37. U.S. Congress, 85th Congress, First Session, Survey Report on Pecos River and Tributaries, Carlsbad, New Mexico and Vicinity, U.S. Department of the Army, Corps of Engineers, 1957.
38. Federal Emergency Management Agency, Flood Insurance Study, Culberson County and Unincorporated Areas, Texas, Washington, D.C., November 1, 1985.
39. Federal Emergency Management Agency, Flood Insurance Study, Chaves County and Unincorporated Areas, New Mexico, Washington, D.C., Date TBD.
40. Federal Emergency Management Agency, Flood Insurance Study, Lea County and Unincorporated Areas, New Mexico, Washington, D.C., Date TBD.
Engineering for Report for 1979 Storm Channel Project Under the Artesia, New Mexico Community Development Program, 1979.
Minton Engineering & Associates, Field Survey, Artesia, New Mexico, February 1973.
26

27
Chow, Ven T., Open-Channel Hydraulics, McGraw-Hill Book Company, Inc., New York, 1959.
Federal Emergency Management Agency, Federal Insurance Administration, Flood Insurance Study, City of Artesia, Eddy County, New Mexico, Washington, D.C., February 4, 1981.
U.S. Department of the Army, Corps of Engineers, Albuquerque District, Feasibility Report, Hydrology, Pecos River and Tributaries at and in the Vicinity of Carlsbad, New Mexico, January 1976.
U.S. Department of the Army, Corps of Engineers, Albuquerque District, Feasibility Report for Water Resources Development, Pecos River and Tributaries at Carlsbad, New Mexico, March 1977.
U.S. Department of the Army, Corps of Engineers, Albuquerque District, Flood Report, Pecos River Watershed, Flood of 23 August 1966, Carlsbad, New Mexico, and Vicinity, November 1966.
U.S. Department of the Army, Corps of Engineers, Albuquerque District, Reconnaissance Report, Pecos River and Tributaries at Carlsbad, New Mexico, April 1987.
U.S. Department of the Army, Corps of Engineers, Albuquerque District, Report on Generalized Skew Coefficients of Annual Maximum Streamflow Logarithms in Southwestern Division, March 1978.
U.S. Department of the Army, Corps of Engineers, Albuquerque District, Report on Survey for Flood Control, Pecos River and Tributaries, Carlsbad, New Mexico, and Vicinity, June 1956.
U.S. Department of the Army, Corps of Engineers, Albuquerque District, Water Control Manual, Brantley Dam and Reservoir, Eddy County, New Mexico, Appendix D to Master Water Control Manual, Pecos River Basin, December 1989.
U.S. Department of the Army, Corps of Engineers, Hydrologic Engineering Center, Flood Frequency Analysis Generalized Computer Program, April 1991.
U.S. Department of the Army, Corps of Engineers, Hydrologic Engineering Center, Multiple Linear Regression Generalized Computer Program, September 1970.
U.S. Department of the Army, Corps of Engineers, Hydrologic Engineering Center, HEC-2 Water Surface Profiles User’s Manual, September 1990.
U.S. Department of the Army, Corps of Engineers, SWDED-XW Letter, Generalized Skew Coefficients of Annual Maximum Streamflow Logarithms, April 12, 1978.
U.S. Department of the Interior, Bureau of Reclamation, Southwest Region, Definite Plan Report, Brantley Project, New Mexico, Amarillo, Texas, December 1982.