Embed Size (px)
Citation preview

1. West Africa is defined here as the region composed of ECOWAS member countries, Cameroon, Mauritania and Chad.
2. Source: UNCTAD see http://www.unctad.org/infocomm/anglais/cotton/uses.htm
3. The three main markets for cotton fibre are: clothing (60%), furnishings (about 33%) and professional clothing (5%). Cotton is also used for manufacturing specific textiles and for medical purposes.
4. ICAC (2004): The World Cotton Market: A Long-term Outlook.
ECOWAS-SWAC/OECD©2006 - August 2006
CSAOSWAC
economy series
Cotton
The Atlas on Regional Integration is
an ECOWAS — SWAC/OECD initiative,
financed by the development co-
operation agencies of France,
Switzerland and Luxembourg.
Divided into four series (population,
land, economy, environment),
the Atlas chapters are being
produced during 2006-2007 and
will be available on-line on the site
www.atlas-westafrica.org
I. West Africa in the International Market
1.1 Global Overview of Supply and Demand
Since 1960, world production of cotton fibre has doubled,
from 10.2 to 20.3 million tons, representing a moderate average
annual growth of 1.7 %. Although there are numerous cotton-
producing countries, global production is largely dominated by
China (28%), followed by the United States (17%) and India (12%).
These three countries alone account for nearly 60% of total
global production of cotton fibre in 2004/05, compared to 47%
30 years ago. In this international environment, West Africa1
occupies a modest place: the region ranks fifth in the world and
contributes only 5% of global production. It has, however, made
remarkable progress by increasing its production ten-fold since
1960 to reach a total of more than one million tons of fibre
produced per year for the past four years (see Figure 1).
Between 1960 and 2000, global demand for cotton fibre increased at the same pace as
population growth, i.e. 1.8% annually. By contrast, during this period, global consumption of
artificial fibres increased by 4.7% per year, marking the relative decline of cotton compared
to synthetic fibre. Cotton represented 68% of total fibre use in 1960; this percentage
followed a downward trend to reach 38% in 20002.
Within the clothing sector, the demand for natural fibres continues to increase and cotton
remains the primary natural fibre3 used. For non-clothing use, however, demand for artificial
fibres is increasing. In the medium-term, given the economic and demographic projections,
global consumption of all textile fibre should increase by roughly 2.3% per year until 2010 to
reach 62 million tons. Cotton consumption should increase at a more moderate pace (1.8%
per annum), and world demand should rise to 23.6 million tons by 20104.
tlas on Regional Integration A in West Africa
�
tlas on Regional Integration A in West Africa
West Africa
North America
Central America
South America
Sub-Saharan Africa(Other Countries)
North Africa
Europe
Russian Federation
Central Asia
China
South Asia
Australia
East Asia
Middle East
Chine
Cotton-producing countries
Regional limit
Production of cotton fibre
Consumption of cotton fibre
3730
1835
65530
1105 1235
350 250
975
100
350 200
30645
475955
1480
385
4935
5870
4510
5195
13951645
55
1700
65530
Average 2000/01 - 2004/05(thousand tons)
Source: ICAC (2005) © Sahel and West Africa Club/OECD 2006
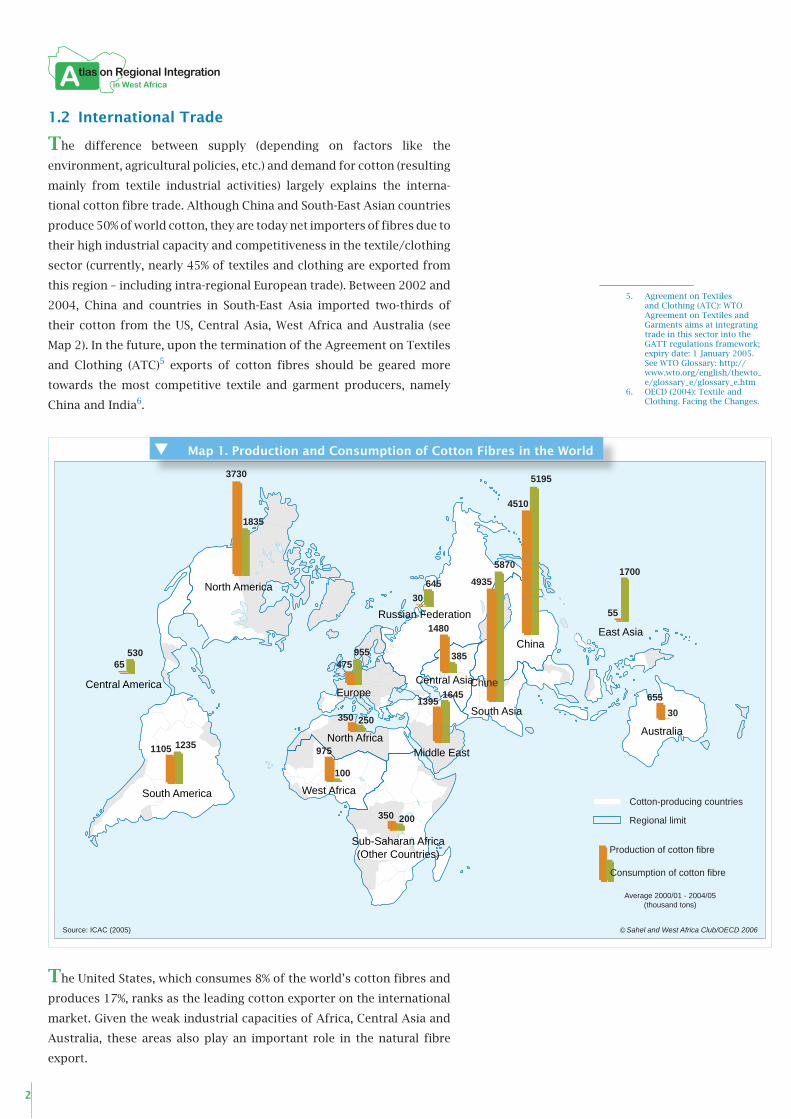
1.2 International Trade
The difference between supply (depending on factors like the
environment, agricultural policies, etc.) and demand for cotton (resulting
mainly from textile industrial activities) largely explains the interna-
tional cotton fibre trade. Although China and South-East Asian countries
produce 50% of world cotton, they are today net importers of fibres due to
their high industrial capacity and competitiveness in the textile/clothing
sector (currently, nearly 45% of textiles and clothing are exported from
this region – including intra-regional European trade). Between 2002 and
2004, China and countries in South-East Asia imported two-thirds of
their cotton from the US, Central Asia, West Africa and Australia (see
Map 2). In the future, upon the termination of the Agreement on Textiles
and Clothing (ATC)5 exports of cotton fibres should be geared more
towards the most competitive textile and garment producers, namely
China and India6.
The United States, which consumes 8% of the world’s cotton fibres and
produces 17%, ranks as the leading cotton exporter on the international
market. Given the weak industrial capacities of Africa, Central Asia and
Australia, these areas also play an important role in the natural fibre
export.
5. Agreement on Textiles and Clothing (ATC): WTO Agreement on Textiles and Garments aims at integrating trade in this sector into the GATT regulations framework; expiry date: 1 January 2005. See WTO Glossary: http://www.wto.org/english/thewto_e/glossary_e/glossary_e.htm
6. OECD (2004): Textile and Clothing. Facing the Changes.
Map 1. Production and Consumption of Cotton Fibres in the World

economy series
�
1.3 West Africa: A Major Player on the International Market
None of the West African
countries is today playing
a major role in the interna-
tional cotton trade. However,
considered as a regional
entity, West Africa is the
world’s third largest exporter
(averaging nearly one million
tons over the 2000/01–
2004/05 period, or 13% of
global production), behind
the USA (2.5 million tons,
or 37%) and Central Asia
(1.2 million tons, or 17%).
Cotton exports from West
African countries developed quickly. The annual growth rate of West
African cotton exports, which developed much more rapidly than in
other regions of the world, was close to 6% in 1960. Only Australia
registered a higher trend in cotton exports, with an annual average rate
of nearly 11% during the same period.
Nevertheless, a short-term analysis of the international market trend
presents a somewhat different picture. Over the past five years, South
America, the USA and Africa are the most active regions on the interna-
tional market (see Figure 3). Brazil quite recently appeared as a dynamic
Figure 1. Global and West African Production of Cotton Fibre (1960/61–2008/09)
0
0,3
0,6
0,9
1,2
1,5
1960/61 1970/71 1980/81 1990/91 2000/010
5
10
15
20
25
0,1 Mt
10,2 Mt
20,3 Mt
1 MtWorld production
West African production
Million tons Million tons
Source: SWAC/OECD (2005), data from ICAC
Fore
cast
(200
4/05
to 2
008/
09)
Figure 2. Extra-regional Export of Textiles and Garments in 2004
0
10 000
20 000
30 000
40 000
50 000
60 000
70 000
80 000
China East Asia Europe SouthAsia
NorthAmerica
Middle-East
CentralAmerica
NorthAfrica
SouthAmerica
RussianFederation
SSA Oceania
Textile exports Clothing exports
Source: SWAC/OECD (2006), data from WTO
Million dollar US

�
tlas on Regional Integration A in West Africa
actor. Indeed, this country could catch up with the level of Australian
exports in 2006, with a volume of around 450,000 tons7. Exports from
the USA increased from 1.5 to 2.5 million tons, confirming the country’s
dominant position. Exports from Central Asia are somewhat on the
decline. In the short- and medium-term, the USA, Central Asia and West
Africa should maintain their position as leaders on the international
market. West Africa could replace Central Asia in second position, which
will surely have an impact on cotton supply from China and globally
from Asia (see Map 3). For some years now, there has indeed been a
reorientation of West African exports to this region.
II. West African Cotton
2.1 Continental Overview
Africa produces about 100 species of cotton grains, whose presence
dates back to the 10th and 13th centuries. In countries with low rainfall,
cotton must be irrigated. This is the case for most of the areas cultivated
in Egypt and all those areas cultivated in Morocco. In sub-Saharan Africa,
cotton production, mainly rainfed, is concentrated in the tropical zone
where dry seasons and humid seasons alternate.
CentralAmerica
SouthAmerica
Sub-Saharan Africa(Other countries)
North Africa
Europe
RussianFederation
North
America
China
South AsiaEast Asia
Middle East
WESTAFRICA
UNITEDSTATES
AUSTRALIA
CENTRALASIA
Main cotton exporters
Major textile industrialzones
Main cotton exportflows (2002-2004)*
* These flows represented over 90% of exports from the USA, Central Asia, West Africa and Australia
Source: Comtrade database, UN (2006)
Cotton-producingzone
© Sahel and West Africa Club/OECD 2006
Map 2. Main Flows of Cotton Exports in the World
7. Perrin, Serge, Lagandre, Damien (2005) : Le coton africain face à la concurrence du marché mondial.

economy series
�
There are six cotton basins on the continent, the largest being the
West African basin, which stretches from Senegambia to South-
Eastern Chad and even to the heart of the Central African Republic.
Figure 3. Dynamics of World Cotton Exports
0
500
1 000
1 500
2 000
2 500
UnitedStates
SouthAmerica
WestAfrica
Africa(others)
RussianFederation
Europe CentralAsia
China Australia EastAsia
SouthAsia
Middle-East
Over 10 %
0 to 10%
Less than - 2%
Annual average growthrate of cotton exports(2000/01 to 2004/05)
Average 2000/01 - 2004/05Thousand tons
- 2 to 0%
Source: SWAC/OECD (2006), from ICAC data
Source: Comtrade database, UN (2006) © Sahel and West Africa Club/OECD 2006
China46%
East Asia17%
EuropeanUnion14%
North Africa3%
South Asia17%
South America1%
Others0.6%
Sub-SaharanAfrica1%
Destination of cotton exportsfrom West Africa (2004 )
Europe
South America
East Asia
West Africa
Sub-SaharanAfrica
(Excluding West Africa)
NorthAfrica
China
South Asia
Map 3. Destination of Cotton Exports from West Africa
�
tlas on Regional Integration A in West Africa
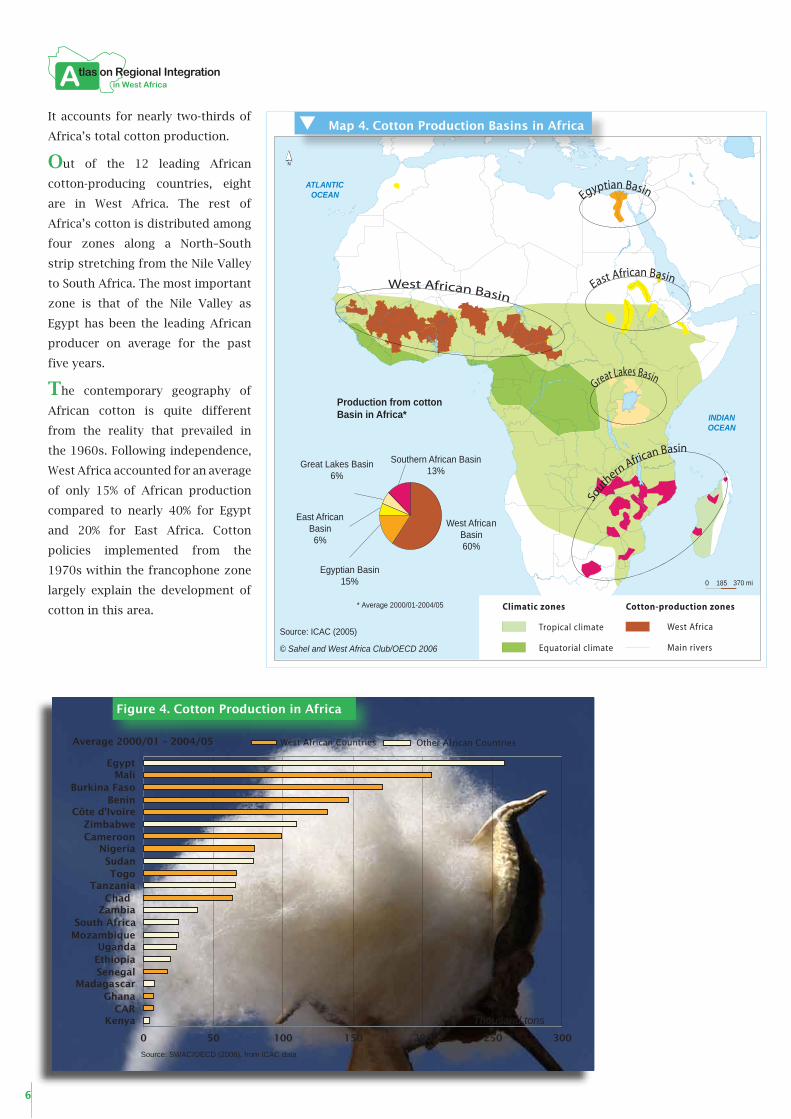
It accounts for nearly two-thirds of
Africa’s total cotton production.
Out of the 12 leading African
cotton-producing countries, eight
are in West Africa. The rest of
Africa’s cotton is distributed among
four zones along a North–South
strip stretching from the Nile Valley
to South Africa. The most important
zone is that of the Nile Valley as
Egypt has been the leading African
producer on average for the past
five years.
The contemporary geography of
African cotton is quite different
from the reality that prevailed in
the 1960s. Following independence,
West Africa accounted for an average
of only 15% of African production
compared to nearly 40% for Egypt
and 20% for East Africa. Cotton
policies implemented from the
1970s within the francophone zone
largely explain the development of
cotton in this area.
Figure 4. Cotton Production in Africa
0 50 100 150 200 250 300
KenyaCAR
GhanaMadagascar
SenegalEthiopiaUganda
MozambiqueSouth Africa
ZambiaChad
TanzaniaTogo
SudanNigeria
CameroonZimbabwe
Côte d'IvoireBenin
Burkina FasoMali
Egypt
Thousand tons
Average 2000/01 – 2004/05
Source: SWAC/OECD (2006), from ICAC data
West African Countries Other African Countries
West African Basin
Egyptian Basin
So
uthern
African Basin
Great Lakes Basin
East African Basin
Main rivers
Cotton-production zonesClimatic zones
West AfricaTropical climate
Equatorial climate
0 185 370 mi
West AfricanBasin60%
Southern African Basin13%
Great Lakes Basin6%
East AfricanBasin6%
Egyptian Basin15%
Production from cottonBasin in Africa*
© Sahel and West Africa Club/OECD 2006
* Average 2000/01-2004/05
Source: ICAC (2005)
ATLANTICOCEAN
INDIANOCEAN
Map 4. Cotton Production Basins in Africa
economy series
�
2.2 Origin and Development of West African Cotton
The second half of the 19th
Century was a key period in the
history of cotton. The 1850s were
initially marked by a doubling
of the world cotton price under
the combined effects of the rapid
development of the textile industry
in Europe and major strikes in India
(revolt by Indian soldiers serving
in companies in the East Indies).
Later, the Civil War in the United
States (1861–1865) deprived the
market of a major source of supply.
The end of the hostilities certainly
forced prices down but ushered in
a new era due to the disappearance
of the unpaid labour of slaves.
European powers then turned
to their African colonies under
the pressure of their industrial
lobbies. In the early 1860s, an
association for the development of
cotton production was created in
Box 1. Cotton: A Long Journey from India
It was from India that the art of cotton fabric was exported to the Old World. As early as 445 BC, the Greek Herodotus wrote of India: “there are trees growing in the wild, whose fruit produces better wool, more beautiful than sheep”. As early as the 7th Century, Arab conquerors brought the use of cotton to North Africa and Europe. Trade between Europe and India took a new turn, thanks notably to the opening of the routes to India by Vasco da Gama in 1497. With the invention of the weaving trade by Jacquard, cotton was part of the European Industrial Revolution. The ginning and spinning techniques were later improved. In the industrialised countries, cotton clothing, even of the finest cotton became accessible to all. The invention of the saw-gin was at the origin of the cotton production boom in the United States. At the beginning of the 20th Century, 90% of global cotton trade was in the hands of Europeans and raw cotton was mostly supplied by the United States, India and Egypt. Today, cotton is cultivated on all five continents, in some 100 countries.
Text from cotton file produced by Cirad http://www.cirad.fr/fr/regard_sur/coton.php
500 mm
500 mm
500 mm
500 mm
1000 mm
1000 mm
1000 mm
1000 mm
1000 mm
1000 mm
1000 mm
ATLANTICOCEAN
INDIANOCEAN
Very suitable
Suitable
Moderately suitable
Marginally suitable
Not suitable
500 - 1000 mm
More than 1000 mm
Isohyets
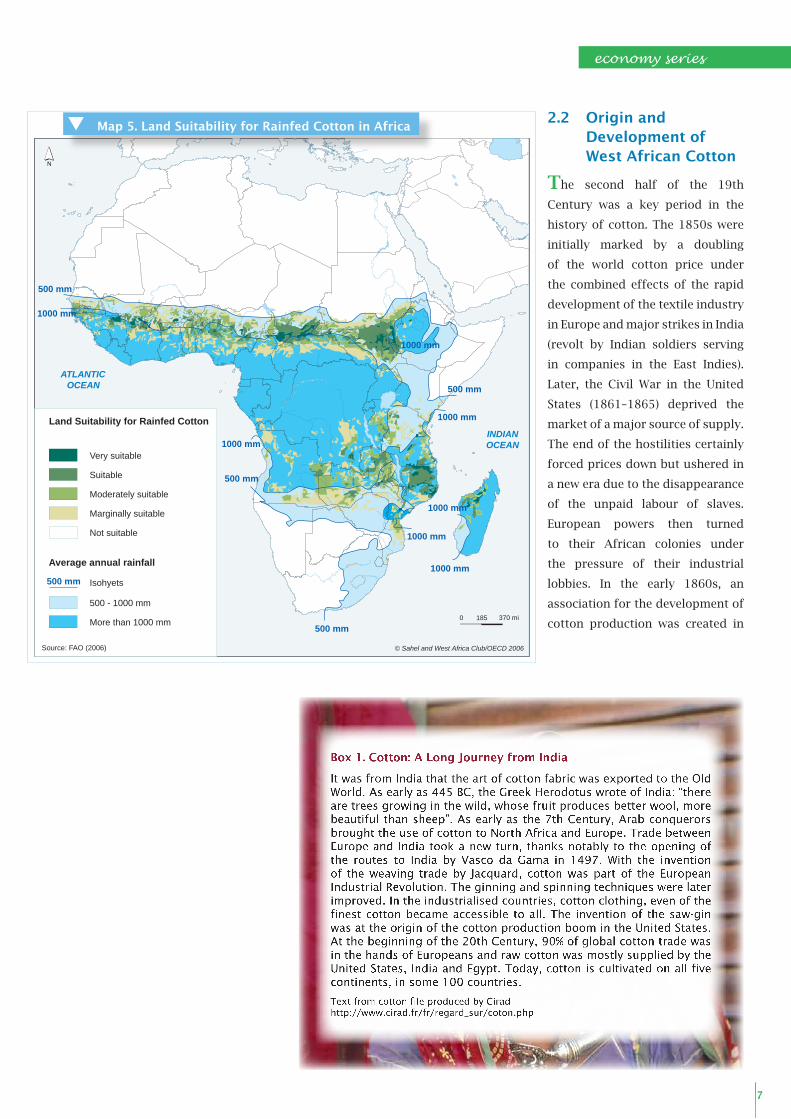
Land Suitability for Rainfed Cotton
Average annual rainfall
0 185 370 mi
Source: FAO (2006)
500 mm
© Sahel and West Africa Club/OECD 2006
Map 5. Land Suitability for Rainfed Cotton in Africa

�
tlas on Regional Integration A in West Africa
Manchester at the initiative of a group of industrialists concerned about
the supply difficulties. Very quickly, trials were launched in The Gambia
and Sierra Leone, and later in Nigeria. In 1903, the English established
in Nigeria the British Cotton Growers Association (BCGA). For its part,
the French government first turned to the Senegal Valley, where the
Soninkes have a long-standing cotton tradition, then the Casamance;
without success. In the 1930s, the construction of the Office du Niger
au Mali was initially designed for cotton production. There again, hopes
were shattered. Finally, it was the savannahs of French Equatorial Africa
(AEF), lying between Cameroon, Chad, and CAR, that constituted the
first major cotton basin (see Map 6). Since the 1970s, the latter is still
the most important basin in the region (42% of West African production)
ahead of the Nigerian basin (38%).
It was only after independence
that cotton developed more in
the West of Africa (see Map 6)
under the effect of voluntary
policies greatly inspired by the
former colonial powers whose
own textile industries continued
to flourish until the beginning
of the 1980s. These policies rely
on parastatal enterprises that
provided support to and ensured
close supervision of producers
in extension services, research,
marketing support, etc. (see
Box 2).
Over the past 45 years, the areas
devoted to cotton production
have practically quadrupled, from
800,000 to 3 million hectares.
In other words, cotton-growing
areas increased from 1.5% to 3.5%
of arable land in West Africa. Comparatively, grain crops such as maize,
millet and sorghum are cultivated on 9, 16 and 14 million hectares
respectively. The extension of cotton-growing areas was accompanied
by an underlying increase in output from 400 kg/ha at the beginning of
the 1960s to 1 ton/ha today.
2.3 An Era of Reforms and Liberalisation
Despite this performance, the cotton sector faced periods of major
economic and financial crises. It was after these difficulties that
structural adjustment policies, heralding the first liberalisation reforms,
were initiated. Liberalisation of the cotton sector, observed in most of
the countries, was the result of a number of homogeneous trends. On
one hand, State corporations have been gradually transferring a number
0
200
400
600
800
1000
1200
1400
1960/61 1970/71 1980/81 1990/91 2000/01
Mali-Burkina Faso-Côte d'Ivoire Benin-TogoChad-Cameroon Nigeria-NigerOthers
Cotton prices fell to 35 cents/pound in October 2001
Fo
reca
st
ICA
C (
20
04
/05
to
20
08
/09
)
Thousand tons
Source: SWAC/OECD (2006), from ICAC data
Figure 5. Trends in Cotton Production in West Africa (1960/61–2008/09)

economy series
�
95 190 mi0
ATLANTICOCEAN
2000s
MALINIGER
CHADSENEGAL
THEGAMBIA
GUINEA-BISSAU GUINEA
LIBERIA
CÔTED'IVOIRE
GHANA NIGERIA
CAMEROON
BENIN
MAURITANIA
SIERRALEONE TOGO
BURKINAFASO
400
800
17%
7%
22%51%
3%
95 190 mi0
ATLANTICOCEAN
MALINIGER
CHADSENEGAL
THEGAMBIA
GUINEA-BISSAU GUINEA
LIBERIA
CÔTED'IVOIRE
GHANANIGERIA
CAMEROON
BENIN
BURKINAFASO
MAURITANIA
SIERRALEONE
TOGO
1960s
400
800
© Sahel and West Africa Club/OECD 2006
© Sahel and West Africa Club/OECD 2006
15%4% 42%
38%
1%
Map 6. Evolution of Cotton-Production Basins Between 1960 and 2000

10
tlas on Regional Integration A in West Africa
of functions (research and
development activities, inputs
supply, production and primary
collection of cotton and ginning
activities) to the farmers’
unions or other private actors.
In the case of Anglophone
countries, this process has even
been completed8. Producers’ or
farmers’ groups are increasingly
involved in the overall
management of the sectors. On
the other hand, these changes
do not fundamentally call into
question some of the respon-
sibilities of the State, which
entail making or influencing
decisions taken on price fixing,
in particular. These general
trends, however, cannot conceal the diverse modes of liberalisation:
The nature of cotton companies. In some cases, these companies
are still in place but have opened their capital to producers or other
national and international private stakeholders (e.g. Union Nationale
des Producteurs de Coton au Burkina Faso – Unpc-B – in the capital
of Sofitex in Burkina Faso; private companies (Aiglon, Dagris) within
the Société Nationale du Coton au Niger; private companies and
producers such as Sodefitex in Senegal). In other cases, the public
enterprises have been completely dismantled and replaced by new
structures: the Nouvelle compagnie cotonnière de Guinée (CGC
– whose capital is provided by private stakeholders and producers),
was created at the end of the public cotton development project,
and, in 2000, signed a 15-year agreement with the State. Irrespective
of their nature, however, cotton companies in Francophone countries
still have a number of prerogatives in the sector’s organisation,
despite their dwindling numbers. In Ghana, activities relating to the
production and marketing of cotton have been totally privatised
and the State-owned cotton company no longer exists. The State is
limited to the role of the certification of seedlings and maintenance
of rural roads. The same applies to Nigeria, where public authority
intervenes in research (the Agricultural Research Institute in Zaria),
in the certification and supply of seedlings through the Ministry of
Agriculture, and in subsidies for fertilizers.
The functions of State-owned cotton companies. In some countries,
these functions are limited to ginning, while other activities are
carried out by private actors or farmers’ groups: in Benin, the Sonapra
manages 12 ginning factories out of the 20 in operation; in Togo,
liberalisation opened the market to three new operators, apart from
Box 2. Cotton Sectors in the Francophone Zone before Liberalisation
The development of cotton in West Africa, notably in the Francophone area, is the result of the establishment and involvement of the CFDT (Compagnie Française pour le développement des Fibres Textiles, a French parastatal company founded in 1949) in the national cotton sectors, with the support of research, particularly by the IRCT (Institut de Recherche du Coton et des Textiles Exotiques founded in 1946). The nationalisation of cotton structures in the 1970s did not challenge the role of the CFDT, which owns shares in national companies: Cotontchad (1971, Chad), Sodecoton (1974, Cameroon), Sodefitex (1974, Senegal), CIDT (1974, Côte d’Ivoire), Sotoco (1974, Togo), Sofitex (1979, Burkina Faso), CMDT (1975, Mali).
The sectoral approach adopted in each of the countries was based on joint modalities for a number of functions: price equalisation, the purchase of cotton seed, the fixing of selling prices of inputs throughout the entire cotton zone, the fixing of a purchase price valid for the entire collection season, and the payment on collection of inputs supplied to farmers by the cotton company without trade margin, obligation and exclusive purchase of the entire harvest by the cotton company.
Source : Coton en Afrique de l’Ouest et du Centre. Situation et perspectives. Ministère français de la coopération et du développement
8. Ghana was the first country to implement liberalisation reforms in 1985, with the privatisation of the Cotton Development Board (CDB), now the Ghana Cotton Company Ltd (GCCL). The State holds 30% of its capital, apart from other shareholders: textile companies, input suppliers and the Agricultural Development Bank.

economy series
11
More than 50,000
30,000 – 40,000
20,000 – 30,000
10,000 – 20,000
5,000 – 10,000
Less than 5,000
Borders of the Mali/Côted’Ivoire/Burkina Faso
cotton basinBorders of the
Benin/Burkina
Faso/Togo/Niger cotton
basin
Heart of the Mali/Côte
d’Ivoire/Burkina Faso
cotton basin
Production 2001/02In tons
Source: Economic and Social Importance of Cotton in West Africa:Role of Cotton in Development, Trade and Livelihoods. SWAC/OECD, november 2005 © Sahel and West Africa Club/OECD 2006
Sotoco, for ginning and spinning activities. In The Gambia, Gamcot,
a private company, manages the collection and ginning of cotton,
agricultural supervision, with Sodefitex (Senegal) ensuring the
technical and financial aspects. In other countries, including Burkina
Faso, liberalisation adhered to the integrated sector principle, where
each cotton company is responsible for organising the production,
processing and marketing of cotton fibre.
The restructuring of the sector and creation of new cotton companies
were sometimes accompanied by a geographical redefinition of their
activities. This is the situation in Côte d’Ivoire, where three companies
share the territory: CIDT Nouvelle in the South, Ivoire Coton in the
North-West and LCCI in the North-East. In Burkina Faso, if Sofitex has
conserved its role in the West, Faso Coton has taken over the Central
zone and Socoma the East zone. This configuration could be adopted
in Mali from 2008, or for the impending privatisation of Sodecoton
(Cameroon) or Cotontchad (Chad).
Subject to different and sometimes divergent national policies, cotton
producers do not share the same access to extension, training, input
supply and marketing services, as this will vary depending on which
side of the border they are situated. Yet, the cotton-producing basins
are situated along the borders (see Maps 7 and 8). Will the process
Map 7. Focus on Cotton-Producing Zones in Burkina Faso
11

1�
tlas on Regional Integration A in West Africa
of liberalising national sectors
gradually eliminate these policy
disparities? The fact is that these
processes today are conducted
without consultation between the
countries, which adopt different
approaches to liberalisation. The
implementation of cross-border
cooperation strategies and the
harmonisation of national policies
have become necessary today. It is
in this spirit that ECOWAS intends
to promote the “development
of cross-border cooperation ties
among the different national cotton
companies in order to harmonise
their strategies and methods of
intervention, reduce costs of inputs,
develop synergies and reduce costs
of collection, ginning and transpor-
tation to the ports”9.
III. Regional Stakes of Development
3.1 Regional Basins for National Wealth
Cotton is cultivated in all the sub-humid and semi-arid zones with an
annual rainfall of between 500–700 mm and 1,200–1,500 mm. Hence
the crop is found in both the Northern zones of the coastal countries
(Benin, Cameroon, Côte d’Ivoire, Nigeria, Togo) and the Southern zones
of the landlocked countries (Mali, Burkina Faso, Niger and Chad). Cotton
is also cultivated in the centre and even the south of Benin and Togo, as
it has adapted to the rainfall characteristics of this region (see Map 8).
These environmental determinants make the West African cotton zones
basically cross border areas. The most important of them is situated
along the border areas of Mali, Burkina Faso and Côte d’Ivoire. Benin and
Togo share most of the second basin. The third is centred on Northern
Cameroon and Southern Chad. The fourth is basically Nigerian. A fifth
basin, though marginal at the regional level, lies between Senegal, Eastern
Gambia, part of Northern Guinea and the North-East of Guinea Bissau.
Some of these areas are bound by highly powerful socio-cultural links:
the Hausa zone between Nigeria and Niger or the Senoufo zone between
Côte d’Ivoire, Mali and Burkina Faso.
These transnational basins are scattered with ginning factories
(there are nearly 100 in West Africa, compared to 1,000 in the United
States, whose cotton grain production is four times higher). It is from
these factories that cotton is transported by road or rail to the ports
9. ECOWAS (2004): Agricultural Policy Framework for West Africa.
Table 1. Macro-economic Importance of Cotton in West Africa
Average for�000-�00�
Cotton fibre exports
(million US$)
Share in West African cotton
exports
Share in the country’s
agricultural exports
Share in the country’s total
exports
Benin 142.5 16 % 70 % 30 %Burkina Faso 154 17 % 75 % 56 %Cameroon 102.8 11 % 20 % 7 %Cape-Verde - - - -Chad 59.7 7 % 52 % 30 %Côte d’Ivoire 147.7 17 % 6 % 4 %The Gambia 0.2 - - -Ghana 5.3 1 % 1 % 1 %Guinea 0.2 - - -Guinea-Bissau 0.1 - - -Liberia - - - -Mali 188.1 21 % 63 % 30 %Mauritania - - - -Niger 0.2 - - -Nigeria 31.8 4 % 7 % -Senegal 17.5 2 % 11 % 9 %Sierra Leone - - - -Togo 39.6 4 % 38 % 8 %Source: Faostat (2006)
economy series
1�
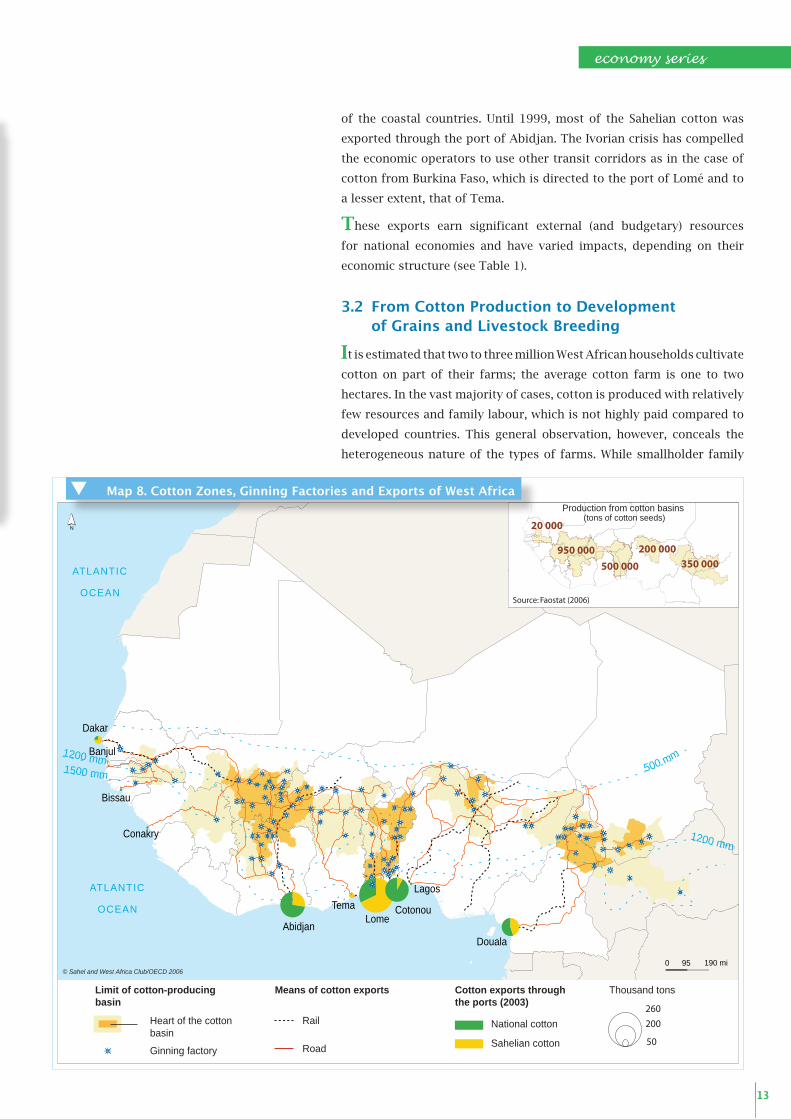
of the coastal countries. Until 1999, most of the Sahelian cotton was
exported through the port of Abidjan. The Ivorian crisis has compelled
the economic operators to use other transit corridors as in the case of
cotton from Burkina Faso, which is directed to the port of Lomé and to
a lesser extent, that of Tema.
These exports earn significant external (and budgetary) resources
for national economies and have varied impacts, depending on their
economic structure (see Table 1).
3.2 From Cotton Production to Development of Grains and Livestock Breeding
It is estimated that two to three million West African households cultivate
cotton on part of their farms; the average cotton farm is one to two
hectares. In the vast majority of cases, cotton is produced with relatively
few resources and family labour, which is not highly paid compared to
developed countries. This general observation, however, conceals the
heterogeneous nature of the types of farms. While smallholder family
Table 1. Macro-economic Importance of Cotton in West Africa
Average for�000-�00�
Cotton fibre exports
(million US$)
Share in West African cotton
exports
Share in the country’s
agricultural exports
Share in the country’s total
exports
Benin 142.5 16 % 70 % 30 %Burkina Faso 154 17 % 75 % 56 %Cameroon 102.8 11 % 20 % 7 %Cape-Verde - - - -Chad 59.7 7 % 52 % 30 %Côte d’Ivoire 147.7 17 % 6 % 4 %The Gambia 0.2 - - -Ghana 5.3 1 % 1 % 1 %Guinea 0.2 - - -Guinea-Bissau 0.1 - - -Liberia - - - -Mali 188.1 21 % 63 % 30 %Mauritania - - - -Niger 0.2 - - -Nigeria 31.8 4 % 7 % -Senegal 17.5 2 % 11 % 9 %Sierra Leone - - - -Togo 39.6 4 % 38 % 8 %Source: Faostat (2006)
0 95 190 mi
ATLANTIC
OCEAN
ATLANTIC
OCEAN
1200 mm
1200 mm1500 mm 500 mm
Tema
Abidjan
Dakar
LomeCotonou
Lagos
Douala
Conakry
Bissau
Banjul
Source: Faostat (2006)
Production from cotton basins (tons of cotton seeds)
350 000950 000
500 000
20 000
200 000
Limit of cotton-producing basin
Means of cotton exports
Heart of the cottonbasin
Road
Rail
Ginning factory
Thousand tons
National cotton
Sahelian cotton 50
200
260
Cotton exports through the ports (2003)
© Sahel and West Africa Club/OECD 2006
Map 8. Cotton Zones, Ginning Factories and Exports of West Africa

1�
tlas on Regional Integration A in West Africa
farms, that may be under-equipped or not
equipped at all, form the vast majority of
farms, slightly larger plantations (two to
five hectares) have developed as a result of
animal traction. There is also a small number
of farms (20–30 ha) that mainly use family
workers, but with considerable agricultural
equipment for animal traction or motorised
cultivation.
Cotton production is never, or almost
never, the sole activity practised on a farm,
even if it is often the main activity. It has
given rise to the development of the practice
of mixed cultivation in association with
millet, sorghum and, more recently, maize.
The succession of cotton and grains on the
same plot enables the second crop to benefit
from the after-effect of fertilizers carried by
the first. This explains to some extent why
cotton and grain production levels have
followed the same trend since the 1980s (see
Figure 6).
In the sparsely populated sub-humid
savannahs, the appearance of cash crops
has facilitated the development of animal
draught cultivation, as these activities make
it possible to earn the necessary income to
purchase the materials and animals. In the
case of cotton pioneers, animal draught
cultivation was used to limit weed invasion
through tilling before sowing and through
mechanical weeding10. However, all cotton-
growing zones in the region are not uniformly
affected by this phenomenon; as the rates
of recorded use of animal draught differs at
the centre of the main West African cotton
basin: nearly 60% of the cotton farms in Burkina Faso, 85% in Mali11.
3.3 The Textile Industry
West Africa’s cotton production is generally under-exploited12; most
of the fibre produced is exported to the international market. However,
the situation is quite different in Francophone countries than in
Anglophone countries. In Francophone countries more than 90% of the
cotton produced is exported in the form of fibres whereas in Anglophone
countries 90% and 65% of Nigerian and Ghanaian cotton respectively
were consumed locally by the textile industry from 1993/94 to 2003/04,
for example.
Box 3. The Sikasso Region in Mali: from Cash Crop Agriculture to Commercial Agriculture
Cotton cultivation is a very old activity in Mali. It was imposed as an export crop by the colonial administration. One agency (CMDT) took over the cultivation, collection and ginning activities. CMDT compels farmers to increase their output (from 200 kg to 1,600 kg), by limiting the areas cultivated and fertilizer use. The farmers quickly understood that the fertilizer financed by cotton can also be used for food cultivation (they sometimes “divert” part of the fertilizer to this end). Cotton revenues are first invested in the increase of the herd as a form of savings; then the revenues are used to purchase draught animals and ploughs. When the pressure from CMDT eases, farmers use animal-drawn ploughs to increase the cultivated area. At the same time, given the growth in urban, local and regional demand for food, grains, particularly maize, have become traded crops.
Between 1984 and 1997 in the Sikasso region, the average area cultivated by each farmer increased from one to three or four hectares. From 1977– 1997, maize production increased from 10,000 to 70,000 tons. At the same time, cotton farming areas increased from 15,000 to 78,000 hectares with a decline in output. On a farm of 85 hectares, the distribution between cotton and grains is set at around 30 hectares for cotton/55 hectares for grain. An initial system of land repartition for crop rotation and the use of livestock for agricultural practices has taken the place of traditional shifting cultivation. The next challenge to be addressed is the disappearance of fallow lands and the need for soil regeneration.
Source: ECOLOC Study, Sikasso (Mali), Club du Sahel / OECD, July 1998
10. CIRAD (2005): L’association agriculture élevage: une stratégie de développement durable en Afrique de l’Ouest et du Centre.
11. DAGRIS (2002): Les filières partenaires.
12. If the textile industry alone is discussed here, it should be noted that cotton grain is largely processed in West Africa, particularly to extract the oil for human consumption and the cotton seed cake for cattle feed; these activities will be discussed in another chapter of the Atlas. With an output of 3.9 million tons, cotton oil is ranked fifth in terms of global cooking oil consumption. Oil cake ranks second in animal feed consumption, behind soya.
62 76 84 92 97
Cotton
Maize
1500 t/ha
1000
500
Sikasso ZoneCotton and Maize Production

economy series
1�
0
5 000
10 000
15 000
20 000
25 000
30 000
35 000
40 000
45 000
50 000
1961 1966 1971 1976 1981 1986 1991 1996 2001
0
500
1 000
1 500
2 000
2 500
3 000
3 500
Cereal production
Cotton seed production
Thousand tonsThousand tons
Source: SWAC/OECD (2006), data from FAOSTAT
Figure 6. Parallel Trends of Cotton and Grain Production in West Africa
190 mi950
ATLANTICOCEAN
ATLANTICOCEAN
Use of animals for carrying, transportingand watering
Cotton zone
Use of mules and horses for sowing, weeding, collection and transportation
Use of cattle for tilling by animal traction
Use of cattle for animal tractionmules and horses for transportation
Use of cattle for animal tractionmules and horses for transportation
Perc
enta
ge o
f equ
ippe
d fa
rms
> 90%
40 to 75%
20 to 40%
< 30%
Source: Cirad, Sahel and West Africa Club/OECD (2006)
© Sahel and West Africa Club/OECD 2006
MALI NIGERCHADSENEGAL
THEGAMBIA
GUINEABISSAU GUINEA
LIBERIACOTE
D'IVOIREGHANA
NIGERIA
CAMEROON
BENIN
BURKINAFASO
MAURITANIA
SIERRALEONE TOGO
Map 9. Animal Traction and Cotton-Producing Zones in West Africa

1�
tlas on Regional Integration A in West Africa
While the first industrial plants were set up from the 1950s, it was only
during the 1965–1985 period that West Africa witnessed the birth and
development of the textile industry under the effect of voluntary policies
Fraudulantimports
Imports
Second-handclothing
Localproduction
Source: WAEMU (2003)
Figure 7. Estimated Distribution of WAEMU Textile Market
Cotton production
Cotton fibre Cotton seeds
OilcakesSpinning
Weaving
Dyeing and printing
Market(regional or export)
Seeds Oil and soapmill
Clothingindustry
Extra-regional-exports
Intra-regional-exports
40% 50%
Loss10%
90%
10%
Craft cloths (Kente, Mandjack, etc.)
Industrial clothes (Wax, Fancy, etc.)
Use of importedproducts
Source: SWAC/OECD 2006
Figure 8. The Cotton Industry in West Africa
economy series
1�
implemented by the State. This “boom” period was followed by difficult
years marked by the crisis in public enterprises, structural adjustments,
devaluation of the CFA franc as well as competition from second-
hand clothing imported from developed countries and Asian textiles
(see Figure 7). This situation triggered a de-industrialisation process
within the WAEMU zone. There were 41 industrial plants in 1980 as
compared to about twenty operating today. In Nigeria, the sector profes-
sionals were equally concerned about the situation. While in 1999, there
were about 100 factories based mainly in Lagos and Kaduna, today only
about 20 or 40 are still operating, according to sources. There are two
contradictory trends for the future: firstly, the AGOA13 agreements and
the implementation of a regional policy capitalising on the textile chain
within the WAEMU would improve industrial activities in the region14.
Secondly, however, the end of the ATC Agreements should intensify
competition from countries like India and China, unless a regional trade
policy coherent with the industrial strategy is promoted.
Beyond the industrial level, the artisanal textile and traditional clothing
sector (weaving, dyeing, manufacturing and selling of materials, etc.) is
the second largest employer in West Africa, after agriculture. Between
65 and 70% of Malian artisans, 50 % of Burkinabe artisans and 30 to 40 %
of Ghanaian artisans are operating in the traditional textile sector15.
13. AGOA: African Growth Opportunity Act. Promulgated on 18 May 2000 by President Bill Clinton, this law enables sub-Saharan African countries to export to the United States, duty and quota free, products that meet defined eligibility rules of which 14 West African countries are today eligible.
14. The WAEMU’s textile development strategy provides for “a dynamic regional textile industry, for processing 25% of local cotton production, creating 50,000 industrial jobs”. See the study on the identification and promotion of regional industrial units in the WAEMU cotton sector (March 2003)
15. Igue J. (2004) : Le secteur textile traditionnel en Afrique de l’Ouest..
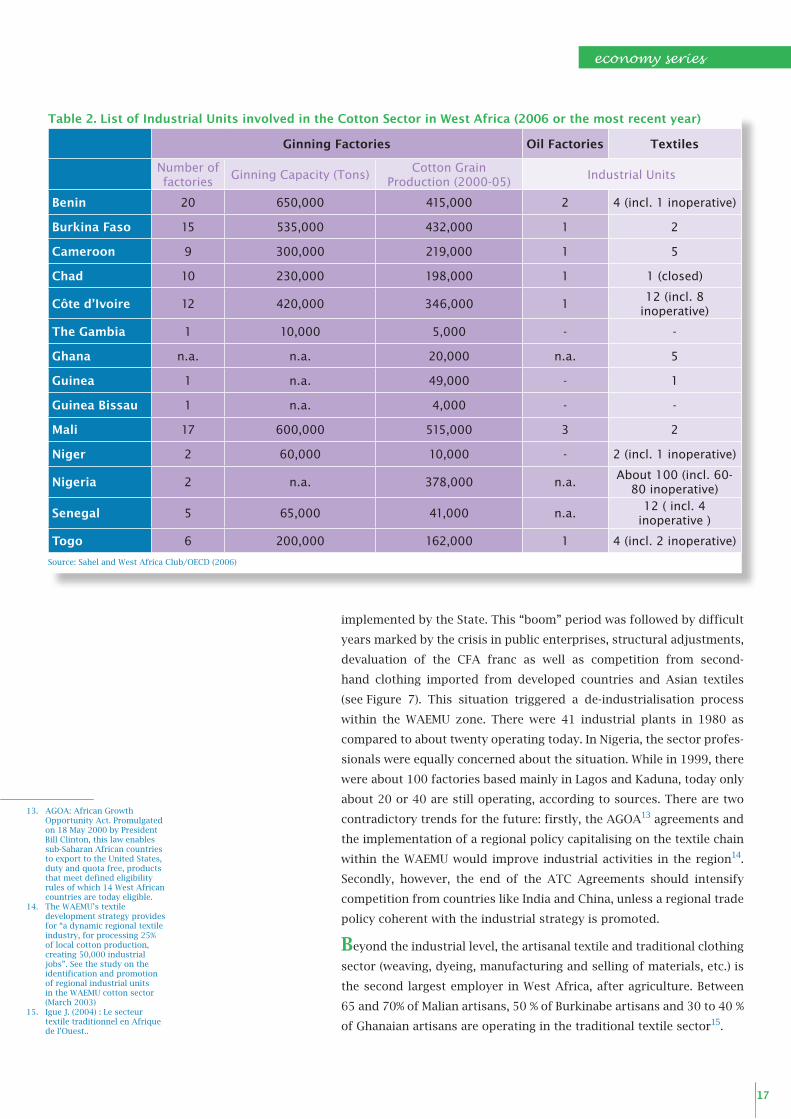
Table 2. List of Industrial Units involved in the Cotton Sector in West Africa (2006 or the most recent year)
Ginning Factories Oil Factories Textiles
Number of factories
Ginning Capacity (Tons)Cotton Grain
Production (2000-05)Industrial Units
Benin 20 650,000 415,000 2 4 (incl. 1 inoperative)
Burkina Faso 15 535,000 432,000 1 2
Cameroon 9 300,000 219,000 1 5
Chad 10 230,000 198,000 1 1 (closed)
Côte d’Ivoire 12 420,000 346,000 112 (incl. 8
inoperative)
The Gambia 1 10,000 5,000 - -
Ghana n.a. n.a. 20,000 n.a. 5
Guinea 1 n.a. 49,000 - 1
Guinea Bissau 1 n.a. 4,000 - -
Mali 17 600,000 515,000 3 2
Niger 2 60,000 10,000 - 2 (incl. 1 inoperative)
Nigeria 2 n.a. 378,000 n.a.About 100 (incl. 60-
80 inoperative)
Senegal 5 65,000 41,000 n.a.12 ( incl. 4
inoperative )
Togo 6 200,000 162,000 1 4 (incl. 2 inoperative)
Source: Sahel and West Africa Club/OECD (2006)

1�
tlas on Regional Integration A in West Africa
IV. A Doubly Regional Future
The position of West Africa on the international market and the
development prospects of the cotton sector at the regional and interna-
tional levels depend on a number of internal and external factors
(emergence of new producing countries, development of biotechno-
logical cotton, competition from synthetic fibres, euro/dollar exchange
rates, oil prices, etc.). Among these factors, the fight against agricultural
subsidies constituted a major and highly-publicised challenge for West
African cotton. The results obtained from the Doha Round Negotiations
on cotton are relatively encouraging. West African countries, in collab-
oration with representatives of NGOs and professional organisations,
have proven their ability to influence decisions made by international
bodies. According to an official WTO communiqué issued during the
Hong Kong Ministerial Conference in December 2005:
All forms of export subsidies for cotton will be eliminated by
developed countries in 2006;
On market access, developed countries will give duty and quota free
access for cotton exports from the least developed countries (LDCs)
from the commencement of the implementation period;
Members agree that the objective is that, as an outcome of the negoti-
ations, trade distorting domestic subsidies for cotton production be
reduced more ambitiously than under whatever general formula is
agreed and that it should be implemented over a shorter period of
time than generally applicable. We commit ourselves to give priority
in the negotiations to reach such an outcome.
economy series
1�
AFD (2006) La fin des quotas textiles. La lettre des économistes de l’AFD, n°11, janvier 2006, Paris.
Baffes John (2004) Cotton. Market setting, trade policies, and issues. World Bank Policy Research, Working paper 3218, February 2004, Washington DC.
CEDEAO (2004) Cadre de politique agricole pour l’Afrique de l’Ouest. ECOWAP. Document de référence pour la première phase de consultations nationales. Juillet 2004.
Cheng Fang, Bruce A. Babcock (2003) China’s cotton policy and the impact of China’s WTO accession and Bt cotton adoption on the Chinese and U.S. cotton sectors. Working paper 03-WP-322, Center for agricultural and rural development, Iowa State University, January 2003, Iowa.
Club du Sahel (1998) L’économie locale de Sikasso, Mali. Etude de cas du programme « Relance des activités locales en Afrique de l’Ouest ». Club du Sahel/OCDE, juillet 1998, Paris.
CIRAD (2006) Dossier Coton. See: http://www.cirad.fr/fr/regard_sur/coton.php
CIRDES (2003) Traction animale et stratégies d’acteurs : quelle recherche, quels services face au désengagement des États ? Atelier international d’échange, 17-21 novembre 2003, Bobo Dioulasso.
Dahou K., Dahou T. et Gueye C. (2002) Espaces frontaliers et intégration régionale. Le cas de SKBo. Enda Tiers Monde, Dakar.
Dagris (2005) Production cotonnière africaine – Campagne 2004/05. Note de conjoncture n°8, novembre 2005, Paris.
FAO (2003) Medium-term Prospects for Agricultural Commodities, Committee on Commodity Problems, 64th Session, 18-21 March 2003, Rome.
Estur Gérald (2005) Situation et perspectives du marché mondial du coton. CCIC, 8 avril 2005, Washington.
Estur Gérald (2005) The competitiveness of African Cotton on the World Market. ICAC, January 2005, Washington.
Fok Michel (2005) Coton africain et marché mondial : une distorsion peut en cacher une autre plus importante. Colloque Agence universitaire de la francophonie. Filières d’exportation de produits agricoles du Sud : réformes institutionnelles, négoci-ations internationales et impacts socio-démographiques, 6 et 7 avril 2005, Bamako.
Goreux Louis, Macrae John (2003) Réformes des filières cotonnières en Afrique subsaharienne. Juillet 2003, Ministère des Affaires étrangères, juillet 2003, Paris.
Harsmar M. (2004) Indigenous institutions – Constraint or refuge? The case of agricultural dynamism at the Mossi Plateau in Burkina Faso. Unpublished report. Sweden.
Bibliography
16. According to current projections, Chinese cotton demand and imports should remain high until 2010. West Africa seems to have accounted for this change: 46% of its cotton was exported to China in 2004, contributing to nearly 20% of the total cotton imports of China. Can this situation be sustained? Will West Africa benefit from this new situation?
The main lesson from the process carried out within the WTO is
that it is absolutely necessary to reach a regional understanding.
This cooperation, which directly involved four West African cotton-
producing countries (Benin, Burkina Faso, Chad and Mali), should be
extended to other West African producing countries. Speaking as one,
these countries would be in a position to defend the interests of this
third world exporter, namely West Africa. The future, therefore, belongs
to a Common Cotton Policy facing the challenges of the international
market, particularly China16; and also in the face of the challenge of the
“rebirth” of the textile industry in the region.
The future of West African cotton will also depend on the its cost/
quality ratio, on the sustainability of the its systems and the capacity
of West African cotton sectors to organise themselves to meet growing
demand. An approach to these challenges at the level of the cotton zone,
i.e. cross-border basin, deserves particular attention, in that regard.
The future of West African cotton may, therefore, be perceived as
“doubly regional”; that is, as regional at the “macro” level so that West
Africa can capitalise on its position internationally, as well as regional at
the more “micro” level of the cross-border production basins.

�0
Chapter produced by Christophe Perret under the supervision of Laurent Bossard Assistant: Sylvie Letassey; Layout: Marie Moncet Photos: UNESCO: Alfred Wolf, T. Joffroy/CRATerre-EAG ;World Bank: Arne Hoel, Ray Witlin, Curt Carnemark; USAID; Wikipedia
ECOWASExecutive Secretariat
60, Yakubu Gowon Crescent,Asokoro District, PMB 401
Abuja – NigeriaTel: +234-9-31 47 647-9Fax: +234-9-31 43 005
Web site: www.ecowas.int Contact: [email protected]
SWAC/OECD2 rue André-Pascal
75775 Paris Cedex 16 - FranceTel: +33 (0)1 45 24 78 55Fax: +33 (0)1 45 24 90 31
Web site: www.oecd.org/sahContact:
Igue John (2003) Le secteur informel en Afrique de l’Ouest : Le cas du tissu traditionnel. Dans L’Afrique de l’Ouest dans la compétition mondiale. Quels atouts possibles ? J. Damon et J.O. Igue (eds) Karthala/CSAO-OCDE.
Lagandre Damien (2005) Le secteur cotonnier en zone franc, entre succès et dépendance. AFD, Rapport thématique Jumbo, septembre 2005, Paris.
MacDonald Stephen, Vollrath Thomas (2005) The forces shaping World cotton consumption after the Multifiber Arragement. USDA, Electronic outlook report from the economic research service, April 2005.
Ministère de la Coopération et du Développement (1991) Le coton en Afrique de l’Ouest et du Centre. Situation et perspectives. Groupe de travail de la Coopération française, Paris.
Nubukpo Kako (2004) L’avenir des filières cotonnières ouest-africaines : quelles perspectives après Cancun ? Communication à la Commission Economique de la Francophonie, 7 avril 2004, Paris.
OECD (2004) A New World Map in Textiles and Clothing: Adjusting to Change. Organisation for Economic and Development Cooperation (OECD), Paris.
Orsena Erik (2006) Voyage aux pays du coton. Petit précis de mondialisation. Fayard édition, Paris.
Perrin Serge, Lagandre Damien (2005) Le coton africain face à la concurrence du marché mondial. AFD, Rapport thématique Jumbo n°6, septembre 2005, Paris.
See: http://www.unctad.org/sections/dite_fdistat/docs/china_ebrief_en.pdf
Sahel and West Africa Club (2005) Economic and social importance of cotton in West Africa: role of cotton in development, trade and livelihoods. SWAC/OECD, november 2005, Paris.
Sow Hamed (1999) L’industrie textile dans les pays de l’UEMOA. Centre pour le développement de l’entreprise (CDE). Partenariat n°41, mars-avril 1999.
See: http://www.cde.int/files/pubs/13/Partenariat41.pdf
UEMOA (2003) Étude d’identification et de promotion d’unités industrielles régionales dans la filière coton de l’UEMOA, UEMOA mars 2003.
UNCTAD (2005) Infocomm, market information in the commodities areas. Cotton production. See: http://r0.unctad.org/infocomm/anglais/cotton/market.htm
UNCTAD (2005) Infocomm, market information in the commodities areas. Uses.
See: http://r0.unctad.org/infocomm/anglais/cotton/Uses.htm
Valderrama Becerra Carlos A. (2004) The world cotton market: a long-term outlook. ICAC, WTO African Regional Workshop on Cotton, March 23-24, 2004, Cotonou.
Zoundi J.S., Hussein K., Hitimana L. (2006) Libéralisation de la filière coton et innovation agricole en Afrique de l’Ouest. Dans Cahiers Agriculture, vol. 15, n°1, janvier-février 2006.
CIRAD. Dossier coton : http://www.cirad.fr/fr/regard_sur/coton.php
Dagris. Informations sur le coton http://www.dagris.fr/infocoton.html
FAO. Land and Water Development division : http://www.fao.org/ag/agl/default.stm
FAO. Global Information and Early Warning System (GIEWS) : http://www.fao.org/giews/english/spot4/waf/index.htm
International Cotton Advisory Committee. http://www.icac.org
IZF. http://www.izf.net
Sahel and West Africa Club (SWAC/OECD). Addressing the cotton crisis in West Africa: http://www.oecd.org/document/2/0,2340,en_2649_34639_30751390_1_1_1_1,00.html
UNCTAD. Market Information in the Commodities Area – Cotton: http://r0.unctad.org/infocomm/anglais/indexen.htm
UNSTATS. Database Comtrade. http://unstats.un.org/unsd/comtrade/default.aspx
USDA. Foreign Agricultural Service (FAS) http://www.fas.usda.gov
WTO. The Cotton Sub-Committee: http://www.wto.org/english/tratop_e/agric_e/cotton_subcommittee_e.htm
Websites