Embed Size (px)
Citation preview

ECOWAS-SWAC/OECD©2007 – July 2007
1. Robusta is used mainly for producing soluble coffee. Its second use is in the preparation of Arabica/Robusta mixtures for inexpensive coffees.
economy series
Coffee
CLUB DU SAHEL ET DE L’AFRIQUE DE L’OUEST
SAHEL AND WEST AFRICA CLUB
Introduction
West Africa was “conceived” for the most part by the colonizers
seeking suppliers of agricultural raw materials. The Office du Niger
(initially set up for cotton), the groundnut basins in Senegal and
northern Nigeria, cotton basins, rubber tree and oil palm plantations
were responsible for shaping the rural landscape, fostering the
development of towns, redistributing the population and sometimes
even defining borders of future nations states.
Coffee and cocoa are emblematic of this history. Often considered
inseparable, grown in the same areas, both dependent on the London
and New York stock exchanges, subject to speculative global markets, they are two topic-
specific chapters of the Atlas on Regional Integration in West Africa.
I. Global Overview
1.1 More Robusta
There are two kinds of coffee: Arabica (Coffea arabica), cultivated at higher altitudes,
and Robusta (Coffea canephora), better adapted to hot, humid regions. Arabica, which
has a lower caffeine content than Robusta (1.4% and 2.5% respectively), is considered
more aromatic. It is more popular with consumers, whereas Robusta has a more intense
body1.
Since 1964, world coffee production has grown at a rate of 1.4% per year, increasing from
3.1 to 6.3 million tonnes. With a lower growth rate than Robusta (0.9% as compared to
2.7%), Arabica’s share has fallen from 4/5 to 2/3 of total coffee production over the last
40 years (see Figure 1 and Map 1). Arabica is far more sensitive to climatic conditions and
therefore subject to greater fluctuations in its production from year to year.
tlas on Regional Integration A in West Africa
The Atlas on Regional
Integration is an ECOWAS —
SWAC/OECD initiative, financed
by the development co-operation
agencies of France, Switzerland
and Luxembourg. Divided into
four series (population, land,
economy, environment), the
Atlas chapters are being
produced during 2006-2007 and
will be available on-line on the
site www.atlas-westafrica.org

�
tlas on Regional Integration A in West Africa
Arabica was the first coffee ever grown. It prefers cool climates without frost and grows best in mountainous tropical regions. It can be found in East Africa's high plateaus, Central America's volcanic slopes and South America's Andean hillsides. However, there are some production areas that are not located at high altitudes, particularly in Brazil.
Robusta is produced by Coffea canephora. It prefers hot and humid equatorial climates, where cocoaand bananas also grow. It does not grow well at high altitudes. The West African plains, Vietnam and Indonesia are major production zones.
Source: CIRAD (2003)
Coffee producing countries
Source: ICO (2007)
Arabica Predominantly Arabica
Robusta Predominantly Robusta
1960-64
2000-04
Arabica and Robusta Production
(in thousand 60-kg bag) 65,000 117,000
© Sahel and West Africa Club / OECD 2007
Map 1. World Arabica and Robusta Production
Figure 1. World Coffee Production
0
20
40
60
80
100
120
140
196
0
196
5
1970
1975
198
0
198
5
199
0
199
5
20
00
20
05
60%
75%
90%
Source: USDA
% Arabica / Total
Total
Arabica
Robusta
In millions of 60-kg bags

economy series
�
1.2 The Rise of Brazil and Vietnam
Africa’s predominance in the early 1960s is giving way to the rise of
Asia and Latin America. With the increased growth in coffee production
in Asia and South America (see Figure 2) there is also relative stagnation
and perhaps even a decline in production in other regions of the
world. This is due to high production costs, a series of crises2 and the
development of alternative crops (palm oil, rubber and cocoa) that are
more profitable and, more importantly, less labour-intensive.
As of 1975, there was a spurt in Brazil’s Robusta production, which
stabilised in the early 1990s. This was followed by Vietnam’s entry into
Figure 2. World Coffee Production Trends
2. Years during which coffee prices in New York (Arabica) and London (Robusta) remained very low. For Robusta, the years were: 1981-1983, 1986, 1990-1995 and 2000-2005. For Arabica, the years were: 1981-1982, 1987-1988, 1990-1995 and 2001-2006.
Box 1. Constraints linked to rising production
Up to 80% of coffee cultivation is carried out on small family farms whose revenue depends greatly on their production. Average yields for Robusta and Arabica are 485 kg/ha and 600 kg/ha respectively, while plant material production potential is assessed at 1,000-1,200 kg/ha indicating a relatively low level of intensification. Improving average yields is one solution for increasing overall production. However, the biggest producers (Brazil and Colombia in the case of Arabica, and Vietnam in that of Robusta) achieve yields that are higher than or equal to global averages. A second way of increasing production is to increase cultivated areas.
Coffee cultivation is highly labour-intensive. On average, 250-300 work days are required to produce 1 tonne of coffee of which around 80% are devoted to harvesting (daily wage labour). Hence, labour costs are a large part of production costs. Not much of the labour involved can be mechanised, particularly in the case of Arabica, which is essentially grown in mountainous regions with high population densities. Brazil is an exception, with conditions enabling almost total mechanisation of cultivation. There are various constraints to increasing Arabica coffee production. Most Latin American countries incur high labour costs and there is significant pressure on land resources, whereas for Robusta, it is not so much pressure on land, but labour availability that often proves a major problem. Finally, increased growth would require easy and low-cost access to financial resources.
0%
25%
50%
75%
100%
1960-64 1999-04 1960-64 1999-04
Arabica Robusta
South America
Central America
Africa
Africa
Asia
South America
Source: USDA

�
tlas on Regional Integration A in West Africa
820
3,100
1,040
930220
135
1,410
290 2,740
1,580
285
820
Europe
North Africa & Middle East
NAFTA
Central America and Carribean
South America Sub-saharan
Africa
Asia
Source: ICO (2007) © Sahel and West Afr ica Club / OECD 2007
Importing countries
Exporting countries
Coffee production
Coffee consumption
2000-04 Averge (In thousand tonnes)
the global market, which led to a significant fall in Arabica’s share in
global supply.
1.3 Demand is concentrated in the North
Since man “domesticated” its production (probably around the 15th
century in Arabia), coffee has been used solely as a beverage, after roasting
and grinding. It has been prepared and consumed in many different ways
over time (decoction, infusion, filtration, percolation, etc.) but there has
not been any real innovation, except for soluble (instant) coffee. Global
demand is relatively insensitive to price variations, although price hikes,
such as those in 1977 or 1997-98, do lead to a fall in consumption. In
fact, coffee consumption is strongly linked to revenues.
Though produced in the South, coffee is mainly consumed in the
North. World consumption3, around 5.1 million tonnes of green coffee,
is essentially concentrated in Western Europe, North America and
Japan (79%), the main importing member countries of the International
Coffee Organisation4. In the context of global consumption (see Map 2),
member countries import approximately 59.6% whereas non-member
countries import 15.8%, while the remainder (24.6%) represents domestic
consumption in exporting countries, the highest being in Brazil and
Ethiopia.
3. According to the International Coffee Organisation (ICO), world consumption is defined by the actual consumption of importing member countries added to the net imports of non-member countries. Global consumption is the combination of world consumption and domestic consumption in exporting member countries.
4. Member countries are signatories of the International Coffee Agreement. They are divided into consuming countries or importing countries (32) and producing countries or exporting countries (45). See http://www.ico.org/listmembers.asp. Together (producers and consumers), they define the ICO’s strategies to tackle the challenges facing the world coffee sector through international cooperation.
Map 2. World Coffee Production and Consumption

economy series
�
1.4 The Emergence of New Markets
The annual growth in world consumption between 1965 and 2004 is
estimated at 1.7%, i.e. higher than the growth in production (1.4%). It
was particularly high in non-ICO member countries (+ 3.5%), especially
the new European Union member countries and the former Soviet
bloc countries (see Figure 3). Non-member countries are not bound
to comply with the ICO’s recommendations and generally purchase
lower quality coffees, therefore at lower prices (or those not included
in quotas up to 2000). This partially explains the relatively higher rise
in consumption in these countries as compared to member countries.
Along with the increase in purchasing power, consumption in these
countries is likely to intensify further over the next 25-30 years. In
Figure 3. Coffee Consumption
Figure 4. Per Capita Coffee Consumption
0
20,000
40,000
60,000
80,000
100,000
120,000
140,000
196
0
196
5
1970
1975
198
0
198
5
199
0
199
5
20
00
20
05
OC
WC
IM
EXNM
Overall consumption (OC), World consumption (WC), non-members (NM), importers (IM), exporters (EX)
Sources: ICO & USDA
Arabica
Robusta
In thousands of 60-kg bags
3
3.5
4
4.5
5
5.5
6
1993 1994 1995 1996 1997 1998 1999 2000 2001 2002
kg green coffee per capita
West Europe
USA
Other importing member countries
Source: F.O. Licht

�
tlas on Regional Integration A in West Africa
Western Europe and the USA consumption increased only by 1.2%
and per capita consumption is decreasing due to competition from
sweetened and flavoured drinks, especially among the youth, or due to
its purportedly harmful effects on health5 (see Figure 4).
1.5 Future Prospects
World consumption could reach 7.6 million tonnes and global
consumption almost 10 million tonnes by 2025, with production at
9.4 to 9.8 million tonnes. If domestic consumption growth in producing
countries continues at the present pace (+1.5%), there could be a shortfall
in supply.
At a constant growth rate, Robusta production should increase by
1.75 million tonnes and that of Arabica by almost 1 million tonnes.
Robusta’s share would then increase to 46% of the world market, which
would lead to Robusta partially replacing Arabica6. This is an acceptable
assumption given the progress in research on aromas and decaffeination
techniques to exclude organic solvents despite consumer preference for
Arabica.
If this assumption proves true, it would be favourable to African
countries. It all depends on the responsiveness of national authorities
and networks (access to demand-related information and technological
progress in the industry) and the incentives offered by producing
countries, if any. This scenario is predicated on the improvement of
cropping practices on existing, relatively young plantations7 where
production can be doubled rapidly (5-10 years). It also depends on the
replacement of aging plantations8 with improved planting material. Over
75% of low-production plantations (< 250 kg/ha) would then have to be
replanted in Angola, Cameroon, Côte d’Ivoire and the DRC. Finally, this
5. Caffeine is considered a stimulant – even a potentially addictive drug. Coffee is sometimes held responsible for cardio-vascular incidents.
6. A second hypothesis is based on the continuance of the current ratio, i.e. 1/3 Robusta and 2/3 Arabica, with an average 1.4% increase in production. In that case, Arabica production would have to increase by 1.5 million tonnes and Robusta’s by 0.8 million tonnes to meet demand.
7. Less than 20-25 years.8. More than 25-30 years.
Figure 5. World Prices and Production
0
50
100
150
200
250
1960
1963
1966
1969
1972
1975
1978
1981
1984
1987
1990
1993
1996
1999
2002
2005
In hundred US Cents/lb
60
70
80
90
100
110
120
130In million bags
Production: average mobile over 5 years
Robusta prices
Arabica prices
Marked Differential
Sources: Marchés tropicaux et méditerranéens and ICO
economy series
�
would also call for increasing the cropped area by improving formerly
fallow and/or virgin land. Hundreds of thousands of hectares in Sub-
Saharan Africa could prove highly promising, though there are labour-
related constraints (it takes 1 man/year to produce 1 tonne of coffee)
along with those stemming from the isolation of some landlocked
countries (the Central African Republic, for example).
II. International Trade
2.1 Market and Prices
Relatively stable between 1960 and 1975, world market prices9 were
very volatile between 1975 and 2005. Rising prices led to an increase in
supply after a 3 to 5 year gap, which resulted from the time taken to set
up new cultivation areas or revive plantations that had been neglected
during the crisis. On the other hand, falling prices led to a relatively
rapid drop in production (and quality). Planters only harvested the most
productive fields, neglected maintenance and even gave up all or part of
their coffee plantations..
Until the mid-1980s, the price differential between Robusta and
Arabica was relatively small as the Robusta demand by the instant
coffee industry remained high. Robusta’s attractive price as compared
to natural Arabica10 led countries like Brazil and Vietnam to produce
this type of coffee. This resulted in an increase in the price differential.
Above all, the crises had greater impact on Robusta producing countries.
Therefore, the price differential penalised Robusta growers despite lower
production costs. On the whole, Brazilian and Vietnamese producers
were better paid for their Robusta than West African growers (see Figure
6), undoubtedly contributing to the decline of coffee plantation in West
Africa and the growth of Robusta in Vietnam and Brazil.
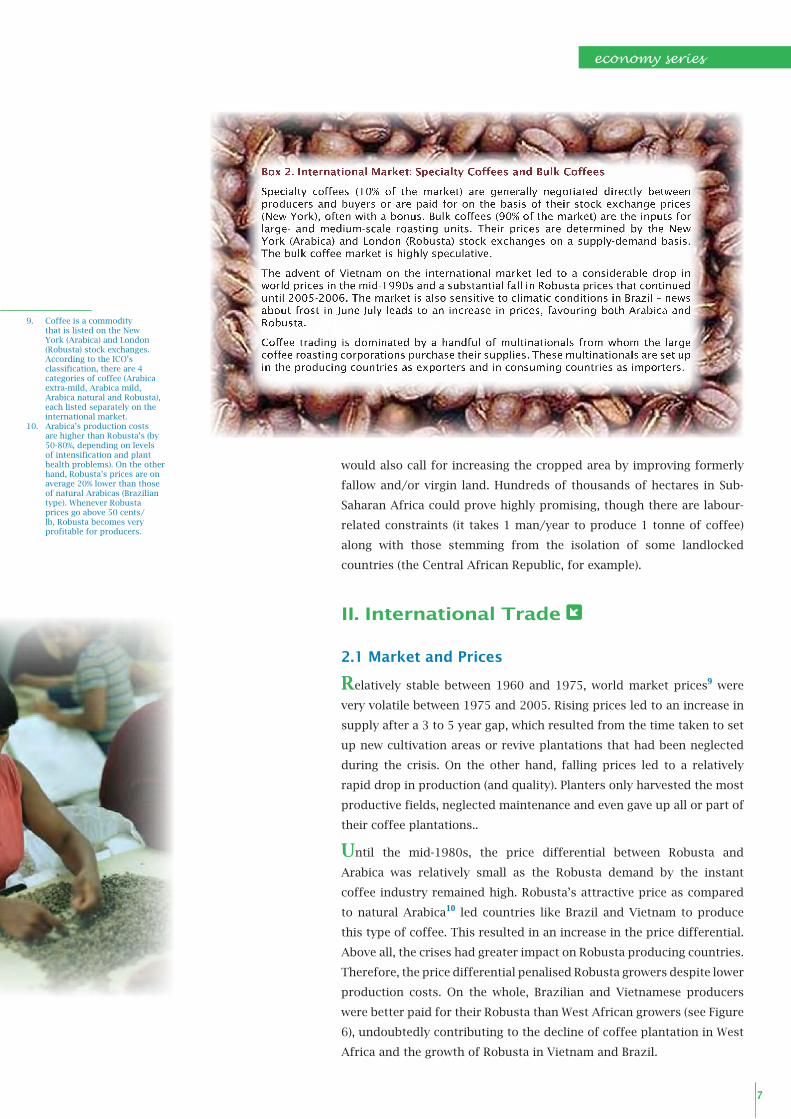
Box 2. International Market: Specialty Coffees and Bulk Coffees
Specialty coffees (10% of the market) are generally negotiated directly between producers and buyers or are paid for on the basis of their stock exchange prices (New York), often with a bonus. Bulk coffees (90% of the market) are the inputs for large- and medium-scale roasting units. Their prices are determined by the New York (Arabica) and London (Robusta) stock exchanges on a supply-demand basis. The bulk coffee market is highly speculative.
The advent of Vietnam on the international market led to a considerable drop in world prices in the mid-1990s and a substantial fall in Robusta prices that continued until 2005-2006. The market is also sensitive to climatic conditions in Brazil – news about frost in June-July leads to an increase in prices, favouring both Arabica and Robusta.
Coffee trading is dominated by a handful of multinationals from whom the large coffee roasting corporations purchase their supplies. These multinationals are set up in the producing countries as exporters and in consuming countries as importers.
9. Coffee is a commodity that is listed on the New York (Arabica) and London (Robusta) stock exchanges. According to the ICO’s classification, there are 4 categories of coffee (Arabica extra-mild, Arabica mild, Arabica natural and Robusta), each listed separately on the international market.
10. Arabica’s production costs are higher than Robusta’s (by 50-80%, depending on levels of intensification and plant health problems). On the other hand, Robusta’s prices are on average 20% lower than those of natural Arabicas (Brazilian type). Whenever Robusta prices go above 50 cents/lb, Robusta becomes very profitable for producers.

�
tlas on Regional Integration A in West Africa
2.2 Trade
south America exports 42% of the coffee produced in the world, followed
by Asia (24%) and Africa (16%). Excluding West African countries, Africa
has a 10.5% share of the global market and its coffee is exported mainly
42.1%
13.9%
4.2%
10.5%
5.6%
23.7%
North America
Europe Asia
Non MemberCountries
Source: FO Licht © Sahel and West Africa Club / OECD 2007
13.9%Volume (%) of exports perproduction zone
Main coffee export flows
Soluble industry in producing countries
Map 3. World Coffee Exports
Figure 6. Global Market Prices and Farm Gate Prices Paid to Producers
US Cents/lb
Source: ICO
10.00
15.00
20.00
25.00
30.00
35.00
40.00
45.00
50.00
55.00
2000 2001 2002 2003 2004 2005
Global prices
Brazil
Vietnam
Côte d'Ivoire
Togo

economy series
�
to Europe and non-ICO countries (see Map 3). West Africa’s share of
the market is less than 6%, apportioned between Europe and ICO non-
members. The region’s countries have lost part of their market share
since the 1960s. In the early 1960s, North America imported 55,000 to
60,000 tonnes of coffee from Côte d’Ivoire and Cameroon, whereas in
the 2000s, trade statistics indicate no imports from West Africa.
over 95% of coffee exported by producing countries is exported as green
coffee (see Map 3). Producing countries export barely 4% of their coffee in
the form of soluble coffee and have a very low share of roasted coffee11.
Only a few producing countries have developed their own soluble coffee
industry: Brazil, Colombia, Ecuador, Thailand and the Philippines being
Figure 7. Types of Coffee Exported
Box 3. A fairly new crop for Africa
Arabica, originating from Ethiopia’s high plateaus, was first planted in Yemen in the early 15th century. Imported by Istanbul in the mid-16th century, coffee consumption slowly spread to all of Europe in the 17th century. Arabica was introduced to Java around 1690 and developed in the New World in 1720 – first in the Caribbean, then Brazil, followed by Central America. In the 19th century, Europe started receiving supplies from Latin America. Europe’s mighty nations were building their colonial empires during the same period, particularly in Africa, and began introducing Arabica. Unfortunately, it did not adapt to West and Central Africa’s hot and humid areas. At the same time, new species of coffee plants were discovered in West Africa and the Congo basin (Coffea liberica and Coffea canephora) and these gradually started being planted in order to lower dependence on Latin American imports. Hence, coffee plants of African origin did not begin spreading across the continent until much later.
Afr
ica
NA
FT
A
So
uth
Am
erI
ca
Asi
a
0%
20%
40%
60%
80%
100%
Roasted Coffee
Soluble
Green
Exporting Countries Importing Countries
Europe
NorthAmerica
Asia
Source: FO Licht
11. Drying and dehusking is generally undertaken on the plantation. The main industrial processes conducted in producing countries consist of ensuring that all the coffee delivered by growers, of whatever grade, is in compliance with international trading standards, which includes cleaning to eliminate dust and other undesirable material, sorting to eliminate defective beans likely to affect taste quality and grading according to bean size.

10
tlas on Regional Integration A in West Africa
the most important. West Africa has only one soluble coffee manufac-
turing plant in Côte d’Ivoire with a capacity of 15,000 tonnes of green
coffee per year.
several coffee producing countries have attempted to sell roasted coffee
for export. Apart from roasting for domestic consumption, the process
remains largely marginal for exports and is limited to special coffees.
This process is technically difficult as costly promotional tools have to
be set up while there is fierce competition from large multinationals that
are offering mixtures rather than pure original coffees. Multinationals
offer consumers a coffee with the desired sensory characteristics that
remain as constant as possible over time in order to maintain their
market share which is achieved by optimising mixtures of different
origins.
Europe imports 53% of the coffee produced, followed by North
America (26%). The rest is shared between Asia and non-ICO members.
Unlike producing countries, importing countries process green coffee
into roasted and ground coffee or soluble coffee. Europe consumes
92.4% of its imports and re-exports 7.6% in the form of green coffee
(55%), roasted coffee (13%) and soluble coffee (32%). Green coffee is
generally unloaded in Hamburg and Rotterdam’s ports (less in The
Hague and Trieste). It is then re-exported to non-member European
countries, such as Russia or the former Soviet bloc countries, or else to
member countries. North America re-exports 1.8% of its imports while
Asia re-exports 6.9% (see Figure 7).
Figure 8. Coffee Production in Africa (2000-04 Average)
0.00.00.1
2.2
2.84.76.26.3
18.619.221.422.522.7
43.6
51.1
175.7
0.6
0.0
2.01.8
2.7
8.3
50.7
169.8
229.1
0 50 100 150 200 250
BeninEquat Guinea
GabonCongoLiberiaGhana
Sierra LeoneAngolaNigeriaMalawi
RCAZimbabwe
ZambieTogo
Guinea Rwanda
MadagascarBurundi
Congo (ex Zaire)Tanzania
CameroonKenya
Côte d' IvoireOugandaEthiopia
In thousand tonnes
Source: USDA
Total: 862,000 tonnes
0.7
1.1
1.4
196
0
196
5
1970
1975
198
0
198
5
199
0
199
5
20
00
20
05
Millions tonnes
African production trends
West Africa Other African countries

economy series
1111
Production shares of Africa’s threeproducing regions
East Africa69%
WestAfrica30%
Central Africa1%
West Africa
Central Africa
East Africa
West West
tral ntral
est AWest West West est Aest Aest Aest Aest Aest Afriest Afri
Cent
ast Aast A
West West West West West West West West
ast Aast Aast Aast A
CentCent
ast Aast Aast Aast Aast A
© Sahel and West Afr ica Club / OECD 2007
Robusta
Arabica
Source: FO Licht, ICO, USDA
Map 4. Coffee Production Regions in Africa

1�
tlas on Regional Integration A in West Africa
Figure 9. Production Distribution in West Africa
1,500 mm
Relief (meters) Coffee production zones
Over 1,000
500 - 1,000
Arabica
Robusta
Isohyet (1961-89) Less than 500 1,500
SENEGAL
MALI
NIGER
CHADTHE GAMBIA
GUINEABISSAU GUINÉA
LIBERIA
CÔTE D'IVOIRE
GHANANIGERIA
CAMEROON
BENIN
BURKINAFASO
MAURITANIA
SIERRALEONE
CAPE VERDE
TOGO
© Sahel and West Africa Club / OECD 2007Source: CIRAD (2007)
Map 5. Coffee Production Regions in West Africa
Côte d'Ivoire
67%
Togo 3%
Nigeria 1%
Sierra Leone 1%
Liberia 0,2%
Ghana 1%
Source: USDA
Cameroon 20%
Guinea 7%
Others 6%

economy series
1�
III. Coffee in West Africa
3.1 African Overview
Robusta is cultivated at low altitudes, humid equatorial and tropical
areas. Arabica prefers higher altitudes with significant differences in
day-night temperatures. For both, the biggest constraint is rainfall – as
much its quantity as its distribution. The Northern plantation limits are
generally defined by the 1,500 mm isohyet, subject to the dry season not
exceeding four months. Apart from unclean floodable soil, no special
soil types are particularly favourable.
African production declined between 1960 and 2004. From
900,000 tonnes in the early 1960s, it peaked at 1.2 million tonnes (1980-
84 average) before dropping to 865,000 tonnes at the beginning of 2000.
It currently accounts for 12.3% of global production as compared to 23%
in the 1960s (see Figure 8).
There are 26 producing countries and 3 major production regions (see
Map 4). West Africa (30% of Africa’s production) grows Robusta almost
exclusively. East Africa (69%), with the exception of Uganda, essentially
produces Arabica. Production in Central Africa12 (1%) has been declining
for several decades now. There was a sharp decrease in Angola’s coffee
production as from 1975 and in Congo as from 1992, essentially due to
political instability.
3.2 West Africa
Production Areas
Climatic conditions favour coffee growing in nine countries. Apart from
Cape Verde, these countries are spread out across two major coffee-
producing areas – one area around Côte d’Ivoire (Guinea, Liberia, Sierra
Leone, Ghana and Togo) and the other around Cameroon and Nigeria
(see Map 5). Côte d’Ivoire, Cameroon and Guinea alone produce 94% of
Africa’s coffee, i.e. about 240,000 tonnes (see Figure 9). Benin stopped
exporting coffee about ten years ago and its production no longer
manages to meet even domestic consumption, as climatic conditions
Table 1. Coffee introduction dates in West Africa
Country Plantation start dates
Côte d’Ivoire End 19th, early 20th: C.liberica
1930: Robusta
Cameroon 1913: Arabica – 1930: Robusta
Guinea 1895: Arabica – 1910: Robusta
Togo 1923: Robusta
Benin 1930: Robusta
Liberia 1875: Arabica – 1945: Robusta
Cape Verde 1790: Arabica
12. Angola, Gabon, Central African Republic, Republic of the Congo and Democratic Republic of the Congo.

1�
tlas on Regional Integration A in West Africa
are not sufficiently favourable. The Cape Verde islands produce a few
tonnes of Arabica, used only as niche coffees.
The End of the “Golden Age”
Average production today (255,000 tonnes) is less than it was in the
1960s, after peaking at almost 400,000 tonnes (see Figures 10 and 11).
In forty years, coffee’s share in agricultural product exports was down
from 17.1% to 6.4% (see Table 2), while agricultural exports rose by
more than 80%. In fact, the trend was visible in both Côte d’Ivoire and
Cameroon long before the 1990 crisis. The bankruptcy of the stabili-
sation funds set up in French-speaking countries was one of the probable
causes of this decline, but other factors also played a role. The 1983
drought highlighted the plantations’ sensitivity to climatic instability,
the preference for “cocoa” in Côte d’Ivoire, the aging of plantations and
their inadequate maintenance.
During the colonial period, while the UK promoted cocoa, France
encouraged coffee growing (see Figure 11) during the 1925-30 period,
especially in Cameroon and Côte d’Ivoire. Most plantations belonged
to small native family farms involved in mixed farming. European
plantations13 represented less than 2% of the area (see Box 4). On the eve
of their independence, Côte d’Ivoire and Cameroon respectively owned
plantations covering 600,000 and 80,000 ha. In Guinea, a support fund
was set up in 1951 and by 1960 production reached almost 15,000 tonnes
before falling drastically. The same year, Togo cultivated 20,000 ha and
produced 12,000 tonnes.
Except for coffee roasting for local markets, there is no industry
in West Africa. The only exception is the Nestlé soluble factory in
13. European plantations were monoculture plantations and used salaried labour and inputs.
Figure 10. African and West African Production Trends
Source: USDA
23,1
%
6,9%
30,0
%
22,0
%
7,5%
34,1
%
12,3
%
29,5
%
3,6%0%
10%
20%
30%
40%
World AfricaAfrica / World
(%)West Africa (%)
1960-64 1980-84 2000-04
30
,0%
economy series
1�
Côte d’Ivoire. It was set up shortly after independence with the target of
producing 10-15,000 tonnes of soluble coffee14. The coffee is exported
to neighbouring countries, the Middle East and East Africa.
3.3 The Failure of the Coffee Sector in French-speaking Countries
Côte d’Ivoire and Cameroon Before Liberalisation
Stabilisation funds were set up in 1955. Their role – initially limited
to stabilising prices for producers – was rapidly extended to the entire
sector: extension15, input supplies, infrastructure, etc. The stabili-
sation mechanism was based on guaranteeing a price to producers, a
scale of marketing charges for reimbursing and paying operators and
a guaranteed CIF (Cost Insurance Freight) price. The funds concerned
– the CSSPPA16 in Côte d’Ivoire and the ONCPB17 in Cameroon – covered
the difference between the CIF price and the sale price (either through
levies or by providing support, depending on the prevailing rates).
Although marketing was officially private, it was under tight State
control. Operators had purchase quotas in specific areas for domestic
marketing and needed to obtain the funds’ authorisation to be able to
export, but only if the Funds themselves were not marketing coffee. The
General Budget in each of these countries came from a Single Exit Tax.
Coffee grinding too was controlled and subject to the approval of the
Fund in Cameroon, while being a State monopoly in Côte d’Ivoire.
From 1960 to the mid-1980s, these stabilisation funds accumulated
surpluses that were used for the Special Investment Budget in
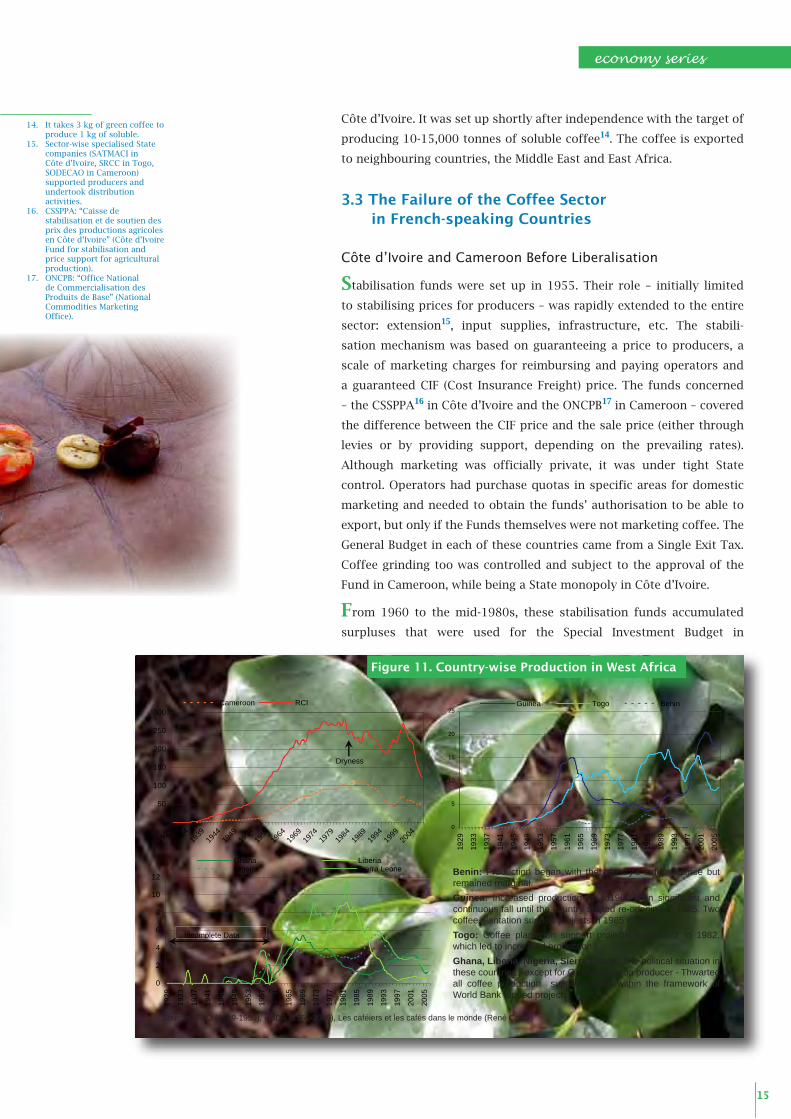
Figure 11. Country-wise Production in West Africa
14. It takes 3 kg of green coffee to produce 1 kg of soluble.
15. Sector-wise specialised State companies (SATMACI in Côte d’Ivoire, SRCC in Togo, SODECAO in Cameroon) supported producers and undertook distribution activities.
16. CSSPPA: “Caisse de stabilisation et de soutien des prix des productions agricoles en Côte d’Ivoire” (Côte d’Ivoire Fund for stabilisation and price support for agricultural production).
17. ONCPB: “Office National de Commercialisation des Produits de Base” (National Commodities Marketing Office).
0
5
10
15
20
25
19
29
19
33
19
37
19
41
19
45
19
49
19
53
19
57
19
61
19
65
19
69
19
73
19
77
19
81
19
85
19
89
19
93
19
97
20
01
20
05
Guinea Togo Benin
0
50
100
150
200
250
300
1929
1934
1939
1944
1949
1954
1959
1964
1969
1974
1979
1984
1989
1994
1999
2004
Cameroon RCI
0
2
4
6
8
10
12
19
29
19
33
19
37
19
41
19
45
19
49
19
53
19
57
19
61
19
65
19
69
19
73
19
77
19
81
19
85
19
89
19
93
19
97
20
01
20
05
Ghana LiberiaNigeria Sierra Leone
Incomplete Data
Dryness
Benin: Production began with the country's independence but remained marginal.
Guinea: Increased production up to1962 then significant and continuous fall until the country started re-opening in 1985. Two coffee plantation support projects in 1985 to 1995.
Togo: Coffee plantation support projects from 1972 to 1982, which led to increased production.
Ghana, Liberia, Nigeria, Sierra Leone: The political situation in these countries - except for Ghana, a cocoa producer - Thwarted all coffee production support efforts within the framework of World Bank funded projects.
Sources: FAO (1929-1959), USDA (1960-2006), Les caféiers et les cafés dans le monde (René Coste)

1�
tlas on Regional Integration A in West Africa
Côte d’Ivoire and production subsidies in Cameroon. But due to lack of
rational management, they were unable to support producers’ prices
when global coffee prices fell drastically at the end of the 1980s. A
benchmark study18 has shown that stabilisation surpluses should have
made it possible to support prices for 13 additional crop years in Côte
d’Ivoire and 11 additional crop years in Cameroon. In fact, the stabili-
sation funds became so indebted that planters received only half the
guaranteed price as of the 1989-90 crop year. The consequences were
immediately visible – plantations were no longer well maintained, those
that produced limited quantities of coffee were soon abandoned and
production declined on the whole (see Figure 11).
Confronted with this crisis, neither the ICO’s International Coffee
Agreement19, nor the STABEX20 were able to play any compensatory
role. The ICO abandoned the quota system in 1989. Its initial objective
was to keep prices within a specific range, thereby ensuring at least the
minimum receipts to coffee-growing States. The surpluses produced in
each ICO member country could be exported to non-member countries
18. Ministry of Cooperation, France (1993): “La compétitivité des cafés africains” (Competitiveness of African Coffees), Study Report Collection.
19. Signed in 1962, this agreement was renewed 4 times until 1983 on the basis of the quota system. The 1983 agreement was extended to 1994, at which time a fifth agreement ratifying market liberalisation was concluded. This agreement, valid until 1999, was extended to 2001, the date of the last agreement on coffee currently in force.
20. Established in 1975, STABEX (Exports stabilisation) concerned 48 agricultural commodities and compensated for the loss of export receipts suffered by all the ACP (Africa, Caribbean, Pacific) States exporting to the EEC.
Box 4. The sector in Côte d’Ivoire
About 300,000 coffee growers – the majority also producing cocoa – have plantations of 1 to 5 ha (average: 1.5 to 2 ha). The average yield is low (less than 300 kg/ha) since the plantations are old (over 25 years), poorly maintained and extensively cultivated without inputs. As most of these farmholdings are family-owned, they use paid labour only for harvesting and some heavy maintenance work. Coffee and cocoa generate a major but insufficient portion of revenue, which is why food crops occupy at least 50% of the land on farms and monopolise a large section of the labour force.
Most producers are members of a cooperative. After the harvest, coffee is dried and husked in cottage-type units or by cooperatives. Following cursory sorting, the beans are delivered to the cooperative or sold to a middleman who resells them to a bigger buyer or an exporter.
To ensure better quality control, some exporters have set up buying centres where producers and cooperatives sell their produce, provided it meets the requisite quality criteria; producers receive a quality and production bulking bonus. The soluble coffee factory in Côte d’Ivoire sources its beans from such buying centres, distributed across the entire production area.
Producer 1
Producer 2
Producer n
Exporter
Schematic flows in Côte d’Ivoire
or
or or
Cooperative
Middleman BuyerProducer X

economy series
1�
at prices that were often lower than those of the quota system. Countries
gradually started bypassing the agreement – for instance, by selling a
part of their production under another country’s quota. In addition,
the funds made available within the STABEX framework proved to be
inadequate and were not always used for stabilisation purposes.
Reforms in Côte d’Ivoire and Cameroon
In the early 1990s, the World Bank insisted on the liquidation of the
ONCPB in Cameroon and the CSSPPA in Côte d’Ivoire and for liberalising
the sector. But the two countries implemented less drastic measures.
Cameroon set up the “Office national du café et du cacao” (ONCC or
National Coffee and Cocoa Office) with modified prerogatives. An Inter-
professional Committee (the CICC) was set up to help define the sector’s
strategies. The pricing system was based on the calculation of a reference
price fixed according to the daily market prices posted in London, the
calculation of a farm price negotiated with traders and the determination
of a minimum guaranteed price for producers (farm price less industry
costs). The stabilisation system, based on the difference between the
farm price and the contract reference price, was maintained. But the
producers’ remuneration depended on world prices. Special purchasing
zones and purchase controls were abolished while the cooperative
movement was strengthened. The reform led to the disappearance of
small local exporters in favour of international companies and large-
scale exporters, capable of securing client loyalty by implementing a
quality policy.
In Côte d’Ivoire, the 1995 Agricultural Structural Adjustment
Programme (ASAP) paved the way for a series of reforms,
culminating in the complete liberalisation of the coffee-cocoa sector.
Table 2. Share of coffee in West Africa’s agricultural exports (Millions of USD)
1990-94 Average 2000-04 Average
Country CoffeeFarm
products% coffee Coffee
Farm products
% coffee
Benin 0.1 17.5 0.3% 0.0 53.5 0.0%
Cameroon 110.7 2,235.0 5.0% 73.9 2,356.6 3.1%
Côte d’Ivoire 240.8 3,320.8 7.3% 167.1 4,314.4 3.9%
Ghana 1.1 343.6 0.3% 2.0 770.4 0.3%
Guinea 6.1 11.9 51.5% 6.2 11.9 51.7%
Liberia 0.3 3.2 10.7% 0.3 4.0 6.7%
Nigeria 0.7 178.8 0.4% 0.3 381.7 0.1%
Sierra Leone 4.7 14.8 32.0% 1.5 8.4 17.2%
Togo 12.9 45.0 28.7% 4.9 45.5 10.7%
Total 377.4 2,201.6 17.1% 256.1 3,992.4 6.4%
Source: FAOSTAT
Producer 1
Producer 2
Producer n
Exporter
Schematic flows in Côte d’Ivoire
or
or or
Cooperative
Middleman BuyerProducer X

1�
tlas on Regional Integration A in West Africa
The CSSPPA continued to play a role until 1998 but no longer
monopolised export sales. Domestic marketing was fully liberalised.
Although quotas were abolished, operators had to obtain an export
permit from the CSSPPA. However, the stabilisation system, based on
an FOB reference price and a sales price, remained in force. With the
1998/99 crop year came the end of the CSSPPA, coming into effect in
2000. Two new players then came on the scene:
The ARCC (“Autorité de Régulation du café/cacao” or Coffee/Cocoa
Regulatory Authority): A public body, responsible for advising the
Interministerial Committee, regulating the sector and ensuring
proper control.
The BCC (“Bourse du café/cacao” or coffee/cocoa stock exchange):
A private body, managed by the sector’s professionals and aimed at
fulfilling operational (commercial) functions.
These organisations were supported by other organisations and
committees, creating a full-fledged inter-professional network:
The “Comité Interministériel des Matières Premières” (CIMP or
Interministerial commodity committee): Chaired by the Prime
Minister, it defined the sector’s policy and saw to the respect of the
objectives fixed by the government.
The “Fonds de Régulation et de Contrôle” (FRC or Regulatory and
Control Fund): A legal entity under private law, it was responsible for
constant control over exporters’ financial commitments, collecting
charges levied on the ARRC’s and BCC’s accounts and establishing
the price scale.
The “Fonds de Garantie des Coopératives Café-Cacao” (FGCCC or
Coffee-Cocoa Cooperative Guarantee Fund): Its mission consisted of
helping Professional Agricultural Organisations (OPA) access bank
credits.
The “Fonds de Développement et de Promotion des producteurs de
Café et Cacao” (FDPCC or Coffee and cocoa producers’ development
and promotion Fund): Set up at the producers’ initiative, it helped
producers enter the coffee/cocoa sector.
IV. Perspectives
While losing ground on the world market, Africa and West Africa’s
future is uncertain especially faced with the rise of Latin America (Brazil)
and Asia (Vietnam).
In 2025, global Robusta demand is likely to be between 3.4 and
4.3 million tonnes (2.5 million tonnes in 2004). To maintain its current
market share, West Africa would need to produce at least 575,000 tonnes,

economy series
1�
i.e. more than twice its current production. But is this minimum target,
which does not include regaining the market share lost over the last
25 years, realistic? With the same surface area, doubling the average
yield should make it possible. The situation varies depending on the
country, although intensification21 is essential for all of them:
Côte d’Ivoire’s plantations, of which at least 60% are old, are
decreasingly productive and need to be renewed22. The remaining
40% need to be regenerated23. However, the country suffers from a
shortage of manpower.
Several systems co-exist in Cameroon: intensive Robusta in the
Mongo, extensive Robusta, and Arabica compete with food crops.
Intensification is relatively recent. The resumption of maintenance
processes should provide quick results.
Guinea was not confronted with successive coffee crises to the same
extent. Its relatively young plantations are being expanded basically
by using rain-fed rice producing land that is already depleted.
Intensification is the sole option.
Togo has very limited possibilities for expanding its plantations.
Plantations were revived between 1975 and 1985. It is imperative to
at least hold on to the existing potential.
Cocoa is the priority in Ghana and Nigeria, so a spectacular growth
of coffee production is unlikely.
Liberia has considerable land reserves. The country is not densely
populated and opportunities for highly-paid work are limited.
Although more densely populated, Sierra Leone faces a similar
situation.
Admittedly, West Africa’s current share of Robusta’s global market
is not very significant (8-9%). But it could become so in the coming
20-25 years. Firstly, because coffee is a profitable crop, especially in
areas where cocoa cannot be grown (Western Côte d’Ivoire, Guinea,
Togo, etc.). Furthermore, increased freight costs have given West Africa
a comparative advantage over its competitors in the European and US
markets. Finally, there are limited possibilities for additional production
in other regions of the world.24
A minimum production target could be achieved with better plantation
productivity by 2025-2030. This will be possible if regional-level
consultation takes place, especially in the field of agricultural research
(improving varieties). In fact, with the complete liberalisation of the coffee
sector, the States could play a significant role by working on a common
agricultural policy. Coffee remains and will remain an enterprise that
can improve the West African farmers’ living conditions.
21. The first intensification level involves putting land and labour resources to the best use and is not necessarily synonymous with using inputs. Agro-forestry systems for perennial crops constitute one such constructive and sustainable solution. The second level involves intensifying foods crops in farms, thereby freeing land resources and labour for coffee.
22. Admittedly, about a dozen years of extensive cultivation have partially depleted the land but coffee plants are relatively less demanding. Replanting is possible in leguminous plant-based agro-forestry systems. In addition, an intensification policy (fighting weeds and pruning) would help cut down the surface area used and thereby select less exhausted land.
23. Coffee regeneration consists of pruning coffee plants in order to restore the tree’s ‘architecture’ and thereby raise productivity.
24. Forced Robusta cropping intensification in Vietnam compromised production sustainability in the long term. Production costs in Brazil increased and mechanising Robusta cultivation proved difficult. Indonesia had no option other than to expand the surface area at the expense of classified forest reserves, with oil palms taking over any area left free. Angola had to first clear coffee plantations of mines. Uganda, another large Robusta producer, is landlocked and has high production costs (Kampala/Mombasa transportation).

�0
Statistical Data Sources
Chapter produced by Daniel Duris (CIRAD) with the support of Christophe Perret, under the supervision of Laurent Bossard. Maps: Christophe Perret.Assistant: Sylvie Letassey, Layout: Marie Moncet.Photos: CIRAD. World Bank: Alex Baluyut, Alan Gignoux, Alfredo Srur. http://www.vert-tiges.com. http://www.satoriz.fr- Satoriz, le bio pour tous !
ECOWASExecutive Secretariat
60, Yakubu Gowon Crescent,Asokoro District, PMB 401
Abuja – NigeriaTel: +234-9-31 47 647-9Fax: +234-9-31 43 005
Web site: www.ecowas.int Contact: [email protected]
SWAC/OECD2 rue André-Pascal
75775 Paris Cedex 16 - FranceTel: +33 (0)1 45 24 78 55Fax: +33 (0)1 45 24 90 31
Web site: www.oecd.org/sahContact:
Bibliography
CIRAD (2003) Le café, des terroirs et des hommes – 16 p.CIRAD Internal Reports: Togo, Côte d’Ivoire, Cameroon, Guinea Coste, R. (1961) Les caféiers et les cafés dans le monde (Part II, 2nd volume).Daviron B. & al (2002) Commerce agricole : l’idée de libre-échange a-t-elle vécu ? In: Déméter 2002 : économie et stratégies agricoles.
Nouveaux enjeux pour l’agriculture. - Paris: Colin, 2001, pp. 9-52. Daviron, B.; Ponte, S. (2005) The coffee paradox: Global markets, commodity trade and the elusive promise of development. London, Zed
Books – 288 p.Laporte, B. (1992) Les réformes des systèmes de commercialisation et de stabilisation des filières café et cacao au Cameroun et en Côte
d’Ivoire – Paris: Ministry of Cooperation and Development – 174 p.Ministry of Cooperation, France (1993) La compétitivité des cafés africains. Study Reports’ Collection.International Coffee Organisation: International Coffee Agreement (1983, 1994, 2001).Ruf, F. (1987) Eléments pour une théorie sur l’agriculture des régions tropicales humides : de la forêt rente différentielles au cacaoyer
capital-travail. In: L’agronomie tropicale, Vol.42/no. 3, pp. 218-232.
FAO - Statistical Database FAOSTAT FO Licht: Coffee years books (2000, 2001, 2002, 2003, 2004)ICO: Consumption, imports and exports in member and non member countries
from 1980 to 2005Pan American Bureau of Coffee: Statistical series from 1958 to 1965USDA: Database (1960-2005)