Embed Size (px)
Citation preview

BROOKINGS | June 2011 1
METRO ECONOMY SERIES FOR THE METROPOLITAN POLICY PROGRAM AT BROOKINGS
Responding to Manufacturing Job Loss: What Can Economic Development Policy Do?Patricia Atkins, Pamela Blumenthal, Adrienne Edisis, Alec Friedhoff, Leah Curran, Lisa Lowry, Travis St. Clair, Howard Wial, and Harold Wolman1
This report shows how public policy and economic development strategy responded to the loss of manufacturing jobs in eight metropolitan areas: Charlotte, Cleveland, Grand Rapids, Hartford, Indianapolis, Louisville, Rochester (NY), and. Scranton. For each metropolitan area it describes the evolution of the metropolitan economy from 1980 to 2005, the area’s major economic development organizations and actors, the major policies and strategies that were adopted to try to shape the area’s economic future in the wake of manufacturing job losses, and other factors that influenced economic development in the area. The responses to manufacturing job loss in the eight metropolitan areas offer important lessons for policymakers and practitioners trying to respond to the most recent wave of manufacturing job loss in U.S. metropolitan areas.
Introduction
Despite some small gains since the beginning of 2010, the loss of manufacturing jobs remains an acute problem for the nation as a whole and especially for metropolitan areas that have depended heavily on manufacturing. Between 2000 and 2010 the United States lost more than 5 million manufacturing jobs, amounting to nearly one-third of its manu-
facturing employment. Public policymakers and economic development practitioners are interested in retaining and even increasing the number of U.S. manufacturing jobs. But not all manufacturing jobs can or should be retained, and many industrial metropolitan areas will have difficulty reversing their long-term manufacturing job losses even under the most favorable conditions. The recent crises of the U.S. auto industry and of the communities that depend on it illustrate the problem. For metropolitan areas such as those, replacing lost manufacturing jobs with others that pay high wages and serve as regional economic anchors is critical. The jobs that replace the ones that were lost may be in either services or different kinds of manufacturing.
This report examines the public policies, economic development strategies, and private business strategies that were designed help industrial metropolitan areas replace lost manufacturing jobs dur-ing the period 1980–2005. During this period the nation as a whole lost about 4.5 million manufactur-ing jobs, or about 24 percent of its manufacturing employment.2 The 1980–2005 period includes two major episodes of large-scale manufacturing job loss: the 1980s (the first decade in which the nation
BROOKINGS | June 20112
lost manufacturing jobs) and the early 2000s. The nation also lost manufacturing jobs during the 1990s but at a slower rate than in the 1980s or the early 2000s.3
We use case studies to answer the following questions about each metropolitan area.4 What roles did the public policies of state and local governments, the strategies of nonprofit economic devel-opment organizations and business groups, and the business strategies of individual firms play in influencing the economic trajectories of the metropolitan areas? What kinds of policies and strategies were adopted? What impact did they have on the metropolitan economy? What other features of the metropolitan area’s economic, social, and political environment aided or impeded the replacement of lost manufacturing jobs?
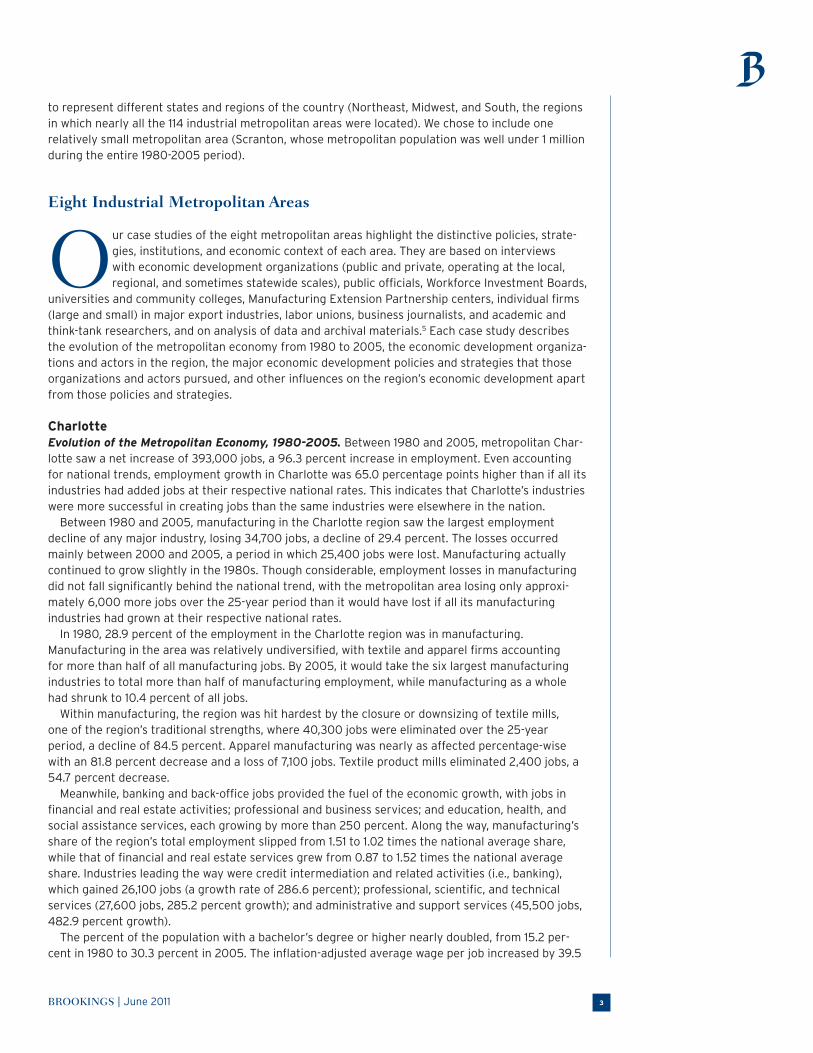
We conducted case studies in eight metropolitan areas: Charlotte, Cleveland, Grand Rapids, Hartford, Indianapolis, Louisville, Rochester (NY), and Scranton. We selected seven of these areas (all but Grand Rapids) from among the 114 industrial metropolitan areas that lost manufacturing jobs between 1980 and 2005 and had a strong specialization in manufacturing in 1980, as evidenced by manufacturing making up at least 20.1 percent of its total 1980 employment. This 20.1 percent share was 5 percent greater than the 19.1 percent of total national employment that was in manufacturing in 1980. We chose Grand Rapids for contrast with the other metropolitan areas because it had a strong specializa-tion in manufacturing in 1980 but gained manufacturing jobs over the entire 1980-2005 period while suffering severe manufacturing job losses from 2000 to 2005.
We chose the eight metropolitan areas to represent different patterns of economic growth during the 1980–2005 period (Table 1). Charlotte’s job and inflation-adjusted average wage growth were above the national average during this period, while Cleveland, Rochester, and Scranton had below-average job and wage growth. Grand Rapids, Indianapolis, and Louisville had above-average job growth but below-average wage growth. Hartford had above-average wage growth but below-average job growth. Although all eight metropolitan areas had smaller concentrations of manufacturing employment, relative to the national average, in 2005 than in 1980, we wanted to include at least one that was no longer highly specialized in manufacturing in 2005 (Charlotte, in which manufacturing’s share of total 2005 employment was less than 5 percent above the national average) as well as others that still had strong manufacturing specializations despite substantial loss of manufacturing jobs. We also sought
Table 1. Selected Economic Development Indicators for Eight Industrial Metropolitan Areas and the United States
Percent Change Percent
in Employment Change in Percent Manufacturing’s Manufacturing’s
Percent Due to Inflation- Change in Share of Total Share of Total
Change in Nationwide Adjusted Manufacturing Employment as Employment as
Employment, Industry Growth, Average Wage, Employment, Percent of National Percent of National
1980-2005 1980-2005* 1980-2005 1980-2005 Average, 1980 Average, 2005
Charlotte, NC 96.3% 31.3% 39.5% -29.4% 151% 102%
Cleveland, OH 10.2 42.7 10.5 -42.5 138 135
Grand Rapids, MI 69.4 35.9 9.0 28.0 151 214
Hartford, CT 11.4 43.2 50.1 -49.7 137 116
Indianapolis, IN 70.6 42.7 13.2 -12.3 114 110
Louisville, KY 43.5 44.4 16.7 -15.1 111 123
Rochester, NY 22.6 36.4 5.4 -44.0 170 146
Scranton, PA 22.5 33.2 17.9 -45.4 155 130
Entire United States 42.6 42.6 28.4 -24.1 100 100
*Percent change in employment that would have occurred if all three-digit NAICS industries in the region had grown at their respective national rates. This is based on
a shift-share analysis in Alec Friedhoff, Howard Wial, and Harold Wolman, “The Consequences of Metropolitan Manufacturing Decline: Testing Conventional Wisdom”
(Washington: Brookings Institution, 2010), appendix table A1.
Source: Authors’ analysis of data supplied by Moody’s Analytics.
BROOKINGS | June 2011 3
to represent different states and regions of the country (Northeast, Midwest, and South, the regions in which nearly all the 114 industrial metropolitan areas were located). We chose to include one relatively small metropolitan area (Scranton, whose metropolitan population was well under 1 million during the entire 1980-2005 period).
Eight Industrial Metropolitan Areas
Our case studies of the eight metropolitan areas highlight the distinctive policies, strate-gies, institutions, and economic context of each area. They are based on interviews with economic development organizations (public and private, operating at the local, regional, and sometimes statewide scales), public officials, Workforce Investment Boards,
universities and community colleges, Manufacturing Extension Partnership centers, individual firms (large and small) in major export industries, labor unions, business journalists, and academic and think-tank researchers, and on analysis of data and archival materials.5 Each case study describes the evolution of the metropolitan economy from 1980 to 2005, the economic development organiza-tions and actors in the region, the major economic development policies and strategies that those organizations and actors pursued, and other influences on the region’s economic development apart from those policies and strategies.
CharlotteEvolution of the Metropolitan Economy, 1980-2005. Between 1980 and 2005, metropolitan Char-lotte saw a net increase of 393,000 jobs, a 96.3 percent increase in employment. Even accounting for national trends, employment growth in Charlotte was 65.0 percentage points higher than if all its industries had added jobs at their respective national rates. This indicates that Charlotte’s industries were more successful in creating jobs than the same industries were elsewhere in the nation.
Between 1980 and 2005, manufacturing in the Charlotte region saw the largest employment decline of any major industry, losing 34,700 jobs, a decline of 29.4 percent. The losses occurred mainly between 2000 and 2005, a period in which 25,400 jobs were lost. Manufacturing actually continued to grow slightly in the 1980s. Though considerable, employment losses in manufacturing did not fall significantly behind the national trend, with the metropolitan area losing only approxi-mately 6,000 more jobs over the 25-year period than it would have lost if all its manufacturing industries had grown at their respective national rates.
In 1980, 28.9 percent of the employment in the Charlotte region was in manufacturing. Manufacturing in the area was relatively undiversified, with textile and apparel firms accounting for more than half of all manufacturing jobs. By 2005, it would take the six largest manufacturing industries to total more than half of manufacturing employment, while manufacturing as a whole had shrunk to 10.4 percent of all jobs.
Within manufacturing, the region was hit hardest by the closure or downsizing of textile mills, one of the region’s traditional strengths, where 40,300 jobs were eliminated over the 25-year period, a decline of 84.5 percent. Apparel manufacturing was nearly as affected percentage-wise with an 81.8 percent decrease and a loss of 7,100 jobs. Textile product mills eliminated 2,400 jobs, a 54.7 percent decrease.
Meanwhile, banking and back-office jobs provided the fuel of the economic growth, with jobs in financial and real estate activities; professional and business services; and education, health, and social assistance services, each growing by more than 250 percent. Along the way, manufacturing’s share of the region’s total employment slipped from 1.51 to 1.02 times the national average share, while that of financial and real estate services grew from 0.87 to 1.52 times the national average share. Industries leading the way were credit intermediation and related activities (i.e., banking), which gained 26,100 jobs (a growth rate of 286.6 percent); professional, scientific, and technical services (27,600 jobs, 285.2 percent growth); and administrative and support services (45,500 jobs, 482.9 percent growth).
The percent of the population with a bachelor’s degree or higher nearly doubled, from 15.2 per-cent in 1980 to 30.3 percent in 2005. The inflation-adjusted average wage per job increased by 39.5
BROOKINGS | June 20114
percent, while productivity grew by 86.7 percent. In 2008, the city of Charlotte had more headquar-tered Fortune 500 companies than all but five other U.S. cities.
The region’s growth was due primarily to the growth of the banking industry and of Bank of America and Wachovia in particular. State law, which permitted cross-county branch banking, gave Charlotte banks an early start on branch banking. They parlayed this head start into an aggressive and ulti-mately successful expansion strategy based on interstate branch banking. The region’s formerly pros-perous textile industry disappeared relatively quietly, with few public policies to aid it, as the region quickly established itself as the second largest financial center in the United States.
Economic Development Organizations and Actors. The two main figures behind Charlotte’s rise in banking and the push for consolidation were Hugh McColl and Ed Crutchfield, CEOs of what would eventually become Bank of America and Wachovia. McColl was named CEO of North Carolina National Bank (NCNB) in 1983. During the 1980’s, NCNB grew from a one-state bank with 172 offices in North Carolina to a franchise with 826 offices in seven states. Crutchfield became CEO of First Union Bank in 1985; like McColl, he assumed a position of leadership just as interstate banking came into existence.
In 1991, McColl, Crutchfield, Bill Lee of Duke Energy, Stuart Dickson (Ruddick Corporation), and John Belk (Belk department stores) formed the Charlotte Regional Partnership, a public/private organiza-tion devoted to attracting firms (especially foreign ones) and investment to the 16 counties in the broader Charlotte region (including some not a part of the strictly defined metropolitan area). The founders decided that the area would be more successful in attracting investment if the surrounding counties adopted a regional strategy rather than working against one another. Meeting once a month with representatives from each county, the Partnership pooled marketing resources, funneled leads to the counties, and served as a mediator around issues of regional competitiveness, such as air qual-ity and traffic management. The Partnership has been primarily devoted to external marketing and firm recruitment. Over the years since its inception, it has gradually expanded the target industries that are its focus, presently numbering eight, such as motorsports and defense; and has increased its geographic reach to its current 16 counties. As mandated by its bylaws, it is 54 percent funded from private sources; the rest comes from public sources. According to some, the Partnership has clashed with the Charlotte Chamber and at times created confusion for investors who do not see the differ-ence between the local chambers and the regional organization.
Regional oversight has in theory enabled local chambers to focus their efforts. The Charlotte Chamber of Commerce, serving Mecklenburg County and the city (with the latter comprising most of the county), is the other dominant economic development organization. It has campaigned on behalf of bond issues, advocated for the business community, and focused on attraction and retention of businesses. In 1987, the Chamber created a Manufacturers Council in response to problems with local environmental regulatory issues. The mission of the Manufacturers Council has been to advocate for manufacturers in the public arena and promote the sharing of best practices. In 2006, the Charlotte Chamber created a business retention program, Business First, which identified and assisted strug-gling businesses. Meanwhile, the Gaston County Economic Development Commission has been able to focus on manufacturing and has been cited as a source of manufacturing training.
In 1998, the Charlotte Chamber initiated the Advantage Carolina project as a strategic planning arm of the Chamber. Seventeen key initiatives would grow out of the project, including the Information Technology Collaborative and the Workforce Development Continuum. The group also identified indus-try cluster groups that would be crucial to the success of the city and Mecklenburg County, including three that were pre-existing – financial services, transportation and distribution services, high growth manufacturing – and three that represented emerging industries – innovative technology, professional services, and travel and entertainment services. A survey of employers revealed that skilled employees were seen as the least available and most needed, while low-skilled employees were in overabundance.
Major Policies and Strategies. The major strategy employed by the private sector in Charlotte was the aggressive expansion of the banks. Both McColl and Crutchfield pursued a risky strategy of consolidation, buying banks in large and fast-growing markets such as Florida, Texas, and Georgia. More conservative banks that did not follow a similar growth strategy were acquired or began to disappear.
Tom Storrs, Hugh McColl’s predecessor at NCNB, pushed for expansion into international finance in the early 1970s before most regional banks saw the opportunities abroad. In 1980, he established a
BROOKINGS | June 2011 5
task force to find ways for his bank to expand beyond state lines, even before the Supreme Court ruled that interstate banking compacts were permitted.
In 1982, NCNB led banking across state lines, fully two years ahead of any competitors. One of the companies’ attorneys, Paul Polking, found a loophole in Florida legislation that enabled NCNB to expand into Florida because it already owned a non-deposit trust company in the state. A series of changes to Southern banking laws in the mid-1980’s, which came to be known as the Southeastern Regional Banking Compact, allowed interstate mergers of banking companies, but restricted the merg-ers to companies based in the South.
The new laws permitted Wachovia to acquire First Atlanta Corp. in Georgia, a $7 billion bank with 104 branches. First Union, which would later merge with Wachovia in 2001, acquired Atlantic Banks in Jacksonville, Florida, increasing its assets to $14.4 billion. In 1988, NCNB doubled its size to $65 billion with the acquisition of First Republic Bank in Texas, a deal that was facilitated through a controversial partnership with the Federal Deposit Insurance Corporation.
The rapid expansion of the banking industry spurred private sector leaders to take steps that would enable them to attract talent to the region. In the 1980s, McColl, Crutchfield, and other power players such as Lee of Duke Energy, spearheaded public/private investments in entertainment and tourism that would make the downtown area a more appealing place to live for well-educated professionals. As early as 1973, NCNB’s annual report emphasized that improving the quality of life of the community was important to the bank and its stockholders. The poor record of educational achievement in the region meant that there simply was not enough talent in the area.
Plans for downtown development already existed; in 1966, the public and private sectors had released the Odell master plan for the redevelopment of “uptown” (as Charlotte’s downtown is called), a blueprint that envisioned a district for government and one for business, that planned housing in the city’s four wards, and that included space for entertainment facilities such as a convention center and a downtown stadium. In 1980, the Charlotte community would augment the Odell Plan with one done under the direction of the architectural firm RTKL to encourage central downtown uses that comple-mented the office towers, placing emphasis on residential units and cultural facilities that could create a safe and pedestrian-focused 24-hour central city neighborhood.
Leading the charge for downtown development was Bank of America, which started a Community Development Corporation (CDC) to acquire property and provide loans that would coax residents into the downtown area. The CDC provided mortgage funds via the Charlotte/Mecklenburg Housing Partnership, a financial intermediary, enabling prospective residents to finance purchase of a home within downtown neighborhoods, particularly within the Fourth Ward. In 1997, under McColl’s leader-ship, the Charlotte Uptown Development Corporation was refinanced and renamed the Charlotte Center City Partners, a public-private partnership that continues to invest in downtown development.
The Blumenthal Performing Arts Center opened in 1992 in conjunction with the Bank of America Corporate Center and Founders Hall, creating an open community space known locally as “The Square.” Bank of America stadium, formerly Carolinas Stadium and home to the Carolina Panthers NFL franchise, opened in 1996. The Charlotte Hornets, an NBA team, played in the 24,000-seat state-of-the-art Charlotte Coliseum between 1988 and 2002. In the early 2000s, McColl and others lured a branch of Johnson and Wales University, the hospitality and culinary arts school, to downtown Charlotte, further boosting the local tourism and hospitality industry and expanding the pool of work-force labor for this industry.
With other industries booming, there were no deliberate policies to confront the challenges facing the textile and apparel industries, although the decline of textiles and apparel may have been harder to pre-vent than that of other manufacturing industries. As the textile industry underwent a retrenchment and grew more diversified, it suffered from a lack of collaboration among local firms and a lack of support from the economic development community. Those textile firms that were unable to integrate advanced machinery and move into higher value-added product lines struggled to stay afloat. Many failed.
A lack of well-educated and technically-skilled workers handicapped the response of some manufac-turing firms. Many saw education as the region’s number one problem. In the past, many high school graduates saw a college degree as unnecessary to finding a well-paying manufacturing job. Without the necessary skills to train and switch industries, these workers were unemployable at firms that wished to utilize better technology.
BROOKINGS | June 20116
Despite the almost universal agreement that the area is business-friendly, it is unclear how effective economic development organizations have been. Some officials acknowledged being taken off guard by the sudden unwinding of the textile industry. One interview participant reported that the community had been taking orders from the textile industry and as a result was slow to diversify. Few took credit for the growth of jobs in professional services and banking. With the private sector putting its own resources into job training and recruitment, there was little incentive for the public sector to respond.
Other Influences on Economic Development. Although there is little evidence that local- or metropolitan-level public policy played a major role in Charlotte’s transformation, several institutions that were in place prior to 1980 positioned the region for growth, while others came into being after 1980. Among these were state- and national-level laws and policies.
Banking laws. While the expansion of Charlotte’s banks was due in no small part to strong leader-ship, they were aided by the state’s banking laws. The state’s liberal branching laws had existed since the early 19th century when a Wilmington bank, Bank of Cape Fear, appealed to the state legislature to open an office 90 miles away in Fayetteville. In 1814, the legislature approved the request and North Carolina, unlike other states, never saw a reason to restrict the branching of state banks.
Branch banking historically was not allowed in most U.S. states; fear of monopoly by the large north-eastern banks led most states to prohibit branching, with the result that by 1910 only 12 states per-mitted it. Given the legal authority to branch statewide, North Carolina banks learned how to acquire other banks, merge their operations, and run branch facilities. This fueled an expansionist impulse that would pave the way for the North Carolina banks to lead the trend of bank mergers of the 1980s and 1990s, when interstate banking was eventually permitted. National policies, including the Riegle-Neal Interstate Banking and Branching Efficiency Act of 1994, repealing restrictions on interstate banking and branching, and the Gramm-Leach-Bliley Financial Services Modernization Act of 1999, removing the separation between commercial and investment banking, helped facilitate the growth of the bank-ing industry nationwide and of Charlotte’s well-positioned banks in particular.
Airport. A 10,000-foot runway and control tower were opened at the Charlotte Douglas Airport in 1979, the same year that Piedmont Airlines announced Charlotte as the hub of its expanding network. Following airline deregulation, passenger numbers nearly doubled between 1978 and 1980. The exis-tence of a hub airport with international flights made the relatively small region attractive to national and international companies and was a major factor in enabling Charlotte to attract so many corporate headquarters. Quickly thereafter was growth in foreign investment along the I-85 “autobahn,” nick-named as such because of the number of German auto companies who established operations there.
The airport’s status as a hub of US Airways (after the company’s merger with Piedmont) has played a major role in its growth. As of July, 2008, Charlotte offered nonstop service to 123 cities—a high number for a city of its size. There is an average of 644 flights daily.
Auto manufacturing and NASCAR. Despite overall trends in manufacturing, there were some bright spots. Transportation equipment manufacturing saw the greatest gain in the number of jobs (3,700) of any manufacturing industry and grew by 94.9 percent. According to local legend, NASCAR originated in the Charlotte area when moonshiners were trying to out-run federal authorities. A motorsports cluster developed in the 1980s as the industry shifted from one that simply modified stock cars to one in which custom parts were manufactured using technologically sophisticated processes. This mir-rored the overall trend within manufacturing whereby the firms able to survive were those that could aggressively introduce new technology. With other areas of manufacturing declining, the motorsports industry was able to absorb a ready work force of machinists. Proximity to other teams reduced costs and attracted many racing-related businesses.
In 2008 there were more than 400 motorsports and automotive-related companies based near Charlotte. A study from the University of North Carolina, Charlotte (UNCC) Urban Institute concluded that the motorsports industry had a total economic impact in the Charlotte area of $3.9 billion in 2003 and created 18,000 jobs. The region has created an infrastructure that would be difficult to replicate elsewhere, as the majority of teams are located in the Charlotte area, as well as the major research and development facilities. NASCAR operates a $10 million, 61,000 square foot R & D center beside the Concord Regional Airport that is involved in engine research and testing. The NASCAR hall of fame opened in downtown Charlotte in May of 2010.

BROOKINGS | June 2011 7
Higher Education. When James Woodard became chancellor of UNCC in 1989, Charlotte was the largest metropolitan area without a doctoral degree-granting institution. With help from McColl and Crutchfield, Woodward started a capital campaign that would enable to university to fund new fac-ulty positions. Within four years, UNCC began to offer doctoral degrees. By 2005, when the Carnegie Foundation revised its classification system, the university was a “research-intensive” institution, behind North Carolina State and the University of North Carolina, Chapel Hill, the state’s only pub-lic research extensive institutions. The school now enrolls approximately 23,300 students, up from 16,000 in 1995, and offers 18 doctoral degrees.
While interviews frequently pointed to North Carolina’s strong higher education system, in par-ticular its community colleges, tensions between the eastern part of the state and Charlotte have left Charlotte with no public law school and as the largest city in the United State without a medical school. Although there have been plans for the University of North Carolina, Chapel Hill to expand its medical school to Charlotte on the Carolinas Medical Center campus, these plans were put on hold during the recession, and the lack of a medical school continues to stymie the growth of the health care industry in the region.
ClevelandEvolution of the Metropolitan Economy, 1980-2005. Between 1980 and 2005 metropolitan Cleve-land gained jobs at a rate of 10.2 percent, less than one-fourth the national rate. Its inflation-adjusted average wage rose by only 10.5 percent, slightly more than one-third of the national average. The well below-average growth rates of both employment and wages are consequences of the long-term loss of high-wage manufacturing jobs and slow growth of nearly all types of non-manufacturing employment. If all of Cleveland’s industries had grown at their respective national rates the metropolitan area would have seen job growth of 42.7 percent between 1980 and 2005, a rate that would have approximated the national average. This indicates that Cleveland’s job growth problem was due more to local com-petitive factors than to its specializing in the “wrong” industries in 1980.
In 1980, Cleveland had a relatively diverse metropolitan economy that was anchored by a diverse set of manufacturing industries. Manufacturing accounted for 26.3 percent of the area’s employment, 1.38 times its percentage of national employment. The largest manufacturing industries were related to auto or steel manufacturing or metalworking: transportation equipment (which consisted primar-ily of auto parts manufacturing), fabricated metal products, primary metals, and machinery. These manufacturing specializations reflect the metropolitan area’s historic role as one of the nation’s largest manufacturing centers for steel and autos in the early 20th century. As of 1983 the area was home to the headquarters of 12 Fortune 500 companies, including manufacturers of steel, paint, and appliances, Standard Oil of Ohio, and American Greetings. A large professional service complex of law, consulting, and engineering firms had developed to serve these companies, although profes-sional services’ share of Cleveland’s employment was only around the national average. Health care was also an important specialization of the metropolitan economy (making up, together with social assistance, 7.7 percent of the area’s employment, a share that was 11 percent higher than the national average). The Cleveland Clinic and Case Western Reserve University’s medical center served patients from throughout the world.
Between 1980 and 2005, Cleveland lost about 110,300 manufacturing jobs, or 42.5 percent of its manufacturing employment. This loss was far more severe than the 24.1 percent loss for the nation as a whole. The metropolitan area lost manufacturing jobs in every decade from 1980 to 2005, but these losses were more severe during the 1980s (18.4 percent loss) and especially from 2000 to 2005 (23.7 percent loss) than during the 1990s (7.6 percent loss). The largest absolute job losses during the entire 1980-2005 period were in transportation equipment, primary metals, fabricated metals, and machinery. These losses reflected the decline of integrated steelmaking in the United States, the movement of remaining steel manufacturing away from the Cleveland area, and, after 2000, the difficulties of the Detroit Three automakers, who were the primary customers of Cleveland’s auto suppliers. Overall, Cleveland’s manufacturing job losses were about equally attributable to nationwide job losses in the manufacturing industries in which the area specialized and local competitive factors; if every manufacturing industry had grown (or declined) at its national rate, Cleveland would have lost manufacturing jobs at about the national rate between 1980 and 2005 instead of at nearly twice
BROOKINGS | June 20118
the national rate. By 2005 manufacturing made up only 13.8 percent of Cleveland’s employment. That share was still 1.35 times the national average, so Cleveland remained almost as specialized in manu-facturing in 2005 as in 1980 despite its huge losses of manufacturing jobs in the intervening years.
From 1980 to 2005 Cleveland gained jobs in all major non-manufacturing industry groups except for agriculture, mining, utilities, retail trade, and information, all of which lost jobs. The largest absolute job growth was in health care and social assistance, administrative and support services, and profes-sional services. However, none of these industries added jobs in Cleveland at rates above their respec-tive national averages. The only major industry in which the job growth rate exceeded the national average was educational services. Although some service industries, such as professional services, information, finance and insurance, transportation and warehousing, and parts of health care and higher education can serve as regional export industries that have the potential to support metropoli-tan economies just as manufacturing supports them, these industries did not fill the gap left by the loss of manufacturing jobs. This may have been due to the fact that Cleveland’s professional service, information, financial, and transportation industries largely served the needs of local manufacturers and other companies headquartered in the area and were not well situated geographically to serve firms located elsewhere. As the area lost manufacturers and corporate headquarters, the export-ori-ented parts of these industries moved with them, and the remaining firms were more locally oriented.
Despite the slow growth of its service industries during the previous 25 years, Cleveland’s econ-omy in 2005 had a number of important service industry specializations. These included banking, insurance, corporate headquarters, hospitals, and educational services. Major non-manufacturing employers included the Cleveland Clinic, Case Western Reserve University and its affiliated University Hospitals and Progressive Insurance. Seven Fortune 500 companies were headquartered in Cleveland in 2003: Eaton, Parker-Hannifin, Sherwin Williams, chemical manufacturer OM Group, OfficeMax, and two banks, KeyCorp and National City.6
Economic Development Organizations and Actors. There were two major waves of institutional activity around regional economic development in the Cleveland area since 1980, one in the 1980s and one after 2000. These corresponded to the two periods when manufacturing job losses were most severe.
In 1981 a group of 50 corporate CEOs formed Cleveland Tomorrow, an organization designed to address the Cleveland area’s chronically slow job growth. CEOs were Cleveland Tomorrow’s decision-makers, but Cleveland Tomorrow established and funded (sometimes working in concert with other regional actors) a variety of separate organizations to address specific economic development con-cerns. These included the Work in Northeast Ohio Council, an independent labor-management orga-nization established in 1981 that promoted productivity programs and quality of work life programs in manufacturing industries; the Cleveland Advanced Manufacturing Program (CAMP, later incorpo-rated into the federal Manufacturing Extension Partnership’s network of centers and renamed the Manufacturing Advocacy and Growth Network (MAGNET)), a partnership established in 1984 among the state government, Cleveland Tomorrow, and local universities and the community college to help small and medium-sized manufacturers adopt new technologies and business processes; the Center for Venture Development, created and funded with grants from the Cleveland and Gund Foundations and the Greater Cleveland Growth Association to assist entrepreneurs in starting new companies; Primus Capital Fund, a venture capital fund seeded in 1984 with $30 million from Cleveland Tomorrow companies and the Ohio Public Pension Fund; and the Technology Leadership Council (later renamed NorTech), established in 1988 to promote initiatives in biotechnology, polymers, electronics, advanced materials, and other emerging high technology industries.7
Although our interviewees perceived Cleveland Tomorrow as an “effective” and “impactful” organi-zation, it was unable by itself to put the Cleveland region on a sustained growth path or to avoid the major downturn in the regional economy that began in 2000. Cleveland Tomorrow became less effec-tive over time because changes in corporate organization and location made its CEO members less able to participate personally in the organization. Many of the founding CEOs were with companies that had been acquired and/or moved. The CEOs had more demands on their time and more traveling, decreasing the personal connections among them and giving them less time to devote to civic causes. The leaders had less autonomy over corporate money if their firms became branches of larger firms. As the CEOs of the large companies became less available, professional service firms and nonprofit
BROOKINGS | June 2011 9
organizations, particularly universities and hospitals, became more important to both the regional economy and civic leadership.8
Cleveland Tomorrow and two other regional business groups, the Greater Cleveland Growth Association and the Greater Cleveland Roundtable, merged in 2004 to form the Greater Cleveland Partnership (GCP). The merger came about, in part, because the large firms that paid the most in dues to regional business groups saw a need to rationalize the region’s economic development organiza-tional structure just as they had had to rationalize their own business operations to cut costs during the early 2000s recession. In addition, according to a GCP board member, “The goal of the merger was to use savings from removing duplication to expand economic development activities.” GCP worked at a larger geographic scale than Cleveland Tomorrow, encompassing the Cleveland, Akron, and Youngstown metropolitan areas and adjacent nonmetropolitan portions of northeast Ohio.9 Unlike Cleveland Tomorrow, GCP included small firms, nonprofit organizations, law firms, and banks on its board, in addition to some large manufacturers.
Foundations have always played an important role in the Cleveland area, but that role increased markedly in the economic development arena during the past decade. The two primary foundations in the region are the Cleveland Foundation and the Gund Foundation. These two foundations have supported economic development by funding research and consultants’ reports, supporting initiatives introduced by Cleveland Tomorrow, and participating in other regional projects. After many years of struggling to make a difference in economic development in the region, often supporting bricks and mortar projects as well as various business-led initiatives, the Cleveland and Gund foundations, together with the GAR Foundation of Akron, spearheaded the creation of the Fund for Our Economic Future, a regional economic development collaboration among 70 foundations throughout northeast Ohio.
Like Cleveland Tomorrow, the Fund for Our Economic Future and GCP together funded several separate organizations to perform specific economic development tasks. Two of these, NorTech and MAGNET, were organizations that Cleveland Tomorrow had previously funded. In 2002 the two funders established JumpStart to stimulate early-stage business development and investment by providing capital, technical, and management support to promising new enterprises. In 2002 they also funded BioEnterprise, a joint initiative of the Cleveland Clinic, University Hospitals Health System, Case Western Reserve University, and Summa Health System, established to provide management counsel, clinical access, business development, and capital access services to promote the growth of new biosci-ence companies in northeast Ohio. Finally, the Fund and GCP created Team NEO in 2003 as a one-stop organization to market northeast Ohio to businesses considering locating there.
Some smaller economic development organizations are also noteworthy. During the 1980s the city of Cleveland, Cuyahoga County, and local business leaders formed and funded Gateway, a nonprofit organization whose purpose was to build new baseball and basketball stadiums in the city; it completed this work in 1994. WIRE-Net, established in 1988, is a membership organization serving Cleveland-area manufacturers. Its initial focus was on increasing infrastructure investment in Cleveland, but since 1995 it has worked on retention of firms, including related policies such as workforce development, technology development, and advocacy regarding zoning and lending.
Although there was a great deal of restructuring of economic development organizations in Cleveland between 1980 and 2005 the leaders and funders of those organizations changed much less. Foundations, smaller firms, universities, and hospitals took on a larger role in economic development funding and the CEOs of large corporations reduced their involvement, but there were no institutional actors that were entirely new to the Cleveland area.
Major Policies and Strategies. Throughout the 1980-2005 period, Cleveland’s business and founda-tion leaders commissioned consultants to study the region’s economy, adopted strategies to respond to problems identified in the studies, and funded organizations to carry out those strategies. In the early 1980s the Gund Foundation commissioned an economic study by the McKinsey consulting firm and the Cleveland Foundation commissioned a similar study by the RAND Corporation. The RAND report found no evidence that manufacturing was losing its central economic role but recommended diversification of the region’s manufacturing away from autos and steel and toward producer durables. The McKinsey report identified the loss of manufacturing jobs and the small size of growth industries as problems for the region. In response to these reports, Cleveland Tomorrow created and funded a

BROOKINGS | June 201110
suite of organizations (described above) that were designed to (a) retain manufacturing jobs by reduc-ing costs and improving productivity and (b) spur the growth of new firms and industries by providing early-stage financing to new firms and supporting the growth of high technology firms. The policy emphasis, however, was more on the retention of existing jobs than on the creation of new ones. It is difficult to know whether Cleveland would have had fewer manufacturing jobs and fewer new firms without these policy initiatives, but the initiatives themselves were not able to stop the loss of manu-facturing jobs or spur the creation of large numbers of new firms in the region.
During the late 1980s and early 1990s the strategies developed in the early 1980s remained in place but no new strategies directed at the regional economy as a whole were formulated or implemented. Instead, the late 1980s and early 1990s were a period in which the city of Cleveland under mayors George Voinovich and Michael White, with the financial assistance of business leaders and foundations, built “bricks and mortar” projects in or near downtown Cleveland. These included the Great Lakes Science Center, the Rock and Roll Hall of Fame, renovation of Terminal Tower (a major skyscraper in downtown Cleveland), the revitalization of the Playhouse Square theater district, and new professional baseball and basketball stadiums. Throughout the 1990s, as part of a downtown revitalization strategy, the city provided property tax abatements for construction projects.
The first few years of the 21st century saw a return to the earlier style of industry-focused regional economic development strategy informed by consulting reports, led by business and foundations, and carried out through separate organizations. Once again, business and foundation leaders commis-sioned a McKinsey consulting report, which identified several barriers to regional economic growth, including an underprepared workforce, high business and personal income taxes, lack of a transparent regional business attraction and marketing system, insufficient early-stage capital, and limited inter-national air service. The report also urged that regional leaders target several new, high technology industries in services and manufacturing (biosciences, information technology, polymers and advanced materials, and instruments, controls, and electronics) as well as existing regional strengths in ser-vices (professional services and health care) and manufacturing (chemicals, metalworking, and motor vehicles).
For the most part, regional business and foundation leaders followed the McKinsey recommenda-tions, except in the areas of workforce development, airport expansion, and tax policy (the latter being under the control of the state and described further below). Economic development leaders created and funded a suite of specialized organizations (described above) to promote the growth of specific industries, fill gaps in funding for business startups, and rationalize the process of business recruit-ment. Some of the organizations were new, while others were organizations that Cleveland Tomorrow had previously funded. It is too soon to evaluate the success of the new strategy.
Although similar in structure to early 1980s policy, early 21st century economic development policy in Cleveland differed in several ways. First, it took a “portfolio approach” to regional economic devel-opment, attempting to ensure that the region had high-performing firms at all stages of the product life cycle, from new business startups to emerging industries with new products to mature industries. The policy emphasis was on creating new businesses and products and improving the performance of existing firms (including but not limited to manufacturing) rather than, as in the early 1980s, retaining existing manufacturing firms. Second, the new approach covered a larger geographic scale, including much of northeastern Ohio rather than just the city of Cleveland and surrounding Cuyahoga County. Third, foundations, via the Fund for Our Economic Future, played a larger role in formulating strategy and making funding decisions, while large manufacturing firms played a smaller role. Fourth, the new strategy included an ongoing process of monitoring the performance of both the specialized economic development organizations and the regional economy as a whole. (Monitoring the regional economy was accomplished by commissioning the Upjohn Institute for Employment Research to construct a set of “dashboard indicators” to track regional economic performance. Researchers from Cleveland State University updated these indicators annually.)
Finally, the Fund for Our Economic Future attempted to take into account the economic development priorities not only of business leaders but of the region’s residents more broadly. It did the latter in 2005 by conducting a civic engagement exercise, “Voices and Choices,” in which more than 20,000 residents of the region identified their economic development priorities. The priorities identified through this process were training workers for current and future jobs, improving racial inclusion and
BROOKINGS | June 2011 11
income equality, attracting and growing businesses, reducing government fragmentation and inef-ficiency, ensuring equitable school funding and accountability, and reducing sprawl and increasing regional connectivity.
Complementary to the bioscience economic development work of NorTech and BioEnterprise, the Cleveland Clinic and Case Western Reserve University established technology transfer offices in the early 21st century. The Cleveland Clinic’s technology transfer office assisted with the spinoff of 24 firms since 2000. As of 2005, all of these remained very small, and the medical device manufacturing that resulted was mostly located in Minnesota, an established medical device manufacturing center, rather than the Cleveland area. Since 2005, this situation has begun to change as the number of biomedical equipment companies in the Cleveland area has grown substantially and medical imaging companies have begun to move to the region, forming a distinct industry cluster.
Case Western Reserve, and the Cleveland Clinic have also become important centers for state-, and federally funded research in biotechnology and fuel cells. Case, the Cleveland Clinic, and University Hospitals have recently announced plans to build a large biotechnology research center and incubator. Stark State College has become a center for state- and business-funded applied research on fuel cells. It is too soon to evaluate the economic development consequences of the recent biotechnology and fuel cell research efforts in the Cleveland area.
State tax policy may have played a role in attracting some manufacturers while discouraging others from locating or expanding in the Cleveland area. The state created a job retention tax credit aimed specifically at retaining General Motors plants. Yet the state’s overall tax structure during the 1980-2005 period included a tangible personal property tax that may have been a disincentive to firms, such as manufacturers, that maintain substantial inventories. (The state legislature reformed the state’s business tax system to eliminate this tax, but that change was scheduled to take place after 2005.)
Two other state-level policy initiatives complemented regional economic development efforts in Cleveland, although their direct impact on Cleveland’s economy is difficult to evaluate. The Edison Centers program, a technology-based economic development program begun in 1984, provides state funding to MAGNET. The Third Frontier program, established in 2002 to support high technology research, development, and business startups, has also provided funding to firms and universities in the Cleveland area, especially in biomedical imaging and fuel cell technologies.
Other Influences on Economic Development. Between 1980 and 2005 Cleveland lost the head-quarters and, often, the primary production and R&D facilities of a number of large firms as a result of mergers and acquisitions. These firms included BP America (which had bought locally based Standard Oil), Republic Steel, TRW, Oglebay Norton, and Office Max. Regardless of which side of the transaction the Cleveland-based firm occupied, the firm that survived moved its facilities from Cleveland to other U.S. locations. This suggests that the Cleveland facilities of large firms in a variety of industries were less competitive than their counterparts elsewhere.10 Some of our interviewees suggested that this disadvantage was, in large part, a failure to innovate in products and/or production processes. They told us that by the 1980s Cleveland’s major firms were mature firms in mature industries and were not receptive to major changes in their operations.
The mature nature of Cleveland’s major firms and industries may relate to the slow growth of new firms and ventures. Several of our business interviewees expressed the view that Cleveland lacked an entrepreneurial culture and that workers and managers throughout the region preferred to work for a large, stable company. In addition, experience with an established company makes the transition to a start-up difficult, since people have to adjust to fewer benefits and more risk. Another consideration is the availability of alternative jobs if a venture fails. A survey of perceptions of entrepreneurs in the northeast Ohio region found that one of the negative perceptions concerned the overall economic health of the region, which could make individuals and firms reluctant to move there.11
The limited air service available between Cleveland and other major national and international cor-porate centers may also have contributed to the region’s loss of large firms. The city of Cleveland did not expand the region’s major airport when land was readily available to do so.
With the notable exception of Lorain Community College, located in an outlying but heavily manufacturing-based county, Cleveland area community colleges have paid less attention to work-force development than their counterparts in several of our other case study regions. As a result, the region’s production workers may be poorly prepared for jobs in modern manufacturing, possibly
BROOKINGS | June 201112
creating a disincentive for manufacturers to locate or expand operations in the area. There was some evidence of mismatch between community college programs and the needs of local employers outside of manufacturing. For example, Cuyahoga Community College started a program in biotechnology, which is not a major or growing industry in the region, rather than one focused on biomedical occupa-tions, which are regionally important and growing.
Finally, Cleveland was the only one of our case study metropolitan areas in which many interviewees emphasized general influences on U.S. manufacturing employment (productivity growth, trade and exchange rates, and offshoring) as important reasons for the slow growth of the regional economy. Although the importance of each of these factors to U.S. manufacturing job loss is the subject of continuing controversy among economists, the fact that interviewees emphasized them is important in itself. It suggests that regional policies and strategies to retain or replace manufacturing jobs in the Cleveland area (at least those policies and strategies that were implemented in the 1980s and 1990s) were outweighed by broader and stronger national and international trends.
Grand RapidsEvolution of the Metropolitan Economy, 1980-2005. The Grand Rapids region has three employ-ment centers, Grand Rapids, Holland, and Muskegon.12 Manufacturing workers in Muskegon County were employed in aerospace, defense, heavy equipment, and casting products. The Holland area included food commodities, automotive parts, furniture, and pharmaceutical industries. In the Grand Rapids employment center the manufacturing economy included office furniture, automotive parts, and custom engineered contract manufacturing.
During 1980-2005, the Grand Rapids region outperformed the national economy on job creation in eight of 10 major industry groups.13 It had a 69.4 percent employment growth rate as compared to the United States’ overall 42.6 percent employment growth. Manufacturing was the standout performer in Grand Rapids over this period. In 2005, the region registered 55,700 more manufacturing jobs than it would have if it had lost manufacturing jobs at the national rate. Also notable was the region’s bifur-cated employment trend. The region steadily gained a total of 281,000 jobs between 1980 and 2000. Total employment grew at 13-17 percent rates during each of the five-year periods 1980-1985, 1985-1990, 1990-1995, and 1995-2000, before falling by 3.7 percent from 2000 to 2005.
The 2000-2005 job losses included a disproportionate share of losses in manufacturing in the free-for-all that disrupted years of strong growth, saw manufacturing’s previous two-decade stellar employment gains halved in five years, and hit the office furniture industry particularly hard. The Grand Rapids region had experienced manufacturing job loss for only three isolated years until its descent in 2000. The number of manufacturing jobs in the region increased by 12.3 percent from 1980 to 1985, 11.1 percent from 1985 to 1990, 16.2 percent from 1990 to 1995 and 8.3 percent from 1995 to 2000 before it collapsed at a -18.5 percent rate between 2000 and 2005. Globalization, a general economic downturn, and price reduction concessions were some of the precipitating factors for this steep downward trend.
Manufacturing’s employment share of the overall regional economy in 2005 was 21.8 percent com-pared to its 10.2 percent representation in the national economy in 2005. In 1980, the manufacturing share of the Grand Rapids economy had been 28.9 percent and the national economy’s 19.1 percent. The manufacturing industries with the most jobs in 2005 were transportation equipment, machin-ery, furniture and related products, and fabricated metal products. These four manufacturing indus-tries, combined, employed only one of every nine workers in the region in 2005; at their height they employed one of every six workers in the region.
A hard landing from the region’s manufacturing losses was averted by very solid job growth in education and health services over the years 2000-2005, and by strong professional and business ser-vices performance overall. The latter created 20,700 more jobs over the 25 years than if its employ-ment had grown at its national average rate. The region’s growth in the health care industry derived partially from growth in employment by the area’s leading private employer, Spectrum Health.
Declines in manufacturing likely were overstated due to adaptations made by manufacturing firms in response to the changed business climate. Both the growth in professional and business services and the decline in manufacturing appear to have reflected manufacturing firms’ new staffing practices of heightened firing of employees and greater use of temporary workers as replacements into those
BROOKINGS | June 2011 13
vacated core manufacturing slots. Hired via temporary help agencies rather than the manufacturer, these new workers were then classified as temporary service workers rather than manufacturing employees, though they might have been doing identical work.
Grand Rapids’ specialization in manufacturing increased over the 25-year span. Manufacturing’s share of the region’s employment grew from 1.51 times the national average in 1980 to 2.14 times the national average in 2005. Furniture production’s share of regional employment was 6.84 times the national average in 2005, down from a peak of 8.68 in 1994, but easily bettering the other two lead-ing manufacturing industries, transportation equipment at 3.18 and fabricated metal products at 2.45 in 2005. From 2000-2005, though, the Grand Rapids furniture industry had lost 9,700 employees, 36.3 percent of its jobs, the result of the furniture firms moving some production processes overseas. Herman Miller, Steelcase, and Haworth dominated the furniture industry in the region, employing 14,000 individuals locally in 2005 of the 17,000 in furniture production.
Economic Development Organizations and Actors. The city of Grand Rapids and the rest of Kent County benefited from a distinct group of business stakeholders. These were private sector individu-als who made fortunes in business, many of them as founders of their own companies or descendants of same. Empowered by their personal finances, they became a collective philanthropic force. In terms of influence and clout, these business elite members dominated the region’s economic develop-ment direction more than any company, agency, government, or industry did. The elite vetted their individual visions for needed civic projects, provided individual and family wealth for critical start-up funding using a legacy gift approach of 25 percent to 50 percent of the cost of a project to catalyze smaller donations, mobilized government leaders as allies, worked in the community for consensus, established agencies to manage the projects, and committed their own time and energy. Organized under a non-profit agency called the Grand Action Committee, members of the group underwrote major civic, health sciences, and educational projects in downtown Grand Rapids, including stadiums, a convention center, multiple museums, parks, a global trade center, numerous entertainment venues, a biomedical research institute, several medical specialty centers, an urban YMCA, a university, and a medical school.
This private sector philanthropic economic development network included the founders of Amway, a direct seller of beauty and health products (Richard DeVos and Jay Van Andel); the descendants of Steelcase founders, makers of office furniture (the Hunting, Pew, and Wege families); the founder of Universal Forest Products, a wood and wood-alternative products company (Peter Secchia); and the Meijer family, which founded the Meijer supermarket chain. There was another tier of owners of small-to-mid-sized firms, on the order of 20–50 funders, who used and benefited from the social networking and added more modest philanthropic support to the major givers, typically on the order of a million dollars or so.
The Grand Action Committee was initially the Grand Vision Committee, begun in 1991 and spear-headed by Richard DeVos to explore construction of an arena, convention facilities, and a baseball park. After a consultant study confirmed such projects were feasible, the Grand Vision Committee moved to a broader community base, renaming itself the Grand Action Committee in 1993, incor-porating as a larger organization, and establishing the Grand Action Foundation. The Grand Action Committee, a formal organization despite its informal-sounding name, numbered about 250 individuals who were broadly representative of the community, but it was not the active committee of the agency, only serving in a networking capacity within the Grand Rapids community. The executive committee of the Grand Action Committee organization was the working group, little changed in member com-position since 1993, resulting in a working committee less representative of the community-at-large. Members of the executive committee had professional and corporate interest, as well as civic interest, in the projects supported by the organization.
When the Grand Rapids Chamber of Commerce decided during the early-1980s economic downtown to end its economic development responsibilities, it gathered local leaders in 1983 to discuss economic development initiatives for the region. The group members, first as a Chamber committee and then as a Chamber program, pledged their own funds, including a large seed donation from Jay Van Andel, the founding chair of The Right Place Committee. In 1997, the program migrated to an independent, incorporated organization established to house it, called The Right Place, Inc. Private individuals and firms fully funded this strong Grand Rapids economic development effort since the mid-1980s. The
BROOKINGS | June 201114
philanthropic contribution funneled to the community through Grand Action was coordinated with the economic development efforts conducted by The Right Place.
The Right Place apportioned its economic development responsibilities into business retention (25 percent of organization emphasis), expansion (50 percent), and attraction (25 percent). Though formally serving Kent County, it informally covered regional business development and looked for new business opportunities both nationally and abroad for neighboring counties when requested.
The Right Place partnered with the Michigan Manufacturing Technology Center (the federal Manufacturing Extension Partnership center for Michigan) and staffed its western Michigan office, uti-lized its own Manufacturers Council which was created in 1989 to provide a peer-to-peer network for manufacturing improvement, created user groups, and contracted with consultants to handle its busi-ness expansion and retention efforts. For its business attraction work, it utilized Innovation WORKS and, beyond Kent County proper, it occasionally worked with a neighboring local economic develop-ment agency, Lakeshore Advantage, covering the Holland area. Muskegon Area First, also an economic development corporation, handled employment and business growth in Muskegon County, chiefly in the tourism, health, and manufacturing industries, but little interaction occurred between Muskegon County agencies and Kent County agencies regarding economic development.
The Right Place annually called on several hundred firms as part of its outreach As part of its reten-tion efforts, it convened industry cluster groups for information exchange , gave financial and stra-tegic advice to stabilize privately held family firms facing intergenerational transitions, and provided and coordinated assistance to small and medium-sized manufacturers. Its attraction efforts included pursuing partnerships with foreign companies to expand markets overseas and attract foreign invest-ment. As part of its business expansion efforts, it established industry councils, around industry-spe-cific common concerns to assist firms with diversification, innovation, lean manufacturing, materials price reduction, new markets, and core competency clarification. The councils formalized horizontal and vertical collaborative networks among businesses. The Right Place undertook one-time projects such as providing to the community college some lessons learned through its industry councils. Those lessons became the basis for a 40-hour course on the fundamentals of manufacturing.
The Right Place reported that it did not define collaborative networks too strictly. The Right Place formed them over the years for more than a dozen industry groups. Industry council membership involved a $3000 to $5000 member investment, and was supported by a Right Place staff member. Some of the Industry Councils lasted only a year to deal with their specific topic, exhausted the sub-ject, then disbanded. The networks helped business organizations connect with their colleagues in the region and built upon a collegial atmosphere that interviewees cited as a strength of the region.
Muskegon County used the Manufacturing Council and Industry Council approach, housing its coun-cils at Muskegon Area First. Muskegon Area First also helped with retraining, convening CEO roundta-bles. In the Holland area, Design West Michigan, a best-in-class manufacturing co-op, held technology events and created action councils.
The Grand Rapids Area Chamber meanwhile maintained its focus on three competencies: attrac-tion and retention of businesses that would create specifically a more culturally diverse community; membership services; and state lobbying on behalf of business interests, including for other economic development efforts such as The Right Place. Grand Rapids has a reputation as majority ethnically Dutch and a Dutch Reformed Christian community, a reputation that would require active diversity recruitment. The Chamber partnered with the Seidman College of Business at Grand Valley State University to run the Family Business Alliance to strengthen West Michigan’s family businesses, an effort that was an offshoot of the Chamber’s Family Business Council, a service now used by The Right Place. The Family Business Alliance provided information, tools, and resources for family business owners, family members, executives and employees through a variety of workshops, seminars and networking opportunities.
The Michigan Manufacturing Technology Center West supported small to mid-sized manufacturers throughout a 17-county area of Western Michigan through staffing by The Right Place. The organiza-tion provided assessment of manufacturing firms, sponsored user groups and workshops, organized tours of best practices, and convened and facilitated industry councils. The Western Michigan Strategic Alliance, covering the seven-county region from its 2000 initiation to 2005, focused primarily on the green movement and on benchmarks for measuring regional progress. It was founded by community
BROOKINGS | June 2011 15
interests in the Holland area who wanted to establish a better process for civic regional decision-making in the Grand Rapids region. The Alliance’s driving vision was the management of the meshing of the three urban centers (Grand Rapids, Holland, and Muskegon) as they grew towards each other. One economic development contact mentioned that hopes were that the group could help the region avoid short-sighted decisions such as the one 50 years ago that located the Grand Rapids airport in a site that now proves problematic. Four chambers formed the West Michigan Chamber Coalition in the late 1990’s as an umbrella organization to promote regionalism, local cooperation, and the region’s business climate, including the Grand Rapids Area Chamber of Commerce, Holland Area Chamber of Commerce, Muskegon Area Chamber of Commerce, and The Chamber for the Grand Haven area, but it operated primarily as convener for regional dialogue. Grand Valley Metropolitan Council was established in 1990 by a separate act of the legislature to coordinate planning. It was an alliance of governmental units, chiefly serving Ottawa and Kent Counties and handling several federal programs, including regional watershed services, regional transportation planning (assumed from the County Roads Commission), and regional land use planning. The West Michigan Regional Planning Commission similarly existed as an alliance of governments handling some similar programs as the Grand Valley Metropolitan Council in different geographic territory. It became a public-private organization in 2006. Two other regional plan-ning commissions served parts of the Grand Rapids metropolitan area.
The Grand Rapids Economic Development Office within the Grand Rapids city government offered the typical mix of financial support for downtown development programs (incentive grants, reimburse-ments, tax abatements). These programs supported new and existing businesses, including its building reuse grant program, streetscape improvement incentive program, areaway fill program, development support reimbursement, and neighborhood business assistance. The Right Place, in contrast, ran customer-driven programs and assisted with incentives specifically for manufacturing firms.
Major Policies and Strategies. Region-wide economic development strategies did not exist during 1980-2005, but The Right Place closely monitored seven-county regional economic trends. The chief economic development policy for the region originated through The Right Place. The private sec-tor, including philanthropic and business interests chiefly in Grand Rapids and Kent County, with The Right Place as the convener and administrator, developed a strategic plan covering 1999-2003. This was a series of priorities more than a strategy or a policy. It did not extend throughout the region. The strategic plan was a streamlined one and was revised every five years. The strategic plan for 1999-2003 supported business retention, expansion, and attraction; workforce development; projects to cultivate world class manufacturing; regional business issues; and strategic activity to shape the future economy.
The Right Place monitored trends continuously, providing early recognition of potential problems. The Right Place became aware of the economic downturn beginning in 2000, and adjusted, providing stronger attention to small business owners and family business owners, more networking opportuni-ties, a focus on the needs of businesses more than the needs of the individual elected officials or juris-dictions, diversification of manufacturing by smaller businesses, help to businesses seeking overseas markets, and continued use of tax incentives, talent recruitment, and workforce skills development.
Private sector. The substantial private investment in downtown amenities was a de facto major policy. The owners of Amway Corporation and Steelcase, and their descendants, each poured hun-dreds of millions of dollars into the city and region through individual and foundation gifts. Because of the moneyed families, the downtown experienced tremendous revitalization. Amway billionaire Van Andel initiated downtown redevelopment by buying and redeveloping the derelict Pantlind Hotel into the Amway Grand Plaza, opening the facility in 1981. The city assisted with bonds for the Amway Grand Plaza; such bonds could be floated at that time for commercial development. Community impetus for downtown renewal came from the November 1976 return home of President Gerald Ford after his failed presidential campaign, when the president’s security personnel initially had deemed the down-town too desolate and unsafe for the welcoming parade. Only a call to arms for all available security personnel in the region provided sufficient manpower to proceed with the event. The next downtown development projects were undertaken by the Grand Action Committee, jumpstarting the arena and then the convention center, respectively completed in 1996 and 2003. The Executive Committee of the Grand Action Committee used an event horizon of 30-40 years, providing effective long-range vision to spur civic transition and growth.
BROOKINGS | June 201116
Public sector. Grand Rapids and Kent County competently provided public services for economic development activity. Steps taken for the arena were typical. Local governments established an arena authority, floated county bonds, and secured a hotel-motel tax. The city and the Downtown Development Authority were the public participants in the project, and a memorandum of agreement was established between them and the Grand Action Committee. The county became the senior public member. The footprint for the project was a donated city parking lot. The city had to move the police precinct station, relocate a street, and redo streetscape construction; the county had to move the county courthouse building. The Urban Institute for Contemporary Arts and Green Grand Rapids had a role in placement of parks, but government had to designate funds. This pattern of cooperation was repeated many times between 1980 and 2005. Local governments were also responsive to smaller requests such as firms’ requests for dealings with the state and local level bureaucracy or for unique infrastructure needs.
The fragmented airport service remained an impediment to economic development. Each major city in the area – Grand Rapids, Holland (no commercial flights), and Muskegon, all within 50 minutes of one another – maintained its own airport. None of these smaller regional airports could support the volume needed by a major carrier and consequently all had more limited service. This situation com-pared with Detroit, where Detroit Metropolitan Wayne County Airport served 11 of the 15 largest cities in its region unimpeded. There was an Air Services Marketing Group in the Grand Rapids region looking for solutions, but no community wanted to lose its own airport. As recently as June 2008, Muskegon was fielding a Small Community Air Service Development Grant Application to the U.S. Department of Transportation to expand service.
There was no consensus on the effect of economic development programs created by the state of Michigan. The state established programs through which qualifying geographically-targeted areas could receive tax exemptions or venture capital, or local governments could receive downtown devel-opment funding to encourage companies’ to locate within cities to attract the “creative class” of young professionals. Opining on this state role, some in the Grand Rapids region concluded that the state had tried to generate a program for everything, resulting in too many programs funded at insufficient levels for too few eligible recipients, while others concluded that the state had provided a big toolbox.
Health care. With the decline of manufacturing employment, the region’s leadership pressed for-ward with creation of jobs in life sciences. The cornerstone of this expansion was the development of Medical Mile, an approximate mile of medical-related development bordering both sides of Michigan Street. Designated a SmartZone under Michigan legislation, the geographic area became eligible for special tax incentives and state funding sources, such as capital distributed through the state’s Pre-Seed Capital Fund, to attract and support high tech business, particularly medical research and bio-tech development. The complex was jump-started in 1996 with the construction by Jay and Betty Van Andel of the Van Andel Research Institute, a biomedical research center that opened in 2000. With an investment of more than a billion dollars by the Van Andels, the Institute was positioned to solicit top talent world-wide, with final staffing projected at 400 researchers. A second major development was the relocation of the main campus of Michigan State University’s College of Human Medicine to Grand Rapids. In 2008, the first students began studies in a leased facility, and the College completed its relo-cation with the dedication of the new facilities in 2010.
To provide teaching opportunities for researchers attracted to the Institute, Grand Rapids business leaders had wanted a medical school in the area. A Deloitte consulting report commissioned by the Grand Action Committee provided a feasibility plan. The Grand Action Committee, hewing to its suc-cessful fundraising method, identified a lead giver in Michigan State University alumnus Peter Secchia who provided $20 million in private support. The Grand Action Committee raised the other $20 million needed in private support through a joint Michigan State University-Grand Action campaign. “It’s called money, is how we got the school here,” one observer said.
The goals of coupling a medical school with a biomedical research center were increased investment and commercialization opportunities and research, goals furthered by the creation in 2003 of the West Michigan Science and Technology Initiative. It was formed as a partnership by The Right Place, the Van Andel Research Institute, Grand Valley State University, the city of Grand Rapids, and Grand Rapids Community College. The partnership expanded to health care agencies, including Spectrum Health. It created the West Michigan Medical Device Consortium to assist manufacturers to translate
BROOKINGS | June 2011 17
emerging research. The Consortium was formed to give medical device companies throughout the region the opportunity to collaborate, and to promote their specialized expertise in the medical device industry. An automotive parts manufacturing firm in the Grand Rapids area, having acquired a high degree of flexible-volume manufacturing expertise, moved into the medical devices market, making parts for orthopedic hips, knees, shoulders, and spines. A bakery and wrappings supplier established a medical packaging subsidiary, manufacturing sterile high-grade nonstandard packaging for medical test kits and other medical components.
Higher education. The philanthropic community started making major investments in the late 1990s, particularly the DeVos family, in the Grand Valley State University downtown Pew campus. The Pew campus held all six of the university’s profession colleges. The university oversaw incubator facilities at its Center for Health Sciences on Medical Mile. Grand Rapids government officials approved the rerout-ing of major sewer trunk lines to support philanthropic investment in the university.
Green infrastructure. More recently the region engaged in the promotion of a sustainable economy, sustainable community, and LEED certification building projects. The furniture companies made chairs that provided points under LEEDS certification, while the engineering companies created cheap water purification systems.
Other Influences on Economic Development. The automotive parts industry was historically competitive within the United States, but protected from import competition through high tariffs. Because the Grand Rapids region produced parts for sport-utility vehicles and trucks, this delayed the decline of the U.S. auto industry in the region and allowed automotive suppliers time to shift products away from exclusively U.S. buyers and diversity their market lines. This was a segment of the automo-tive market that, though it tracked downward with the national recessionary dips of the early 1980s, early 1990s, and early 2000s, had always bounced back by mid-decade. However, trouble loomed ahead and no rebound appeared by mid-decade in the 2000s. The Detroit Three automakers played into the downward trend by demanding thinner margins and more give-backs, encouraging supplier abandonment, in what would turn out to be a hidden blessing. Manufacturers accustomed to creat-ing a customized superior quality product found new markets for their niche skill rather than move to a high-volume, routinized, low-quality commodity product. Others moved parts of production across national borders. When a surge in fuel costs helped bring the automotive industry in Grand Rapids to a standstill due to the decline in demand for sport-utility vehicles, the region’s automotive suppliers had a slight positional advantage over earlier years because manufacturers had become less connected to traditional automotive. Negotiated tariff reductions under the General Agreement of Tariffs and Trade (GATT) put additional pressure on the domestic auto industry due to an increase in global competition.
Fabricated metal manufacturing was affected by Corporate Average Fuel Economy (CAFE) standards that required weight reduction in cars, causing substitution of plastic for metal parts. This led to the contraction of the metals and metal products industry and the growth of the plastics and chemicals industries in the Grand Rapids area, especially from 2000 to 2005.
For furniture and related products, the Uruguay Round reduction of tariffs on furniture led to sud-den increase in international competition in the furniture industry. Unlike the fabricated metal manu-facturing industry, the furniture industry was not as well-positioned to adjust. Furniture and related product manufacturing in Grand Rapids suffered the steepest jobs decline over 2000-2005, with a 36.3 percent falloff. The high-end Herman Miller furniture company moved its lower-end products and commodity office furniture, such as the famous Aeron chair, overseas, but retained design, custom high end products, customer interface, and the early production rounds at home to infuse quality. The company had adaptively moved to new behaviors; it carried less inventory, handled less materials management, and used less manual labor. Steelcase at the beginning of the 1980s had capital invested throughout the Grand Rapids region. By the mid-2000s, it retained one plant, a smaller one, and within it a million square feet of space were vacant; production was also moved out of the country.
The machinery manufacturing industry gradually lost the less-skilled components of its business to cheaper labor and materials overseas between 1980 and 2005.
Unions. Unlike in eastern and central Michigan, unions were very weak in most of the Grand Rapids region, excepting Muskegon County and a few townships where plants owned by large unionized corporations were located. Many business owners in western Michigan were vehemently anti-union, and historical incidents of labor suppression were mentioned in interviews. Heavy use of temporary
BROOKINGS | June 201118
workers evidenced that unionization was not a binding constraint to hiring inexpensive, unorganized, low-skilled labor. Although manufacturing wages were high in western Michigan until the 1990s, overtime or changes in job tasks did not correspond to automatic wage rate jumps. Also, employers asserted, workers received wages and bonuses tied to individual productivity and business profitabil-ity. Lower labor costs plus proximity to Detroit made western Michigan a good location for auto parts manufacturing. The rapid uptake of temporary staffing and professional employer organization ser-vices since 1990 contributed to further decreases in average labor costs, which contributed to reduced production costs.
Recategorization. Some of what appears to be manufacturing jobs’ decline was an artifact of manu-facturing firms’ hiring of temporary workers for core manufacturing jobs, rather than a true decline, and manufacturing employment may not have been in as severe a decline as it appeared to be after 2000. Some manufacturing firms cut their permanent workforce and were employing hard-hat temps when spikes occurred in demand or were using temporary help agencies as hiring pools. Economic development agencies and individual firms independently corroborated this behavior.
Employment services jobs grew by 1552 percent during 1980-2005, mostly in the 1997-2005 period. From 1997 to 2005, employment services jobs in the Grand Rapids area grew by 59 percent.
The employment services industry includes employment placement agencies, temporary help services, and professional employer organizations. As an estimate, if in 2005, two-thirds of the employment services industry’s workers were employed in manufacturing, then Grand Rapids-area employment in manufacturing would be underestimated by at least 10 percent. Further, there was no medical or back office employment in the region where such employment might also persist, and the city had almost all the SIC codes to back that up.
Amenities. The regional philanthropy by the business elite increased the level of amenities in the Grand Rapids region, off-loading those costs from local governments. This non-governmental ameni-ties contribution could be considered a contribution to lowering production costs for all firms in the region in two ways: through a voluntary provision of amenities, which removed the burden from local taxes, and through the availability of an amenity-adjusted wage. The increase in amenities would increase the value of any wage offered by any firm in the region. This would allow firms to pay a lower dollar wage, adding a competitive advantage over other regions without access to this perk.
HartfordEvolution of the Metropolitan Economy, 1980–2005. Hartford added jobs at an anemic rate of 11.4 percent between 1980 and 2005, just more than one-quarter of the nationwide rate. If all its industries had grown at their respective national rates, Hartford would have had 43.2 percent job growth during this period, slightly above the national average job growth rate. This indicates that Hartford’s slow rate of job growth was largely due to local competitive factors rather than to the “wrong” mix of indus-tries. In contrast to its poor record of job creation, the region experienced strong wage gains, with the inflation-adjusted average wage growing by 50.1 percent over the same period, well above the 28.4 percent growth seen nationwide. This combination of weak job growth and strong wage gain reflects the region’s increasing concentration of jobs in industries and firms producing high value-added but mature products that have not generated rapid job growth, such as those in insurance and aerospace manufacturing. Within these industries, firms shed routine production and back-office occupations while adding higher-skilled positions to their payrolls, including engineers, systems analysts, and pro-grammers.
In 1980, manufacturing accounted for 26.3 percent of all jobs in the Hartford region, which was 1.37 times its share nationwide. Aerospace manufacturing comprised a large portion of these jobs, with transportation equipment manufacturing (which includes aerospace) accounting for 33.5 percent of manufacturing jobs, or 8.8 percent of all jobs in the region (4.01 times its national share).14 Fabricated metals manufacturing made up an additional 20.6 percent of manufacturing jobs, or 5.4 percent of all jobs in the region (2.91 times its national share). Other large manufacturing industries included machinery manufacturing (2.8 percent of all jobs and 1.67 times its national share) and computer and electronic products manufacturing (2.2 percent of all jobs and 1.10 times its national share). Many large manufacturing assemblers call the Hartford region home, including Pratt & Whitney, known primarily for its production of aircraft engines, and Hamilton Sundstrand, a manufacturer of aerospace systems.

BROOKINGS | June 2011 19
In addition, other large manufacturers such as the Carrier Corporation (a producer of air conditioning and refrigeration systems) and Otis Elevators are headquartered in the region, but have no produc-tion there.15 The area has a long history of precision manufacturing, dating back to the founding of Colt’s Manufacturing Company in 1836 to produce revolvers. Colt’s itself was an outgrowth of the gun manufacturing cluster that had existed in the Connecticut River Valley for several decades prior. This competency has endured, enabling the region’s suppliers and assemblers to meet the strict tolerances required in aerospace manufacturing, the region’s most important manufacturing industry.16
From 1980 to 2005, Hartford lost 73,200 of its manufacturing jobs, a 49.7 percent decline and more than double the 24.1 percent rate of loss experienced nationwide; it was also the hardest hit, in percentage terms, of the eight regions covered in this report. From 1980 to 1995, there was only one year (1983-84) in which manufacturing did not lose jobs, with total losses amounting to 61,900 manu-facturing jobs during this 15-year period. The largest declines occurred during the five-year periods from 1980-85 (20,900 jobs lost) and 1990-95 (24,700 jobs lost). From 1995 to 2000, the region actu-ally gained a small number of manufacturing jobs, but lost 12,100 jobs (a decline of 14.1 percent) from 2000-05. The largest absolute declines over the 25-year period occurred in transportation equipment manufacturing (which includes aerospace), with the industry losing 26,800 jobs (a decline of 54.3 per-cent) from 1980 to 2005. Accompanying the losses in transportation equipment manufacturing were large job losses in fabricated metal manufacturing (a decline of 13,800 jobs or 45.5 percent), computer and electronic products (a decline of 8,800 jobs or 71.1 percent), and machinery manufacturing (a decline of 7,700 jobs or 48.6 percent). New Britain (nicknamed the “Hardware City”), home of Stanley Black & Decker, saw declines in its metalworking industry, as did Meriden (the “Silver City”), Waterbury (the “Brass City”), and Naugatuck (a center for screw machine manufacturing). The latter three towns are not in the Hartford metropolitan area, but they are useful in understanding the kind of manufac-turing losses experienced in central Connecticut during our study period.
Hartford’s other prominent industry is insurance. The region has long been called “the insur-ance capital of the world.” Several large insurance companies are headquartered there, including Aetna, The Hartford Financial Services Group, and Phoenix Companies. In addition, Travelers, CIGNA, UnitedHealth Group, MetLife, and others are major employers in the region, although they are not (or are no longer) headquartered there.17 In 1980, insurance and related activities was the region’s largest non-manufacturing industry, accounting for 8.6 percent of the region’s employment (5.22 times its nationwide share). From 1980 to 2005, its employment level was nearly unchanged (there was a slight decline of 0.1 percent), though this masked large shocks due to the commercial real estate bubble of the late 1980s and early 1990s as well as a cycle of strong hurricanes that included hurricane Andrew in the early 1990s. After gaining more than 14,000 jobs between 1980 and 1990, the industry lost more than 17,400 jobs in the region from 1990 through 1995.
Overall, non-manufacturing industries gained jobs at a rate of 33.2 percent from 1980-2005, or 25.2 percentage points slower than the comparable U.S. growth rate. All major industries lagged (or declined more swiftly than) their comparable U.S. growth rates, except for information and utilities, which were roughly in line with U.S. rates of change. The largest absolute gains occurred in health care and social assistance (an increase of 38,400 jobs or 92.3 percent); administrative services (an increase of 16,200 jobs or 115.5 percent); government (an increase of 13,000 jobs or 16.1 percent); and professional, scientific, and technical services (an increase of 11,800 jobs or 63.2 percent). In Hartford, these industries lagged their comparable U.S. growth rate by 24.5, 108.1, 9.6, and 81.5 percentage points, respectively.
By 2005 Hartford’s economy was more industrially diverse than in 1980, due primarily to its loss of manufacturing jobs. Manufacturing accounted for 11.9 percent of Hartford’s jobs (1.16 times its nation-wide share), down by 14.4 percentage points from 1980. Shares of jobs in health care and social assis-tance increased by 5.4 percentage points, as it became the region’s largest private sector industry. The share of jobs in finance and insurance was down modestly (0.4 percentage points), while shares in administrative services and professional, scientific, and technical services increased by 2.3, and 1.6 percentage points, respectively.
Economic Development Organizations and Actors. Hartford’s economic development landscape is marked by many small to medium-sized organizations, often with overlapping missions, that have engaged in activities such as place-marketing, workforce development, lean production assistance to
BROOKINGS | June 201120
manufacturers, technology-based economic development, and assistance to firms in the insurance, aerospace supply, metals fabrication, and medical device industries. Over the course of our study period, the region lacked a unified business leadership, which marked a departure from prior years when powerful insurance executives held sway in the economic development and political arenas. The state government has been the most important governmental player in economic development over the past 25 years. Connecticut is a home-rule state that lacks meaningful county governments, leaving government-led economic development efforts to the state or the municipalities. With 57 cities and towns in the greater Hartford area and a relatively dispersed population, the coordination effort appears to have been too great for municipal governments to overcome. Many of our inter-viewees cited political and organizational fragmentation as a problem for the region. They claimed that it hinders the ability of local actors to develop and act upon a common set of economic develop-ment priorities and diminishes the economic might of organizations seeking limited funding dollars. Fragmentation exists at the state level as well, with myriad departments and quasi-public agencies engaged in economic development. Explaining the root cause of the area’s fragmented institutions is difficult. It may be driven by a cultural preference for addressing problems at a very small scale. Alternatively, the region’s organizational fragmentation may simply be a reflection of its political divi-sions, with the many city and town boundaries contributing to a culture of fragmentation that carries over to economic development efforts.
There are two prominent business membership organizations in Hartford, though they differ in terms of their geographic scope and services provided. The smaller of the two organizations is the region’s chamber of commerce, called the MetroHartford Alliance. It focuses on traditional economic development activities such as business attraction and retention, talent attraction, entrepreneurship, and marketing.18 It was formed in 2001 from two predecessor organizations, the Greater Hartford Chamber of Commerce and the MetroHartford Economic Growth Council, and serves roughly 1,000 businesses in the greater Hartford region.19 The larger organization, the Connecticut Business and Industry Association (CBIA), is an association of statewide businesses, with roughly 10,000 private sector members statewide.20 It lobbies on its members’ behalf to influence public policies affecting the state’s business climate (e.g., tax policy). Unlike the MetroHartford Alliance, CBIA does not work on business attraction or retention. It has engaged directly in workforce development initiatives through its affiliate, the Education Foundation, since 1983.
Workforce development has been Hartford’s most crowded economic development arena. The region’s precision manufacturing industries have required a highly skilled labor force and many com-panies have voiced concern about being not being able to find skilled workers. It was once common for workers to find training in apprenticeship programs with the region’s large manufacturers, though this practice seems to have been scaled back around the late 1980s Furthermore, the region has faced an aging workforce and the long-standing problem of many impoverished inner-city residents who have been disconnected from the region’s core industries. These issues have combined to make workforce development a well-recognized and particularly pressing concern for leaders in state government as well as the region’s many economic development organizations.
CBIA has served as a conduit for its members, especially the small- and medium-sized manufactur-ing firms, on workforce training issues. They have looked to it to help identify specific workforce needs and provide training assistance, which it has done, often with the cooperation of other existing institu-tions, such as community colleges.
To better coordinate the efforts of the state’s 12 community colleges to meet workforce challenges, the schools came together in the early 2000s to form the College of Technology (COT). As with CBIA, the focus of COT extends beyond the Hartford region, but because of Hartford’s manufacturing specialization, its efforts have been especially relevant to the region. Of the 12 community colleges that are part of the COT, interviewees reported that Asnuntuck Community College in Enfield has been especially active and successful in providing training for the precision manufacturing needs of Hartford’s manufacturers. However, despite its excellent work, interviewees reported that its efforts have been too small to adequately address the purported skill shortages faced by aerospace manu-facturers.
Added to these efforts are those of the region’s Manufacturing Extension Partnership (MEP) affili-ate, ConnStep, its Workforce Investment Board (Capital Workforce Partners), and industry-specific

BROOKINGS | June 2011 21
organizations described below. Perhaps as a reaction to the myriad efforts reacting to the Connecticut’s workforce challenges, the state created the Office of Workforce Competitiveness in 1999 to improve coordination of its efforts around workforce issues.
Hartford is home to multiple organizations, such as the Connecticut Center for Advanced Technology (CCAT), the Connecticut Technology Council, and the Biomedical Engineering Alliance & Consortium (BEACON) which have tried to push the state to new technology frontiers. Despite purported skill shortages, productivity and skill levels are very high in Connecticut and these organiza-tions have sought to help the region capitalize on that potential.
The primary focus of CCAT has been to help aerospace suppliers implement both lean production and “hard” technologies that increase productivity. This involves both engineering and management/organizational change. In addition, CCAT operates a simulation lab, in which it can show manufactur-ers what the implementation of various engineering and management changes would look like on the shop floor and what impacts those changes would have on the production process. Its efforts overlap somewhat with the MEP, but CCAT’s efforts appear to place more emphasis on the combination of engineering and management solutions. CCAT is funded by federal grants, allowing it to provide its services free of charge, unlike MEP, which charges fees to the firms it assists. It has also engaged in workforce development through partnerships with training providers as well as a focus on promoting science and technology education in the elementary and secondary schools.
The Connecticut Technology Council is a statewide trade association that has sought to promote high technology innovation. It performs a wide variety of functions, serving to facilitate business net-works between the state’s metropolitan areas as well as lobbying the state government around issues related to innovation (e.g. the angel investor tax credit).
BEACON is an organization headquartered in Hartford that brings together medical device manu-facturers in the region to promote their common interests and helps aerospace suppliers diversify into the technologically similar area of medical device production. Most of its focus is on manufacturers in the Hartford region and more generally, the Interstate 91 corridor in north-central Connecticut and western Massachusetts.
The geography of Beacon’s focus is similar to that of the Hartford-Springfield Economic Partnership (HSEP). HSEP was founded in 2000 to provide marketing for the bi-state region and to influence public policy affecting the region. It has received financial support from both state governors and it includes members from business, higher education, chambers of commerce, Bradley International Airport, and other economic development organizations. Northeast Utilities was the motivating force behind HSEP’s creation and it serves as the primary facilitator of the group today.
Until the late 1970s the region possessed a powerful business elite—drawn mostly from the insur-ance industry—that was civically minded and had both the financial resources and political connec-tions necessary to affect local development. These executives were known as “the Bishops” and their marked level of private sector leadership has not been seen since their departure. John Filer, the former chairman of Aetna, known as the “Archbishop” or “shadow-mayor,” argued that corporate lead-ership “should be part of the enlightened group that calls the different factions and players together and trie[s] to do some intelligent planning, tries to do some intelligent demonstration projects.”21 This group worked with the city government to rebuild the Hartford Civic Center Coliseum after its roof col-lapsed. In the early 1970s it was also a driving force behind a major region-wide planning effort called the Greater Hartford Process, which sought to address inner city poverty and increase the efficiency and availability of social services.22 The plan, developed with input from James Rouse (the planner behind Columbia, MD), was hailed at the time as a model of regional planning, with one New York Times columnist calling it “the largest, most visionary effort ever undertaken to renew and develop an entire metropolitan area in America” The Nixon administration praised the plan as a “model for future metropolitan planning throughout the country.”23 However, it was also quite controversial due to its lack of transparency, which gave rise to fear among wealthy suburbanites and poor inner-city residents alike, not to mention politicians who feared that their political power might be curtailed.24 Ultimately the plan failed, but it was a testament to the ability of the Bishops to generate momentum around a region-wide vision.
The influence of the Bishops began to wane as once locally owned insurance companies were acquired by firms from outside the region and as politicians and corporate leaders left their posts.25
BROOKINGS | June 201122
As discussed above, Hartford is still home to corporate and division headquarters of major insurance firms, which remain generous regional benefactors, but the scope and degree of their civic engage-ment has diminished and no group has come together to replace the Bishops since.
During our study period, social ties between businesses appear to have been limited to firms within the same industries and were strongest between small firms. The state’s cluster initiative (discussed below) has facilitated the creation of businesses networks in specific industries, such as aerospace components and insurance and financial services.
Major Policies and Strategies. During our study period, the most high profile economic develop-ment efforts focused on downtown revitalization as part of an amenities-based development strategy and on the implementation of a cluster-based economic development strategy. Both were programs of Governor John Rowland’s administration (1995-2004). Although the latter was a statewide project without regional differentiation, it ended up targeting two of Hartford’s key industries, insurance and aerospace. At different points during our study period, public sentiment arose in support of efforts to promote regionalism, but political impediments prevented anything meaningful from materializing in this regard.
Downtown revitalization became a focus of the Rowland administration in 1998, when it unveiled its Six Pillars initiative. The weakness of local government accompanied by the void left by the decline of the Bishops’ power have been cited as catalysts for the unique attention given to the city of Hartford by the governor.26 Unveiled in 1998, the Six Pillars were: “a rejuvenated Civic Center,” “a highly devel-oped waterfront,” “a downtown higher education center,” “a convention center and sports megaplex,” “the demolition or redevelopment of vacant buildings and the creation of downtown housing units,” and “an increase in the number of well located and inexpensive parking spaces”27 The state envisioned spending $350 million with the hope that accompanying federal and private investments would reach $1 billion.28 Although it is not clear how Governor Rowland viewed the initiative in terms of region-wide economic impact, the “suburbs also strongly supported the plans to redevelop Hartford,” believing that the city’s “dismal national reputation” was an impediment to attracting people to the region.29
The Rowland administration’s Industry Cluster Initiative was of similar prominence to the Six Pillars project, but it focused more squarely on industrial development. In a 1997 article, Peter Ellef, the Commissioner of Connecticut’s Department of Economic and Community Development (and Governor Rowland’s future chief of staff), wrote: “Connecticut’s cluster development approach is moving from an economic concept to the cornerstone of our state’s economic policy because clusters not only make sense, they are the wave of our future.”30 The initiative launched on the heels of the wrenching 1990s downturn that resulted from what Ellef called the state’s “’three eggs [insurance, banking, and defense] in one basket’ economy,” which was hurt by declines in defense spending and restructur-ing in the banking and insurance industries.31 Drawing inspiration from cases such as Silicon Valley’s technology cluster, Italy’s leather goods cluster, and Connecticut’s own emerging photonics cluster, Ellef argued that cluster-based development “is an approach that will help [Connecticut] industries gain the competitive advantages they need to grow strong and stay strong.” That same year, the Rowland administration identified six broad industry groupings—financial services, telecommunica-tions and information, health care services, manufacturing, high technology, and tourism—and con-vened Industry Cluster Advisory Boards for each. Ellef called these industries “a mix of Connecticut’s traditional strengths and key emerging industries.”32 One administration official was quoted at the time as saying the industry groupings were intentionally very broad “so as not to ‘pick winners.’”33 The administration perhaps missed an important point; instead of viewing clusters as geographically local-ized groups of firms and other actors within and/or across industries, it appeared to see them, less appropriately, as favored industries.34
At their convening, the Industry Cluster Advisory Boards were given two tasks: The first was a very broad call to develop recommendations aimed at enhancing the global competitiveness of Connecticut’s firms and residents; the second was to assess whether or not a state cluster initiative should be formalized.35 A year later, the advisory boards released a report detailing their recommen-dations. Prominent among them was the affirmation that the broad industry groupings should be formalized as industry clusters while additional clusters and “sub-clusters” should be encouraged. At the time, Governor Rowland was quoted as saying, “I think we will look back to this day and year, and say that this report is the most significant economic plan in the last 50 years.”36 The summary report
BROOKINGS | June 2011 23
of the boards’ recommendations described two general principles necessary for any cluster strategy to succeed: “Firms within a cluster must cooperate to identify problems and generate solutions; and [g]overnment, academia, and regional/local organizations in economic development must become full partners within the cluster and work toward common goals.”37
Subsequent to the release of the report the Aerospace Components Manufacturers (ACM) cluster and the Insurance and Financial Services (IFS) cluster were formalized. ACM began as an alliance of fewer than ten aerospace suppliers, which initially joined to address common workforce issues. In 1999, the group sought funding from the state Department of Economic and Community Development (which administered the cluster program) and formally became the state’s aerospace cluster. One interviewee familiar with the cluster told us that it was founded with the mission to counter offshoring trends present since the early 1990s. The cluster’s member firms are mainly small to medium-sized. One interviewee told us that lean manufacturing was not widely implemented in 1999 and this has been one issue tackled by the cluster; it does not do the training itself but works with outside consultants in addition to the region’s MEP affiliate, ConnStep. ACM also addresses basic workforce issues by arrang-ing custom training courses for its members. In addition, it provides assistance through consolidated purchasing agreements as well as by providing a roundtable forum to discuss business development. One interviewee told us that “the greatest advantage of ACM is peer-to-peer support.”
Evidence from our interviews suggests that the ACM cluster has been the most successful cluster in terms of the support it has brought to its members. The general view expressed by many of our inter-viewees was that the mission of the other clusters was not well defined and that most simply devolved into trade organizations shortly after they were formed. For example, it is unclear how the clusters were supposed to interface with and become “full partners” with government, higher education, and other economic development organizations as the program envisioned. After Rowland resigned from office in 2004, his successor’s administration inherited the program. Although the program continued under that administration, interviewees suggested that the program suffered as a result of the discon-tinuity in leadership.
Efforts to promote regionalism were in full swing in 1994 after the topic had been a matter of debate for several years. Proponents of regionalism touted the cost saving, efficiency enhancing, and disparity reducing benefits of regional government. Supporters framed it as an issue of competitiveness. One state legislator was quoted at the time as saying that “[t]he business community has to make clear [to politicians] that our competitors are already doing [regional planning].” Another state legislator sounded a similar note: “[R]egional governance is tied into our long-term economic competitiveness.”38 Earlier that year, a “focus group” created by the state legislature had recommended the creation of a middle tier of government, though the structural details were not well developed.39 Opponents of the recommendation attacked this as a measure that would merely add another layer of bureaucracy and undermine the power of local governments. As one politician seeking office said, “I don’t think it’s right to force another level of government on the cities and towns.” He added, “I think it’s just going to end up costing more money and taking away local control.”40 In addition, the soon-to-be Governor Rowland was firmly against regional governance.41
Nearly 14 years later, the issue was once-again in the news as the Hartford Courant ran the headline: “City, Town Challenges Cry out for Regional Solutions.” Hartford’s enduring struggle with drugs, pov-erty and poor schools led to the paper to say “it has been Groundhog Day in Hartford.”42 Tom Condon, the article’s author and a prominent advocate for regionalism in Hartford, used the issue to illustrate the need for regional action: “We have tried to solve our problems on a town-by-town basis. Hartford may well be too small to solve its own problems; it’s hard to be an inner city without an outer city.”43 Further, Condon underscored the point that issues like “transportation, affordable housing, energy, and economic and workforce development are regional.”44 Although interviewees frequently cited fragmen-tation as a problem for the region, the region has little to show for all of the rhetoric.
Other Influences on Economic Development. The efforts of Hartford’s many small economic devel-opment organizations appear to have aided many of the region’s firms, especially those in aerospace manufacturing. However when taken together, their efforts do not appear to have been successful in changing the economic trajectory of the region. The real impacts of the Six Pillars Initiative and of the Industry Clusters Initiative are not clear, but they appear to have been minor. Consequently, the evolu-tion of Hartford’s economy has been shaped primarily by broad economic forces. Job losses in the
BROOKINGS | June 201124
aerospace industry were likely due to a variety of factors, including declines in defense spending; Pratt & Whitney’s loss of market share in commercial aviation (highlighted most notably by its absence from the Boeing 737 program); large aerospace assemblers seeking lower cost markets to source parts; the globalization of customers and, in turn, parts of the supply chain; woes in the air travel industry; and increases in productivity that were not offset by increases in business.45 Automation and structural changes in the insurance industry allowed firms in Hartford to outsource jobs to lower cost regions, such as Scranton and metropolitan areas in the Great Plains. Furthermore, without large-scale innova-tion in the insurance industry, job levels remained steady, though the industry’s inflation-adjusted average wage continued to rise.
Connecticut’s median income has long been very high. Interviewees claimed that this statistic has garnered too much attention because it prevented state and regional leaders from focusing on the serious threats facing the region’s industries and its poor inner-city population. Those with close ties to aerospace have been aware of losses in their industry all along, but high incomes have appear to have stood in the way of a sense of region-wide urgency that might have catalyzed broad action in response to manufacturing job loss. Instead, interviewees said, the statistic encouraged complacency.
Interviewees cited the high cost of doing business in Connecticut as a hindrance to the region. However, the presence of many corporate headquarters in the region suggests that the region has a high quality of life for business executives and professionals. Highly restrictive zoning, a source of higher costs for companies, contributes to that quality of life. Interviewees also described the region’s labor force as possessing a strong work ethic, focusing particularly on a regional trait they termed “Yankee ingenuity,” which was said to explain how businesses could remain competitive despite the state’s harsh business climate. Despite a low rate of new business formation, the region’s businesses were said to be very innovative. While this appears to have been less true with regard to product inno-vation, the region’s manufacturing firms, especially many of the aerospace suppliers, appear to have been particularly good at process innovation. Because its core industries, insurance and aerospace, focus on controlling risk, the region may have been less capable of producing major product innova-tions that require substantial risk.
IndianapolisEvolution of the Metropolitan Economy, 1980–2005. Between 1980 and 2005, employment in manufacturing in the Indianapolis region contracted by 12.3 percent, or 14,200 jobs.46 Plant closures and downsizing in the transportation equipment industry accounted for the bulk of the job loss from 1980 to 1990. Chrysler closed its Indianapolis plants. GM reduced its labor force. The shuttering of Western Electric and Westinghouse plants further cut manufacturing jobs. Although transportation and heavy manufacturing industries continued to shed jobs during the 1990s, growth in chemical, plastic, and other non-durable goods manufacturing allowed job levels in manufacturing as a whole to remain relatively level during the decade. Eli Lilly and Company and Dow AgroChemical led the growth of chemical manufacturing; that industry’s share of metropolitan Indianapolis’ employment rose from 1.52 times the national average in 1980 to 3.09 times the national average in 2005. The recession at the turn of the century, however, contributed to another round of cutbacks by transportation equip-ment and other durable goods manufacturers.
Manufacturing job loss in the city of Indianapolis and its suburban counties was eclipsed by dramatic expansion of services employment. Services firms created 360,000 jobs between 1980 and 2005. Total employment in the Indianapolis region grew by 70.6 percent during this period, 28.0 percent-age points above the national employment growth rate and 27.9 percentage points more than if all its industries had grown at their respective national rates. This indicates that Indianapolis’ industries were stronger job creators than were the same industries in other parts of the country.
Growing exportable service industries included logistics and transportation; professional, scientific, and technical services; insurance; and the performing arts, spectator sports, and related industries. The transportation and warehousing industry added 29,900 jobs to the Indianapolis metropolitan area over the twenty five year period. Warehousing and storage grew at roughly six times the national rate. FedEx expanded to 4,000 workers by 2006, making Indianapolis its second largest hub in the country. The professional, scientific, and technical service industries expanded by 28,800 jobs due not only to a secular increase in demand, but also the substitution of contracts with professional services firms for
BROOKINGS | June 2011 25
in-house professional services personnel. The insurance industry added 7,000 jobs over the 25 year period, driven by the growth of WellPoint and Conseco insurance. Educational institutions in the region increased their employment by 11,400.
The burgeoning employment services industry employed nearly 36,600 workers in metropolitan Indianapolis in 2005, up from around 3,500 in 1980. Some of this growth resulted from an increase since the 1990s in manufacturers’ use of temporary help services, which account for about two-thirds of jobs in the employment services industry in the region. This increase occurred nationwide, but our interviews suggest that it was especially important in Indianapolis.47 Some of the measured decline in manufacturing employment in Indianapolis is, in fact, a restructuring of manufacturing employment from direct-hire permanent jobs temporary services firm-intermediated arrangements.
The shift in the mix of manufacturing and services production in Indianapolis had a negative effect on earnings larger than the national average. While the effect on real earnings of changes in industrial structure in the U.S. from 1980 to 2005 was an estimated -2.3 percent, the effect on real earnings of the change in industrial structure in the Indianapolis region was -6.4 percent. The average wage per job in transportation and warehousing in 2005 was only 59.7 percent of that in manufacturing, without taking into account use of temporary services workers in either industry. The average wage per job in administrative and support services firms was less than half that in manufacturing in 2005. The data corroborate the concern of some interviewees, including union representatives, that employ-ment growth for low-skilled workers has been in jobs that pay far less than the permanent, direct-hire manufacturing jobs lost.
Counting only workers directly hired by manufacturers, the inflation-adjusted average wage per job in manufacturing increased by 27.1 percent from 1980 to 2005. The increase suggests improvement in the aggregate level of technology and efficiency in manufacturing due to some combination of clos-ing less technologically advanced or efficient firms and investment by extant firms in technology and efficiency advances.
Economic Development Organizations and Actors. An unusual characteristic of the response of the city government and collective organizations of the Indianapolis region to manufacturing job decline is that it was initiated in advance of the actual decline. “Downtown-centric” economic develop-ment and amateur sports attraction were already underway by 1980. Mayor William Hudnut formed the Greater Indianapolis Progress Committee and in 1981 sought to change the image of the city from “India-no-place,” a sleepy town below the radar of national corporate location decision-makers and potential residents, into a place that an investor in search of a site might consider. The Project became the Indianapolis Economic Development Corporation two years later to promote investment from out-side of the region and support expansions of local companies in Indianapolis city/Marion County.
The non-profit Indianapolis Sports Corporation, formed in 1979 to attract, coordinate, and market major amateur sports events, developed into a specialized organization that directly and indirectly contributes to economic development of the region. When a Latin American city bowed out of its commitment to hold the 1987 Pan American Games, the second largest international multi-sport amateur competition in the Western Hemisphere behind the Olympics, Indianapolis stepped forward. The Indianapolis Sports Corporation succeeded in mobilizing over 35,000 Hoosier volunteers from the region to support the Pan Am Games. The Indianapolis Sports Corporation has since helped attract multiple amateur sports organizations (notably the NCAA) to the region, has contributed to the region’s amenity base by generating an array of spectator sports events, and has provided a vehicle for forming “social capital” in the form of connections of managers and workers to each other and to the region. Indianapolis sought out and now hosts national and inter-national amateur sports events such as NCAA Basketball Final Four games and tournaments, rowing and track and field champion-ships, and Olympic trials, as well as professional motor sports events such as the Indianapolis 500 and the NASCAR 400 at the Brickyard.
Hamilton County, Hendricks County, Johnson County and other suburban counties established economic development authorities during the early 1990s to attract investors interested in the Indianapolis region to their jurisdictions. Through 1990, growth in the region had been highly central-ized in Indianapolis/Marion County. The new economic development agencies collaborated informally. Indianapolis and Hamilton County agencies, with the benefit of greater resources and the most desir-able sites, tended to take the lead on regional economic development matters. According to Mayor

BROOKINGS | June 201126
Stephen Goldsmith, a “bilateral treaty” between Marion and Hamilton Counties addressed shared infrastructure investment, regional transportation and sewer planning, and joint industry development strategies, and included a “no economic cannibalization” agreement.48
By the end of the 1990s, elite attention expanded from the city to the region. In 2000, the Central Indiana Corporate Partnership was established to bring together corporate leaders from throughout the Indianapolis metropolitan area to address regional public policy issues. The Partnership commis-sioned a set of industrial cluster studies for central Indiana. Three industry specific organizations were formed as a result. BioCrossroads (2001) supports life sciences development through lobbying, venture capital, and matchmaking of invention and entrepreneurs. TechPoint (2002) aims to develop high technology as an industry able to support other industries in the region. Conexus (2002) assists advanced manufacturing and logistics expansion, mainly through workforce development. The orga-nizations share facilities, fundraising tactics, and ideas. In 2005, the role of the Indianapolis/Marion County economic development agency, now called the Indy Partnership, was expanded to include serving as the apex agency for coordinated promotion across the various counties of the larger Indianapolis region.
Major Policies and Strategies. Before 1980, an idealistic, ad hoc group of young Hoosiers in second-tier positions in city or state government and in the professions and businesses, activated by the moribund city center and announcement of the closure of Western Electric, visited Toronto, Boston, San Antonio, and other vibrant mid-size cities in search of a path for Indianapolis. The “city committee” agreed on an unwritten three-industry strategy for the city economy in (1) health sciences, (2) logis-tics, and (3) sports and convention tourism. This group catalyzed the launch of downtown redevelop-ment and originated the successful initiative to attract sports events to Indianapolis in the hope that a vibrant downtown and sports image would bolster convention center use and tourism. In addition to its novel amateur sports strategy, the informal group of young public sector and business executives sought to attract professional sports teams, including through the building of the Hoosier Dome, which was financed with a food and beverage tax that also funded convention management and marketing.
Mayor Hudnut and private sector leaders in the early 1980s continued to believe strongly that the turnaround of downtown Indianapolis was essential to attracting and maintaining businesses and to overall regional prosperity. An explicit downtown-centric amenity development strategy was initiated with financial backing from the Lilly Foundation, private sector leaders, and public funds. Further, to spur downtown development, location of businesses and development in the city center, especially within the central square mile, was encouraged through site preparation, utility deals, and tax incen-tives on the part of Indianapolis/Marion County. As a result of the 1969 unification of Indianapolis City and Marion County governments into “Unigov,” the mayor had the reach to direct investors seeking to locate in Marion County to the city’s downtown. Moves outside the city downtown were also discour-aged by non-profit and business leader peer pressure and moral suasion.
Mayor Steve Goldsmith subsequently aimed to stimulate regional economic growth by reducing costs to private businesses. He established a Private Regulatory Commission to review and strike down costly regulations that did not have a strong demonstrated need or policy basis. He also sought to increase public sector efficiencies through use of market mechanisms, including use of competitive contracting where city departments had to compete with private firms to provide city services. From 1992 to 1997, Goldsmith cut the city budget from $460 to $428 million.49 With reduced funding for eco-nomic development, business and nonprofit leaders took the initiative to create organizations such as Indianapolis Downtown Inc. and the expanded Indy Partnership, formerly called the Indiana Economic Development Corporation.
Throughout the 1980-2005 period, economic development agencies in the region worked to pro-mote Indianapolis, and then central Indiana, for business location, using standard investment promo-tion strategies and tools with relative success. The Lilly Endowment funded background and strategy studies and organizational development. The Endowment, other foundations, and private businesses contributed to promotion efforts and economic development agency operating budgets. The Indy Partnership and Hamilton County economic development agency stepped up emphasis on firm reten-tion during the 1990s.
Other Influences on Economic Development. From 1980 to 2005, many manufacturing firms, especially in durable goods producing industries, faced dramatic demand shifts and increases in

BROOKINGS | June 2011 27
competitive pressures such that demand-side factors exogenous to the region largely overshadowed local supply-side factors. All representatives of firms interviewed indicated that product market shifts drove their actions. Changes in product markets resulting from of advances in technology and commu-nications, reductions in transport costs, and globalization have forced most manufacturing firms, and many service firms, to retrench, reengineer, and restructure.
Firms in highly regulated industries, such as defense and pharmaceuticals, were less vulnerable to competitive entry as a result of globalization. The Indianapolis region was fortunate to have major employers, Rolls-Royce and Eli Lilly & Company, in such industries. Eli Lilly & Company pharmaceuti-cals grew consistently in Indianapolis from 1980 to 2000, generated the large-scale joint venture Dow AgroScience, and spun off two significant companies—Guidant Corporation and Elanco. In 1999, Eli Lilly & Company announced a billion dollar expansion at two of Lilly’s main Indianapolis campuses. City officials liken the effect of the investment to that of a Fortune 500 company relocating to Indianapolis every two years for the next decade.
General trends in technology, transportation, and global market openness have not had uniform effects across or within industries. The region’s engineering tradition, which dates back to race car engi-neering research and development, helped mitigate losses in automotive equipment manufacturing. For example, Allison Transmission, which grew out of the Indianapolis Speedway Team Company, invented the auto industry standard V-drive transmission in the 1940s, and powered U.S. tanks through the second half of the twentieth century, grew during the 1980-2005 period as a result of innovations and entry into new market niches. Similarly, a significant number of small to medium-sized durable goods manufacturers in Indianapolis were engaged in custom, batch, or high value-added production. These firms were able to compete against offshore manufacturers based on non-price factors while commod-ity production moved overseas. Although employment levels declined in these industries, the declines were less than the national average. Fabricated metal product manufacturing employment declined by 1.8 percent in Indianapolis, compared to an 18.2 percent decline across the country. Machinery manufac-turing employment decreased by 18.3 percent, compared to 32.7 percent nationally.
Indianapolis was fortunate to be an ideal location for a transshipment depot, given the evolution of domestic and global transportation costs. As an Indianapolis public official noted, Indianapolis “hap-pens to be located in the middle of four major interstates [U.S. 69, 70, 94, and 65] with a number of legs of major interstate [7] greater than any other metro area.” One warehouse manager revealed that his corporation would have located in the Indianapolis metropolitan area even if it was a “bombed out shell” because, by the firm’s calculations, Indianapolis was the population-weighted center of the United States. In addition, the Indianapolis region’s good air-to-road and rail-to-road connections, as well as lack of congestion that would cause delays in the time-conscious business, contributed to its competitive advantage.
Returns to capital in the Indianapolis region benefited from advantageous state and local tax policies. Tax structures affecting firms compare favorably to those in other Midwest regions and, when incentives are taken into account, are competitive nationally. Manufacturing firms interviewed reported little difficulty in receiving property tax abatements from cities or counties for investments in capital equipment and site expansions. In addition, Indiana’s employment taxes are reputed to be low compared to those of other Midwestern states.
The term used nearly universally in interviews to explain Indianapolis’ successes in attracting new businesses was its “business-friendly environment.” The state tax regime is a large component of the business-friendliness of the region. The “business-friendliness” seems also to be related to more quali-tative elements of the Indianapolis region’s political economy. The public sector in the region has been collaborative with the private sector. Multiple terms of the central city mayors and domination of city politics by a single party since the late 1960s have meant stability and low levels of uncertainty about policy directions. Outside Indianapolis/Marion County, city and county governments are reportedly non-obstructionist or even helpful to manufacturers in granting tax abatements for growth investments and to companies in obtaining the sites, utilities, and public services they need to conduct business.
Downtown-centric infrastructure investment, sports-based development, and subsequent public-private investments in parks, art, and culture dramatically improved the level of amenities in the Indianapolis region. Such improvements came at a relatively low cost to the region because they were heavily underwritten by the Lilly Endowment, private foundations, and corporations. The infusion of
BROOKINGS | June 201128
hundreds of millions of dollars of public, non-profit, and private funds into public projects contributed directly to economic expansion. Further, business executives interviewed judged that Indianapolis’ amenities, as a result of such investments, have become sufficient to attract and retain talented pharmaceuticals researchers, engineers and technical workers, and senior and middle managers. Anecdotes from executives and human resource directors of firms in the suburbs, as well as in Marion County, indicate that the amenities helped them to attract workers to the region.
The actions of public officials, non-profit activists, private sector leaders, and the organizations they created positively influenced the landscape of the Indianapolis region’s physical and institutional context for business before and during the 1980-2005 study period. Case study interviews revealed a history of good government, effective public-private collaboration, and high levels of social capital. The infusion of private capital into public works contributed directly to economic growth. The role of public and private sector collective action in job creation in Indianapolis should not be overstated, however. WellPoint, Lilly, Conseco, Guidant, Roche, Allison, the Motor Speedway, and many small and medium-sized automotive suppliers retained and created jobs in Indianapolis through successful strategic responses to competitive challenges of globalized product markets.
LouisvilleEvolution of the Metropolitan Economy, 1980–2005. Louisville gained jobs at a rate of 43.5 percent between 1980 and 2005, just under 1 percentage point above the national rate. Its inflation-adjusted average wage, however, rose by only 16.7 percent, nearly 12 percentage points below the national aver-age. This combination of slightly above-average job growth and well below-average wage growth is a consequence of the long-term loss of high-wage manufacturing jobs and their replacement by lower-wage jobs, especially in transportation and warehousing (United Parcel Service (UPS) air freight), health insurance, health care, and higher education.
In 1980, Louisville had a relatively diverse metropolitan economy. Its economic base consisted largely of a diverse set of manufacturing industries, although it was less specialized in manufacturing than any of the other metropolitan areas covered in this report. Manufacturing made up 21.2 percent of the area’s employment, 1.11 times its percentage of national employment. The largest manufactur-ing industries were in machinery manufacturing, beverage and tobacco products, fabricated metals, transportation equipment, and food manufacturing. Several large, locally owned alcoholic beverage and tobacco manufacturers, the plumbing supplier American Standard (also locally owned), a large International Harvester tractor plant, General Electric’s (GE) Appliance Park (the headquarters and chief manufacturing and R&D center for GE’s appliance division), and two Ford car and truck assembly plants were especially important.
Between 1980 and 2005, Louisville lost 14,000 manufacturing jobs. This loss amounted to a relatively modest 15.1 percent loss, far less than the 24.1 percent that the nation as a whole lost. Manufacturing job losses came in two waves, 1980-1985 (when the region lost 12.8 percent of its manufacturing jobs) and 2000-2005 (when it lost 17.7 percent). The largest absolute job losses from 1980 to 1985 were in machinery and beverage and tobacco product manufacturing, reflecting the closure and/or buyout of major locally owned firms. The largest absolute losses during 2000-2005 came in machinery and fabricated metal product manufacturing, perhaps reflecting the difficulties of Detroit Three-related auto parts manufacturing during this period. Every five-year period from 1985 to 2000 saw manufacturing job growth in the area, and by 1995 Louisville had more manufac-turing jobs (although a smaller manufacturing job share) than it had in 1980. The popularity of the Ford Explorer sport-utility vehicle, manufactured in Louisville, helped fuel this growth. The steep job losses of the early 2000s wiped out all the previous gains, though. The two periods of manufacturing job loss were characterized by a number of plant closings and downsizings but no single closing or downsizing had an especially large impact on the regional economy or loomed especially large in the consciousness of policymakers or business leaders. By 2005 the major manufacturing establishments were GE Appliance Park and the two Ford plants, and manufacturing accounted for only 12.5 percent of Louisville’s employment. That share was still 1.23 times the national average, so Louisville retained a substantial manufacturing specialization despite the large manufacturing job losses.
From 1980 to 2005 Louisville gained jobs in all major non-manufacturing industry groups except for agriculture, mining, and utilities, all of which lost jobs. The largest absolute job growth occurred in
BROOKINGS | June 2011 29
health care and social assistance (an increase of 37,800 jobs or 116.4 percent), administrative services (an increase of 26,300 jobs or 245.6 percent), and transportation and warehousing (an increase of 22,700 jobs or 163.3 percent). Of these industries, transportation and warehousing stands out, having outpaced the national growth rate over the same period by more than 100 percentage points. This growth was due largely to the expansion of UPS’ major hub at Louisville’s airport and consisted, in large measure, of part-time jobs. Other major industry groups that grew at rates above their respec-tive national averages were construction, real estate rental and leasing, administrative and support services, educational services, and arts/entertainment/recreation. Health care and social assistance and professional/scientific/technical services grew at rates similar to their respective national rates. The rapid growth of administrative and waste services may have resulted in part from the growth of Humana, a locally owned nursing home chain that grew into a hospital chain and then into one of the nation’s major health insurance companies and whose primary business today is health insurance.
By 2005 the Louisville economy was even more industrially diverse than in 1980, largely because of the loss of manufacturing jobs. In addition to manufacturing, the largest major industry groups in which the region was specialized included health care and social assistance and transportation and warehousing. Major non-manufacturing employers included Humana, the University of Louisville, and the hospital systems of Norton Healthcare, Jewish and Sts. Mary and Elizabeth Hospital, and the University of Louisville Hospital. In addition, the international fast-food conglomerate Yum! Brands, which grew out of Louisville’s Kentucky Fried Chicken, is headquartered in Louisville. There has been little high technology development in the area, although the local hospitals have made some notable contributions to medical research and treatment.
Economic Development Organizations and Actors. Louisville’s economic development organiza-tions and actors can be described in terms of social networks of business and public sector leaders, government economic development organizations, and private economic development organizations. Each went through a number of splits and reconsolidations during the 1980s and 1990s until the for-mation of the public-private Greater Louisville, Inc., created an economic development structure that was the most centralized in Louisville’s recent history and perhaps the most centralized of any of the metropolitan areas covered in this report.
Louisville’s traditional business leadership network consisted of 50-60 local families that owned the area’s major firms.50 By the 1980s this network had largely decayed as the local leaders retired or sold their companies to firms from outside Louisville, although old families still have some influence. In its place was a looser network of small, local businesses, which were mostly uninterested in regional-scale economic development, and larger firms that took a greater interest in metropolitan economic develop-ment.51 The latter included Humana, Kentucky Fried Chicken, the local daily newspaper, the University of Louisville, the city’s major hospitals, and some local banks. Large firms whose owners lacked ties to the region (such as Ford, GE, and UPS) did not participate in this network; they did not need to do so because their size made it possible for them to negotiate directly with state and local governments for economic development assistance. The business leadership network did not, and does not, operate in a centralized fashion. Instead, individual members would pursue their own favored development projects and try to obtain support for them from other network members and the public sector.
The split between small and large firms was manifested in tension with the region’s Chamber of Commerce over the Chamber’s role in economic development. Large firms interested in regional economic development periodically formed separate organizations to pursue their goals. Project 2000 was formed in 1981 to advocate for city-county consolidation as an economic development strategy; when that effort failed, it merged back into the Chamber in 1983. The Greater Louisville Economic Development Partnership, formed in 1988, pursued a “Regional Economic Development Strategy” based on targeting of the region’s major industry clusters. It merged with the Chamber in the late 1990s to form Greater Louisville, Inc. (GLI). (See below.)
Jerry Abramson, mayor of Louisville from 1986 to 1998 and of the merged (city-county) Louisville Metro from 2003 through early 2011, and his predecessor, Harvey Sloane, were the major public sector members of the metropolitan area’s economic development leadership network. They did not initiate major economic development efforts but deployed the power of city government on behalf of individ-ual firms or private sector economic development leaders. For example, a leading real estate developer alerted Mayor Abramson to the fact that UPS was considering leaving Louisville if the airport was not
BROOKINGS | June 201130
expanded. The Mayor then initiated the process of planning and taking land for the airport expansion via eminent domain.
The city of Louisville and surrounding Jefferson County each had an economic development office responsible for business retention and expansion. In 1986 the city and county offices were merged as part of a city-county Compact, eliminating duplicative services. The Greater Louisville Economic Development Partnership was made responsible for business attraction and marketing, eliminating city-county rivalry over firm location.
In 1997 the Chamber and the Economic Development Partnership merged to form GLI, the metro-politan area’s umbrella economic development and business leadership organization. With a board of directors consisting of business and public sector leaders, including those from large firms not other-wise active in regional economic development activities, GLI was formed to implement the vision of the metropolitan area’s economic development leaders to transform Louisville from a “nice, average city” to an economic “hot spot.”52 GLI took over economic development for the city and county and, later, for the merged Louisville Metro. In addition, GLI performs the advocacy and business service functions of a traditional Chamber of Commerce and brings together business and government leaders in support of the Regional Economic Development Strategy and downtown development initiatives. In the early 2000s GLI helped firms in several local industries to come together to form industry cluster groups, in which they could jointly identify and work to solve problems specific to their industry clusters. Our interviewees almost unanimously regarded GLI as the key driver of economic development in the Louisville area. However, its importance, up through 2005, seemed to be more as a forum and connec-tor of leaders, ideas, and resources than as an implementer of economic development strategy.
Major Policies and Strategies. Although manufacturing job loss was the major threat to the metro-politan area’s economic base during the 1980-2005 period, economic development leaders cast their policies and strategies as responses to economic decline in general rather than to the loss of manu-facturing per se, perhaps because no single plant closing had a major impact on the area’s economy. Before Mayor Abramson took office in 1986, business leaders pursued broad, general goals, such as increasing the number of office or high technology jobs.53 They used the standard economic develop-ment incentives to pursue those goals but did not have a more targeted strategy for reaching them.
Beginning in the mid-1980s, economic development leaders began to target specific industries as antidotes to economic decline. They promoted the growth of logistics and distribution and health care and biomedical research and, to a lesser extent, the retention of manufacturing. These were the broad industries in which the metropolitan area already specialized. Logistics and distribution and health care and biomedical research were also expanding and offered prospects for future growth, while man-ufacturing remained too large a part of the region’s economy to abandon entirely. By the mid- to late 1990s economic development leaders had reached a consensus on the need to come together in sup-port of a shared vision that was based on reviving Louisville’s economy by targeting these industries. In 1996 the Chamber of Commerce and Economic Development Partnership hired Colorado-based economic development consultant Ross Boyle to write a report on the Louisville economy and make policy recommendations. Boyle’s report, which may have reflected the leadership’s emerging consen-sus and/or helped to create or solidify it, challenged economic development leaders to work together to transform the region into an economic “hot spot.” The report led to a “visioning” process in which economic development leaders formalized the Regional Economic Development Strategy, which was centered around logistics and distribution and health care and biomedical research. The consensus that accompanied the Boyle Report resulted in the creation of GLI.
Economic development leaders pursued specific policies and strategies designed to expand or retain jobs in the two major targeted industries. In the case of logistics and distribution, this meant using public resources to help UPS expand and, later, stay in Louisville.54 UPS moved its air freight package-sorting facility from Chicago to Louisville in 1981. The operation grew, but UPS needed a bigger airport to support continued growth and threatened to leave the area if Louisville’s airport was not expanded. In the late 1980s the city used its power of eminent domain to expand the airport after Mayor Abramson learned of the possibility that UPS might leave. Before making this policy public, the mayor met with business leaders and obtained their support for it, and the developer who alerted the mayor to UPS’ impending move seems to have been the major force behind the policy.55 The initial impacts of the airport expansion were the demolition of three residential neighborhoods; UPS’ creation of

BROOKINGS | June 2011 31
many low-wage, part-time, overnight package-handling jobs, a smaller number of higher-wage jobs for pilots and mechanics; and the attraction of other companies’ distribution centers. Later on, the UPS operation also attracted many other logistics businesses, such as overnight computer repair firms, and began to perform some repair and other service functions for its package-shipping clients. By the mid-1990s UPS was the metropolitan area’s largest private employer.
By 1997, UPS perceived potential shortages of part-time, overnight workers in Louisville. It began to consider alternative locations, especially Columbus, OH, which offered similar locational advantages to Louisville plus a large number of college students as a potential workforce. The governor of Kentucky, city and county officials, and the leaders of the University of Louisville and the community and techni-cal colleges held an emergency meeting in which they created Metropolitan College as a solution to UPS’ workforce problem. Metropolitan College enables any UPS part-time worker to take, at no charge, an unlimited number of college classes in any subject and at any level (up to and including degree attainment) at either the University of Louisville or Jefferson Community and Technical College. The state and UPS jointly pay the tuition. Students are eligible as long as they remain employed at UPS. UPS credits the program with keeping its hub in Louisville and reducing turnover of its part-time work-force, and the program seems to have attracted many students from rural Kentucky to Louisville to obtain a free college education.56
Policies directed at health care and biomedical research were more modest and their economic development impact less clear. In 1998, the state of Kentucky launched a “Bucks for Brains” initiative at the University of Louisville and the University of Kentucky, in which it matched private donations to create endowed professorships in areas of strategic importance to the state.57 The state appropriated $110 million for the program in 1998 and $120 million in each of 2000 and 2005. The intent of Bucks for Brains was to attract outstanding faculty to the universities to spur innovation, entrepreneurship, and economic growth. As of 2010, the program had succeeded in attracting 59 outstanding faculty members and more than $210 million in federal research funding to the University of Louisville. However, it is dif-ficult to attribute any specific impact on the region’s economic development trajectory to the program.
The other health care-oriented strategy was the expansion of Metropolitan College to Norton Healthcare. To alleviate perceived shortages of nurses and health technologists, Norton paid the tuition of students who agreed to work for it after completing their degree programs at the University of Louisville or Jefferson Community and Technical College. This “Norton Scholars” program has helped Norton meet its own workforce needs, although its broader economic development impact is uncertain.
Unlike policies and strategies toward logistics and health care, policies toward manufacturing are mainly traditional tax abatements and other city and state government subsidies designed to keep Louisville’s Ford and GE plants open. These subsidies seem to have been a factor in keeping GE in Louisville during the 1980-2005 period.58 The city and state seem to do little to expand manufactur-ing employment or improve manufacturing productivity and quality in Louisville. The federal-state Manufacturing Extension Partnership, which helps small and medium-sized manufacturers improve productivity and quality, has a smaller presence in Louisville than in our other case study regions. GLI’s industry cluster groups include some for manufacturing; these may have an impact on small manu-facturers’ productivity and quality, but the cluster groups were formed too recently for us to assess their impact.
Like their counterparts in our other case study regions, public officials and economic developers have pursued downtown revitalization strategies. These have included the construction of stadiums and arenas, the creation of the Fourth Street Live! Entertainment and retail complex, and a new park/green space initiative. GLI, in particular, views downtown revitalization as important for attracting young managers and professionals to Louisville. However, none of our business interviewees, including those in health care and venture capital, mentioned downtown revitalization as an attraction for work-ers or firms. The downtown efforts themselves do not appear to be part of a unified strategy. Rather, individual economic development leaders pursue their own separate downtown projects and seek the support of other business and government leaders for those projects. The projects may or may not have the effect of making Louisville a more attractive place for young workers but workforce attraction has not been an explicit goal of the projects.
Finally, the 2003 merger of the city of Louisville with surrounding Jefferson County was intended, in part, to promote economic development. Merger was a longstanding goal of economic development
BROOKINGS | June 201132
leaders dating back to the 1950s. After three unsuccessful referenda during the previous five decades, voters approved the merger in 2000. Advocates believed that merger would streamline business attraction and retention efforts by eliminating interjurisdictional service duplication and rivalry, make Louisville more visible to corporate site selectors by making its population appear larger, “shake up” the city to create an economic boom, and improve Louisville’s ability to compete for business with nearby Lexington, Indianapolis, and Nashville, all of which already had merged city-county govern-ments. However, the 1986 city-county Compact merged the two jurisdictions’ economic development departments, so the metropolitan area already had some of the economic development benefits of full governmental merger. A comparison of pre- and post-merger trends in employment, payroll, and business establishments reveals no major changes in these indicators after merger.59 Merger may have other merits but stimulating economic development does not appear to have been one of them, at least not yet.
Of all Louisville’s major economic development strategies and policies in the 1980-2005 period, only the two directed at UPS (airport expansion and Metropolitan College) appear to have changed the economic trajectory of the metropolitan area. Without these measures UPS probably would have left Louisville. With them, UPS became the center of a new logistics and distribution cluster in the metro-politan area. Other policies and strategies may have affected individual firms or industries, created favorable conditions for future growth, or had impacts after 2005, but the UPS-oriented policies were the only ones that had regional-scale economic impact between 1980 and 2005.
Other Influences on Economic Development. Louisville’s central location, within a day’s drive of most of the major metropolitan centers of the South, Midwest, and Northeast, has been an important influence on its economic development. Louisville’s central location was a major reason why it became a manufacturing center. It was also a major reason why UPS moved its air freight hub to Louisville from the less centrally located (in terms of population access) Chicago.
Louisville’s educational and training system was consistent with the kinds of economic develop-ment that took place there. Although some of our interviewees told us that Louisville’s public schools were the best in Kentucky, they also believed that Kentucky’s low levels of educational spending and achievement and the low priority that state government placed on education had impeded Louisville’s development of high technology industry. Moreover, until recently the state-supported University of Louisville was mainly a local-serving undergraduate institution, reflecting its origin as a municipally funded university. The university was unable to secure state funding comparable to that of the state’s flagship University of Kentucky. Finally, Jefferson Community and Technical College, the metropolitan area’s major provider of non-credit workforce development programs, oriented those programs pri-marily toward existing large firms in the area, working closely with those firms to serve their changing needs. These features of the educational and training system may have helped account for the fact that Louisville’s population had relatively low proportions of high school and college graduates com-pared to similar Midwestern and Southern metropolitan areas.60
As in other case study regions, interviewees cited the area’s high quality of life and moderate cost of living as features that helped retain businesses and high-level employees. The 2000 Places Rated Almanac ranked Louisville as the 14th-best place to live in North America.61 The metropolitan area’s cost of living in 2007 was slightly below that of Rochester, Cleveland, and Grand Rapids and slightly above that of Indianapolis.62 We were told that a high quality of life also helped attract some managers and professionals to the region if they had previously lived there or had family there.
Interviewees described Louisville’s business culture as one in which slow, steady growth was valued over the ups and downs of a more dynamic economy. The business community’s widespread accep-tance of the Boyle Report and the creation of GLI may have signaled some change in this orienta-tion in favor of making Louisville an economic “hot spot.” However, this change seems to have been relatively slow and may have been largely rhetorical; neither the employment and wage data nor our interviews show evidence of more rapid economic growth, more variability in economic performance (higher peaks and lower valleys in employment or wages), or rapid change in the industrial composi-tion of the metropolitan area’s economy in the years since GLI was created.
The business decisions of large firms, such as UPS and Ford, that provide goods or services to resi-dents of other regions, and the market factors that shaped those decisions, were responsible for much of the path of economic development in the Louisville area between 1980 and 2005. Declining costs

BROOKINGS | June 2011 33
for shipping goods, including declining costs of trucking (which is complementary to UPS’ air freight operations), helped fuel the growth of UPS, while public policy was responsible for keeping UPS’ hub in Louisville.63 Declining (inflation-adjusted) gasoline prices during the late 20th century stimulated the demand for sport-utility vehicles, which Ford produced in Louisville. The growth of these regional export firms (and the decline of others) during the 1980-2005 period influenced employment in local-serving businesses as well. Louisville’s firms, overall, were roughly competitive with their counterparts in the same industries nationwide, as evidenced by the fact that Louisville’s total 1980-2005 job growth rate was only 0.9 percentage points lower than it would have been if all the metropolitan area’s industries had grown at their respective national rates.64
RochesterEvolution of the Metropolitan Economy, 1980-2005. Total employment in the Rochester region increased by nearly 23 percent between 1980 and 2005, roughly 20 percentage points less than in the nation as a whole. However, if each industry in the Rochester economy had grown at its respec-tive national rate, the region’s total employment would have risen by 36.4 percent rather than the 22.6 percent increase it did experience. The economic decline in Rochester was driven by the hemor-rhaging of manufacturing jobs from the region. Rochester lost 61,200 manufacturing jobs, or 44.0 percent of its manufacturing employment, between 1980 and 2005. A substantial proportion of these losses resulted from the decline of Kodak, the region’s largest manufacturer. If Rochester had simply lost manufacturing jobs at the same rate as did the U.S. economy as a whole (-24.1 percent), it would have lost only 33,500 manufacturing jobs. Twenty of the 21 manufacturing industries in Rochester (all except plastics and rubber products) lost jobs over the period.
In addition to declines in manufacturing employment, wages in the Rochester region also suffered over the time period. Although the region began the period with wages above the national average, between 1980 and 2005 the inflation-adjusted average wage in Rochester (across all industries) grew by only 5.4 percent, compared to 28.4 percent nationwide. Average wages in Rochester manufacturing grew more rapidly—at an inflation-adjusted rate of 13.4 percent—but the region still trailed the national average manufacturing wage growth rate of 28.8 percent.
Despite the large job losses in manufacturing, the Rochester region remains disproportionately reli-ant on manufacturing for employment; in 2005 manufacturing made up 1.46 times higher a percent-age of metropolitan Rochester employment than of nationwide employment. Nonetheless, it is less concentrated in manufacturing than it was in 1980, when manufacturing’s share of the metropolitan area’s employment was 1.7 times higher a percentage of metropolitan Rochester employment than of nationwide employment.
Total employment in the region grew by 22.6 percent from 1980 to 2005 (although from 2000 to 2005 total employment fell by 3.1 percent). The growth was driven by gains in health care and social assistance, which increased by 35,400 jobs (108.3 percent) between 1980 and 2005, and educational services, which gained 18,600 jobs (136.8 percent) over the same period. Rochester’s relative special-ization in educational services also grew from 1980-2005, as its share of the metropolitan area’s total employment rose from 2.26 times the national average to 3.21 times the national average. A similar trend held for health care and social assistance, as its share of Rochester’s employment rose from 1.10 to 1.23 times the national average share.
Until recently, Kodak, Xerox, and Bausch & Lomb dominated the region in terms of employment, influence, and clout. These “Big Three” optical-electronics companies grew to dominate the global markets for their respective products. Kodak became the world’s leading manufacturer of cameras and film, Xerox became the world’s top producer of photocopiers, and Bausch & Lomb came to supply forty percent of the world’s eyeglasses.
The economic downturn in Rochester’s traditional manufacturing industries was led by job cuts at these three employers. According to the Wall Street Journal, Kodak, Xerox, and Bausch & Lomb alone eliminated 26,500 jobs in the area from 1993 to 2004.
Kodak, in particular, suffered during this time period. Between the years of 1982 and 2008, the company cut 51,200 jobs and employment dropped from 60,400 employees to 9,200 employees. There were several reasons for Kodak’s decline: failed products, increased productivity in film produc-tion, the core of Kodak’s activity, that resulted in a more capital-intensive process requiring less labor,
BROOKINGS | June 201134
outsourcing, and the rise of digital photography. Economic Development Organizations and Actors. Establishing and reorganizing the region’s
institutional infrastructure for economic development was one of the most visible responses to the region’s manufacturing decline. Because the “Big Three” dominated economic, political and social life for so many years, prior to the late 1980s Rochester’s local governments had not had to formulate or implement comprehensive economic development policies independently.
Monroe County established an economic development office in 1988 in response to job losses in the region, while the city simultaneously attempted to increase its interactions with the private economy. However both the city and county economic development departments have remained small since their inception, and neither has added much in terms of programs, staffing or capacity since the late 1990s. As one of our interviewees noted, “With the city of Rochester under the control of the Democratic Party and Monroe County usually controlled by the Republican Party, city and county cooperation on economic development issues has been episodic.”
In terms of business groups, prior to the collapse of the “Big Three,” there were separate organi-zations serving different elements of the business community. The Chamber of Commerce and the Industrial Management Council functioned as separate, overlapping entities, with competing visions and needs. The Industrial Management Council and the Chamber of Commerce finally merged in 2000 to form the Rochester Business Alliance (RBA), which now functions as the chamber of commerce. RBA serves the entire Rochester region and provides information, advocacy, human resource services and networking to regional employers.
Simultaneously, in the late 1990s and early 2000s individuals in the business community began to feel constrained and frustrated with the limited economic development activities underway at the city and county. Two successful local entrepreneurs joined forces to spawn Greater Rochester Enterprise (GRE). Established to be independent from both the public sector economic development entities and RBA, GRE’s creation spurred conflict over roles and responsibilities. Eventually, these turf battles were resolved and GRE became the region’s acknowledged leader in marketing and business attraction. GRE remains an independent public-private partnership. Many interviewees asserted that conflict over roles and responsibilities delayed the region’s response to the community’s changing eco-nomic circumstances.
In addition to these broad-based organizations, Rochester businesses created industry organiza-tions focused on specific clusters. The Rochester Photonics Cluster represents the region’s more than 60 optics, imaging and photonics companies serving industries including aerospace, biomedi-cal, defense, manufacturing, remote sensing, semiconductor and telecommunications. The Rochester Tooling and Machining Association was established to support the region’s important advanced manufacturing firms. High Tech Rochester (HTR) was established as the community’s technology development organization, whose mission is to stimulate growth in the Rochester region’s technology-based business sector and to assist businesses with the identification, development, and incubation of opportunities.
The formal economic development organizations discussed above have historically been less impor-tant than informal private sector leadership exercised by the “Big Three,” and particularly Eastman-Kodak. However, the participation of the “Big Three” in civic affairs declined substantially as these firms confronted new global competition and focused their energies on firm survival.
Once Kodak was no longer willing to be the driving force behind business collaboration, a number of informal and formal groups were established, GRE being the latest and longest-lasting. Although business leaders made attempts to foster private sector collaboration and leadership in the post-“Big Three” era, those initiatives did not translate into substantial tangible outcomes. The “Breakfast Club” played a significant role in the community during the early 1980s, providing key leadership for downtown development. The “CEO Group” and later the “Rump Group” also exercised a degree of concerted civic leadership. The Rump Group was absorbed by the Rochester Business Alliance and has since become the RBA’s Executive Committee. As a result the informal CEO commitment to civic affairs and economic development has now been formalized within the RBA and GRE.
Major Policies and Strategies. When the “Big Three” firms, especially Kodak, began shedding jobs in the 1980s, many residents and public officials refused to recognize the seriousness of the threat to the economy, believing that the job losses were temporary, Kodak would make a comeback, and public

BROOKINGS | June 2011 35
action was unnecessary. As one interviewee told us, “Everyone thought that Kodak and Xerox would always be there. It wasn’t until 2000, when Kodak started laying off 600 workers at a time, that people started to think there may be a problem.”
As decline set in, leaders of the formal and quasi-formal economic development organizations responded by creating new institutions and reorganizing existing ones as described above. These institutional changes were, in themselves, a substantial part of the response of the economic develop-ment community to manufacturing decline, apart from the activities in which the institutions would be engaged. Indeed, the activities these new and restructured organizations undertook were typical of those adopted at state and local levels nationwide from 1980 to 2005, including subsidies to attract individual firms (the city and county development authorities), marketing of the region, retention ser-vices and activities, technology-based economic development (High Tech Rochester), industry cluster assistance (the cluster associations for photonics and for tooling and machining), entrepreneurship promotion, efforts to integrate workforce development and economic development (the Finger Lakes WIRED initiative in the early 21st century, supported by the U.S. Department of Labor’s Workforce Innovation in Regional Economic Development program), and community college and university pro-grams (particularly the University of Rochester and Rochester Institute of Technology) in support of workforce and economic development, entrepreneurship, and commercialization.
In addition, the city of Rochester pursued an active “amenities strategy,” focusing heavily on improv-ing the downtown area. The region’s leaders felt that if they improved downtown they could enhance the already-high quality of life in the region and by making downtown a more attractive and livable place, they would be able to attract businesses and talented workers, retain college students, and maintain an educated, sophisticated labor force.. This strategy amounted to “focusing on something we could control,” a Rochester journalist told us. The city undertook several downtown development projects that combined public and private investment during the time period.
Throughout our interview research, the one initiative that we heard about most frequently was the fast ferry project, which had long been discussed in the community. Rochester Mayor Bill Johnson solicited proposals to develop a ferry that would link Rochester to fast-growing Toronto. Together, the city and state governments initially invested $15.3 million in capital construction, including building a ferry terminal in the Port of Rochester.65 As one of our interviewees explained, the private opera-tor selected made several tactical errors, particularly the decision to purchase a relatively large vessel (750 passengers and 220 cars), thus imposing crippling fixed operating costs on the venture. Faced with high costs, low ridership and mechanical problems), the Spirit of Ontario operated for part of 2004, only to cease operations when it became clear that it was not financially viable. Hoping to recoup a portion of the investment, the city of Rochester took possession of the vessel in 2005 through a foreclosure action. When a new mayor took office in 2006, he decided to cease ferry opera-tions permanently and to sell the boat to a European company for $29.8 million. This left taxpayers with roughly $20 million in remaining debt on the ferry project.66 Public disgust and animosity regard-ing the ferry project still runs deep in the Rochester community. Interviewees referred to the ferry project as an “utter debacle” and an “economic development catastrophe.”
Based on our interview research, it does not appear that policy-making in the Rochester region had an important effect on economic conditions. Interviewees felt that community-wide denial led to inaction, and that when collective action finally did occur, the proliferation of economic development entities and the resulting turf battles impeded the region’s progress. When questioned about economic performance, most of our interviewees did not mention public policy at all without being probed. When we asked about public policy, we heard statements such as, “Public policy hasn’t really existed -- it hasn’t made much of a difference”; “Job growth has occurred in spite of public policy”; and “People keep looking to government, but it’s useless.”
Other Influences on Economic Development. When we asked Rochesterians why the region per-formed as it did over the period—why, despite grave manufacturing losses, the region still gained jobs, albeit less than would have been expected given its economic structure -- we heard a story of private sector initiatives and firm-specific strategies, strong leadership and vision at the universities, a strong labor force, a pro-education culture and a high quality of life in the region. We heard stories of regional creativity; however, we also heard about the region’s conservative business culture, which may have held the region back. We did not hear much about public policy unless we directly asked about it.
BROOKINGS | June 201136
Firm-specific strategies. In addition to downsizing its workforce over the period of our study (dis-cussed above), Kodak, beginning in the mid-1990s, revamped its business model and became much less vertically integrated. It identified two core competencies, nanoparticles and imaging science, and decided to focus only on those two operations while outsourcing all other functions. In addition, Kodak began aggressively marketing hundreds of patents to outside developers. At the height of Kodak’s suc-cess, the company “was literally developing one new idea per day,” one interviewee stated. However, other than those it developed internally, Kodak did not historically take ideas to market. When Kodak began to decline it was able to capitalize on this opportunity and the intellectual property team took many of the patents to market, generating substantial revenue. Despite the fact that Kodak’s core market—photographic film—nearly disappeared over a period of only five years, the company has survived and continues to remain a prominent economic force in the Rochester region. As one Kodak executive suggested, “The question should not be, ‘Why did Kodak decline?’ The question should be, ‘How did Kodak succeed in the face of such huge changes in the market?’”
While Kodak and other manufacturing companies in the region were declining, the University of Rochester was expanding and ascending in importance as a driver of the regional economy; it is now the region’s largest employer. In 2010, the University and Strong Partners Health System (the universi-ty’s affiliate hospital) directly employed 19,600 people, a marked change from 1988 when it employed only 9,784. When considering the direct and spillover effects of the university’s employment, the Center for Governmental Research estimates that the university is responsible for generating 31,000 jobs in the region or approximately $1.4 billion in annual income of which $820.7 million are the result of exported goods and services.67 Much of the recent growth of the university can be largely attrib-uted to the expansion of the University of Rochester Medical Center (URMC) under the leadership of Jay Stein and subsequent leaders. URMC adopted a strategic plan in 1996 that drove the institution’s growth and expanded the role of the university in the regional economy. By 2006, the Strong Partners Health System directly employed 12,700 full-time equivalent workers.
Another educational institution, the Rochester Institute of Technology (RIT), under the leadership of Al Simone, also greatly increased its importance in the regional economy. When Simone became president in 1992, RIT’s enrollment was at 13,000, the school’s total endowment was $189 million, and the operating budget was $240 million. When Simone left in 2007, enrollment had risen to 15,200, the endowment had grown to more than $580 million, and the school’s operating budget had increased to more than $492 million.68 RIT is now the region’s eighth largest employer, and directly employs 3,435 workers.
Workforce. The Rochester region has a workforce with a high concentration of highly educated, spe-cialized workers relative to the rest of the nation. This specialization is unsurprising considering the technical specialization of the region’s “Big Three.” Despite frequently expressed concerns about the quality of the city of Rochester public schools, it appears that the region’s private sector leaders are relatively content with the capacity of the region’s workforce, although some of the individuals that we spoke with complained that workers often lack the soft skills and the technical expertise necessary to succeed at entry-level jobs. In addition, some expressed concern that, unlike the graduates of many other highly regarded research universities, few students from outside of the Rochester region who attend the University of Rochester choose to remain there after they graduate, representing a loss of potential highly skilled workers.
Educational System. With the exception of the central city’s public schools, the Rochester region’s academic institutions are among the strongest in the country. The region’s local school districts con-sistently receive national praise for their quality and performance and five Rochester area public high schools are ranked among the top 100 in the country.69 There are 18 colleges and universities in the region, providing education to roughly 75,000 students.
Business Culture. The Rochester region has traditionally been viewed as innovative but as having a conservative and not terribly entrepreneurial business culture. The region’s innovation is a prod-uct of the firms located there; organizations in the Rochester region receive patents at close to six times the national average. Most of these patents, of course, are generated within and through the research and development activities of Kodak and Xerox. Nonetheless, we were told that conserva-tism permeates the decision-making process in the region, restricting the region’s entrepreneurial potential. Interviewees almost unanimously described Rochester’s business culture as “creative yet

BROOKINGS | June 2011 37
conservative.” Respondents suggested that business leaders aren’t risk-takers; that, while the region houses many creative people, the business community is skeptical of change. We heard that regional leaders are not welcoming of failed pursuits, which are an essential ingredient of entre-preneurship. Therefore, although individuals within the region have been good at inventing ideas, they have been poor at bringing them to market. “Conservatism slows us down,” said one successful entrepreneur.
Quality of Life. Interview respondents also posited that the region’s high quality of life has helped to retain residents and businesses over the time period. Forbes, Expansion Management Magazine and the Places Rated Almanac consistently praise the Rochester region for cultural and recreational amenities, and the 2007 Places Rated Almanac ranked Rochester as the sixth best place in the nation to live.70 Furthermore, Rochester’s cost of living is approximately at the national average.71 Interview respondents felt that the high quality of life in Greater Rochester helps to retain business establish-ments and residents despite the changing economic structure of the region.
ScrantonEvolution of the Metropolitan Economy, 1980-2005. The Scranton metropolitan area consists of Lackawanna County (including Scranton), Luzerne County (including Wilkes-Barre and Hazleton), and Wyoming County. The area gained jobs at the relatively slow rate of 22.5 percent from 1980 to 2005, or slightly more than half the nationwide rate. However, if each industry in the region had grown at its respective national rate, the region’s total employment would have risen by 33.2 percent rather than 22.5 percent. The region’s inflation-adjusted average wage also grew slowly, increasing by 17.9 percent during the period, or 10.5 percentage points less than the national rate. This combination of slow job and wage growth reflects the impact of large manufacturing and mining job losses and job growth in relatively low-wage export industries such as logistics and back-office services.
In 1980, manufacturing accounted for 29.6 percent of all jobs in the Scranton region, which was 1.55 times its share of all jobs nationwide. Fully one-quarter (25.3 percent) of these manufacturing jobs were in apparel manufacturing, which accounted for 7.5 percent of all jobs in the region, or 7.49 times its nationwide share. Computer and electronic products accounted for a further 9.6 percent of manufacturing jobs (2.8 percent of all jobs, or 1.41 times its share nationwide) and fabricated metals manufacturing accounted for 9.2 percent of manufacturing jobs (2.7 percent of all jobs in the region, or 1.47 times its share nationwide). Scranton’s large manufacturing industries were primarily engaged in the production of commodity goods, such as cut-and-sew garments and cathode ray tube televi-sions. As in other regions of the country, the jobs associated with producing commodity goods were especially vulnerable to being offshored or moved to lower-cost regions of the country.
Manufacturing employment in Scranton was nearly cut in half from 1980 to 2005, as the region shed 28,900 manufacturing jobs (a decline of 45.4 percent). Manufacturing job loss was persistent during this 25-year period, with 1984, 1989, and 2000 marking the only years in which manufacturing did not lose jobs. The region’s most dramatic period of losses occurred between 2000 and 2005, when it lost 10,500 manufacturing jobs (a 23.2 percent decline). The 1980-1985 period was second-worst, with 8,600 jobs lost (a 13.5 percent decline), while the 1995-2000 period was the least severe, with 800 jobs lost (a 1.8 percent decline). More than half (54.1 percent) of the total manufacturing job loss in Scranton was attributable to losses in apparel manufacturing, as the industry was essentially wiped out. From 1980 to 2005, apparel manufacturing lost 15,600 jobs (a decline of 97.0 percent), with most of the losses occurring from 1980 to 1995.
After job losses in apparel began to taper off, additional losses were quick to occur in other industries. In May 2001, Thomson Electronics announced the closing of its picture tube plant in the region, laying off 1,100 workers.72 The plant was moved to Mexico, where wages were reported to be 80 percent lower.73 Also in mid-2001, Corning announced it would close one of its plants producing fiber optics in the region. The plant had been completed just a year earlier during the dot-com bubble, but as the bubble burst nationwide, so did the promise that the Internet boom would bring a large number of high-tech manufacturing jobs to the region.74 From 2000 to 2005, the largest manufac-turing losses occurred in computer and electronic products manufacturing, which lost 2,700 jobs (a decline of 47.3 percent), and in nonmetallic mineral products manufacturing, which lost 2,100 jobs (a decline of 62.3 percent).
BROOKINGS | June 201138
However, not all manufacturing industries lost jobs during this period. Food manufacturing gained 1,500 jobs from 1980 to 2005, an increase of 58.1 percent and 64.4 percentage points greater than its national growth rate. Similarly, plastics and rubber products gained 1,600 jobs, an increase of 68.2 percent and 55.3 percentage points greater than its national rate. By 2005, they were the region’s second- and third-largest manufacturing industries (up from ninth and eleventh in 1980), respectively, and their shares of total employment were 1.61 and 2.55 times their respective national employment shares.75
Scranton’s non-manufacturing industries added jobs at a rate of 51.0 percent from 1980 to 2005, which was 7.4 percentage points slower than the U.S. rate. The growth was led by health care and social assistance, which added 21,800 jobs, an increase of 118.0 percent, 1.2 percentage points greater than the national growth rate. Back-office services, especially those relocating from New York and New Jersey, boomed in Scranton, fueling the addition of 9,700 jobs in administrative and support ser-vices, a 263.1 percent increase, 39.5 percentage points faster than the industry’s national job growth rate. Evidence of this growth can readily be seen with a visit to the large Montage Mountain develop-ment in Moosic, which contains office parks as well as shopping, restaurants, and recreation. The region’s retail trade industry gained 9,000 jobs, or 36.2 percent, but trailed its national job growth rate by 6.1 percentage points. Accommodation and food services added 7,400 jobs, an increase of 59.6 percent, but still 30.7 percentage points short of its national job growth rate. Trucking and warehous-ing experienced rapid growth, owing in large part to the region’s proximity to large population centers on the east coast in addition to the availability of cheap land. Transportation and warehousing gained 5,700 jobs, a 96.9 percent increase, 36.6 percentage points faster than its national job growth rate.
By 2005 Scranton’s economy was more industrially diverse than in 1980, primarily as a result of job losses in manufacturing. In 1980, manufacturing accounted for 29.6 percent of the region’s jobs, but by 2005 this share had fallen to 13.2 percent. Health care and social assistance increased its share of jobs by 6.7 percentage points, as it became the largest industry in the region. Administrative and sup-port services increased its job share by 3.4 percentage points, while both accommodation and food services and transportation and warehousing increased their shares by 1.7 percentage points. These numbers point to the changing face of Scranton, from a region that was primarily driven by manu-facturing to one that relies more heavily on service industries, especially back-office services, health care, and logistics.
Economic Development Organizations and Actors. Scranton’s economic development organiza-tions have mostly been concerned with business attraction through site preparation, marketing, and the provision of incentives. These efforts have been led primarily by the region’s chambers of commerce and reflect a longstanding approach toward economic development that the region pioneered many decades prior to our study period. The emphasis on attraction reflects an economic development landscape that has mostly been oriented toward capitalizing on the region’s compara-tive advantages, such as proximity to major east coast metropolitan areas, low cost real estate, and reliable, low-cost labor. The organizations engaged in this work have been quite proficient in their work. Notably, though, they have not tried to reposition the region to create new sources of regional advantage. The region is home to many small colleges, but it lacks a large research university and, during our study period, lacked a medical school—both of which have aided economic development in other regions. Furthermore, not since salt manufacturer AkzoNobel left town has a large company headquarters called the region home; instead it is home to branch plants and back-office locations. This has left the area without the kind of deep-pocketed corporate citizens who might otherwise pro-vide economic development leadership.
Coal put Scranton on the map, but it resulted in a regional economy that was dependent on a single product. Even during coal’s heyday in the late 1800s, many local business owners worried about what would happen to their own businesses if and when that industry began to fade.76 As a response, they formed the Scranton Board of Trade in the 1880s to focus on economic development.77 The most impressive achievement during this early era was the founding of the Scranton Industrial Development Company (SIDCo) in 1914, with $1.2 million in funding from the sale of bonds to busi-nesses and individuals. SIDCo aimed to spur manufacturing growth in the region through direct invest-ments from its fund.78 The Board of Trade ultimately became Scranton’s Chamber of Commerce, which today describes SIDCo as “the forerunner of all future Chamber economic development efforts.”79
BROOKINGS | June 2011 39
Funding drives for economic development became common modes for combating the decline of coal and loss of business following World War II. In 1945, Scranton’s Chamber organized a funding drive to purchase the plant that the Murray Corporation had used to produce wings for the B-29, allowing the company to remain in the region producing household appliances.80 A year later, a funding drive cre-ated the Scranton Lackawanna Industrial Building Company (SLIBCo) to further the region’s push into manufacturing through the financing and construction of industrial shell buildings to entice manu-facturers to the region.81 Five years later, yet another drive funded the creation of the Lackawanna Industrial Fund Enterprises (LIFE), which built on the efforts of SLIBCo to fund the creation of new manufacturing facilities. These organizations have formed the backbone of the Scranton Chamber of Commerce’s economic development effort for the decades since they were created, establishing a mode of operation for the Chamber that has been focused on making deals, first to bring manufactur-ers to the region and later, as manufacturing declined, to bring back-office operations to office parks it helped to construct.
In nearby Luzerne County, economic development efforts in the cities of Wilkes-Barre and Hazleton mirrored those in Scranton. In Hazleton, the Community Area New Development Organization (CAN DO) was created with a mission similar to that of SLIBCo, as was the Greater Wilkes-Barre Industrial Fund. As these early organization pursued business, the competition between them pitted Scranton, Wilkes-Barre, and Hazleton against one another.82 The legacy of interjurisdictional competition has been a persistent storyline in the region, though there have been recent attempts to promote region-wide cooperation in its economic development efforts.
The region’s utility, Pennsylvania Power & Light (PP&L), has functioned as a region-wide player in economic development since the early industrial development efforts in Scranton, Wilkes-Barre, and Hazleton.83 More recently, PP&L has sought to end the cycle of competition within the region. Instead of providing marketing dollars to each city individually, as it had done for some time, it founded a regional marketing organization called Penn’s Northeast in the 1990s. The organization has served as a point of contact for companies looking to locate in the region, providing site selection services inde-pendently of the region’s chambers (though it operates with the chambers’ support). Further nudging the region’s economic development organizations towards greater cooperation, PP&L helped pave the way for a first-time meeting in 2003 between the chambers of commerce of Scranton, Wilkes-Barre, Pittston, and Hazleton. While this was perhaps indicative of a trend toward greater regional coopera-tion, this “first” also underscored how cut off from one another these organizations had been.84
Major Policies and Strategies. Our interviewees saw Scranton’s losses in manufacturing as the inevitable outcome of the region’s specialization in producing commodity goods. There does not appear to have been any major effort to stem the losses of apparel manufacturing. Following the large Thomson Electronics closure, government officials and community leaders touted the recent service sector growth and strong presence of financial services firms as the way forward for Scranton.85 The region’s economic development leaders did not have an agreed-upon strategy for replacing lost manu-facturing jobs. Rather, they followed an “anything we can get” tack. This is likely a reflection of the prominent role that the chambers played in economic development, and their straightforward mission of attracting business on a deal-by-deal basis. Efforts to promote entrepreneurship were limited during our study period, as were those that focused on workforce development. Numerous efforts focused on the development of local amenities to raise the profile of the region, resulting in new developments such as a mall in downtown Scranton, a new baseball stadium, and a new winter sports recreation area, among others.
By the start of our study period the Scranton Chamber, SLIBCo, and LIFE had extended their efforts beyond industrial park development. The initial development at Montage Mountain was spurred by consultants’ recommendations in the mid-1970s, and LIFE provided $1.1 million to develop the ski resort in 1976.86 The Chamber’s focus on office parks began in 1975, and marked an effort to focus on what it thought were “higher value-added jobs.”87 There are conflicting opinions as to whether this was an intentional strategy to diversify the economy, or whether it simply reflected the Chamber’s recognition that the organizational restructuring of the banking and insurance industries would make such office parks attractive to firms in these industries. A consulting report released in the mid-1980s validated the Chamber’s earlier efforts, advising that an office park strategy could be successful in enticing firms from the New York region to relocate in Scranton. Regardless of the exact motive, the Chamber’s
BROOKINGS | June 201140
efforts to construct office parks paved the way for a slew of back-office service operations to set up shop in the region.
Between 1980 and 2005 Scranton’s Chamber developed new office and industrial parks, constructed new buildings, and renovated old ones, leveraging state grants and low-interest loans in certain cases. These efforts were part of deals that brought new operations of The New York Times Company, the Prudential Asset Management Company, National Westminster Bank (NatWest), JCPenney, and Grumman Electronics to the region, while retaining operations of General Dynamics in an expanded facility.88 The recruitment of NatWest was likely the most high-profile recruitment effort during this period. The deal that brought NatWest to the region included a $27 million incentive package, includ-ing $12 million in low-interest loans and $9 million in grants for infrastructure and job training, while the bank moved into a Montage Mountain office park that had been developed by SLIBCO.89 By 1996, the year that Fleet bought NatWest, the data processing center employed 1,400 people.90 According to one interviewee familiar with the deal, local workers filled nearly all these new jobs.
Meanwhile, manufacturing was rapidly losing jobs. For most of our study period, efforts by the region’s Industrial Resource Center (as Manufacturing Extension Partnership centers in Pennsylvania are called) focused on increasing product quality and productivity through lean manufacturing tech-niques. Eventually, local firms were not able to keep up with foreign manufacturers in the race toward higher and higher productivity. This led to a shift in the Industrial Resource Center’s focus from the bottom line (reducing costs) to the top line (increasing revenues), as businesses needed to find new markets and produce more innovative products to survive in the region. This change occurred at the very end of our study period, so its effect on the job changes in question was necessarily minimal. Despite the presence of a nearby Ben Franklin Technology Partners center, the lack of a local research university appears to have made the shift toward higher-level technology more difficult.91 Furthermore, because many of the region’s manufacturers were branch plants of firms’ headquartered outside of the region, corporate offices not tied to the region were responsible for major business decisions that affected the region. Although local economic development actors allied themselves with local manag-ers of national firms in an attempt to retain plants in the region, they were not able to influence the firms’ strategies in ways that were favorable to the region.
The region’s economic development leaders did not engage in any large-scale efforts to spur entre-preneurship. However, the issue gained traction with regional leaders toward the end of our study period. In 1999, a report by the Battelle Institute highlighted the region’s poor entrepreneurial climate, in addition to several other regional weaknesses, including lack of a research university, limited coordination between local businesses and colleges, and lack of attention to quality of life issues.92 In response to that report, the Great Valley Technology Alliance was founded in 2000 with funding from the federal government, the state Department of Community and Economic Development, and the region’s chambers of commerce. Its mission was to promote entrepreneurship in the region as well as to address the other challenges identified in the Battelle report. It has hosted business plan competi-tions and organized a network of angel investors, and it coordinates the state’s Keystone Innovation Zone program for Lackawanna and Luzerne counties. Adding to the region’s efforts in this arena, the Scranton Chamber constructed the Scranton Enterprise Center in downtown Scranton in 2003, which has provided office space in addition to housing a business incubator. The state of Pennsylvania has provided support to entrepreneurs through its Keystone Innovation Zones and Ben Franklin centers, mentioned above, as well as through low interest loans to small businesses. However, our interview evidence indicates that the entrepreneurial climate has remained weak in the area and that lack of funding has remained a major barrier to the successful growth of young businesses.
Workforce development efforts in Scranton seem to have lagged behind the best practice efforts adopted in some other parts of the state. The region is home to 13 small colleges that have provided worker training on an as-needed basis in partnership with local businesses. For example, during the recruitment of the Prudential Asset Management Company, colleges in the region began coordinat-ing their course offerings with information technology firms in the region. This collaboration set the stage for work carried out by the Great Valley Technology Alliance. Similarly, when job opportunities in the fiber optics industry arose, several colleges created courses to address the skill needs of those jobs.93 In recent years, the region’s colleges have formed an alliance called the Northeast Pennsylvania Association of Colleges and Universities. The Association provides a platform for open communication

BROOKINGS | June 2011 41
between college and university officials, industry, and the economic development community. The organization appears informal, but interviewees said that it has enhanced communication and aided in the identification of available training resources to meet the specific needs of particular firms.
During our study period, the Scranton region did not have a medical school, but plans were under-way in the early 21st century to create one. The primary motive for the creation of the medical school was to address northeastern Pennsylvania’s shortage of physicians. Business and political leaders also expected that the school would provide an economic benefit to the region in the form of new jobs and sources of income. The school, called the Commonwealth Medical College, opened in 2009.94
A number of our interviewees viewed improvements to local amenities as having had a positive impact on the profile of the Scranton region, enhancing the quality of life for residents and making the region attractive to outsiders. Although these efforts have been cast as beneficial to the region, they were not offered as an explicit strategy to replace lost manufacturing jobs. Major efforts included the construction of the Mall at Steamtown, which opened in 1993, and the opening of the Steamtown National Historic Site, a museum dedicated to the history of the steam engine, in 1995. These projects were long in the making, with both projects beginning in the 1980s. The Steamtown National Historic Site benefitted from the efforts of U.S. Representative Joseph McDade, who, despite cries of pork- barrel politics, secured an $8 million earmark for the project in 1985. Also during our period of study, a new baseball stadium was built as the new home of a minor-league New York Yankees affiliate, a new hockey arena opened its doors, and Scranton’s historic train station was renovated to house a new hotel.
Other Influences on Economic Development. As the industry job trends above show, Scranton evolved from a region that was heavily dependent on manufacturing in 1980, to one that was less so in 2005. Along the way, the health care industry became the region’s largest employer, but this reflected the growth of this industry nationwide. In terms of region-specific trends, Scranton became a center for transportation and warehousing and back-office services, and it experienced robust growth in plas-tics and food manufacturing, outpacing national trends in these industries. Much, perhaps most, of this transformation can be described in terms of general economic forces.
Efforts by the local economic development organizations and actors, such as the chambers of com-merce, may have gone a long way toward facilitating growth in back-office services, but the driving forces in this case appear to have been the region’s advantages in low-cost labor and land, proxim-ity to large east coast metropolitan areas, and the restructuring of the financial services industry, which enabled the geographic separation of back-office from headquarters functions and thus cre-ated demand for back-office locations. Similarly, locational advantages appeared to have been the primary driver of the growth in transportation and warehousing. Five major highways meet in the region, opening it up to the major markets of the east coast, including New York, Boston, Philadelphia, Baltimore, and Washington. Logistics requires large tracts of lands and with property values appre-ciating more slowly in Scranton than in other nearby areas such as New Jersey or the Lehigh Valley, Scranton emerged as a favorite location for firms in the industry. Strength in transportation also made the region more attractive to food manufacturers, who moved to the area to take advantage of the robust distribution channels this infrastructure provided. Plastics manufacturers also appeared to have benefited from the region’s transportation strength, but their success was more likely due the advan-tages its firms had developed over the years. The region has a long history of locally owned plastics manufacturers dating back to the early button manufacturers in the late 1800s. Although its products have primarily been commodity goods, the industry appears to have been less susceptible to competi-tion from firms located elsewhere because its firms had already made substantial capital investments in production machinery, which is a primary barrier to entry elsewhere. Furthermore, the production process for certain plastics, such as ultra-high-molecular-weight polyethylene, requires skills that the region’s workforce already possesses. In addition, the region’s firms have been successful in locating and servicing niche markets, which face less competition.
For a region of its size, Scranton has a history of strong ties to important political leaders, most notably to the Scranton and Casey families, as well as to the long-serving state senator Bob Mellow. Governor Casey was instrumental in creating the highway that connected Route 6 with Interstate 81, thus providing an important route for trucks. The so-called “Casey Highway” was completed around 2000, and enhanced the region’s transportation accessibility. Notably, local government appears to
BROOKINGS | June 201142
have played little role in the economic development of the greater Scranton region. Interviewees did report that local government in Scranton was successful in helping to revitalize the downtown, though the extent to which this altered the trajectory of the region is unclear.
As in other regions, interviewees reported that a high quality of life, combined with relatively low costs of living, made it possible for the region’s firms to attract and retain good workers. They also described the region’s labor force as possessing a strong work ethic. Interviewees cited cultural impediments to growth as well, such as the perception that manufacturing was a dead-end industry. This was cited as a cause of purported shortages of skilled manufacturing workers, although the problem has probably been felt more acutely in high-skilled manufacturing centers such as Hartford. Interviewees also described the region as lacking a strong entrepreneurial spirit. Reasons for this varied, but tended to focus on the values workers place on job security, perhaps as a residual effect of the major upheavals many families experienced when jobs were lost in the coal and manufacturing industries. The region’s long history of community willingness to invest in big efforts such as SLIBCo, LIFE, and CAN DO suggests that residents are willing to take large collective risks but many interview-ees thought that this did not carry over to a corresponding willingness to take individual risks. This may have affected the ability of the region to produce large firms of its own.95
Throughout our study period the region’s growth relied primarily on its comparative advantages which were shaped by general economic factors. Economic development policymakers skillfully took advantage of those comparative advantages. However, they did not place much emphasis on generat-ing new sources of regional advantage, such as those that might arise from the emergence of new industry clusters that built on preexisting industry strengths. Without the latter, the region could be vulnerable to externally generated job losses in much the same way that it was vulnerable to manufac-turing job losses in the past.
Observations
The cases of the eight metropolitan areas highlighted in this report illustrate several impor-tant features of efforts to rebuild or reorient metropolitan economies in the face of manu-facturing job losses.
Regional economic development policies and strategies are the product of diverse public and private sector institutions, not just of local government economic develop-ment organizationsIn all the case study regions, the formal economic development programs of local governments were much less important as generators of intentional economic development policies and strategies than were other public and private institutions. The latter included individual companies, informal coali-tions of business and local government leaders, chambers of commerce and other regional business associations, regional organizations formed to promote specific industries or technologies, state government agencies, Manufacturing Extension Partnership centers, Workforce Investment Boards, educational institutions, and private foundations. The relative importance of each of these institutions varied among the case study regions, as did the extent to which they worked together to achieve com-mon goals. Collectively, however, they formulated and implemented most of the policies and strategies described in this report.
In case study metropolitan areas with strong business leadership groups from diverse industries, those groups developed and implemented regional-scale policies/strategies to influence the metropolitan area’s economic trajectory In Indianapolis a group of second-tier public and private sector leaders came together to develop the amateur sports development strategy that helped build a new industry specialization in the metropoli-tan area. In Grand Rapids a tightly knit group of business leaders and wealthy families from both large firms in the area’s major industries (such as furniture) and smaller firms in other industries was the driving force behind the multi-pronged regional development strategy that included the reorientation
BROOKINGS | June 2011 43
of manufacturing and the development of new health care and higher education clusters. Louisville’s diverse public-private economic development leadership group was responsible for the airport expan-sion that paved the way for UPS to establish its major hub in Louisville, a move that helped make the area a center for logistics and product distribution. Beginning in the late 1990s this leadership group created a regional economic development strategy centered around logistics/distribution and biomedi-cal clusters. Cleveland’s economic development organizations, led by the CEOs of many major firms in multiple industries, developed and implemented a variety of economic development strategies since the 1980s.
The Chambers of Commerce in the Scranton metropolitan area also created and implemented an office park-development strategy to compensate for the loss of manufacturing jobs; that strategy helped attract the back offices of banks and insurance companies to the area. The strategy had broad backing from local-serving businesses in diverse industries, although the Chambers’ executive direc-tors seemed to play a larger and more independent role in formulating and implementing it.
The policies and strategies of these business groups were not always successful either in replacing lost manufacturing jobs. However, those of Indianapolis, Louisville, and Scranton in the 1980s and, more speculatively, that of Grand Rapids seemed to have some impact on their respective regions’ economic development trajectories.
At the beginning of the 21st century a different kind of economic development organizational model began to emerge in Cleveland and Indianapolis. In both metropolitan areas, foundations set economic development agendas and created a variety of staff-driven organizations to implement them. This new model, which may be a response to the declining ability of large-firm CEOS to participate in regional economic development efforts, led to the formulation of comprehensive, multi-industry economic development strategies.96 Because the model is so new, however, it is not yet clear whether it will be as successful as the business-led model in carrying out the strategies. Nor is it yet clear whether the resulting strategies, if implemented, will be more or less successful than those produced by business leaders.
Case study metropolitan areas where a few large firms from the same industry or re-lated industries dominated the economy and civic life were successful or unsuccessful in replacing lost manufacturing jobs depending on the fortunes of those firms Until fairly recently, three large manufacturing firms in the optics and imaging industries—Kodak, Xe-rox, and Bausch & Lomb—accounted for a large share of total employment in Rochester and provided substantial support for local economic development projects and for the arts and entertainment. City officials consulted with executives of these firms before taking action on major public issues. Until even more recently, Charlotte’s two large banks played a similar role in the economic and civic life of that metropolitan area and were especially active in planning and funding the revitalization of the city’s downtown area. In both metropolitan areas the dominant firms worked on behalf of what they saw as the welfare of their home cities and metropolitan areas, funding local amenities that probably would not otherwise have existed.
This dominant-firms model served Rochester well until those firms began laying off large numbers of workers. The magnitude of the resulting manufacturing job losses was too great to be overcome even over a period of nearly two decades. In part because of the economic and civic dominance of the area’s “Big Three” firms, it was difficult for the metropolitan economy to replace the lost jobs. Workers did not believe that the layoffs would be permanent and could not imagine that any of the Big Three might fail or substantially downsize their operations in the area. Because the Big Three had historically done all the design work and provided a ready market for their local suppliers, the downsizing on the Big Three left many of those suppliers without the design and marketing capacities they would need to compete for other business. Local governments were ill equipped to respond to the downsizing of the Big Three because they were not used to making major decisions independently of those firms and because they lost substantial property tax revenue as an indirect result of the downsizing. Local business and economic development groups did not have the capacity to respond, either, as other businesses and nonprofit organizations had neither the experience in bringing together the necessary resources nor the ability to cooperate to do so. During the era when the Big Three made the important economic development decisions, other public and private actors did not have to develop the ability to do so.
BROOKINGS | June 201144
In Charlotte, the dominant-firms model worked well during the 1980-2005 period that is the focus of this report. The two major banks expanded their local employment rapidly during that time, providing a mix of professional and administrative jobs that more than made up for the area’s lost textile manu-facturing jobs in terms of both employment and average wages. However, the financial crisis of 2008-2009, which left Charlotte with only one major bank, called into question the continued viability of the dominant-firms model in Charlotte. The similarity between the economic and civic roles of Charlotte’s dominant banks and those of Rochester’s dominant manufacturers may mean that Charlotte will enter a long period of economic stagnation, just as Rochester did. Alternatively, it is possible that other influences on Charlotte’s economic development, such as relatively low labor costs and the existence of a structure for regionwide business cooperation on economic development issues (the Charlotte Regional Partnership) will enable it to avoid Rochester’s fate.
The cases of Rochester and Charlotte illustrate the risk that the dominant-firms model poses for the economic resilience of a metropolitan area. The area is more vulnerable to business downturns at those firms than it would be if its economy were more diversified, but the problem with the dominant-firms model is not mainly one of diversification as such; a diverse local economy did not generally help industrial metropolitan areas replace lost manufacturing jobs between 1980 and 2005.97 More impor-tantly, the dominance of the local economy by a few large firms leaves workers poorly equipped to find new jobs, other firms poorly equipped to compete for labor, and suppliers poorly equipped to find new business. Their dominance of local government and civic life leaves the local public and nonprofit sec-tors without the experience or resources to respond to downsizing at the dominant firms and without the experience necessary to assist other firms. Their dominance of business social networks blocks the informal channels of communication that could help other business leaders to develop new busi-ness ideas outside the dominant firms.98
The case study metropolitan area where economic development was dominated by many small organizations had policies and strategies that may have helped individual indus-tries but did not influence the metropolitan area’s overall economic trajectoryHartford is a metropolitan area that, during the period of our case study, lacked a unified business leadership group that either took responsibility for regional economic development or coordinated the activities of separate organizations that did different kinds of economic development work. (It had such a leadership group in the mid-20th century but the group had dissolved by 1980 and was not replaced.) Hartford had many public and private economic development organizations, including sepa-rate organizations devoted to regional place-marketing, workforce development, lean production assis-tance to manufacturers, technology-based economic development, and the provision of assistance to firms in the insurance, aerospace supplier, and medical device industries. The different organizations covered very different geographic areas, although all covered the central city and immediate sur-rounding towns. In some fields of economic development practice there were multiple organizations doing similar work without a clear division of labor between them.
The efforts of many of these organizations appear to have been successful in expanding or improving the performance of particular industries. However, their efforts, taken together do not seem to have had a major impact on the economic development trajectory of the metropolitan economy as a whole in the way that the efforts of business-led groups in Louisville, Indianapolis, and perhaps Scranton and Grand Rapids, or the strategies of dominant firms in Rochester or Charlotte, appear to have. In the absence of such leadership, general economic factors rather than intentional action by identifiable actors shaped the economic development of Hartford from 1980 through 2005.
In the case study metropolitan areas, policies and strategies intended to replace lost manufacturing jobs were of four general types.
• In three metropolitan areas economic development policymakers recruited or promoted specific non-manufacturing firms or industries. In Grand Rapids they promoted health care, the biomedi-cal industry, and higher education, and recruited a medical school. In Louisville they promoted the growth of United Parcel Service. In Indianapolis they recruited amateur sports organizations and promoted the growth of the amateur sports industry.
BROOKINGS | June 2011 45
• Site preparation/land development directed at generic non-manufacturing industries was another important strategy. This is clearest in Scranton, where the Chamber of Commerce built office parks to attract service jobs without targeting a particular industry or firm. However, all the metropolitan areas that pursued downtown amenities strategies can also be thought of as trying to attract ser-vice firms that would meet the consumption needs of the professionals and managers they hoped to lure to live downtown.
• In the early years of the 21st century, policymakers in Cleveland took a portfolio approach based on the idea of a product life cycle. This involved a coordinated effort to improve productivity and product quality in mature manufacturing industries (via the local Manufacturing Extension Partnership organization), develop targeted new high technology industries (through programs designed to promote the growth of such industries as biomedical applications, information tech-nology, polymers, and advanced materials), and stimulate the formation of new firms regardless of industry. The idea was to diversify the metropolitan area’s “portfolio” of industries and help firms throughout that portfolio grow and become more productive and innovative. A similar effort, although with less of an explicit theoretical motivation, occurred in Indianapolis in the early 21st century.
• In Grand Rapids and Cleveland, policymakers consciously tried to retain or grow manufacturing jobs via technical assistance to manufacturers. Although Manufacturing Extension Partnership Program organizations provided technical assistance to manufacturers, to a greater or lesser extent, in all the case study metropolitan areas, this assistance was part of a broader metropolitan economic development strategy in Grand Rapids and Cleveland. The purpose of the assistance was initially to improve productivity and quality through the diffusion of waste-reducing lean produc-tion techniques to small and medium-sized manufacturers. In the early 21st century the assistance was broadened to include helping those firms design new products, reposition themselves within existing industries in response to shifts in consumer demand, adopt new technologies, and find new markets (including export markets) for their products.
The specific policy levers used as part of these strategies were typical of those used nationwide at the state and local levels between 1980 and 2005.99 They included subsidies to attract individual firms (in the form of tax abatements, customized job training, and the construction of infrastructure designed for individual firms), technical assistance to small- and medium-sized manufacturers and to new entrepreneurs, high technology economic development programs, early-stage financing for entre-preneurs, business incubators, industry cluster groups, generic infrastructure expansion (especially of airports and highways), downtown redevelopment (including residential) via eminent domain and subsidies (in the form of tax abatements or tax-increment financing), “unlocking” unused technolo-gies from large firms, and industry- and occupation-specific training programs at community colleges. Given the nature of our study, we are unable to assess the relative effectiveness of any of these spe-cific policy levers or of any of the four general types of policies to replace lost manufacturing jobs.Amenity-focused downtown redevelopment was an important activity of economic development organizations in all case study metropolitan areas but it did not always have a clear link to regional-scale economic developmentSome form of amenity-based downtown or near-downtown redevelopment was a feature of economic development policy in all the case study metropolitan areas. In Charlotte and Rochester amenity-based downtown redevelopment was intended to stimulate both commercial and residential activity and, in Charlotte it was successful in doing so. In Cleveland, Grand Rapids, Indianapolis, Hartford, and Louisville it was aimed primarily at commercial revitalization of the downtown through the construc-tion of hotels, stadiums, convention centers, and other facilities designed to attract entertainment-seekers from elsewhere in the metropolitan area, tourists, or business visitors. In Scranton it was also aimed mainly at downtown commercial revitalization but via the construction of a downtown shopping mall as a means of sparking business revitalization throughout the downtown. (Of course the line between commercially oriented and residentially oriented revitalization is somewhat blurry, as new downtown residents can attract local-serving businesses and commercial development can attract residents.)
The fact that a downtown redevelopment strategy succeeded in attracting businesses or residents to the downtown area does not necessarily mean that the strategy succeeded in spurring metropolitan

BROOKINGS | June 201146
regional economic development. Indeed, such a strategy may succeed merely by attracting busi-nesses or residents from elsewhere in the metropolitan area without creating any net gains in jobs or incomes in the area as a whole.100 In most of our case study metropolitan areas policymakers pursued downtown redevelopment for its own sake, regardless of whether they thought it would benefit the entire metropolitan area. In most of the areas it was difficult to see a theoretical link between down-town redevelopment activities and metropolitan-level economic benefits and even more difficult to see evidence that downtown revitalization contributed anything to the metropolitan economy as a whole.
However, a downtown development strategy can, in principle, create net economic gains for an entire metropolitan area in two possible ways. First, downtown commercial development can attract tourists or business visitors who would not otherwise spend money anywhere in the metropolitan area. This is most likely when the development stimulates visitor-oriented economic activity that does not already exist in the metropolitan area. In Indianapolis downtown redevelopment was designed to create a new concentration of amateur sports activities that would bring in tourists and it succeeded in doing just that.
The second way in which downtown redevelopment could benefit the metropolitan area as a whole is by making it easier and less costly for businesses in the area to recruit key employees, such as young managers and professionals, who would be attracted to downtown living or entertainment.101 If those employees are more likely to move to a metropolitan area if it has an attractive downtown, or if they are willing to accept lower pay to move to an area that has an attractive downtown, then their employers may be more profitable and./or more likely to expand in the metropolitan area, benefiting the area as a whole. Although economic development policymakers in several of the case study metropolitan areas articulated some version of this argument, the only area in which the facts are consistent with the argument is Charlotte. It may well be the case that Charlotte banks would have had more difficulty attracting young financial professionals and managers if Charlotte’s bankers had not transformed the downtown into a place where those employees wanted to live and play as well as work.
Regional economic development strategies in the case study metropolitan areas gener-ally lacked input from labor, environmental, and minority community organizations The actors who formulated regional economic development strategies in the case study metropoli-tan areas were mainly business leaders and, sometimes, local or state government officials. In some cases they also included foundation executives, college and university leaders, former managers or professionals with expertise in a particular industry (especially in industry-specific organizations), and nonprofit organization staffers with some independent ability to influence policy (e.g., the Chamber of Commerce leaders in the Scranton area).
Notable for their absence from metropolitan regional economic development policymaking were representatives of groups that are often critical of the business leaders’ consensus, such as labor unions, environmental advocates, and minority community organizations. The latter groups were often active in neighborhood and community development efforts and, in a few cases, allied themselves strategically with portions of the business community on specific regional economic development issues. However, they were neither part of the groups that formulated the metropolitan-level eco-nomic development consensus nor challengers to that consensus. This seemed to be true regardless of their size and activity level in each metropolitan area. The only potential exception to this general-ization came from Cleveland in the early 21st century, where the foundation leaders who formulated metropolitan economic development strategy were partially responsible to environmental and minor-ity community organizations (whose leaders sat on the foundations’ boards) and made an effort to include minority business leaders in the formulation of consensus policies.
The exclusion of labor, environmental, and minority community interests from the metropolitan economic development policymaking arena (either as participants in the formulation of consensus policies or as challengers to those policies) may make policy consensus easier to reach but exclude important voices concerned with economic and racial/ethnic inequality and environmental quality. Such concerns need not be inimical to metropolitan economic growth but their inclusion in the policy-making process may push policy in different directions, e.g., toward greater emphasis on environmen-tally benign industries or jobs that pay relatively high wages to less educated workers.

BROOKINGS | June 2011 47
The exclusion of these interests from economic development policymaking is not inevitable. In at least one other metropolitan area, Seattle, the board of the area’s major economic development orga-nization includes representatives of organized labor and antipoverty organizations as well as business and government leaders.
In most case study metropolitan areas new economic development institutions were created and/or existing ones were restructured or consolidated from the 1990s onward Virtually all the case study regions undertook changes in the organizational structure of their eco-nomic development activities during the period we studied. Indeed, in many cases these organizational changes, apart from any changes in activities that the changes brought about, were a major response to the loss of manufacturing jobs in the region.
In the 1990s and early 2000s business leaders in all the case study metropolitan areas created broad regional organizations to market the metropolitan area as a whole (or, in the case of Cleveland, an even larger region containing the metropolitan area). This reflected their frustration with the inter-jurisdictional competition that occurred in the past, when each city, town, and/or county did its own place-marketing and each competed with other jurisdictions in the same metropolitan area to attract new business.
Business groups in several metropolitan areas also came to see intergroup as well as interjuris-dictional rivalry as counterproductive. Rival general-purpose business leadership groups merged in Rochester, Louisville, and Cleveland.
In Cleveland and perhaps in Louisville and Rochester, reduction in the involvement of corporate executives in metropolitan economic development activities helped motivate the creation of new economic development organizations. Some large home-grown firms were sold to companies based elsewhere, whose executives were not concerned with the economic development of places where their firms were not headquartered. Meanwhile, changing business needs forced executives of other large local corporations to spend more time on internal corporate operations and less on the economic development of their home regions.102 Other organizations stepped in to fill the gap. In Cleveland and Indianapolis major foundations and nonprofit organizations created a suite of new, staff-driven eco-nomic development organizations. In Louisville a public-private partnership filled the gap. In Rochester the leaders of other local firms tried, so far unsuccessfully, to take the place of the metropolitan area’s three largest corporations in economic development decisionmaking.
Restructuring of economic development efforts was also, in part, a response to the growing com-plexity of economic development activities. Particularly after 1990, economic development policymak-ers in the case study metropolitan areas added many other activities to the traditional place-marketing and business recruitment that had previously been their bread and butter. These activities included technical assistance to firms in specific industries, workforce development, technology-based eco-nomic development, and assistance to new entrepreneurs.103 Organizations that specialized in place-marketing and business recruitment were poorly equipped to carry out the new activities, and new organizations emerged to do so. In Cleveland and Indianapolis after 2000, a single umbrella organiza-tion coordinated and funded some or all of the new organizations. In Hartford, in contrast, new organi-zations emerged without any central coordination, sometimes in competition with one another.
Very few policies/strategies in the case study metropolitan areas appear to have changed metropolitan economic trajectories Of the policies and strategies implemented in the case study metropolitan areas, only a few appeared to have a major impact on long-term, metropolitan area-wide job growth, wage growth, or industrial composition.
Louisville’s airport expansion in the 1980s and perhaps its subsequent creation of Metropolitan College for the benefit of UPS turned Louisville into a center of transportation and warehousing. Transportation and warehousing made up 16.3 percent more of Louisville’s employment than of nation-wide employment in 1982, just after UPS moved to the area, but 61.2 percent more in 1990 (after the airport expansion) and 92.5 percent more in 2000 (after the creation of Metropolitan College). The growth of this industry in Louisville in excess of its nationwide job growth rate accounted for 3.3 per-centage points of the metropolitan area’s 43.5 percent job growth. and for 0.6 percentage points of its

BROOKINGS | June 201148
16.7 percent inflation-adjusted wage increase between 1980 and 2005. If the industry had not grown especially rapidly in Louisville, largely as a result of economic development policy, then Louisville would have had job growth below the national average as well as slower wage growth.104
Indianapolis’ amateur sports strategy turned that metropolitan area into an amateur sports center. Performing arts, spectator sports, and related industries accounted for less of Indianapolis’ employ-ment than it did nationwide in 1980, shortly after the amateur sports strategy was launched, but accounted for 4.4 percent more in 1990 and 63.2 percent more in 2000. In a few other cases it seems plausible that economic development policy or strategy had an important impact on a metropolitan area’s economic trajectory but it is more difficult to link the economic change tightly to the policy or strategy. The extensive, high-quality support that The Right Place provided to small and medium-sized manufacturers in Grand Rapids may have contributed to the growth of manufacturing in that metro-politan area from 1980 through 2000. The construction of office parks by the Chambers of Commerce in the Scranton area may have helped attract back-office financial services to the area.
Other policies and strategies may have increased employment, wages, or productivity in particular industries but either the impacts or the industries were too small for the policies or strategies to have had a large effect on the metropolitan area as a whole. This does not mean that those policies and strategies were unwise, just that the scope of their impact was more limited. Some economic develop-ment policies and strategies are not intended to affect the entire metropolitan economy and should not be judged negatively if they fail to do so. Still other policies or strategies may have been imple-mented in the early 21st century and may not yet have had an impact by 2005.
Metropolitan economic characteristics and the business strategies of major firms had more impact on regional economic trajectories in most case study metropolitan areas than did explicit regional economic development policies and strategiesA number of metropolitan economic characteristics seemed to play an important role in shaping the economic development trajectories of one or more case study metropolitan areas. These characteris-tics included transportation costs (influenced especially by location and by public policy toward the ex-pansion of airports), the costs of labor and land, the quality and nature of the educational and training systems, state and local business regulations, and amenities. Some of these characteristics were ame-nable to public policy influence and some were the subject of local, metropolitan, or state-level public policies. In most cases, though, no single policy had a decisive impact on the metropolitan economy.
In addition, the business strategies of firms, whether successful or unsuccessful, influenced the fortunes of the metropolitan areas. This was especially true of Charlotte and Rochester, where a few firms dominated not only their own product markets but also metropolitan economic and civic life. In those metropolitan areas dominant firms’ decisions to expand nationwide (Charlotte banks) or their failure to commercialize inventions (digital photography at Kodak in Rochester) were pivotal for the metropolitan economy. In other metropolitan areas, especially Indianapolis and Grand Rapids, the capacity to design and make new products and improve existing ones seemed to be something that many firms of all sizes shared. This capacity contributed to the rapid job growth in those areas. With the exception of technical assistance to small and medium-sized manufacturers (which varied in quan-tity and quality among the case study metropolitan areas), there were few public policies designed to influence business strategies for the benefit of the case study metropolitan areas.105
Public policies that were not designed to influence metropolitan economic development sometimes mattered. For example, North Carolina’s early abolition of restrictions on intrastate branch banking enabled Charlotte’s banks to take an early lead in managing a geographically far-flung network of branches, setting the stage for those banks’ nationwide expansion through the acquisition of other banks. And federal trade and currency policies affected the ability of manufacturers to remain in busi-ness in the case study metropolitan areas and influenced the viability of corporate decisions to send manufacturing work abroad.
Economic development policy and strategy can play a modest role in helping regions recover from manufacturing job lossOur research indicates that intentional economic development policies in most cases played little role in altering the economic circumstances of regions that experienced substantial manufacturing job
BROOKINGS | June 2011 49
loss. This should not come as a surprise; to expect them to do so vastly underestimates the forces af-fecting the economies of these regions. Political necessity (elected officials and their appointees must be seen to be responding to the serious needs of their constituents) and a belief in the power of their own actions (part of the professional ethos of economic development practitioners) lead economic development actors to exaggerate the likely effects of their own activities. The exaggeration reflects both their own sincere beliefs and public credit-taking (in the words of Herbert Rubin’s classic article, “Shoot anything that flies; claim anything that falls”106).
In fact, economic development policy and strategy can play a modest but, in some circumstances, important role in helping regions respond to manufacturing job loss. Regional comparative advantages (the regional economic characteristics, mentioned above, that influence the relative attractiveness of regions to various types of businesses and whose importance depends in part on state, national, and international economic trends and public policies) shape the economic trajectories that are possible for metropolitan areas. However, they do not necessarily dictate a particular trajectory. At a minimum economic development organizations can provide the data and analysis that serve to elucidate the state of the region’s economy and set forth the regions underlying assets as well as possible trajec-tories, given the region’s constraints. In the process, economic development policymakers and prac-titioners can discover some alternative trajectories (or at least one alternative to general economic decline) and use policy and strategy to help push a region onto a more favorable trajectory. This is what happened in Louisville and, on a more modest scale, in Scranton, Indianapolis, and perhaps Grand Rapids. Sometimes, as in Louisville, that trajectory will be very different from the one the region was previously on; in other cases (e.g., Grand Rapids), it may be more of an outgrowth of the region’s previ-ous industry strengths. Economic development policy and strategy are most likely to be able to shape a regional response to manufacturing decline in metropolitan areas that have strong multi-industry business leadership of economic development efforts, organized formally or informally, because those are the metropolitan areas where intentional regional-scale policy and strategy are more likely to exist and be implemented. (Thus, the response of the Hartford economy to manufacturing job loss was a product of regional comparative advantage and broader economic trends and policies above the regional level, while the responses of Charlotte and Rochester depended on the decisions of dominant firms; in none of these cases was regional-scale policy or strategy important in influencing regional economic development trajectories.) Yet, as the case of Cleveland illustrates, there are no guarantees of success; even well-conceived and implemented policies may not be strong enough to overcome the impacts of broader economic trends and policies over which regional policymakers have no control.
Regional economic development policy and strategy, at least in the case study metropolitan areas, is less well suited to helping a region develop new competitive advantages that will change the menu of economic development possibilities that are available to it. This may be because developing a new regional competitive advantage, as opposed to choosing among or working with a region’s existing comparative advantages, requires a set of large-scale, coordinated investments by many different pub-lic and private actors. Some countries, such as South Korea and Taiwan, have been able to make such investments and “leapfrog” from poverty to high-tech prosperity, but even the best-coordinated, most effective public-private regional economic development systems in our case study regions do not have enough coordination or power to accomplish this. It is unrealistic to expect regional economic develop-ment policy and strategy, at least as they are organized in the regions described in this report, to play a major role in “turning around” a metropolitan economy that has experienced large-scale manufac-turing job losses.
BROOKINGS | June 201150
Endnotes1. Patricia Atkins is an associate research professor of
public policy at the George Washington University,
where Adrienne Edisis, Leah Curran, Lisa Lowry, and
Travis St. Clair are Ph.D. students in public policy and
Harold Wolman is Director of the George Washington
Institute of Public Policy and a professor of political
science and public policy. Alec Friedhoff is a research
analyst and Howard Wial is an economist and fellow in
the Brookings Institution’s Metropolitan Policy Program.
Pamela Blumenthal is a social science analyst at the
U.S. Department of Housing an Urban Development. The
opinions expressed in this report are those of the authors
and do not necessarily reflect the views of the U.S.
Department of Housing and Urban Development or the
U.S. government.
2. Authors’ analysis of Bureau of Labor Statistics Current
Employment Statistics data.
3. According to our analysis of Bureau of Labor Statistics
Current Employment Statistics data, the nation lost 5.5
percent of its manufacturing jobs between 1980 and 1990,
2.4 percent between 1990 and 2000, and 17.6 percent
between 2000 and 2005. Those data show that nation-
wide manufacturing employment peaked in 1979.
4. We also conducted a quantitative analysis of all 114
metropolitan areas that specialized strongly in manufac-
turing in 1980 and lost manufacturing jobs between 1980
and 2005. The results of that analysis may be found in
Alec Friedhoff, Howard Wial, and Harold Wolman, “The
Consequences of Metropolitan Manufacturing Decline:
Testing Conventional Wisdom” (Washington: Brookings
Institution, 2010).
5. All material not specifically attributed to other sources is
from our interviews.
6. Since 2003, Cleveland lost the headquarters of OfficeMax
and National City Bank as a result of corporate mergers.
7. Cleveland Tomorrow also established an organization to
conduct neighborhood development work.
8. Royce Hanson and others have documented and
explained the decline in the ability of corporate CEOs
to participate in city and regional economic develop-
ment efforts. See Royce Hanson and others, “Corporate
Citizenship and Urban Problem Solving: The Changing
Civic Role of Business Leaders in American Cities”
(Washington: Brookings Institution, 2006).
9. GCP operates in the Akron and Youngstown metropolitan
areas in partnership with those areas’ respective cham-
bers of commerce.
10. See Randall Eberts, George Erickcek, and Jack Kleinhanz,
“Dashboard Indicators for the Northeast Ohio Economy,”
Working Paper 06-05 (Cleveland: Federal Reserve Bank of
Cleveland, 2006).
11. David O. Kasdan and Jill S. Taylor, Northeast Ohio
Entrepreneurship Confidence Survey: Second-Year
Findings (Cleveland: Center for Economic Development,
Maxine Goodman Levin College of Urban Affairs,
Cleveland State University, 2007).
12. In this report, the Grand Rapids area is defined as the
counties of Allegan (including the city of Holland), Barry,
Ionia, Kent (including the city of Grand Rapids), Muskegon
(including the city of Muskegon), Newaygo, and Ottawa.
This reflects the federal definition of the Grand Rapids-
Muskegon-Holland Combined Statistical Area rather than
the definition of the Grand Rapids-Wyoming Metropolitan
Statistical Area, which includes only the four counties of
Barry, Ionia, Kent, and Newaygo. We use the combined
statistical area definition because it corresponds to the
way our interviewees perceived the region.
13. www.bls.gov/bls/naics_aggregation.htm. The region out-
performed in employment growth for natural resources
and mining; construction; manufacturing; trade, trans-
portation, and retailing; financial activities; professional
and business services; education and health services; and
leisure and hospitality. It underperformed in and govern-
ment.
14. An analysis of four-digit NAICS data from Moody’s
Analytics indicates that as of 1980 aerospace products
and parts manufacturing made up approximately 87
percent of all transportation equipment manufacturing in
Hartford.
15. Each of these firms is a subsidiary of the United
Technologies Corporation, headquartered in Hartford.
16. Why this competency has endured is unclear. One reason
may be that the region’s firms have been especially good
at passing production and managerial skills between
generations of employees and managers.
17. See www.metrohartford.com/economicdevelopment.aspx?
id=80&ekmensel=cbda55a2_12_0_80_2.
18. For current strategic goals, see www.metrohartford.com/
uploadedFiles/Strategic%20Framework.pdf
BROOKINGS | June 2011 51
19. See www.metrohartford.com/aboutus.aspx?id=96
20. For more, see the CBIA website: www.cbia.com/home.php.
21. See Peter Burns, “The Intergovernmental Regime and
Public Policy in Hartford, Connecticut.” Journal of Urban
Affairs 24 (2002): 55-73.
22. See Scott Cummings, editor, Business Elites and Urban
Development: Case Studies and Critical Perspectives
(Albany: State University of New York Press, 1988).
23. See Nicholas Dagen Bloom, Merchant of illusion: James
Rouse, America’s Salesman of the Businessman’s Utopia
(Columbus: Ohio State University Press, 2004).
24. Ibid.
25. See Burns, “Intergovernmental Regime.”
26. Ibid.
27. See www.ct.gov/governorrowland/cwp/view.
asp?A=1331&Q=256160
28. See www.ct.gov/governorrowland/cwp/view.
asp?A=1331&Q=256160
29. Burns, “Intergovernmental Regime.”
30. Peter N. Ellef. “Industry Clusters Shape New CT Economy.”
The Connecticut Economy 5 (Summer 1997), available at
http://cteconomy.uconn.edu/TCE_Issues/Summer_1997.
pdf.
31. Ibid..
32. Ellef. “Industry Clusters.”
33. Dan Haar, “State Convenes Economic Board.” Hartford
Courant, February 26, 1997.
34. For more on clusters, see: Joseph Cortright, “Making
Sense of Clusters: Regional Competiveness and Economic
Development” (Washington: Brookings Institution, 2006);
Mark Muro and Bruce Katz, “The New ‘Cluster Moment’:
How Regional Innovation Clusters Can Foster the Next
Economy” (Washington: Brookings Institution, 2010).
35. Connecticut Department of Economic and Community
Development, “Partnership for Growth: Connecticut’s
Economic Competitiveness Strategy At a Glance”
(Hartford: Connecticut Department of Economic and
Community Development, 1998).
36. William Hathaway, “Development Report Praised.”
Hartford Courant. February 12, 1998.
37. Connecticut Department of Economic and Community
Development, “Partnership.”
38. Stan Simpson and Mike Swift,. “Regionalism: An Idea
Whose Day Already Has Gone?” Hartford Courant, May 21,
1994.
39. Ibid.
40. Ibid.
41. Ibid.
42. Tom Condon, “City, Town Challenges Cry Out For Regional
Solutions.” Hartford Courant, March 16, 2008.
43. Ibid.
44. Ibid.
45. Airbus recently announced that it will design a more
fuel-efficient version of its A320 jet, to be offered with a
new engine from Pratt & Whitney. See Christopher Hinton,
“Pratt & Whitney elbows out CFM for spot on A320,”
Dec 1, 2010, available at www.marketwatch.com/
story/pratt-whitney-elbows-out-cfm-for-a-spot-on-
a320-2010-12-01. Pratt & Whitney has supplied an engine
option for the A320 through a joint venture with Rolls
Royce, though it has not been the sole supplier to a nar-
row body plane for quite some time. See Rachel Layne,
“United Technologies CEO Sees Decade-Long Engine
Effort Pay Off,” Dec 1, 2010, available at www.bloomberg.
com/news/2010-12-01/airbus-s-neo-lands-pratt-back-in-
biggest-engine-market-boosts-ge-safran.html. For more
on Pratt & Whitney, see Tim Smart, “Pratt Could Use a
Jump,” Business Week, Feb 8, 1993, available at www.
businessweek.com/archives/1993/b330424.arc.htm, and
Jonathan Hicks, “United Technologies’ Bumpy Ride,” New
York Times, May 1, 1991.
46. Calculations in this section are based on data from
Moody’s Analytics unless otherwise noted.
47. Nationwide evidence can be found in Matthew Dey, Susan
N. Houseman, and Anne E. Polivka, “Manufacturers’
Outsourcing to Employment Services,” Working Paper No.
07-132 (Kalamazoo, MI: Upjohn Institute for Employment
Research, 2006).
BROOKINGS | June 201152
48. Stephen Goldsmith, The Twenty-First Century City:
Resurrecting Urban America (Lanham, MD: Rowman and
Littlefield, 1999), p. 85.
49. Ibid., p 79.
50. Material on the social networks of business and gov-
ernment leaders is drawn from Scott Gissendanner,
“Strategic Action in Hard Times: Local Responses to
Deindustrialization in the United States and Germany,”
Ph.D. dissertation, University of Georgia, 2001, and H.V.
Savitch, Takashi Tsukamoto, and Ronald K. Vogel, “Civic
Culture and Corporate Regime in Louisville,” Journal of
Urban Affairs 30 (2008): 437-460, supplemented by our
own interviews for recent years.
51. Gissendanner, “Strategic Action.”
52. Edward Bennett and Carolyn Gatz, “A Restoring Prosperity
Case Study: Louisville, Kentucky” (Washington: Brookings
Institution, 2008), p. 28.
53. See Gissendanner. “Strategic Action.”
54. Material on the airport expansion and its consequences
is drawn from Bennett and Gatz, “A Restoring Prosperity
Case Study,” as well as from interviews.
55. William S. Butler and others, editors, Passing the Torch
(Louisville: Greater Louisville, Inc., 2005), interview with
Barry Bingham; Gissendanner. “Strategic Action.”
56. For more on Metropolitan College, see Stuart C. Strother
and others, “Building Human Capital Through Public-
Private Cooperation: The Case of Metropolitan College,”
Economic Development Quarterly 19 (2004): 343-353.
57. See the University of Louisville’s description of Bucks for
Brains at http://louisville.edu/bucksforbrains, on which
this paragraph draws.
58. We were not able to conduct any interviews with Ford
Motor Company in Louisville.
59. H.V. Savich, Ronald K. Vogel, and Lin Ye, “Beyond the
Rhetoric: Lessons from Louisville’s Consolidation,”
American Review of Public Administration 40 (2010): 3-28.
60. Brookings Institution Center on Urban and Metropolitan
Policy, Beyond Merger: A Competitive Vision for the
Regional City of Louisville (Washington: Brookings institu-
tion, 2002). This report makes recommendations to
increase educational attainment in the region.
61. David Savageau with Ralph D’Agonstino, Places Rated
Almanac, Millennium Edition (Foster City, CA: IDG Books
Worldwide, 2000).
62. Council for Community and Economic Research, ACCRA
Cost of Living Index (Arlington, VA, 2008), http://www.
gastongazette.com/attachments/1203624730-costofliving.
pdf.
63. On the decline of transportation costs, see Edward L.
Glaeser and Janet E. Kohlhase, “Cities, Regions, and the
Decline of Transport Costs,” Papers in Regional Science 83
(2004): 197-228.
64. Friedhoff, Wial, and Wolman, “The Consequences of
Manufacturing Decline,” table A1. This analysis is based on
NAICS three-digit industries.
65. State of New York Comptroller’s Office, Division of Local
Government Services and Economic Development, “City
of Rochester Involvement with the Fast Ferry Operation”
(Albany, NY, 2006).
66. State of New York Comptroller’s Office, “City of Rochester
Involvement.”
67. Center for Governmental Research, “Economic Impact of
the University of Rochester on the Rochester Region,”
(Rochester, NY, 2007).
68. Bob Finnerty, “President Simone will retire next year:
Search committee seeks feedback from entire RIT com-
munity on successor,” RIT: The University Magazine,
Fall 2006, available online at www.rit.edu/news/umag/
fall2006/02_oc_president-simone-retires.html.
69. Council on Competitiveness, “Fanning the Flames
of Economic Progress: Igniting Greater Rochester’s
Entrepreneurial Economy” (Washington, 2004).
70. David Savageau, Places Rated Almanac, 7th edition
(Washington: Places Rated Books, 2007).
71. Leah B. Curran and others, “Poverty, Programs, and
Prices: How Adjusting for Costs of Living Would Affect
Federal Benefit Eligibility” (Washington: Brookings
Institution, 2008).
72. See www.npr.org/programs/morning/features/2001/aug/
scranton/010814.scranton.html.
73. See www.npr.org/programs/morning/features/2001/aug/
scranton/010814.scranton.html
BROOKINGS | June 2011 53
74. Felicity Barringer with Simon Romero, “Corning and
Alcatel Announce Large Cutbacks,” New York Times,
July 10, 2001.
75. The largest manufacturing industry in 2005 was fabri-
cated metal manufacturing.
76. Thomas Dublin and Walter Licht, The Face of Decline: The
Pennsylvania Anthracite Region in the Twentieth Century
(Ithaca, NY: Cornell University Press, 2005).
77 Dublin and Licht. Face of Decline.
78. Greater Scranton Chamber of Commerce, 100 Years
of Service: Greater Scranton Chamber of Commerce
1867-1967 (Scranton, PA: Greater Scranton Chamber of
Commerce).
79. Greater Scranton Chamber of Commerce, The Greater
Scranton Chamber of Commerce. Available at http://www.
scrantonchamber.com/history.php.
80 Greater Scranton Chamber of Commerce, 100 Years
of Service.
81. Greater Scranton Chamber of Commerce, 100 Years
of Service.
82. Dublin and Licht. Face of Decline.
83. Dublin and Licht. Face of Decline.
84. David Falchek, “Chambers of Commerce in Spirit of
Cooperation.” Scranton Times-Shamrock, August 3, 2003.
85. See www.npr.org/programs/morning/features/2001/aug/
scranton/010814.scranton.html.
86. Greater Scranton Chamber of Commerce, “A Detailed
History of the Greater Scranton Chamber of Commerce.”
Available at http://www.scrantonchamber.com/uploads/
page_publications/extensive_history1241196428.pdf.
87. Scranton Lackawanna Industrial Building Company,
“SLIBCo: Fifty Years & Building” (Scranton, PA, 1995).
88. Greater Scranton Chamber of Commerce, “Detailed
History.”
89. Scranton Lackawanna Industrial Building
Company,“SLIBCo”.
90. “’96 is Year of Opportunity for NE PA,” Northeast
Pennsylvania Business Journal, April 1996. Accessed at
www.highbeam.com.
91. This program was started in the state of Pennsylvania in
1983. Its goal is “To accelerate technology development
and commercialization in the state of Pennsylvania, and to
create high-paying, sustainable jobs for Pennsylvanians.”
92. For more information, see the Great Valley Technology
Alliance Web site at www.greatvalleyalliance.com/aboutus.
php.
93. The focus of the colleges on fiber optics ended with the
collapse of that industry in Scranton.
94. A background of the college is available at: http://
www.thecommonwealthmedical.com/oth/Page.
asp?PageID=OTH000018.
95. Note that the region is now home to a few relatively large
high-tech firms such as Pepperjam and Solid Cactus,
though it is too early to tell whether or how this might
evolve into a larger industry cluster.
96. See Royce Hanson and others, “Corporate Citizenship.”
97. Friedhoff, Wial, and Wolman, “The Consequences of
Manufacturing Decline.”
98. Our findings, therefore, support the arguments of
Chinitz, Christopherson and Clark, and Safford about the
economic and social disadvantages of a regional economy
dominated by a few large firms. See Benjamin Chinitz,
“Contrasts in Agglomeration: New York and Pittsburgh.”
American Economic Review, vol. 51, no. 2 (May 1961): 279-
289; Susan Christopherson and Jennifer Clark, “Power
in Firm Networks: What It Means for Regional Innovation
Systems.” Regional Studies, vol. 41, no. 9 (December
2007): 1223-1236; Sean Safford, Why the Garden
Club Couldn’t Save Youngstown (Cambridge: Harvard
University Press, 2009).
99. For a categorization of these policy levers in terms of
successive “waves” of state-level economic develop-
ment policy, see Andrew Isserman, “State Economic
Development Policy and Practice in the U.S.: A Survey
Article,” International Regional Science Review 16 (1994):
49-100.
100. Robert Baade makes this point forcefully in his evaluation
of sports as a metropolitan development strategy. See
Robert A. Baade, “Getting into the Game: Is the Gamble
on Sport As a Stimulus for Urban Economic Development
a Good Bet?’ in Urban and Regional Policy and Its Effects,
volume 3, edited by Nancy Pindus, Howard Wial, and
Harold Wolman (Washington: Brookings Institution Press,
2010).

BROOKINGS | June 201154
101. Richard Florida is the most notable proponent of this
argument. See Richard Florida, The Rise of the Creative
Class (New York: Basic, 2002).
102. Hanson and others, “Corporate Citizenship.”
103. These activities were part of what Isserman termed the
“second wave” of economic development policy, which
was designed to promote the growth of new and exist-
ing firms that were rooted in regional economies. See
Isserman, “State Economic Development Policy.”
104. These estimates are based on a shift-share analysis,
as described in Friedhoff, Wial, and Wolman, “The
Consequences of Manufacturing Decline.” They do not
take into account indirect impacts of transportation and
warehousing on employment and wages in other indus-
tries.
105. It is difficult for state and local governments to influence
the business strategies of multinational corporations,
but Pike, Rodriguez-Pose, and Tomaney suggest that
government officials try to influence corporate deci-
sionmaking indirectly by allying themselves with locally
based managers, who may have the desire and ability to
influence corporate decisions in ways that benefit their
home regions. See Andy Pike, Andres Rodriguez-Pose, and
John Tomaney, Local and Regional Development (London:
Routledge, 2006).
106. Herbert Rubin, “Shoot Anything That Flies; Claim
Anything That Falls: Conversations with Economic
Development Practitioners,” Economic Development
Quarterly 2 (1988): 236-251.
BROOKINGS | June 2011 55
Acknowledgments
The authors thank Austin Burke, George Erickcek, Kent Gardner, Carolyn Gatz, Dan Haar, Ned Hill, Drew Klacik, Rick Rothacker, and Jennifer Vey for their comments on an earlier draft of this report. They also thank Susan Christopherson, Jennifer Clark, Sean Safford, Carey Treado, and participants in the 2009 Industry Studies Association conference for comments on a preliminary version of the report’s major findings. They are grateful to the Alfred P. Sloan Foundation for its support of the report. The Brookings Institution Metropolitan Policy Program thanks the John D. and Catherine T. MacArthur Foundation for its support of the report and of the Metropolitan Economy Initiative.
For More InformationHoward WialThe Brookings Institution1775 Massachusetts Avenue NWWashington, DC [email protected](202) 797-6412
For General InformationThe Brookings Institution Metropolitan Policy Program(202) 797-6139www.brookings.edu/metro
The Brookings Institution is a private non-profit organization. Its mission is to conduct high qual-ity, independent research and, based on that research, to provide innovative, practical recommen-dations for policymakers and the public. The conclusions and recommendations of any Brookings publication are solely those of its author(s), and do not reflect the views of the Institution, its management, or its other scholars.
Brookings recognizes that the value it provides to any supporter is in its absolute commitment to quality, independence and impact. Activities supported by its donors reflect this commitment and the analysis and recommendations are not determined by any donation.
1775 Massachusetts Avenue, NW Washington D.C. 20036-2188telephone 202.797.6000fax 202.797.6004web site www.brookings.edu
telephone 202.797.6139 fax 202.797.2965web site www.brookings.edu/metro
BROOKINGS
About the Brookings Institution Metropolitan Economy InitiativeTo inform debate about metropolitan economic development, the Brookings Institution has launched a series of analyses designed to promote under-standing of the economic transformation underway in the nation’s metropolitan areas. The Metropolitan Economy Initiative provides practi cal research and policy advice that state and local leaders can use to maximize their communities’ economic potential and achieve prosperity.
In the Series:• Bearing the Brunt: Manufacturing Job Loss in the
Great Lakes Region, 1995–2005• Bootstrapping High Tech: Evidence from Three
Emerging High Technology Metropolitan Areas• The Consequences of Metropolitan Manufacturing
Decline: Testing Conventional Wisdom• The Implications of Service Offshoring for
Metropolitan Economies• Living Wage Laws: How Much Do (Can) They Matter?• The Local Economic Impact of “Eds & Meds”: How
Policies to Expand Universities and Hospitals Affect Metropolitan Economies
• Middle-Wage Jobs in Metropolitan America• New Housing, Income Inequality, and Distressed
Metropolitan Areas• Where Workers Go, Do Jobs Follow?