Embed Size (px)
Citation preview

ECONOMICS ESSAYS 1. INTRO
DEFINITIONS THESIS OUTLINE BODY PARAGRAPHS LINK TO THESIS
2. TRENDS HISTORICAL > STATS CURRENT > STATS LINK TO QUESTION
3. BODY TOPIC SENTENCE DEFINITIONS + FORMULAS DIAGRAMS CAUSE/EFFECT OR ADVANTAGES/DISADVANTAGES CURRENT TRENDS + FUTURE TRENDS LINK
4. CONCLUSION THESIS SUMMARY OF ARGUMENTS FUTURE TRENDS FINAL ARGUMENT/THESIS KEY 2018’S HSC 2019’S HSC ESSAYS FOR ELSIE ESSAYS FOR ELLA

TOPIC 1: THE GLOBAL ECONOMY Account for the differences between the different levels of economic development in the global economy. INTRO Definitions:
- Global economy: The Global Economy refers to the synchronisation of multiple economies accelerated by the process of globalisation.
- Different types of economies: World economies are typically categorised under three labels; ‘developing’, ‘emerging’ and ‘advanced’.
- Global vs. domestic reasons - G = trade system, finance architecture,
phantom aid. - D = Resource endowment, labour
supply, institutions.
CONTEXT Mention: - Globalisation
- According to World Bank most countries experienced improvements in development (especially emerging)
- Industrialisation Fact:
- Inequality tra economies accounts for 70% of the disparity between the levels of ED
1. Global trade systems
Theory: - Less incentivised to join bilateral - Trading blocs exclude lower nations - Higher income can subsidise their producers
easier Contemporary:
- EU Common Agricultural Policy (18-28% tariff on agricultural imports)
- Graph on tariffs - Also Graph on subsidies
Fact: - A 1% lift in market share of trade for Asian,
African Latin America lifts 128m people out of poverty.
2. Internal financial/political +
Theory 1. - Investor confidence is in strong economies

Discuss the effects of globalisation on the global economy.
financial flows - Low confidence because poor political stability/economic growth
- General inability to invest due to weak financial institutions set up to account for
- Higher levels of FDI inflows results in higher income levels, which can be used for x, y, z to improve ED
- Graph AD Ye graph
Contemporary: - The lowest 48 countries only receive 4.8% of
global FDI flows. - Strong negative correlation between level of
corruption and economic development (good govs invest in education etc.) The top 20 least corrupt have a HDI higher than 0.785
3. Factor Endowments Theory: - Lack of natural resources - Lack of skilled labour due to brain drain
- Graph of AS cannot shift right so lower incomes
Contemporary: - Australia’s large source of income from mining
vs. Mali poor factor endowment - Mali HDI = 0.427 - Australia HDI = 0.938
INTRO Definitions: - Globalisation: Globalisation refers to the
increasing integration and interdependency of economies through an increase in trade, financial flows, investment, technology and labour movement.
- Global economy: The Global Economy refers to the synchronisation of multiple economies accelerated by the process of globalisation.
CONTEXT Coordination pros vs. cons
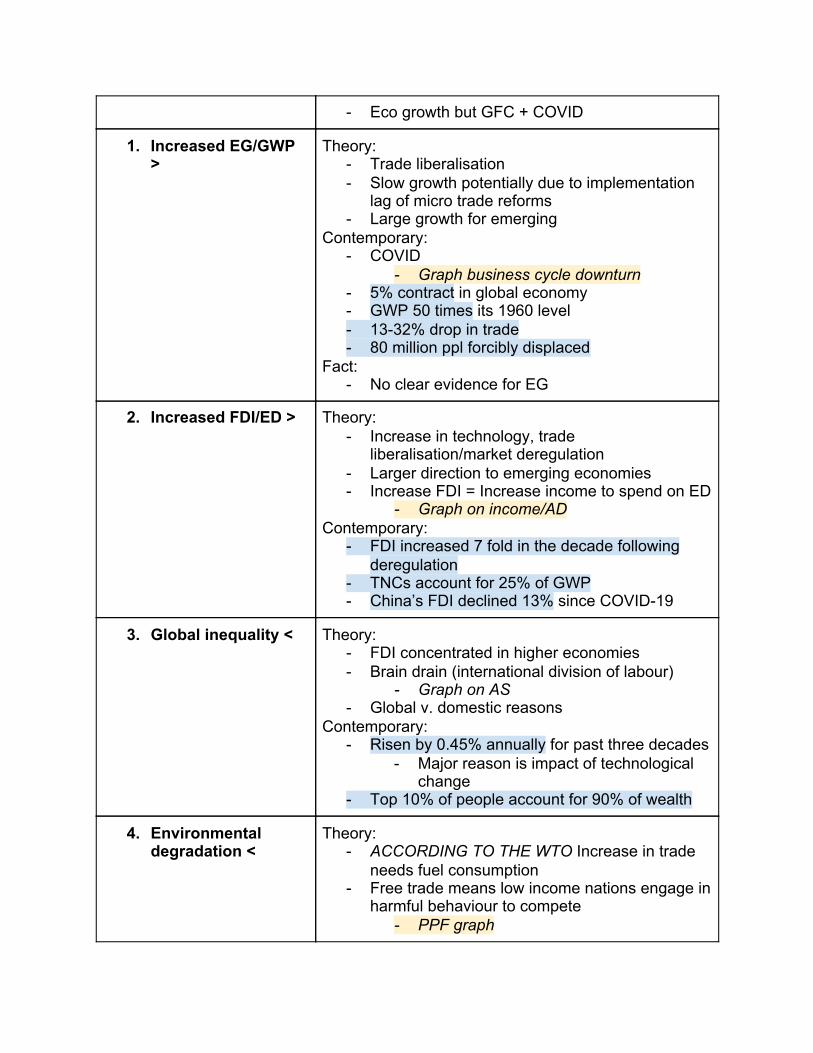
- Eco growth but GFC + COVID
1. Increased EG/GWP >
Theory: - Trade liberalisation - Slow growth potentially due to implementation
lag of micro trade reforms - Large growth for emerging
Contemporary: - COVID
- Graph business cycle downturn - 5% contract in global economy - GWP 50 times its 1960 level - 13-32% drop in trade - 80 million ppl forcibly displaced
Fact: - No clear evidence for EG
2. Increased FDI/ED > Theory: - Increase in technology, trade
liberalisation/market deregulation - Larger direction to emerging economies - Increase FDI = Increase income to spend on ED
- Graph on income/AD Contemporary:
- FDI increased 7 fold in the decade following deregulation
- TNCs account for 25% of GWP - China’s FDI declined 13% since COVID-19
3. Global inequality < Theory: - FDI concentrated in higher economies - Brain drain (international division of labour)
- Graph on AS - Global v. domestic reasons
Contemporary: - Risen by 0.45% annually for past three decades
- Major reason is impact of technological change
- Top 10% of people account for 90% of wealth
4. Environmental degradation <
Theory: - ACCORDING TO THE WTO Increase in trade
needs fuel consumption - Free trade means low income nations engage in
harmful behaviour to compete - PPF graph

For an economy other than Australia analyse the impacts of strategies aimed to improve economic growth and development.
TOPIC 2: AUSTRALIA’S PLACE IN THE GLOBAL ECONOMY Analyse the causes of Australia’s current account deficit and its effects on the economy.
Contemporary - Industrial process accounts for 65% of
greenhouse gas emissions, of which transport contributes 15%
- Fish (like tuna) declined 74% in population over the past 50 years.
INTRO
CONTEXT
1.
2.
3.
INTRO Definitions: - BoP: The Balance of Payments records all
transactions between Australia and the rest of the world, consisting of the current account and the capital and financial account. The BoP is an important indicator of the health of an economy and Australia’s ability to make good on its foreign obligations.
- Ranges -3-6% - Current Account: Non-reversible transactions.
Mention: - Structural v. Cyclical

CONTEXT Persistent CADs First CAS 2019 in 44 years
- LNG exports reducing cyclical - Superannuation reducing structural
CAS pulled through in COVID at $17.7bn in second quarter of 2020
- External Stability is not a high economic objective anymore
1. Narrow Export Base (cause)
Theory: - Structural factor of an over dependence on
exporting minerals at 57% (natural endowment) Contemporary:
- China's drop in GDP in 2015/6 (8%>7%) caused deterioration of world price for coal increasing Australia’s CAD by 40%.
- Alex Brewster claims we need to focus on “ETMs and Services to recover from COVID and maintain our external stability.”
2. Low international competitiveness (cause_
Theory: - Low productivity growth (structural) in Aus
reduces competitiveness because production costs are up^
- Graph of AS left - Appreciation of AUD (cyclical) similarly
- Graph of appreciation - Impacts BOGs
Contemporary: - Australia’s 1990s PG was 2.2% now it is
ENTER STAT due to low wage growth ENTER STAT
- However, our relatively low AUD (17 year low in March 2020 at 0.55USD) has assisted in delivering CAS
3. Savings Investment Gap (cause)
Theory: - Savings-investment gap evolved due to a small
economy with historically low levels of national savings alongside a need for high levels of capital investment to stimulate eco growth.
- Finance through international borrowing > servicing payments > NPY outflows.
- Low household savings cause banks and Governments to borrow from overseas to facilitate domestic lending.
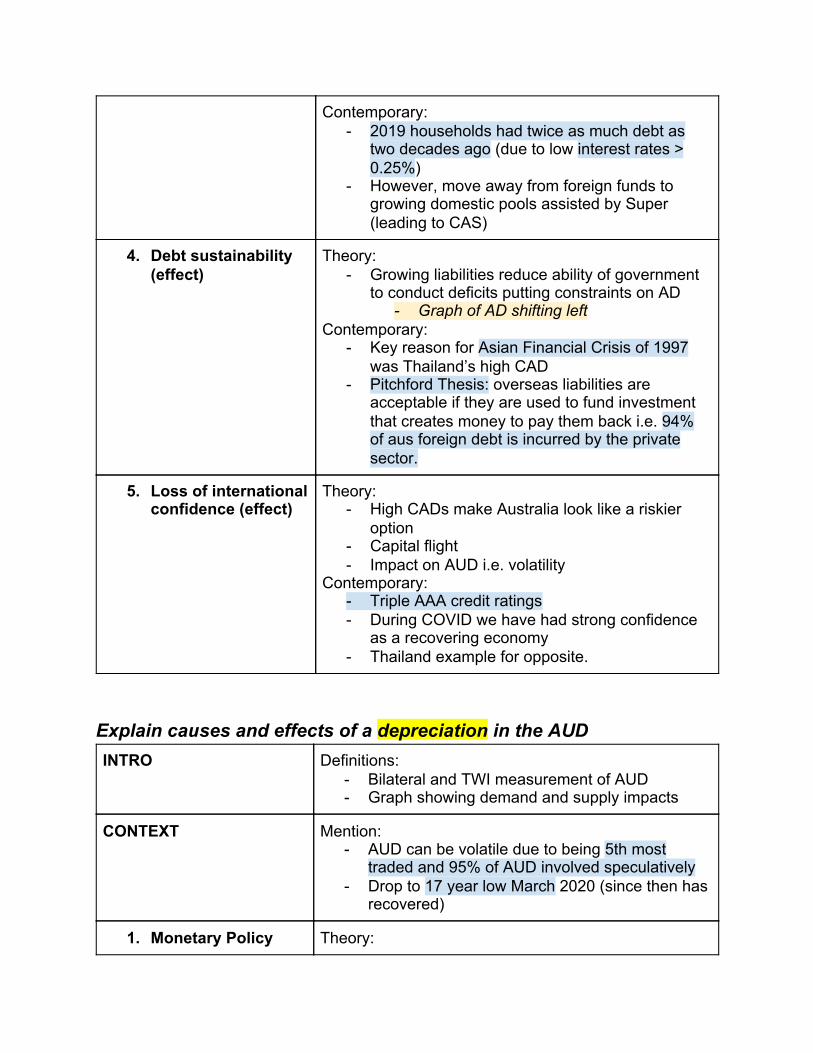
Explain causes and effects of a depreciation in the AUD
Contemporary: - 2019 households had twice as much debt as
two decades ago (due to low interest rates > 0.25%)
- However, move away from foreign funds to growing domestic pools assisted by Super (leading to CAS)
4. Debt sustainability (effect)
Theory: - Growing liabilities reduce ability of government
to conduct deficits putting constraints on AD - Graph of AD shifting left
Contemporary: - Key reason for Asian Financial Crisis of 1997
was Thailand’s high CAD - Pitchford Thesis: overseas liabilities are
acceptable if they are used to fund investment that creates money to pay them back i.e. 94% of aus foreign debt is incurred by the private sector.
5. Loss of international confidence (effect)
Theory: - High CADs make Australia look like a riskier
option - Capital flight - Impact on AUD i.e. volatility
Contemporary: - Triple AAA credit ratings - During COVID we have had strong confidence
as a recovering economy - Thailand example for opposite.
INTRO Definitions: - Bilateral and TWI measurement of AUD - Graph showing demand and supply impacts
CONTEXT Mention: - AUD can be volatile due to being 5th most
traded and 95% of AUD involved speculatively - Drop to 17 year low March 2020 (since then has
recovered)
1. Monetary Policy Theory:

- Expansionary monetary policy - Buys CGS injecting money increasing
supply lowering interest rates - Graph
- Interest rate differentials = unattractive for foreign investors to save money
- Graph = shift left in demand Contemporary:
- The RBA is currently pushing expansionary to the limits 0.25% March caused drop in March
2. Domestic economic conditions
Theory: - Economic boom increases consumers income
increasing demand for M - Increases supply of AUD
- Graph of supply Contemporary:
- Commodity boom contributed to strong eco growth enabling consumers to demand imports and dollar depreciating to US$0.49 in 2001
3. Global economic conditions
Theory: - Economic downturn in IBC reduces demand for
Aus X Contemporary:
- IMF states Global economy contracted for first time ever by 5%
- However due to Aus eco growth (-7%) offsets global as we aren’t demanding as much M either.
4. CON = External instability/valuation effect
Theory: - Volatile dollar and deep depreciates deteriorates
international confidence worsening external stability
- Debt denominated in foreign currencies worsens (valuation effect)
Contemporary: - Sharp drop in March then bounce back up to
current $0.72
5. PRO = international competitiveness
Theory: - Short term bad for CAD because M are more
expensive - Long term good bc X are more desirable
improving trade deficit

Outline changes to Australia’s free trade and protection policies and analyse the effects of these changes on the Australian economy.
- Current CAS of $17.7bn Contemporary:
- 2011/12 appreciation of AUD to US$1.10 saw deterioration of IC causing trade deficit of -$4bn
INTRO Definitions: - Free trade: The movement of g/s between
countries without the imposition of artificial barriers by governments.
- Comparative advantage - Protection: When governments use strategies
to artificially give domestic firms an advantage over foreign competitors.
- Globalisation: Globalisation refers to the increasing integration and interdependency of economies through an increase in trade, financial flows, investment, technology and labour movement.
CONTEXT Mention: - Deregulation or product and financial markets in
80s led to years of EG - Undertaken bilateral and multilateral
(strengthened M capacity and X) - Thrived in commodity and services
1. Reduced protection Theory: - Reducing protection ensures the principle of
comparative advantage can operate, which improves overall productivity and prices for economy
- AS Graph? Contemporary:
- Removal of tariffs by Whitlam (25% cuts to all in 1973)
- Current average tariff is 1.3% - Tariff Graph
- Removal of PMV subsidies of 500m annually - Subsidy graph
2. Increased bilateral Theory:

and multilateral - Trade agreements facilitate stronger trading relationships
- Move to trade with Asia-Pacific region Contemporary:
- ChAFTA (2015) important because biggest trading partner
- Eliminates tariffs on 96% of goods by 2029 + MVN clause
- APEC (1989) increased Aus output by 6.8% and created 500,000 jobs.
3. PRO = Lower inflation and increased efficiency and productivity growth
Theory: - Reduce protection removes tariff taxes that
consumers were burdened with reducing overall prices and increasing deflationary pressures
- Reduced protection also improves efficiency because we specialise in industries (comparative advantage)
Contemporary: - ⅘ employed in services - Those employed in manufacturing declined 26%
to 10% since 1970
4. CON = Unemployment/heavy reliance on certain nations
Theory: - Structural reforms to assist in trade increase
structural unemployment - Negative implications for budget and economy
(i.e. low wage growth). Contemporary:
- PMV industry 2016/17 laid off 700,000 employees accounting for two thirds of u/e rate in 2017
Theory: - Strong reliance on China can help us i.e. GFC
mining boom appreciated AUD to $1.12 helping avoid recession + June quarter $112bn of X helped achieved CAS
- However, diplomatic tensions exposed Australia’s supply shortages i.e. PPE and Barley tariffs (80%) and wine

TOPIC 3: ECONOMIC ISSUES Explain the causes and effects of economic growth INTRO Definitions:
- Real GDP/Economic Growth: Increase in the value of g/s produced by an economy over a period of time. It is measured by a percentage change in real GDP.
- Formula (AD = C + I + G + (X-M)) i.e. leakages and injections
- Business cycle - Graph
CONTEXT - 29 years of economic growth around 4% - Slowing in recent years - Successful macroeconomic policy - COVID
1. Consumption (cause)
Theory: - 60% of AD hence important
- Graph of AD shifting right - Factors that influence consumption are:
- Interest rates - Distribution of income - Consumer confidence - Unemployment (COVID)
Contemporary: - Strong expansionary macroeconomic policy to
encourage consumption, which is at devastatingly low levels
- Low interest rates graph - $213bn deficit (largest since WWII)
- Fiscal automatic stabilisers to improve distribution of income (2 $750 payments to low income earners at beginning of COVID).
- Consumer confidence dropped to a 12 year low at 75 points in April 2020
2. Investment (cause) Theory: - 20% of AD - Influenced by:
- Interest rates - Productivity - Micro and Macro policies

- Business expectations Contemporary:
- Direct support for small businesses: Terms Funding Facility
- Instant asset write off for 99% of businesses of up top $150,000
- Low levels of productivity since the 1990s (labour productivity 2.2% in June quarter of 2020)
3. Trade (cause) Theory: - (X-M) can impact AD positively if there is a trade
surplus - Influenced by:
- Exchange rates - ToT - Tastes and preferences - Productivity
Contemporary: - Commodity boom from China post GFC assisted
in avoiding a recession and appreciated the AUD to $1.12
- Trade surplus (LNG exports) leading to CAS of $17.7bn carry on effect of support budget deficit through having available funds
4. Higher living standards/Employment creation (effect)
Theory: - Increase in real GDP per capita - Higher disposable income
Contemporary: - Faster economic growth in 2000’s resulted in
2.3% annual growth in per capita real incomes compared to 2% late 2000s.
Theory: - AD higher than AS means there is a need for
labour - Graph of labour supply
- Can lower unemployment rate and underemployment as well as creating jobs + improvement in wages (low levels of wage growth at 1.8%
Contemporary: - Currently low economic growth has had adverse
effect with record high unemployment (7%) and underemployment (19%)
Explain the causes and effects of unemployment
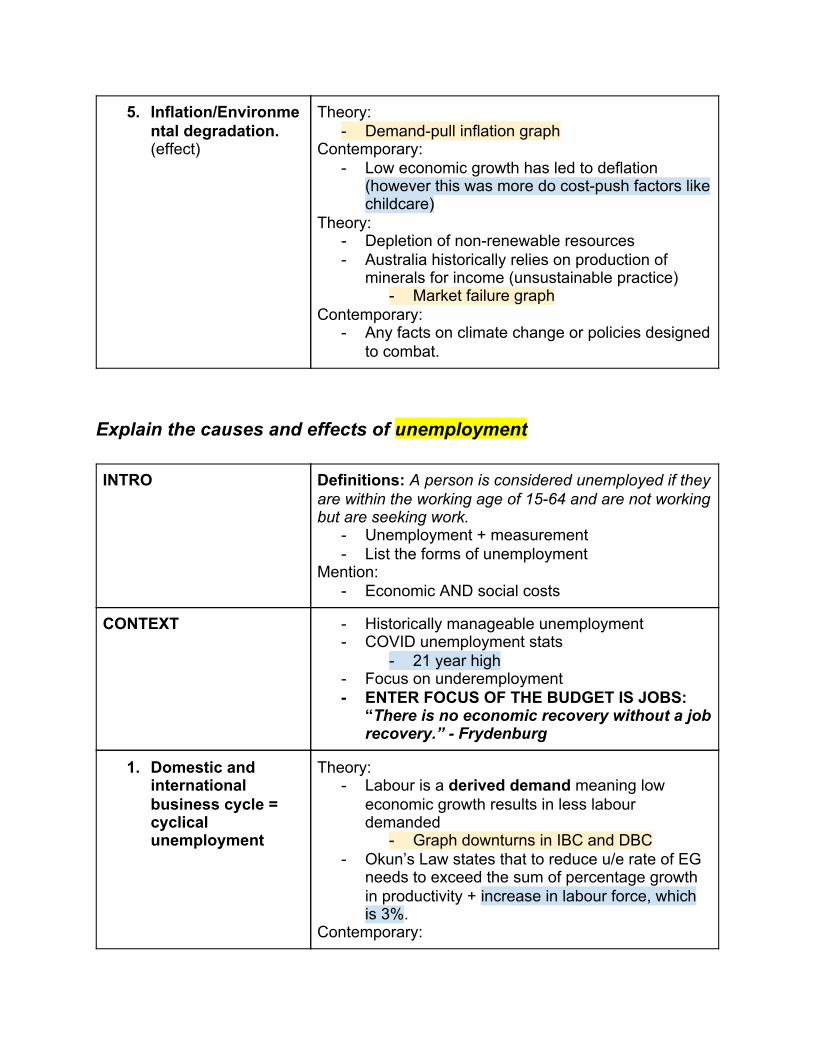
5. Inflation/Environmental degradation. (effect)
Theory: - Demand-pull inflation graph
Contemporary: - Low economic growth has led to deflation
(however this was more do cost-push factors like childcare)
Theory: - Depletion of non-renewable resources - Australia historically relies on production of
minerals for income (unsustainable practice) - Market failure graph
Contemporary: - Any facts on climate change or policies designed
to combat.
INTRO Definitions: A person is considered unemployed if they are within the working age of 15-64 and are not working but are seeking work.
- Unemployment + measurement - List the forms of unemployment
Mention: - Economic AND social costs
CONTEXT - Historically manageable unemployment - COVID unemployment stats
- 21 year high - Focus on underemployment - ENTER FOCUS OF THE BUDGET IS JOBS:
“There is no economic recovery without a job recovery.” - Frydenburg
1. Domestic and international business cycle = cyclical unemployment
Theory: - Labour is a derived demand meaning low
economic growth results in less labour demanded
- Graph downturns in IBC and DBC - Okun’s Law states that to reduce u/e rate of EG
needs to exceed the sum of percentage growth in productivity + increase in labour force, which is 3%.
Contemporary:

- COVID downturn resulting in -6.3% EG and 7.5% u/e
- Underemployment is a huge issue over 1.8 million
- Participation rates and productivity are not rising at a good enough pace (Okuns) with Frydenberg announcing that the three main objectives of the government are “Productivity, participation and population”.
Cyclical Policy Derived demand for AD (C + I + G + (X-M) so any improvement to the indicators can help cyclical.
- New Budget aims to create BLAH amount of jobs through:
- JobMaker - JobTrainer - Manufacturing - Women in STEM - Infrastructure.
2. Structural change (micro-economic reforms)
Theory: - Define structural - Restructuring of manufacturing industry - Education and retraining programs
Contemporary: - PMV industry case study accounted for “⅔ of job
losses in 2017” according to Employment outlook.
- Number of Australians involved in retraining programs has almost halved in the past 5 years according to “Australian Jobs 2018”
- INCLUDE BUDGET STAT ABOUT NEW PROGRAMS
Structural policy JobMaker: Hiring credit to encourage businesses to hire young Australians 16-24 yr olds.
- U/e for young ppl during COVID = 16.1%
3. Deterioration of budget balance
Theory: - Falling income tax revenue - Increased transfer payments due to automatic
stabilisers Contemporary:
- Largest deficit since WWII - BUDGET STATS
4. Low wage growth + Theory:

Explain the causes and effects of inflation
sole positive economic effect (control inflation)
- Excess labour supply leads to fall in equilibrium level of wages
- Graph of wages - Larger labour pool competing stalls wage growth
Contemporary: - Wage growth plunged from average of 4.5% up
until 2012 to 2% - Likely to continue to stall with COVID
Theory: - Positive effect is control on inflation (but not
worth it) - Phillips curve
5. Social costs Theory: - Crime, drug abuse, mental health issues,
suicides and family breakups - Can cause economic costs as funds are directed
towards welfare, police and correctional services rather than being used to satisfy community wants.
INTRO Definitions: - Inflation (is a sustained increase in the general
level of prices in an economy). - CPI
CONTEXT - RBA’s target of 2-3% since 1993 - Underlying v. headline
- GST in 2001 put headline inflation at 6% when underlying was 3.5%
- Low inflation at -0.3% due to COVID - Extreme expansionary stance to improve it.
1. Demand-pull Theory: - Demand > productive capacity - Competition for limited goods results in higher
prices. - Graph of demand pull
Contemporary: - AD is negative due to COVID reducing demand
pull - AD graph

2. Cost-push Theory: - Factors of production (labour, capital, land and
enterprise) increase firms pass these costs onto consumers
- Graph of cost-push - Causes can be crises and wages (60% of firms
costs) Contemporary:
- Childcare subsidy up to 95% during Covid was the key cause of negative inflation rates (mention underlying vs2. headline)
- Wage growth has plummeted to around 2% from the average of 4.5% between 2001-2012 decreasing inflationary pressures.
3. Imported inflation v. inflationary expectations
Theory: - Imports account for 20% of the final cost
structure of consumer goods. Higher import prices result in higher CPI
- Depreciation of AUD can similarly cause imported inflation as it makes purchasing international materials more costly
- Self-fulfilling prophecy Contemporary:
- Commodity boom 2005-08 Australian inflation peaked at 5.1%
4. Negative effects = income inequality, contractionary policy responses, international competitiveness.
Theory: - Income inequality worsens because those on
fixed incomes (welfare) don't match rising prices. - Low income earners also face higher interest
rates on their borrowings as RBA applies contractionary monetary policy to control inflation.
- Impacts of contractionary fiscal policy i.e. unemployment.
- Phillips curve Contemporary
- Current monetary policy
5. Positive = real value of borrowers’ loan and avoidance of deflation.
Theory: - Diminishes real value of loans easier to repay
them (especially important for government) - High inflation also reduces deflation (define)
Contemporary: - Our current deflation (headline though)

Evaluate the effectiveness of environmental policies used to address market failure in Australia INTRO Evaluation = Mixed effectiveness
Definitions: - Ecologically sustainable development:
Ecologically sustainable development involves conserving and enhancing the community’s resources to ensure that ecological processes are quality of life and are maintained. It is a level of economic activity that is compatible with the long term preservation of the natural environment rather than the maximum level of economic growth possible in the short term.
- Market failure: Market failure occurs when the price mechanism fails to take into account the social needs and benefits of production.
Key words: - Intergenerational equity - Exploitation of resources - Policy focus
CONTEXT Mention: - Globalisation > led to unsustainable practices - Climate Change > list some facts
Future risks associated with CC: - IMF estimates climatic disasters will cost global
economy $1.3tn annually - Reduce Australia’s GDP by 4.8% by 2100 and real
wages by 7.8%
1. Regulation Theory: - Policy approach eliminates negative externalities
entirely through banning the demerit good. - Graph of social v. private cost
- National parks prevent the depletion of renewable resource i.e. fish stocks and environmental damages
- Graph of PPF Contemporary:
- Leaded petrol ban 2002 effective in reducing speed of CC i.e. UN predicted increase in AUS temperature of 1 degree from 1990-2010 instead increased 0.8 degrees
- Banning plastic bags > NSW agreed March 2020 (9 billion bags used per year)

TOPIC 4: ECONOMIC POLICY Discuss the conflicts between different economic objectives
- Increase in single-use consumption during COVID due to take-away safety measures reducing effectiveness
- Great Barrier Reef two thirds dead but Turnbull announced $444m grant to GBR Foundation (key source of tourism income for Queensland so important)
2. Market-based (tax and subsidy)
Theory: - Market-based internalise the externality - Explain taxation of demerit + Graph - Explain subsidy of merit + Graph
Contemporary: - Carbon Tax 2012 > $23 per tonne was highly
effective reducing emissions to their lowest level since 1997/98
- Political constraints of fiscal policy saw tax repealed by Abbott government in 2014
- Subsidy to the Clean Energy Innovation Fund $1.8bn annually
- 2020 budget 62m to nature based tourism
3. International treaties/targets
Theory: - Environmental crises often require global cooperation - International treaties can hold countries accountable - However, they are largely unenforceable and
unsuccessful Contemporary:
- Montreal Protocol to phase out production of ozone-depleting products by 2000 highly effective (98% removed according to UN)
- Paris Agreement (2015) goal to ensure temps don't rise above 1.5 degrees ineffective (Trump pulling out 2016)
INTRO Definitions: - Macroeconomic policy (fiscal + monetary)

- Graph of objective to minimise fluctuations in the business cycle + act countercyclically
- Outline key objectives - Internal = Price stability, full employment,
economic growth, income and wealth distribution, environmental sustainability
- External = ToT, AUD, Net Debt, NFL, CAD, International competitiveness.
CONTEXT Mention: - External stability less important - Environmental sustainability should be important
but is discarded - Current economic objectives are the three Ps
(Productivity, participation and population).
1. Price stability v. full employment
Theory: - Define both concepts - To achieve full employment uses expansionary
policy, which can increase AD and demand pull inflation
- Graph of demand pull inflation - Relationship described by the phillips curve
- Graph phillips curve Contemporary:
- Currently we have 21 year high u/e (7%) and record low interest rates (0.25%)
- Both economic objectives can coexist currently because our inflation is so low (-0.3%) that any expansionary policy aimed at improving unemployment will also improve our inflation to get to the target of 2-3% (RBA since 1993).
2. Economic growth and environmental sustainability
Theory: - Economic growth can be achieved through
increasing AS which may exhaust resource inputs depleting natural resources and producing pollution
- Graph of AS - Minimising negative externalities involves
increasing prices to reduce market failure but this in turn can decrease AD
- Graph of AD and graph of social cost v. private cost
Contemporary:

Evaluate the effectiveness of fiscal policy in achieving Australia’s current economic objectives.
- Australia is one of the worst countries at combating Climate Change with our priorities lying in unsustainable practices due to our rich resource endowment and composition of exports (55% = mining).
- Carbon tax removed case study
3. Economic growth and external stability
Theory: - Increase eco growth improves capacity to buy
imports deteriorating trade balance (M>X) - Strong AD also may require contractionary policy
which pushes up interest rates and thus appreciating the dollar disrupting external stability.
Contemporary: - Strong eco growth and dollar in 2011/12 ($1.12)
led to CAD of -$4 billion.
INTRO Definitions: - Fiscal policy - How it is implemented (use of the budget) - What are the objectives
- Graph of business cycle
CONTEXT Mention: - Fiscal consolidation goal for the past 10 years - COVID - Limitations of fiscal + benefits - Largest deficit since WWII - ENTER MORE STATS AFTER BUDGET
1. Economic Growth Theory: - Define economic growth + objective (3-4%
sustained increase > however, Treasury has estimated this to 2.75%)
- AD = C + I + G + (X-M) - Based on the theory of the simple multiplier (i.e.
injections create larger injections) - AD graph

- Expansionary vs. contractionary policy Contemporary:
- Currently have -7% EG due to COVID - First recession in 29 years (used to be effective) - Huge fiscal policy response - ENTER BUDGET STATS
2. Full employment Theory: - Define u/e + objective (4-5% u/e) - Full employment = natural rate (i.e. no cyclical) - Through discretionary measures and automatic
stabilisers the government can influence u/e - Improvements in AD also influences
Contemporary: - 21 year high of 7% u/e but it would have been
13.3% without government fiscal intervention (evidence of effectiveness)
- ENTER JOB KEEPER STATS AND DISCUSS JOBSEEKER
- Jobkeeper package worth $101bn to help support 3.5 million Australians since march 2020 to March 2021
- U/e expected to peak at 10% in december due to second wave in Victoria
3. Price stability Theory: - Monetary policy is more important in achieving
this outcome - Define Inflation + objective (2-3% target since
1993) - Mention different types of inflation i.e. cost-push
demand-pull etc. Contemporary:
- Government caused deflation through reducing cost-push from subsidising child-care showing conflict between objectives
- Graph of cost-push inflation - Graph of phillips curve
- Inflation at -0.3% but not reflective of underlying which is more 1.3%
4. Environmental sustainability
Theory: - Due to COVID environmental issues have been
ignored - Define ecologically sustainable development - Discuss limitations of fiscal policy and

Evaluate the effectiveness of monetary policy in achieving internal stability
environment i.e. (political constraints, implementation lag).
Contemporary: - Increased reliance on Iron ore and coal x to
stimulate growth (55% of exports) - Carbon Tax repeal 2014 Abbott - Lack of action in general
5. Income and distribution
Theory: - Define income and distribution (refer to gini
coefficient) - Graph Lorenz Curve of equality improving
- Current Gini is 0.34 above OECD average Contemporary:
- COVID has had a large impact on income and wealth distribution
- Superannuation early take out of $10,000 - Digital divide and larger impact on women (due
to their overrepresentation in sectors most affected).
- To combat there was 2 x $700 handouts to low income earners and increased welfare payments i.e. Jobkeeper
INTRO Definitions: - Monetary policy (Identify that The purpose of
monetary policy is to maintain price stability, full employment and economic prosperity and welfare, and that this is internal stability)
- Internal stability - Economic Growth - Price stability - Full employment
- Outline DMOs - For an “assess its effectiveness”: monetary is
effective in controlling inflation etc during upturns but less effective during downturns
CONTEXT Mention:

- When the inflationary target was set - Monetary policy’s effectiveness in controlling
inflation post/during GFC - Relative ineffectiveness in stimulating
employment in both GFC and present day CV - Unconventional monetary policy used in CV
crisis - The current extreme expansionary stance of
monetary policy
1. Economic growth Theory: outline the Transmission mechanisms impact on the investment and consumption component of AD - Contemporary:
- Monetary policy was used 2008-2011 both during and in the aftermath of GFC Dr David Gruen’s speech “The Return of Fiscal Policy”, the 4.25%-decrease in the official cash rate from Sep 2008 to Apr 2009 in response to the GFC contributed less than 1% to economic growth.
- Current cutting to 0.25% - During the June 2020 quarter, investment declined
5.9% to A$26.1 billion ($18.9 billion) on top of a downwardly revised 2.1% fall in the March quarter, figures from the Australian Bureau of Statistics (ABS) showed on Thursday. However, the outcome was far better than market forecasts for an 8.4% slump.
- Important to note that Coronavirus has been an anomaly which has led to extraordinary economic circumstances, which can distort indicators of monetary policy’s effectiveness Mention the importance of fiscal policy to fill the gaps. This has been so vital that monetary policy has been referred to as “fiscal support” now
2. Price Stability Theory: Outline a contractionary transmission mechanism and how this pushes real prices down. However, expansionary monetary policy is ineffective at maintaining price stability in downturns.
- Limitations due to indirectness such as that the banks don’t necessarily have to offset the lower borrowing rates and that they could keep interest rates the same on mortgages and business loans

Assess the impact of microeconomic reform on the labour market
- Contemporary: despite an extreme expansionary stance, inflation was -0.4% (but this is still distorted by childcare being made free)
3. Full employment Theory: expansionary monetary policy’s effects on full employment can also be explained with the transmission mechanism. An expansionary monetary policy stance will reduce unemployment as components of AD including C and I increase. Firms are more likely to invest in inputs to production, including labour. Simultaneously, firms must satisfy the increase in AD caused by expansionary monetary policy by increasing output which requires more employees. - Contemporary: “the Board will not increase the cash rate until progress is being made towards full employment” (Phillip Lowe). Unemployment levels of 7.4%
INTRO Definitions: - Labour market reforms (Interaction between the
supply and demand of labour to improve the supply, efficiency and productivity of labour.)
- Aggregate Supply - Graph of AS
- Labour is 60% of business costs so policy changes have a major influence on economy
1. Industrial relations (enterprise bargaining and productivity-based wages)
Theory: - Originally had a centralised wage system
- Inefficiencies due to compliance costs - 1991 introduction of EB at workplace level under
Keating and then Workplace Relations Act (1996) by Howard linked wage increases to productivity growth
- Graph of wages with a minimum wage (price floor) being reduced back to equilibrium (i.e. lowering wage costs)
- EB increases the efficiency of the labour market because it gives employers more flexibility to reward their employees with higher wages for increases in productivity.

Effectiveness: - Compliance costs reduced by $4.8bn over 10
years - Days lost to strikes decreased from 4000
average annually in the 80s to now below 200 - Labour productivity grew by 2.2% annually from
1990-2014 above the OECD average
2. Inequality and Fair Work Act 2009
Theory: - Workers possessing highly-demanded skills had
bargaining power but low-skills did not and had to rely on minimum wage or awards.
- To restore equity Rudd passed the Fair Work Act 2009 which introduced the Better-Off Overall Test (BOOT) and unfair dismissal was reintroduced
- FWA also reduced the awards from 4300 to 122 modern awards
- Dispute resolutions (conciliation and arbitration) Contemporary:
- Gini coefficient deteriorated from 0.292 in 1996-97 to 0.328 in 2017/18
- Currently discussing to remove the BOOT (not good)
- Efficient allocation of resources (allocative efficiency)
3. Education and training programs
Theory: - Education/retraining programs reduce structural
unemployment (define structural u/e) - Shift leftwards of Short-term Phillips curve
as NAIRU is contracting as structural u/e decreases
- Targets disadvantaged demographics that are part of the labour market
Contemporary: - Gonski: Per-capita to needs based $23.5bn over
10 years - Job-Active 2015/16 helps those on welfare find
new jobs and agencies get paid bonus if they then stay in the job for over 6 months increased employment from 13-20% of participants
- PaTH (prepare, trial, hire) 2016/17 incentivises businesses to trial a young person then $10,000 wage subsidy if they employ them
- Wage subsidy graph

Discuss the impacts of non-labour microeconomic
- Criticised as not that effective - The number of Australians involved in retraining
programs has almost halved over the past 5 years according to “Australian Jobs 2018”.

How does microeconomic policy/ reform promote long term economic performances in the australian economy?
INTRO Definitions: - Microeconomic reform (MER) refers to policies
that reform a particular product of factor markets with the aim of raising an economy’s long term growth and increasing its flexibility.
- Microeconomic policy aims to improve long term economic growth by influencing aggregate supply
- Include graphs. - The objectives of microeconomic reform are to
improve allocative efficiency, raise labour and capital productivity and increases competitiveness
- MER also causes structural change in economy whereby the patterns of production in an economy changes over time with the emergence of new industries and demise of old industries
4. Labour market Theory:
● Labour accounts for 70% of business costs so policy changes have a major influence on the economy.
● Microeconomic reform operates within product and factor markets, the latter of which contains Australia’s labour market.
● Labour market reform has greatly increased productivity and the efficiency of resource allocation of labour, which has strengthened price stability, but has worsened the distribution of income
● Contemporary:
● A major microeconomic reform in relation to labour markets was the decentralisation and deregulation of the labour market
● Wage systems have historically functioned on both federal and state levels, which established differing minimum Y and conditions for employees based on occupations.
● How: in the early 1990’s, a shift away from industry wide awards towards firm level

HSC ESSAYS
enterprise agreements occurred. The labour market system was still largely dominated by a mixture of state and federal systems which determined wages.
● A framework in abolishing this system was set by the Howard Government through the Workplace Relations Amendment (Work which was then overridden by Rudd’s Fair Work Act 2009.
● This reduced compliance costs for all states but Western Australia by $4.8 billion through 2010, illustrating the effectiveness of unified industrial relations systems.
● Furthermore, 4,300 state awards have been reduced to just 122, streamlining the awards system.
Implication on economic performance: - Inflation: because wages are now linked to
productivity, wage growth has reduced, in turn limiting input costs for firms. Thus, labour market economic reforms has contained cost push inflation
- Income distribution: another byproduct of the establishment of greater links between productivity and wages has been that high skilled workers are now better positioned to demand higher wages than low skilled workers. Thereby increasing income equality as low skilled workers have less bargaining power and thus less income.
-
5. Reduction of protection
Theory: -
6. Theory: -
“Assess the effectiveness of FISCAL POLICY in achieving its current economic objectives” INTRO Fiscal policy is a subset of macroeconomic policy where the government uses their annual budget as an instrument to affect economic activity, income distribution and the reallocation of resources. Through taking an expansionary (G>T) or contractionary (T>G) budget stance, the government can work counter-cyclically to changes in the business cycle in order to minimize fluctuations as demonstrated in the graph below:
- Business cycle graph CONTEXT The events of COVID-19 have brought on unprecedented economic crises necessitating “extraordinary fiscal stimulus for these extraordinary times.” (ABC, 2020). With the largest budget deficit since WWII at $213bn, the Australian government is engaging in extreme expansionary economic policies to get under control unemployment, economic growth and income and wealth distribution, which are Australia’s key current economic objectives. Through policies designed at improving aggregate demand (AD = C+I+G+(X-M)) the government can and has been effective in minimising the impacts of COVID-19 and achieving their current economic objectives. U/E THEORY + CURRENT STATS The 2020 budget was described by treasurer Josh Frydenburg as a ‘Jobs Budget’ arguing that there is “no economic recovery without a jobs recovery.” Unemployment has been a primary economic objective for the government during 2020. Unemployment occurs when a person of the working age (15-64) does not currently have a job but is seeking work. It is measured by dividing the total number of unemployed (u/e) by the labour force. It is the economic objective of the government to achieve a rate of u/e around 4-6% otherwise known as full employment, which is the natural rate of u.e that has removed all cyclical u/e. While the rate of u/e has trended around the natural rate for the past decade, COVID-19 saw u/e rapidly increase to 7.5% with forecasts of it peaking at 10% in December - a 21 year high. The key causes of this have been a sharp decrease in AD and as labour is a derived demand it has subsequently plummeted due to the closure of many businesses. A drop in AD is represented below:
- AD graph To return u/e to its natural rate the government can focus on improving its causes being low consumption alongside targeting disadvantage demographics. CONSUMPTION CONTEXT

Consumer confidence reached a 12 year low in April 2020 at 75 index points dramatically contributing to a fall in consumption, which comprises 60% of AD. To improve consumer confidence and consumption levels the government is working alongside monetary policy to bring the rate of borrowing to a record low as well as providing welfare benefits under the JobKeeper and JobSeeker programs that ensure Australians have a steady flow of income to spend. JobKeeper was an income program introduced at the start of COVID in the form of $1500 fortnightly payments now revised to $1100. Costing the Government $101bn it has provided support to 3.5 million Australians. Frydenberg announced that their initial policies helped save 700,000 jobs demonstrating their effectiveness in managing the economic objectives. FISCAL POLICIES DIRECTLY FOR U.E Furthermore, the new JobMaker program has targeted the youth u/e rate, which was significantly higher than the national rate reaching 16.5%. This hiring credit encourages businesses to hire workers aged 16-24 through subsiding wages thus improving demand and creating approximately 450,000 new jobs as demonstrated by the shift from Q1 to Q2.
- Graph of Wage subsidy. While the government has been criticised for basing its job creation forecasts off assumptions that there will be a vaccine by early 2021 and no new outbreaks, it is effectively targeting the u/e rate and has already reduced the predicted rate for 2020 of 13.3% u/e to 7.5%. Thus fiscal policy has been significantly effective in achieving the objective of full employment considering the crises. ECONOMIC GROWTH THEORY Economic Growth worldwide has fallen dramatically due to the consequences of COVID-19. While the Australian economy has fared better than most, with the UK recording -20% growth and New Zealand recording -12% compared to our current -6.3% it is important the Government continues to employ an expansionary stance to return economic growth to its objective of 3-4%. Economic growth is the increase in the total number of goods and services produced in an economy over a period of time measured by the percentage change in real GDP. Through increasing the factors of AD (C+I+G+(X-M)) the government can stimulate economic activity and economic growth as demonstrated below:
- Improving AD This is because of the simple multiplier theory, which argues that an initial injection into the economy will result in a larger increase in national income. The Government (G) has injected a record spending into the economy under the 2020 budget focusing on improving consumption © and investment (I).

INVESTMENT CONTEXT Financial policies including a reduction in tax and instant write-off programs have aimed to stimulate I+C. The discretionary measures lifting the $37,000 tax bracket to $45,000 achieving a tax reduction of approximately $6000 for low to middle income earners has effectively reduced tax for 11 million taxpayer. Tax reductions can stimulate consumption as they ensure more money stays with consumers who can then spent it - especially for low-middle income earners that have a higher marginal propensity to consume. However, with consumer confidence remaining low many economists including Killian Plastow have speculated on the effectiveness of this policy measure to increase consumption rather than savings. On the other hand, the instant write off program and reforms to insolvency have encouraged investment (I). Making the largest investment any Government has ever made (G) the program is accessible to 99% of businesses who can write off assets such as equipment and capital of up to $150,000. Paired with the RBA’s record low cash rate at 0.25% there has been a strong focus on encouraging investment to not only stimulate economic growth but to also improve cyclical u/e which is derived from AD. While the effectiveness of this program is difficult to assess only being introduced mid October, the Coalition is confident it will support an economic recovery. INCOME DISTRIBUTION THEORY Finally, COVID-19 has deeply impacted income and wealth distribution for Australians, becoming a key economic objective under the recent budget. Income distribution is measured by the Lorenz Curve which plots the cumulative percentage of income recipients against the cumulative percentage of income to create a line of perfect inequality that the Lorenz curve will deviate from, becoming worse the further it strays as demonstrated below:
- Lorenz curve graph Australia’s Gini Coefficient has worsened over the past decades reaching a score higher than the average OECD countries. To improve the distribution of income the government can improve welfare payments or target specifically hard hit demographics. INCOME DISTRIBUTION POLICIES The JobKeeper program as aforementioned and JobSeeker payments have seen unprecedented welfare spending that has supported the distribution of income. However, demographics such as women, indegenous Australians and the youth were particularly hard hit by the pandemic due to their overrepresentation in the industries most affected. Thus the most recent budget has provided specific programs to support these individuals and improve equality including; 240m for women in STEM, direct

funding for indigenous Australians in apprenticeships and the previously explained JobMaker program. Through these programs the government can influence the short-term issues that have arised, however Amber Schultz argues there will need to be further policies designed at reducing the long-term impacts on wealth distribution that have arisen from the pandemic, especially for women and super. CONCLUSION While achieving its current economic objectives will require a combination of fiscal, monetary and micro stimulus the 2020 fiscal policy measures to combat COVID have been greatly effective. The early intervention methods and recent budget announcements have supported a jobs recovery working back towards the economic objective of full employment. Similarly the record spending and budget plans to target AD have created a sense of confidence that economic growth will return to positive 2.75% by 2022-23. Finally, while policies have been introduced to encourage income and wealth distribution more stimulus will be needed to achieve long term objectives. “Assess the effectiveness of MONETARY POLICY in achieving its current economic objectives” (1100 words) INTRO
Monetary policy is a subset of macroeconomic policy that aims to influence aggregate demand (AD = C+I+G+X-M) through manipulating the cash rate. The Reserve Bank of Australia (RBA) conducts monetary policy (MP) independent of the government through Domestic Market Operations (DMOs), with the three objectives of full employment (4-5% u/e), price stability and enhancing the economic prosperity and welfare of Australian citizens. To achieve these objectives the RBA aims for a headline CPI (inflation) target of 2-3%, however while the RBA can effectively constrain the economy during an economic upturn it is less effective during a downturn, earning the catch phrase “pushing string”. CONTEXT Since 1993 the RBA has set an inflation target of 2-3% to control price stability and support a sustainable level of growth. Through DMOs the RBA can sell or buy second hand Commonwealth Government Securities (CGS) to manipulate the supply of money thus influencing the cash rate and subsequently AD. During an upturn the RBA can tighten MP by selling CGS as demonstrated in the figure below:
- TIGHT MP/SELLING CGS GRAPH

EXAMPLE OF OPPOSITE MP STANCE TO DEMONSTRATE KNOWLEDGE The move from i/r1 to i/r2 indicates an increase in the interest rates which through the transmission mechanisms can dampen AD by disencouraging borrowing for investment and consumption. This occurred during the mining boom when strong demand for mineral exports put upward pressure on AD seeing the RBA respond by increasing the cash rate from 5.5% in 2005 to 7.25% in 2008. CURRENT CONTEXT However, in more recent times the RBA’s effectiveness has been tested with the devastating economic impact of the COVID-19 crisis pushing expansionary MP to the limits. To improve our current economic growth (-7%), price stability (-0.3%) and unemployment (-7.5%) the RBA has set interest rates at a record low of 0.25% and begun employing unconventional MP to stimulate the economy alongside fiscal policy. ECONOMIC GROWTH THEORY Economic Growth is the increase in the total number of goods and services produced in an economy over a period of time measured by the percentage change in real GDP. The RBA can stimulate economic growth during an economic downturn by implementing expansionary MP through buying CGS injecting money into the economy as demonstrated by the figure below:
- LOOSE MP/BUYING CGS A decrease in the cash rate as noted by the slash to 0.25% in March 2020 can influence AD through boosting investment and consumption. Low i/r’s encourage investors and consumers to borrow due to relaxed servicing payments and with the RBA confirming in October 2020 that this cash rate level “will remain the same for at least another three years” consumers and investors can regain confidence due to the certainty of low i/r’s. ECONOMIC GROWTH EFFECTIVENESS/CONTEMPORARY Consumer confidence dropped to a 12 year low at 75 index points in April 2020 and investment fell by 5.9% in the June 2020 quarter. While these figures indicate the ongoing necessity for expansionary MP the 5.9% drop instead of the ABS’s forecast 8.4% drop and the increasing consumer confidence to a 2018 level high of 105 index points in October, indicate the effectiveness of the RBA’s expansionary stance. However, many economists including former Prime Minister Paul Keating argue the recovering economy and improvement in levels of EG are due to the extraordinary fiscal policy measures. The $213bn budget deficit for 2020-21 (largest since WWII) has been the key driver of an economic recovery. ECONOMIC GROWTH AND UNCONVENTIONAL MP

While fiscal policy is the main contributor with MP being described as purely “fiscal support” it must be recognised that the RBA has played a key role in enabling high fiscal stimulus. Unconventional MP can be used during times of crisis to improve economic conditions. Through quantitative easing (QE) the RBA can directly buy Government bonds to finance a budget deficit. While, QW popularly known as ‘printing money’ has been criticized in the past, economist Ross Gittins argues that “The RBA should not be afraid of supporting Government spending especially with inflation levels so low.” The traditional fear of hyperinflation as famously seen in Germany during the 1920s, is no longer a key cause for concern especially with headline inflation dropping into the negatives at -0.3%. PRICE STABILITY THEORY Inflation is the sustained increase in the general level of prices in an economy overtime measured by the Consumer Price Index, which tracks changes in the price of a basket of common goods. Price stability is a key economic objective of the RBA and can be influenced through manipulating demand pull inflation, which is derived from AD as noted in the graph below:
- DEMAND PULL INFLATION PRICE STABILITY CONTEXT AND EFFECTIVENESS By increasing AD through the transmission mechanisms previously explained, the RBA can increase inflation rates to ensure they meet the 203% target. Despite an extreme expansionary stance, inflation levels remain low at -0.3% headline and just 1.3% underlying. The gap between headline and underlying inflation can be attributed to the Government’s initial subsidisation of childcare which distorted cost-push inflation. Nevertheless, the inflation rate remains below the target with many economists including Chris Richardson remaining skeptical as to whether MP can increase it when wage levels continue to stagnate and savings level increase to 20%. UNEMPLOYMENT THEORY + CURRENT STATS Finally, while MP aims to achieve full employment it is limited due to its nature of being a blunt instrument as well as having a medium impact lag. The COVID-19 crisis has caused u/e to jump to a 21 year high at 7.5% in the June quarter of 2020. U/e occurs when a person is seeking but unable to find work. The lockdown and global economic recession with the IMF recording a 5% contraction in global GDP contributed to plummeting employment levels. Furthermore, the link between our low levels of inflation and high u/e can similarly be explained by the Phillips curve, which dictates the inverse relationship between the two as demonstrated below:
- Phillips Curve

UNEMPLOYMENT INEFFECTIVENESS While the RBA’s expansionary stance can improve AD and inflation rates and thus cyclical u/e, it is unable to target specific regions such as Victoria due to its unilateral nature. The Victorian u/e rate remains 1% higher than the national level due to the second set of lockdowns and requires immediate stimulus. The 18 month typical impact lag of the RBA policies has limited its effectiveness during the COVID-19 crisis, as it is unable to respond as quickly as fiscal policy to changes. Nevertheless, Phillip Lowes the RBA Governor remains committed to “continuing our current expansionary stance only until u/e bounces back.” CONCLUSION The economic calamity of COVID-19 has pushed MP to the limits, necessitating unconventional policy measures and exposing the limitations of the RBA’s policy. Despite this an economic recovery for Australia would not be possible without the combined support of fiscal and monetary policy to boost AD. Thus, while MP is only moderately effective in achieving its current objectives it is nevertheless crucial.