Embed Size (px)
Citation preview
ISSN 1327-8231
Working Paper No. 203
Economic Reforms and Carbon Dioxide
Emissions in European and Central Asian
Transition Economies
By
Rabindra Nepal
Clem Tisdell
and
Tooraj Jamasb
February 2017
ECONOMICS, ECOLOGY AND
THE ENVIRONMENT
THE UNIVERSITY OF QUEENSLAND
ISSN 1327-8231
WORKING PAPERS ON
ECONOMICS, ECOLOGY AND THE ENVIRONMENT
Working Paper No. 203
Economic Reforms and Carbon Dioxide Emissions in
European and Central Asian Transition Economies1
By
Rabindra Nepal2
Clem Tisdell3
and
Tooraj Jamasb4
February 2017
© All rights reserved
1 This is a copy of a draft paper completed in early 2015. A revised and extended version of it entitled ‘On
environmental impacts of market-based responses: Evidence from the European and Central Asian economies’ (authors: R. Nepal, T. Jamasb and C.A. Tisdell) will appear this year in Renewable and Sustainable Energy Reviews.
2 Business School, Charles Darwin University, Darwin, NT, 0800 Australia. Email: [email protected] 3 School of Economics, The University of Queensland, St. Lucia Campus, Brisbane QLD 4072, Australia
Email: [email protected] 4 The Business School, Durham University, Durham, DH1 3LE, UK. Email: [email protected]
The Economics, Environment and Ecology set of working papers addresses issues involving
environmental and ecological economics. It was preceded by a similar set of papers on
Biodiversity Conservation and for a time, there was also a parallel series on Animal Health
Economics, both of which were related to projects funded by ACIAR, the Australian Centre for
International Agricultural Research. Working papers in Economics, Environment and Ecology
are produced in the School of Economics at The University of Queensland and since 2011,
have become associated with the Risk and Sustainable Management Group in this school.
Production of the Economics Ecology and Environment series and two additional sets were
initiated by Professor Clem Tisdell. The other two sets are Economic Theory, Applications and
Issues and Social Economics, Policy and Development. A full list of all papers in each set can
be accessed at the following website:
http://www.uq.edu.au/economics/PDF/staff/Clem_Tisdell_WorkingPapers.pdf
For further information about the above, contact Clem Tisdell, Email:
In addition, the following working papers are produced with the Risk and Sustainable
Management Group and are available at the website indicated. Murray-Darling Basin
Program, Risk and Uncertainty Program, Australian Public Policy Program, Climate Change
Program :http://www.uq.edu.au/rsmg/working-papers-rsmg
For further information about these papers, contact Professor John Quiggin, Email:
1
Economic Reforms and Carbon Dioxide Emissions in European and
Central Asian Transition Economies
ABSTRACT
Global warming and other adverse climate change impacts induced by anthropogenic carbon
dioxide emissions is a major public policy concern around the world. This paper examines the
impacts of market-based economic reforms on per capita CO2 emissions in the European and
Central Asian transition economies where environmental degradation was pervasive prior
reforms. A dynamic panel data model is employed for this purpose for 28 countries covering
22 years from 1990-2012. Our results suggest that reforms in competition policy and corporate
governance are the significant driver of emissions reductions in the region. Therefore, advances
in competition policy and governance reforms are desirable given the available scope to extend
these reforms. The Kyoto Protocol had no significant effect in reducing emissions levels while
the relationship between economic growth and emissions seems weak based on our results. The
results indicate that reducing energy use by increasing energy efficiency and investments in
renewable energy are necessary to reduce the carbon emissions level and mitigate the adverse
impacts of climate change in the region.
Keywords: transition, CO2 emissions, reforms, environmental policy, climate change
JEL Classification: Q57, Q54, P27, P28
2
Economic Reforms and Carbon Dioxide Emissions in European and
Central Asian Transition Economies
1. Introduction
The early 1990s marked the end of command-based policies in former member nations of the
now defunct Soviet Union. They become transition economies (TECs) in the early 1990s and
embarked an era of market-based economic reforms in response to pervasive political, social
and economic pressures1. Economic liberalization, macroeconomic stabilization, restructuring
and privatisation and institutional reforms were the main ingredients of this transformation
process (Williamson, 1993). These reforms were termed Type I reforms while Type II reforms
included the design and enforcement of laws, regulation and supportive institutions to buttress
and facilitate the functioning of the market-based reforms (Svejnar, 2002).
The transition process vividly exposed the broad-scale environmental degradation that took
place during the command-based regime in these countries (Soderholm, 2001). High levels of
airborne particulates from industrial and household sources; widespread contamination of soil
and water from toxic chemicals and nitrates; and a persistent negligence of nuclear safety and
waste management issues were some of the common and urgent environmental problems
identified in the fifth European Community Environmental Action Programme (EAP) for
Central and Eastern Europe in 1993. The legacy of industrial inefficiency, obsolete and
polluting technologies coupled with weak environmental management and regulation prior to
their economic reforms had exacerbated ecological woes in the region.
The fifth EAP was a powerful forum as the meeting identified the long-term European
environmental agenda for the decades to follow. A central principle of the EAP was that the
process of economic reforms and restructuring associated with the transition were expected to
eliminate the perverse incentives that underlay many of the ecological problems of the centrally
planned economies (Hughes and Lovei, 1999). The importance of effective environmental
policies; institutions and investments in supporting the market-based reforms improving the
environmental performance of developed economies was also recognised. Now, 20 years after
1 The transition economies, in this study, comprise the countries of Central Europe and Baltic States (CEB), South
East Europe (SEE) and Eastern Europe and the Commonwealth of Independent States (CIS) belonging to the
Soviet Union (FSU).
3
the commencement of economic reforms by European and Central Asian TECs, it is possible
relying on available empirical data to determine the extent to which their market reforms
resulted in environmental experiments such as reduced air pollution. Has the prediction of the
fifth EAP been vindicated? The purpose of this paper is to investigate empirically the extent to
which this is true for reductions in carbon dioxide (CO2) emissions by this group of countries.
Improving air quality by reducing the amount of air pollutants such as carbon dioxide (CO2) in
the atmosphere has been an actively pursued global agenda since the 1992 United Nations
Framework Convention on Climate Change (UNFCC) came into force. The Kyoto Protocol,
which extended the UNFCC, was adopted in Kyoto on 11 December 1997 and entered into
force on 16 February 2005 while the first commitment period expired in 2012. All the TECs in
the group considered here had agreed to cap and eventually reduce their emissions of CO2
considering the international importance of combating global warming. However, to what
extent international climate change agreements like Kyoto Protocol (a post Kyoto analysis)
reduced the CO2 emissions of these countries remains an important empirical question.
The European and Central Asian (ECA) TECs still contribute about 15 percent of the
greenhouse gas emissions (GHGs) even though carbon emissions have fallen substantially
since 1990. For example, the transition region is the only major region in the world where per
capita carbon emissions fell substantially by about 28 percent between 1990 and 2008 despite
an average increase in real GDP in this region by about 22 per cent over the same period
(EBRD, 2011). This fall in CO2 emissions can be attributed to the combined effects of
economic reform and other underlying factors such as economic growth, investments in clean
energy, changed composition of energy use, environmental policies and compliance with the
EU directives that could potentially affect the trends in total emissions and environmental
quality. However, the extent of impacts of economic reforms and other underlying factors on
the falling levels of CO2 emissions in the TECs is unknown in the existing literature.
Furthermore, the region still includes some of the most carbon intensive countries in the world
such as Russia, Turkmenistan, Uzbekistan, Kazakhstan and Ukraine implying that there is
much scope for improvement in environmental quality.
The purpose of this study is to evaluate the impacts of the transition process on environmental
quality concentrating on comparisons of changes in CO2 emissions among fast and slow
reformers in the ECA TECs by capturing the combined effects of their economic reforms,
growth, environmental interventions and studying trends. The econometric evidences obtained
4
from this study aims to deliver two major objectives. First, there is a paucity of published
econometric studies gauging the impacts of market-oriented economic reforms on
environmental quality in TECs. This is particularly so for ECA TECs. This study helps to fill
this gap and identifies the main drivers of CO2 reductions in ECA TECs. Secondly, identifying
the drivers of CO2 emissions reductions will guide policymaking on combating climate change
in the TECs, as the TECs will have to further reduce emissions over the coming decades to
achieve the required scale of global emissions reductions.
The remainder of the study is organized as follows. Section 2 reviews the relevant literature on
the relationship between economic reforms, environmental regulations and environmental
quality. Section 3 describes the econometric methodology and data used while the results are
presented and discussed in section 4 along with relevant policy implications. Section 5
concludes the paper.
2. Review of Relevant Literature
The empirical literature on the relationship between CO2 emissions and economic growth is
large and is beyond the scope of this paper to review extensively. In general, the relationship
between several indicators of environmental degradation and income can be typified by an
inverted U-shaped relationship. This relationship is referred as the Environmental Kuznets
Curve (EKC) and was originally proposed by Seldon and Song (1994) implying that pollution
becomes a diminishing problem as per capita income rises large enough. In 1995, Grossman
and Krueger (1995) studied the EKC following cross-country studies on urban air pollution
(sulphur dioxide emissions and smoke) and several indicators of water pollution as measures
of environmental degradation. The EKC, hence, is a hypothesized relationship between
indicators of environmental degradation and economic development which shows that the
intensity of environmental degradation tend to increase as modern economic growth occurs
until average income reaches a certain point over the course of development. Several empirical
studies such as Shafik (1994), Hilton and Levinson (1998), Harbaugh, Levinson and Wilson
(2002), Dinda (2004) have confirmed this relationship although the functional form and data
properties can influence findings about the existence of an EKC curve. Other studies such as
Tisdell (2001), Stern (2004, 2014), Perman and Stern (2003) underscore the limitations of EKC
and outline the conditions under which the EKC relationship may not exist such as
heterogeneity, spurious regressions and spatial dependence.
5
Another strand of literature focusses on the relationship between economic openness and
environmental quality. Economic globalisation and trade openness is viewed as a possible
positive force for environmental improvement and as a major factor increasing the likelihood
of sustainable development through its likely boost to global investment (Tisdell, 2001). Earlier
empirical studies such as by Dean (2002); Copeland and Taylor (2004) and Frankel and Rose
(2005) have confirmed a positive relation between trade openness and environmentally quality.
The impact of environmental regulation and policy on environmental degradation has also been
captured by several studies. Grunewald and Martinez-Zarzoso (2009) found in testing the
theory of the EKC while taking account of environmental regulations that Kyoto obligations
had a reducing effect on CO2 emissions in both developed and developing countries. Iwata and
Okada (2014) found that the effects of commitment to the Kyoto Protocol significantly reduced
the CO2 emissions among 119 countries from 1990 to 2005. Similarly, Jalil and Habibullah
(2013) estimated that Kyoto commitment and Kyoto Clean Development Mechanism produced
a statistically significant effect in reducing C02 emissions in Asia and the Pacific region for the
period 1971-2009. Aichele and Felbermayr (2011) conducted the first ex-post empirical
evaluation of Kyoto Protocal to analyse the carbon content of bilateral trade. The results
showed that Kyoto has led to carbon leakage among countries. Carbon leakage implies that
environmental regulation and restrictions in some countries could change relative goods prices
and hence shift production of CO2 intensive goods to countries that are exempt from such
restrictions (Copeland and Taylor, 2005). For example, it is possible for higher income
countries to reduce their pollution intensities by shipping very polluting industries offshore
(such as in China and India) as growing environmental restrictions usually add to the private
costs of locating eco-unfriendly businesses in higher income countries.
Governance issues such as corruption and absence of democracy can also result in socially sub-
optimal environmental policy and regulation. Lopez and Mitra (2000), Damania, Fredriksson
and Mani (2005) and Pelligrini and Gerlagh (2005) show that the existence of corruption has a
negative effect n reducing environmental degradation. Moreover, Cole, Elliott and Fredriksson
(2006) found that foreign direct investments (FDI) was associated with less stringent
environmental policy when the corruption level is very high. Damania, Fredriksson and List
(2003) analysed the joint effect of trade openness and corruption on the stringency of
environmental policy. Their estimated results showed that trade openness increased the
stringency of environmental policy in countries with more corruption (low governance).
Halkos and Tzeremes (2013) empirically revealed a high nonlinear relationship between
6
countries’ CO2 emissions and the incorporated governance measures such as voice and
accountability; political stability and absence of violence; government effectiveness;
regulatory quality; rule of law and control of corruption. Their findings showed that increasing
the quality of countries' different governance factors does not always result to lower carbon
dioxide emission levels.
Pellegrini and Gerlagh (2005) found a negative and statistically significant impact of corruption
on environmental polices while the presence of democracy produced a limited positive impact.
Right-wing governments in OECD countries are found to be associated with less reduction of
CO2 emissions than centre and left-wing governments (Garmann, 2014). In the context of
transition economies, environmental problems can also be due to institutional inertia in the
economic and political system and are not necessarily only a result of market imperfections
(Soderholm, 2001). The stringency of environmental policies set under decentralised regimes
also depends on political centralization, measured by the strength of national level political
parties (Fredriksson and Wollscheid, 2014).
Zugravu, Millock and Duchene (2008) demonstrated that increases in stringency of
environmental policy led to a significant net reduction in CO2 emissions among the Central
and Eastern European countries between 1995 and 2003 even though their output growth
increased industrial CO2 emissions. The results confirmed the importance of institutional
factors in reducing pollution in transition countries. Another study by Tamazian and Rao
(2010) investigated the linkage between economic development, financial development and
institutional quality on environmental degradation in transition countries. The results lend
support to the EKC hypothesis while also confirming the importance of both institutional
quality and financial development for environmental performance in the region. They pointed
out that financial liberalization may be harmful for environmental quality among the transition
countries if it is not accompanied by a strong institutional framework. These existing studies
do not study the effect of market-based economic reforms on environmental degradation
controlling the effects of economic growth, environmental policy, investments in clean energy
and energy consumption patterns. This presents a major gap in the literature which this study
aims to fill.
3. Methodology and Data
The relationship between market-oriented economic reforms and environmental degradation is
7
complex, as the implementation of economic reforms does not instantaneously lead to
reductions in per capita CO2 emissions. The behaviour of the dependent variable can depend
upon the past values of itself along with a set of independent and control variables (Bruno,
2005). This necessitates specifying a dynamic panel data model can be expressed as:
yit = ρyi, t-1 + x'itβ + αi + ϵit ; |ρ| < 1; i = 1,…….N and t = 1,…….,T (1)
where yit is the dependent variable, xit is the { (k – 1) * 1 } vector of strictly exogenous
explanatory variables, ρ is the coefficient of the lagged value of the dependent variable, αi is an
unobserved individual effect, x'itβ represents the matrix of explanatory variables and coefficients
and ϵit is an unobserved white-noise disturbance with constant variance. However, econometric
literature establishes that a dynamic panel data model based on fixed-effects or the Least
Squares Dummy Variables (LSDV) analysis with a lagged dependent variable generates biased
estimates when ‘T’ is small as is the case here (Roodman, 2006). Kiviet (1995) that produced
the lowest Root Mean Square Error (RMSE) for panels of all sizes (Bun and Kiviet, 2003)
devised a bias-corrected LSDV estimator applicable only for balanced panel.
These earlier works led to the development of a bias-corrected LSDV estimate (LSDVC) by
Bruno (2005) for unbalanced panels as in our case. The approximation terms are all evaluated
at the unobserved true parameter values implying no direct use for estimation. Hence, the true
parameter values are replaced by estimates from some consistent estimator to make them work
(Bruno, 2005). The estimates obtained from a dynamic LSDV are also not meaningful unless
they are corrected for bias in small samples. The preferred estimator is then plugged into the
bias approximations formulae while the resulting bias approximation estimates βi_hat are
deducted to derive the corrected LSDV estimator as
LSDVCi=LSDV- βi_hat (2)
where i=1 in STATA by default indicates the accuracy of the bias approximation2. To initialize
the bias corrections, a consistent estimator needs to o be chosen and could vary could vary, for
2 The estimation includes one lag by default.
8
example, between the Arellano-Bond (AB) and the Blundell-Bond (BB) estimators (Bruno,
2005). The AB estimator is a GMM estimator for the first differenced model relying on a
greater number of internal instruments (Arellano and Bond, 1991). The BB estimator assumes
that the first differences of the instrumental variables are uncorrelated with fixed effects and
augments the AB estimator by allowing for introducing more instruments and improve
efficiency of the estimates (Blundell and Bond, 1998).
An alternative to LSDVC estimates would be to use other consistent Instrumental Variable (IV)
and Generalized Methods of Moments (GMM) estimators (Roodman, 2006). However, the
relative performance evaluation of LSDVC in comparison to LSDV, AB and BB estimators by
Bruno (2005) for unbalanced panels with small ‘N’ concludes that LSDVC is superior to all
other estimators in terms of root mean square errors (RMSE) and bias.
We thus use the LSDVC model to examine the impact of several market based economic
reforms on per capita CO2 emissions in transition countries and report the results for the
estimators used to initialize the bias corrections (AB and BB). Equation 3 examines the reform
impacts on emissions across the whole sample while equation 4 models the reforms impacts
on missions across the specific country groups (SEE, CEB and CIS) of TECs.
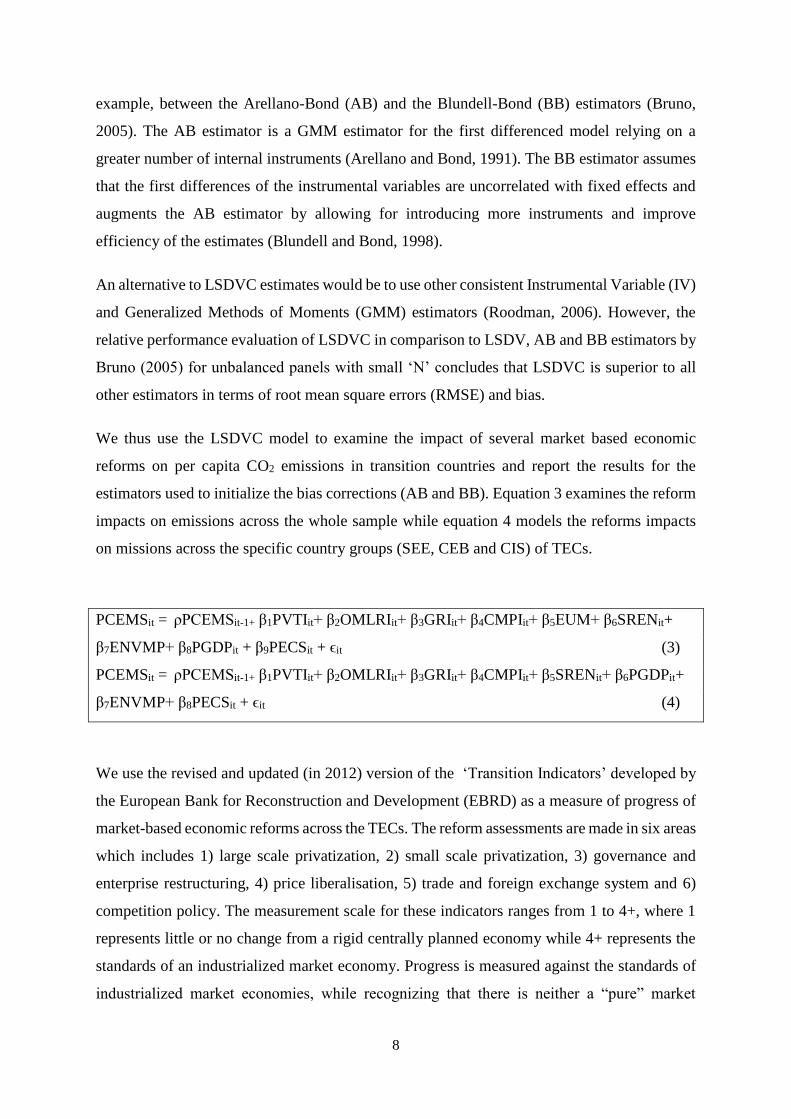
PCEMSit = ρPCEMSit-1+ β1PVTIit+ β2OMLRIit+ β3GRIit+ β4CMPIit+ β5EUM+ β6SRENit+
β7ENVMP+ β8PGDPit + β9PECSit + ϵit (3)
PCEMSit = ρPCEMSit-1+ β1PVTIit+ β2OMLRIit+ β3GRIit+ β4CMPIit+ β5SRENit+ β6PGDPit+
β7ENVMP+ β8PECSit + ϵit (4)
We use the revised and updated (in 2012) version of the ‘Transition Indicators’ developed by
the European Bank for Reconstruction and Development (EBRD) as a measure of progress of
market-based economic reforms across the TECs. The reform assessments are made in six areas
which includes 1) large scale privatization, 2) small scale privatization, 3) governance and
enterprise restructuring, 4) price liberalisation, 5) trade and foreign exchange system and 6)
competition policy. The measurement scale for these indicators ranges from 1 to 4+, where 1
represents little or no change from a rigid centrally planned economy while 4+ represents the
standards of an industrialized market economy. Progress is measured against the standards of
industrialized market economies, while recognizing that there is neither a “pure” market

9
economy nor a unique end-point for economic transition (EBRD, 2014). For example, a score
of 4+ in competition policy reforms imply that there is unrestricted entry to most market and
competition policy is effectively enforced representing the standards and performance typical
of advanced industrial economies. Likewise, a score of 1 indicate no competition legislation
and institutions in place.
We construct the following economic reform indicators from the set of six indicators to
summarize and reflect the different types of market driven economic reforms in the transition
countries:
Privatisation Reform Index (PRI): composite index based on un-weighted average of
small-scale privatisation and large scale privatisation reforms.
Governance Reform Index (GRI): comprising corporate governance and enterprise
restructuring reforms.
Overall Market Liberalization Reform Index (OMLRI): composite index based on un-
weighted average of reforms in price liberalization and trade and foreign exchange
reforms.
Competition Policy Reform Index (CMPI): comprising competition policy reforms.
Per capita CO2 emissions are used a measure of environmental degradation in this study3. We
focus on CO2 because CO2 emissions (from fossil fuel use, deforestation, biomass decay and
others) are the largest source of GHGs accounting for around 75 percent of the total emissions
globally in 2010 (IPCC, 2014). Hence, the contribution of CO2 emissions to global warming
and inducing adverse climate change impacts is internationally recognised implying that
reducing CO2 emissions is an issue of global importance. The data on CO2 emissions is also
rich and publicly available as compared to other measures of environmental degradation. We
control for the effect of economic growth on carbon emissions by including per capita Gross
Domestic Product (GDP) as an indicator of economic growth in the econometric model. The
literature studying the relationships between emissions and growth supports this inclusion
(Grossman and Krueger, 1991).
We also account for the effect of energy use by using per capita energy consumption as a
control variable. This is important as energy use contributed around 35 percent of CO2
3 Carbon dioxide emissions are the economy wide emissions levels as reported in the WDI.
10
emissions in 2010 (IPCC, 2014). The share of carbon-neutral generation technologies in the
generation mix such as renewable energy (SREN) is important in reducing the reliance on
emissions intensive generation technologies in the TECs. Furthermore, countries joining the
European Union (EUM) have established a common framework for the use of energy from
renewables sources aiming to obtain 20 percent of their energy from renewable sources by
2020. We explicitly control for the existence of an environmental policy (ENVMP) by
considering the ratification/acceptance of the Kyoto Protocol by the TECs. This is binary
variable and captures the different timings of acceptance/and ratification of the Kyoto Protocol
by the ECA TECs.
Capturing the extent of emissions reductions effects during the first commitment period of
Kyoto Protocol can provide guidance to these countries on the important aspects to be agreed
during the future commitment periods of the Protocol. Population growth is an important
factors so all comparisons are on per-capita basis. Further, the per capita GDP is adjusted for
purchasing power parities (PPP) to remove the price level differences levels across countries
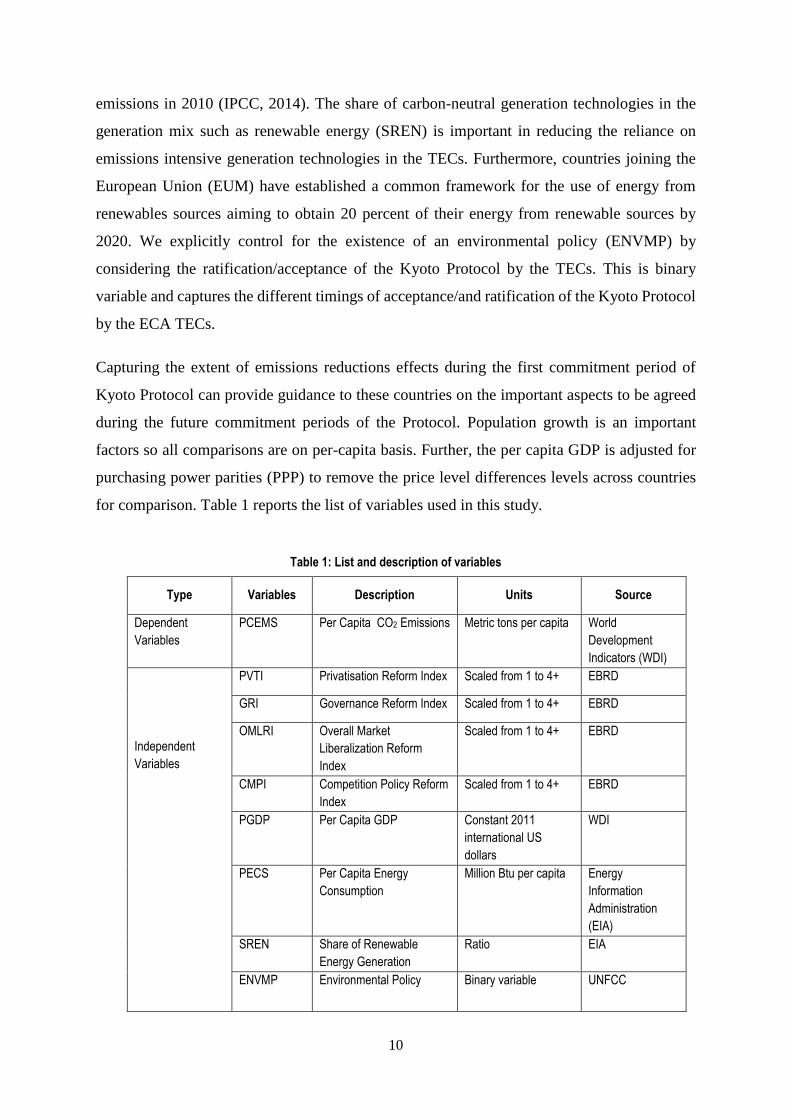
for comparison. Table 1 reports the list of variables used in this study.
Table 1: List and description of variables
Type Variables Description Units Source
Dependent
Variables
PCEMS Per Capita CO2 Emissions Metric tons per capita World
Development
Indicators (WDI)
Independent
Variables
PVTI Privatisation Reform Index Scaled from 1 to 4+ EBRD
GRI Governance Reform Index Scaled from 1 to 4+ EBRD
OMLRI Overall Market
Liberalization Reform
Index
Scaled from 1 to 4+ EBRD
CMPI Competition Policy Reform
Index
Scaled from 1 to 4+ EBRD
PGDP Per Capita GDP Constant 2011
international US
dollars
WDI
PECS Per Capita Energy
Consumption
Million Btu per capita Energy
Information
Administration
(EIA)
SREN Share of Renewable
Energy Generation
Ratio EIA
ENVMP Environmental Policy Binary variable UNFCC
11
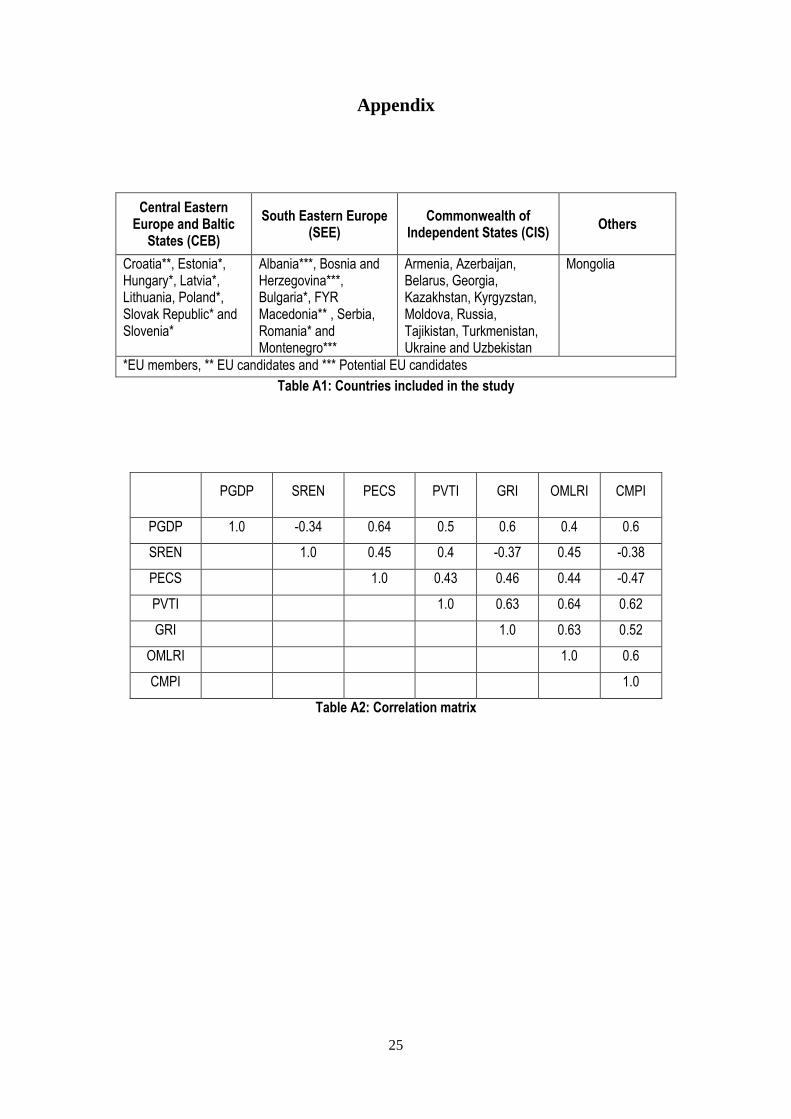
The period of analysis ranges from 1990-2012 (22 years) covering 28 countries (out of 34) in
the EBRD areas of operation. The year ‘1990’ marks the dawn of economic transformation in
most of the ECA transition countries. Some of the transition countries have already obtained a
membership at the EU while some are in the process of being a EU member and have the
potential for joining EU. Out of the included 28 countries in our sample, 15 are associated with
the EU while 7 out of 9 EU members in the sample belong to the CEB region. Table A1 in
Appendix lists the countries included in our analysis4. Thus, the data comprises an unbalanced
panel including 28 cross-sections with short time series of 22 years that captures the key reform
period from 1990-2012.
Table 2 shows the descriptive statistics for the dependent and independent variables. In general,
the results indicate that many transition countries have not fully met the economic reform
standards of industrialised economies in all sectors. Thus, market-based economic
transformation is an on-going (even stalled) process in many transition countries (Nepal,
Jamasb and Tisdell, 2014). It can be inferred that liberalizing the economy as a whole (which
involves opening up trade, liberalising foreign exchange and price liberalization in the
economy) has been on high agenda of reforms across the transition countries though the extent
of progress varies considerably across them. There is significant scope for advancing
competition policy and governance reforms in these countries as the average reform scores are
far below the 4+ levels observed in industrialized market economies. The average share of
renewable energy installed capacity in the total energy mix is only around 30 percent across
the TECs. Table A2 in the Appendix reports the correlation estimates among the variables.
4 We exclude Turkey, Egypt, Kosovo, Jordan, Tunisia and Morocco from our analysis due to lack of the data
although they fall within EBRD areas of operation.
12
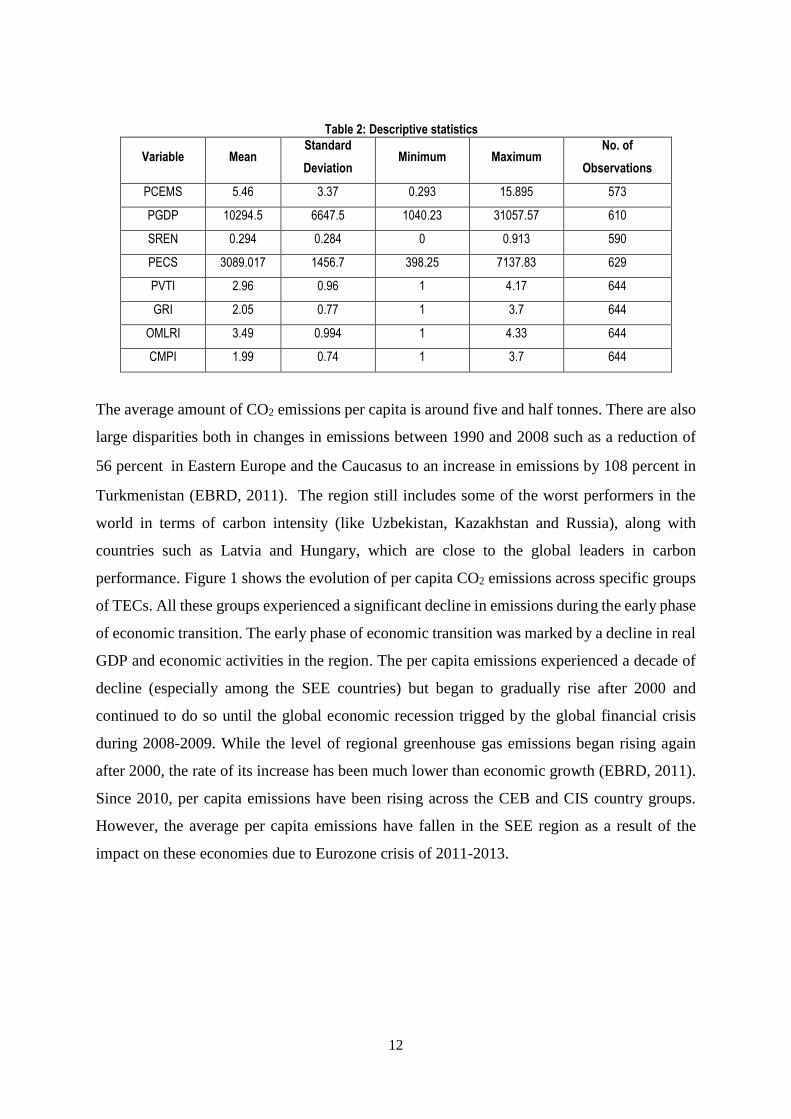
Table 2: Descriptive statistics
Variable Mean Standard
Deviation Minimum Maximum
No. of
Observations
PCEMS 5.46 3.37 0.293 15.895 573
PGDP 10294.5 6647.5 1040.23 31057.57 610
SREN 0.294 0.284 0 0.913 590
PECS 3089.017 1456.7 398.25 7137.83 629
PVTI 2.96 0.96 1 4.17 644
GRI 2.05 0.77 1 3.7 644
OMLRI 3.49 0.994 1 4.33 644
CMPI 1.99 0.74 1 3.7 644
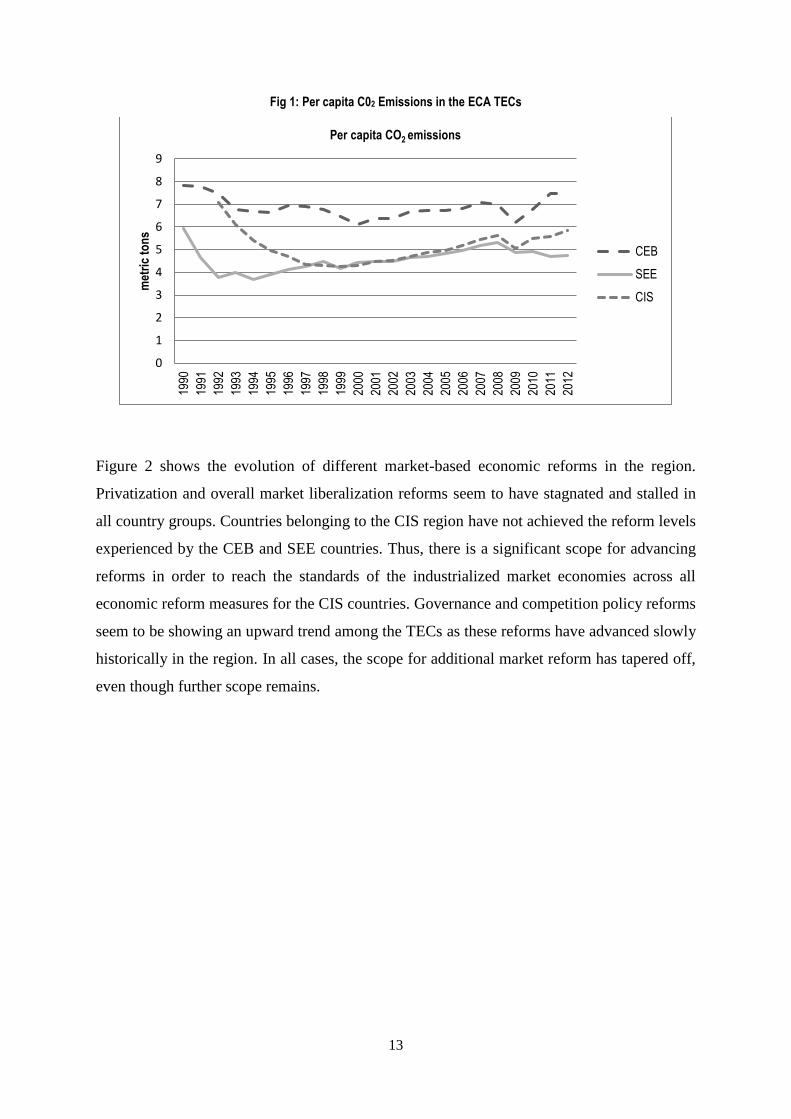
The average amount of CO2 emissions per capita is around five and half tonnes. There are also
large disparities both in changes in emissions between 1990 and 2008 such as a reduction of
56 percentin Eastern Europe and the Caucasus to an increase in emissions by 108 percent in
Turkmenistan (EBRD, 2011). The region still includes some of the worst performers in the
world in terms of carbon intensity (like Uzbekistan, Kazakhstan and Russia), along with
countries such as Latvia and Hungary, which are close to the global leaders in carbon
performance. Figure 1 shows the evolution of per capita CO2 emissions across specific groups
of TECs. All these groups experienced a significant decline in emissions during the early phase
of economic transition. The early phase of economic transition was marked by a decline in real
GDP and economic activities in the region. The per capita emissions experienced a decade of
decline (especially among the SEE countries) but began to gradually rise after 2000 and
continued to do so until the global economic recession trigged by the global financial crisis
during 2008-2009. While the level of regional greenhouse gas emissions began rising again
after 2000, the rate of its increase has been much lower than economic growth (EBRD, 2011).
Since 2010, per capita emissions have been rising across the CEB and CIS country groups.
However, the average per capita emissions have fallen in the SEE region as a result of the
impact on these economies due to Eurozone crisis of 2011-2013.
13
Fig 1: Per capita C02 Emissions in the ECA TECs
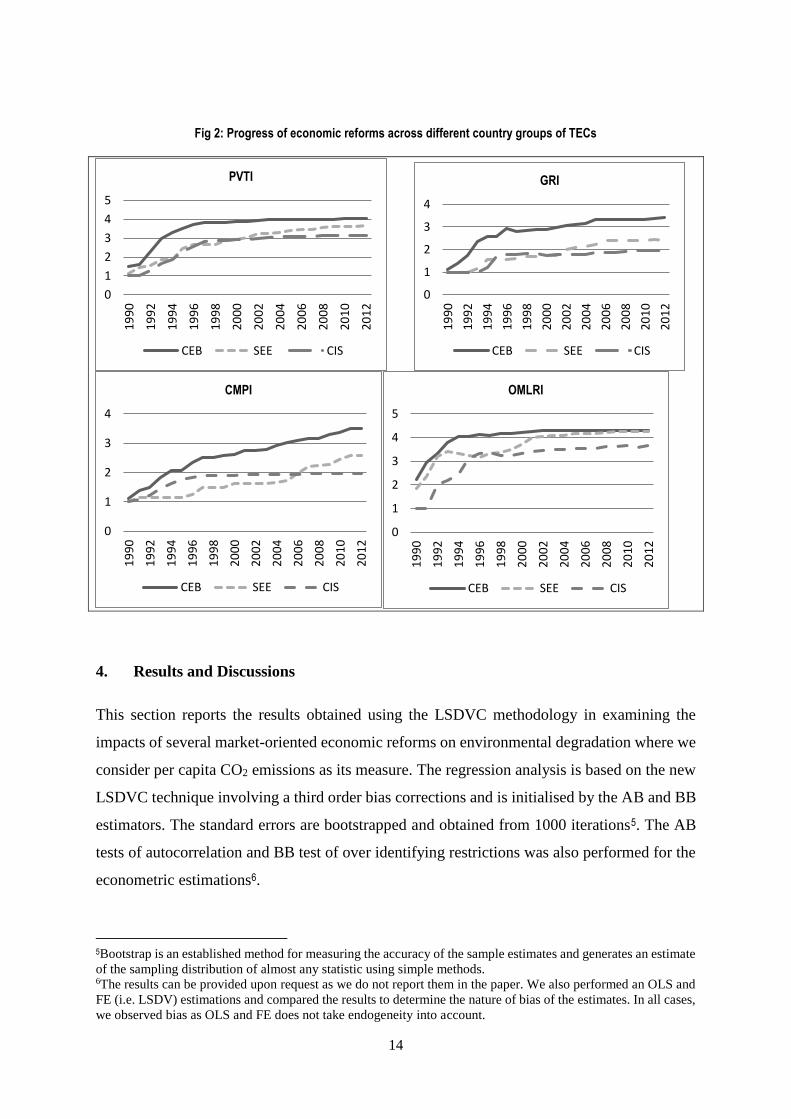
Figure 2 shows the evolution of different market-based economic reforms in the region.
Privatization and overall market liberalization reforms seem to have stagnated and stalled in
all country groups. Countries belonging to the CIS region have not achieved the reform levels
experienced by the CEB and SEE countries. Thus, there is a significant scope for advancing
reforms in order to reach the standards of the industrialized market economies across all
economic reform measures for the CIS countries. Governance and competition policy reforms
seem to be showing an upward trend among the TECs as these reforms have advanced slowly
historically in the region. In all cases, the scope for additional market reform has tapered off,
even though further scope remains.
0
1
2
3
4
5
6
7
8
9
1990
1991
1992
1993
1994
1995
1996
1997
1998
1999
2000
2001
2002
2003
2004
2005
2006
2007
2008
2009
2010
2011
2012
met
ric
ton
sPer capita CO2 emissions
CEB
SEE
CIS
14
Fig 2: Progress of economic reforms across different country groups of TECs
4. Results and Discussions
This section reports the results obtained using the LSDVC methodology in examining the
impacts of several market-oriented economic reforms on environmental degradation where we
consider per capita CO2 emissions as its measure. The regression analysis is based on the new
LSDVC technique involving a third order bias corrections and is initialised by the AB and BB
estimators. The standard errors are bootstrapped and obtained from 1000 iterations5. The AB
tests of autocorrelation and BB test of over identifying restrictions was also performed for the
econometric estimations6.
5Bootstrap is an established method for measuring the accuracy of the sample estimates and generates an estimate
of the sampling distribution of almost any statistic using simple methods. 6The results can be provided upon request as we do not report them in the paper. We also performed an OLS and
FE (i.e. LSDV) estimations and compared the results to determine the nature of bias of the estimates. In all cases,
we observed bias as OLS and FE does not take endogeneity into account.
0
1
2
3
4
5
19
90
19
92
19
94
19
96
19
98
20
00
20
02
20
04
20
06
20
08
20
10
20
12
PVTI
CEB SEE CIS
0
1
2
3
4
19
90
19
92
19
94
19
96
19
98
20
00
20
02
20
04
20
06
20
08
20
10
20
12
GRI
CEB SEE CIS
0
1
2
3
4
19
90
19
92
19
94
19
96
19
98
20
00
20
02
20
04
20
06
20
08
20
10
20
12
CMPI
CEB SEE CIS
0
1
2
3
4
51
99
0
19
92
19
94
19
96
19
98
20
00
20
02
20
04
20
06
20
08
20
10
20
12
OMLRI
CEB SEE CIS
15
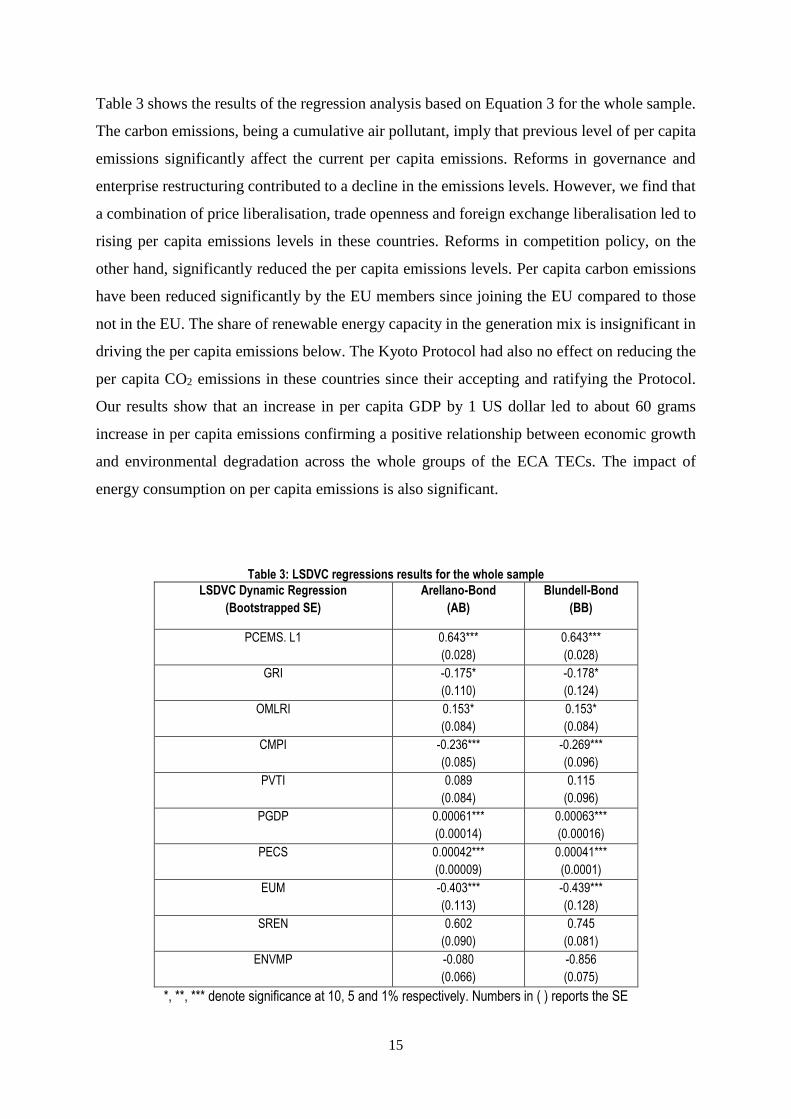
Table 3 shows the results of the regression analysis based on Equation 3 for the whole sample.
The carbon emissions, being a cumulative air pollutant, imply that previous level of per capita
emissions significantly affect the current per capita emissions. Reforms in governance and
enterprise restructuring contributed to a decline in the emissions levels. However, we find that
a combination of price liberalisation, trade openness and foreign exchange liberalisation led to
rising per capita emissions levels in these countries. Reforms in competition policy, on the
other hand, significantly reduced the per capita emissions levels. Per capita carbon emissions
have been reduced significantly by the EU members since joining the EU compared to those
not in the EU. The share of renewable energy capacity in the generation mix is insignificant in
driving the per capita emissions below. The Kyoto Protocol had also no effect on reducing the
per capita CO2 emissions in these countries since their accepting and ratifying the Protocol.
Our results show that an increase in per capita GDP by 1 US dollar led to about 60 grams
increase in per capita emissions confirming a positive relationship between economic growth
and environmental degradation across the whole groups of the ECA TECs. The impact of
energy consumption on per capita emissions is also significant.
Table 3: LSDVC regressions results for the whole sample LSDVC Dynamic Regression
(Bootstrapped SE)
Arellano-Bond
(AB)
Blundell-Bond
(BB)
PCEMS. L1 0.643***
(0.028)
0.643***
(0.028)
GRI -0.175*
(0.110)
-0.178*
(0.124)
OMLRI 0.153*
(0.084)
0.153*
(0.084)
CMPI -0.236***
(0.085)
-0.269***
(0.096)
PVTI 0.089
(0.084)
0.115
(0.096)
PGDP 0.00061***
(0.00014)
0.00063***
(0.00016)
PECS 0.00042***
(0.00009)
0.00041***
(0.0001)
EUM -0.403***
(0.113)
-0.439***
(0.128)
SREN 0.602
(0.090)
0.745
(0.081)
ENVMP -0.080
(0.066)
-0.856
(0.075)
*, **, *** denote significance at 10, 5 and 1% respectively. Numbers in ( ) reports the SE
16
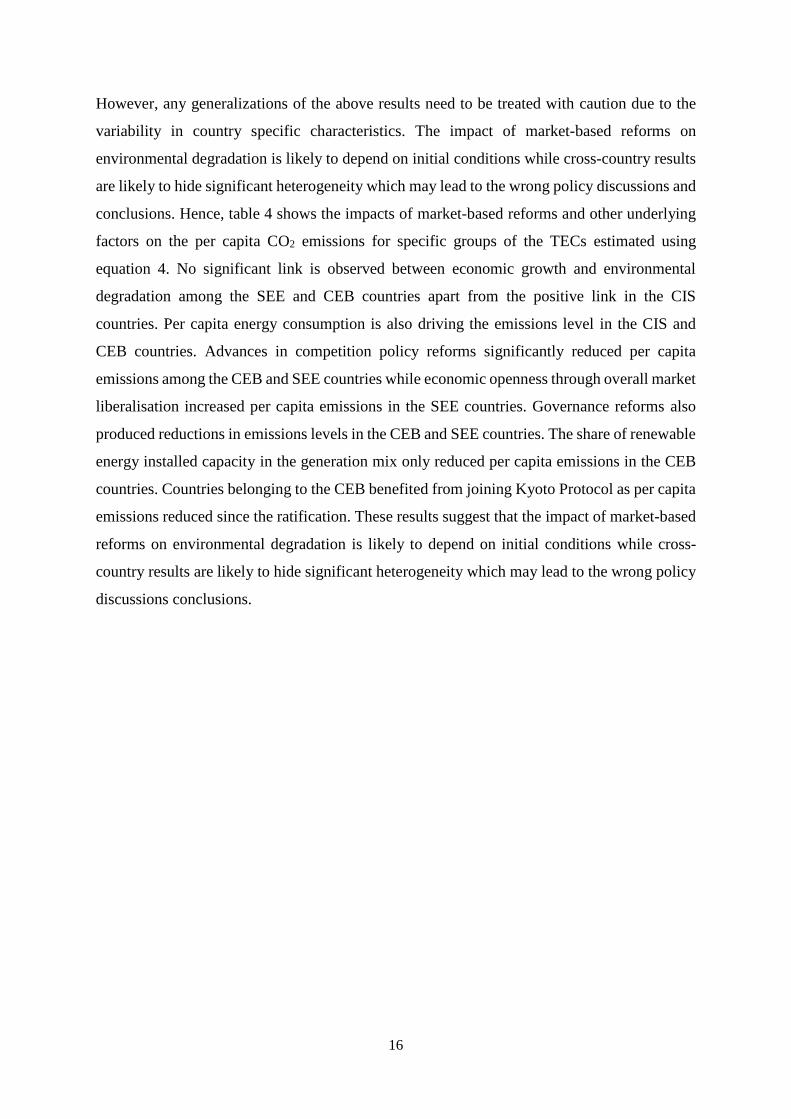
However, any generalizations of the above results need to be treated with caution due to the
variability in country specific characteristics. The impact of market-based reforms on
environmental degradation is likely to depend on initial conditions while cross-country results
are likely to hide significant heterogeneity which may lead to the wrong policy discussions and
conclusions. Hence, table 4 shows the impacts of market-based reforms and other underlying
factors on the per capita CO2 emissions for specific groups of the TECs estimated using
equation 4. No significant link is observed between economic growth and environmental
degradation among the SEE and CEB countries apart from the positive link in the CIS
countries. Per capita energy consumption is also driving the emissions level in the CIS and
CEB countries. Advances in competition policy reforms significantly reduced per capita
emissions among the CEB and SEE countries while economic openness through overall market
liberalisation increased per capita emissions in the SEE countries. Governance reforms also
produced reductions in emissions levels in the CEB and SEE countries. The share of renewable
energy installed capacity in the generation mix only reduced per capita emissions in the CEB
countries. Countries belonging to the CEB benefited from joining Kyoto Protocol as per capita
emissions reduced since the ratification. These results suggest that the impact of market-based
reforms on environmental degradation is likely to depend on initial conditions while cross-
country results are likely to hide significant heterogeneity which may lead to the wrong policy
discussions conclusions.
17
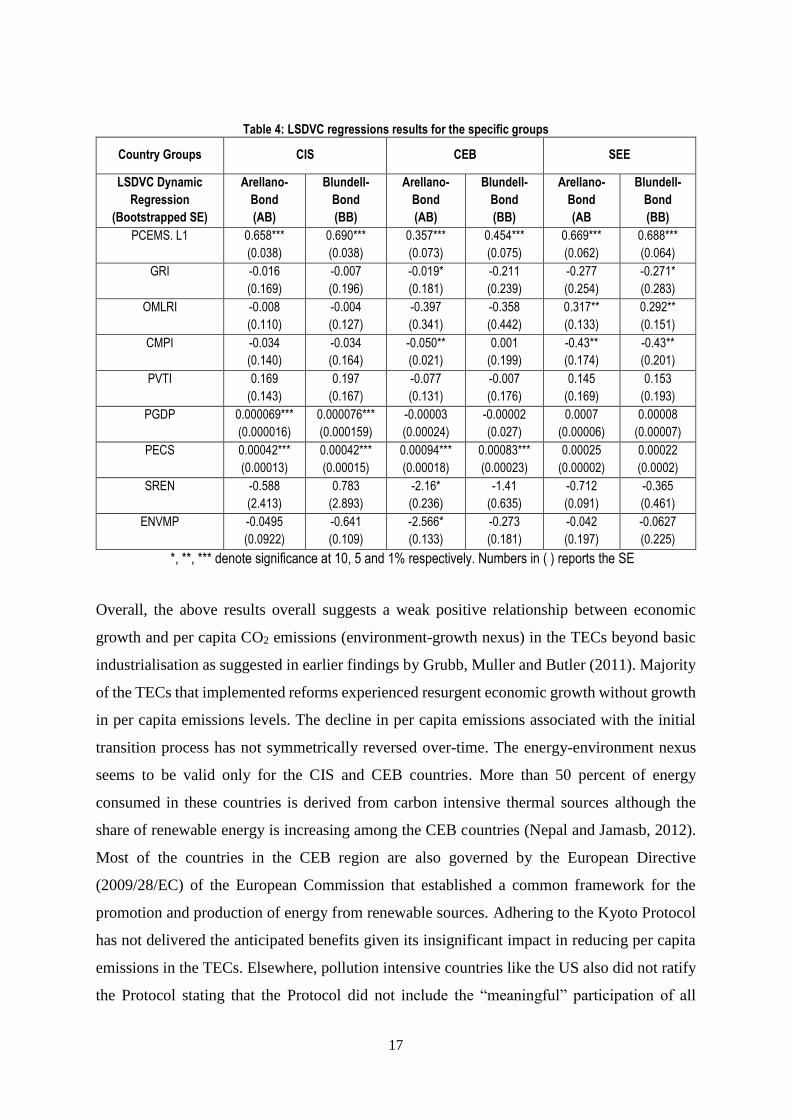
Table 4: LSDVC regressions results for the specific groups
Country Groups CIS CEB SEE
LSDVC Dynamic
Regression
(Bootstrapped SE)
Arellano-
Bond
(AB)
Blundell-
Bond
(BB)
Arellano-
Bond
(AB)
Blundell-
Bond
(BB)
Arellano-
Bond
(AB
Blundell-
Bond
(BB)
PCEMS. L1 0.658***
(0.038)
0.690***
(0.038)
0.357***
(0.073)
0.454***
(0.075)
0.669***
(0.062)
0.688***
(0.064)
GRI -0.016
(0.169)
-0.007
(0.196)
-0.019*
(0.181)
-0.211
(0.239)
-0.277
(0.254)
-0.271*
(0.283)
OMLRI -0.008
(0.110)
-0.004
(0.127)
-0.397
(0.341)
-0.358
(0.442)
0.317**
(0.133)
0.292**
(0.151)
CMPI -0.034
(0.140)
-0.034
(0.164)
-0.050**
(0.021)
0.001
(0.199)
-0.43**
(0.174)
-0.43**
(0.201)
PVTI 0.169
(0.143)
0.197
(0.167)
-0.077
(0.131)
-0.007
(0.176)
0.145
(0.169)
0.153
(0.193)
PGDP 0.000069***
(0.000016)
0.000076***
(0.000159)
-0.00003
(0.00024)
-0.00002
(0.027)
0.0007
(0.00006)
0.00008
(0.00007)
PECS 0.00042***
(0.00013)
0.00042***
(0.00015)
0.00094***
(0.00018)
0.00083***
(0.00023)
0.00025
(0.00002)
0.00022
(0.0002)
SREN -0.588
(2.413)
0.783
(2.893)
-2.16*
(0.236)
-1.41
(0.635)
-0.712
(0.091)
-0.365
(0.461)
ENVMP -0.0495
(0.0922)
-0.641
(0.109)
-2.566*
(0.133)
-0.273
(0.181)
-0.042
(0.197)
-0.0627
(0.225)
*, **, *** denote significance at 10, 5 and 1% respectively. Numbers in ( ) reports the SE
Overall, the above results overall suggests a weak positive relationship between economic
growth and per capita CO2 emissions (environment-growth nexus) in the TECs beyond basic
industrialisation as suggested in earlier findings by Grubb, Muller and Butler (2011). Majority
of the TECs that implemented reforms experienced resurgent economic growth without growth
in per capita emissions levels. The decline in per capita emissions associated with the initial
transition process has not symmetrically reversed over-time. The energy-environment nexus
seems to be valid only for the CIS and CEB countries. More than 50 percent of energy
consumed in these countries is derived from carbon intensive thermal sources although the
share of renewable energy is increasing among the CEB countries (Nepal and Jamasb, 2012).
Most of the countries in the CEB region are also governed by the European Directive
(2009/28/EC) of the European Commission that established a common framework for the
promotion and production of energy from renewable sources. Adhering to the Kyoto Protocol
has not delivered the anticipated benefits given its insignificant impact in reducing per capita
emissions in the TECs. Elsewhere, pollution intensive countries like the US also did not ratify
the Protocol stating that the Protocol did not include the “meaningful” participation of all
18
developing as well as industrialized countries. Canada also dropped out of the Protocol in 2011.
While the Kyoto Protocol is now expired, the need for stronger international climate change
agreements involving the ECA TECs is desirable in the future in mitigating the adverse impacts
of global climate change.
Our results indicate the advances in competition policy reforms seem to be the biggest driver
of per capita emissions reductions in the ECA TECs7. Advocating externality pricing (through
measures like the Emissions Trading Scheme and tradable green certificates) seem to have
helped in reducing carbon emissions (Wilsher, 2009). Based on this result, creating robust
competition legislation and institutions can drive the future reductions in per capita emissions
while these is also a significant scope for advancing competition on policy reforms across all
country groups in the TECs. Advancing competition policy reforms are also important as some
market-based policy measures require substantial institutional capacity for effective
implementation (EBRD, 2008). For example, tradable green certificates are an attractive
market‑friendly instrument, but they also require substantial institutional capacity and long
development periods to deliver the anticipated environmental benefits. Good governance is an
element of institutional capacity required to sustain the market-based reforms. Strengthening
reforms in corporate governance and enterprise restructuring in the economy through sound
accounting principles, corruption control and enterprise level transparency will also help
achieve reductions in per capita emission in the TECs.
Our results showed only limited impact of trade openness (coupled with price and foreign
exchange liberalisation) in reducing per capita emissions levels. Economic openness is
expected to contribute to sustainable development significantly as it facilitates better transfer
of clean technology and knowledge skills that are required to improve the industrialisation
process (Hansen, 1990). However, economic openness may not necessarily result in sustainable
development if only the 'weak conditions' are satisfied which entails accumulating man-made
capital so as to substitute natural capital without adversely affecting economic production.
‘Strong conditions’ probably need to be satisfied to achieve significant sustainable
development from economic openness as environmental stocks have an essential and
irreplaceable economic role to play (Tisdell, 2001).
7 It probably did not happen in China’s case but that has yet to be fully explored. In China’s case, the reforms
might have had a positive effect but economic growth and other factors might have had a negative effect on CO2
emissions outweighing the pollution-reducing effects of the market reforms.
19
In many transition economies, market reforms done were sufficient to reduce CO2 emissions
per capita but as these reforms became more pronounced, their marginal impact is less, they
tapered-off. Therefore, after the passage of some time further reductions in CO2 per capital
would become more dependent on policies specifically targeted at reducing CO2 emissions.
That is after a time, further reductions in CO2 emissions would depend on interventions, e.g.
tradable permits, taxes on emissions, subsidies for reducing emission, for instance, for some
forms of renewable energy. The marginal effect of pure market reforms on CO2 emissions is
probably declining. Further significant reductions may require increased targeting.
The insignificance of economic reforms on per capita emissions also portray that reform
implementation may not always be translated into reform performance or outcome unless
implemented properly. This implies that the effect of economic reforms on environmental
performance is non-linear and complex. In many transition countries, reforms may have only
advanced in paper but not in practice. Hence, only effective implementation of reform measures
can achieve the desired outcomes of reforms. Nonetheless, our model may not capture all the
qualitative dimensions and steps involved in the reform process considering that not all aspects
of reform outcomes are readily quantifiable in physical and monetary units. The model also
does not capture the effect of the lagged reform variables on environmental degradation, as
their effects can be distributed over-time. The relevant distributed lag can be different for
different economic reform variables.
5. Conclusions
This paper examined the impacts of market-based economic reforms on environmental
performance in the TECs since the inception of the fifth EAP in 1993. One of the core beliefs
of the EAP that the process of economic reforms and restructuring associated in the transition
were expected to eliminate the perverse incentives which contributed to vast environmental
degradation in these command-based economies. A dynamic panel data model based on the
LSDVC technique was employed to gauge the impacts of economic reforms on per capita CO2
emissions, as a measure of environmental performance, across the TECs. We also consider
other underlying factors such as energy consumption, economic growth, environmental policy
and the scale of renewable energy in the generation mix that can potentially explain the per
capita CO2 emissions patterns in the transition region.
The results from the LSDVC analysis suggest that the objectives of the fifth EAP have been

20
partially met after more than two decades of market-based economic reforms in the transition
countries. Reforms in competition policy and governance seem to have contributed to
significant decline in per capita emissions levels in these countries. Hence, these exists scope
to advance these reforms and achieve further reductions in per capita CO2 emissions levels.
This is because the transition countries still remain much more carbon intensive on average
than either advanced economies or emerging market economies like China. Moreover, the
carbon performance of the leading countries in the region such as Hungary, Latvia and
Lithuania demonstrates that a strong carbon performance is feasible with adequate reforms and
good policies.
The Kyoto Protocol produced no direct effect in reducing emissions levels in the TECs
although other market-based arrangements such as emissions trading scheme and tradable
green certificates seem to reduce CO2 emissions. Our results also suggest that further
investments in renewable generation capacities are needed in the TECs to produce any
significant carbon reduction impacts. Likewise, reducing energy consumption by promoting
energy efficiency is desirable to curb the per capita emissions. These measures are necessary
as the carbon performance of the EBRD region as a whole remains mixed indicating that the
polluting legacy of central planning is still pervasive.
Hence, the main conclusions from this study is that at least for several years after beginning
their economic reforms, the main contributors to reduced CO2 emissions per capita in the ECA
TECs were their economic (market) reforms. The Kyoto Protocol did not come into effect until
2005. So for most of the period considered, Kyoto Protocol was not a factor influencing CO2
emissions. It seems likely that it was not specific policies to reduce CO2 emissions but the
increased economic efficiencies resulting from the market reforms that were the most important
factor in reducing CO2 emissions per capita in ECATECs. In fact, after Kyoto came into
operation we observe no major decline in CO2 emissions per head. There is, however, some
slight decline in these emissions by SEE probably due to the European recession.
Future research may focus on the interaction of the market-based reforms and their effect on
per capita CO2 emissions. Adequate attention also needs to be paid to the importance of time
lags in the adjustment of economic systems to various market-based reforms. Alternative
measures of environmental degradation also needs be considered in the future analysis
depending on the availability of data.
21
References:
Aichele, R. and Felbermayr, G.J. (2011). Kyoto and Carbon Leakage: An Empirical Analysis
of the Carbon Content of Bilateral Trade, CESifo Working Paper Series 3661,
Munich.
Arellano, M., and S. Bond (1991). Some Tests of Specification for Panel Data: Monte Carlo
Evidence and an Application to Employment Equations, Review of Economic Studies,
Vol. 58, pp. 277-297.
Blundell, R. and Bond, S. (1998). Initial Conditions and Moment Restrictions in Dynamic
Panel Data Models, Journal of Econometrics, Vol. 87, pp. 115-143.
Bruno, G.S.F. (2005). Estimation and Inference in Dynamic Unbalanced Panel data Models
with a Small Number of Individuals, The Stata Journal, Vol. 5(4), pp. 473-500.
Bun, J.G. and Kiviet, J.F. (2003). On the Diminishing Returns of Higher Order Terms in
Asymptotic Expansions of Bias. Economics Letters, Vol. 79, 145-152.
Cole, M.A., Elliott, R. and Fredriksson, P.G. (2006). Endogenous Pollution Havens: Does FDI
Influence Environmental Regulations? Scandinavian Journal of Economics, Vol.
108(1), pp. 157-178.
Copeland, B.R. and Taylor, M.S. (2004). Trade, Growth and Environment, Journal of
Economic Literature, Vol. 42(1), pp. 7-71.
Copeland, B.R. and Taylor, M.S. (2005). Free Trade and Global Warming: A Trade theory
View of Kyoto Protocol, Journal of Environmental Economics and Management, Vol.
49 (2), pp. 205-234.
Dean, J. (2002). Does Trade Liberalisation Harm the Environment? A New Test, Canadian
Journal of Economics, Vol. 35 (4), pp. 819-842.
Dinda, S. (2004). Environmental Kuznets Curve Hypothesis: A Survey, Ecological Economics,
Vol. 49, pp. 431-455.
Damania, R., Fredriksson, P.G. and List, J. (2003). Trade Liberalization, Corruption and
Environmental Policy Formation: Theory and Evidence, Journal of Environmental
Economics and Management, Vol. 46 (3), pp. 490-512.
Damania, R., Fredriksson, P.G. and Mani, M. (2004). The Persistence of Corruption and
Regulatory Compliance Failures: Theory and Evidence, Public Choice, Vol. 121 (3-
4), pp. 363-390.
EBRD (2008). Securing Sustainable Energy in Transition Economies, European Bank for
Reconstruction and Development, London.
22
EBRD (2011). Special Report on Climate Change: The Low Carbon Transition, European
Bank for Reconstruction and Development, London.
EBRD (2014). Transition Indicators Methodology, European Bank for Reconstruction and
Development, Available at:
http://www.ebrd.com/cs/Satellite?c=Content&cid=1395237866249&d=&pagename
=EBRD%2FContent%2FContentLayout
Frankel, J.A. and Rose, A.K. (2005). Is Trade Good or Bad for the Environment? Sorting Out
the Causality, Review of Economics and Statistics, Vol. 87(1), pp. 85-91.
Fredriksson, P.G. and Wollscheid, J.R. (2014). Environmental Decentralization and Political
Centralization, Ecological Economics, Vol. 107 (11), pp. 402-410.
Grossman, G.M. and Krueger, A.B. (1991). Environmental Impacts of a North American free
Trade Agreement, NBER Working Paper No. 3914, National Bureau of Economic
Research, Cambridge, MA.
Grossman, G.M. and Krueger, A.B. (1995). Economic Growth and the Environment, Quarterly
Journal of Economics, Vol. 110 (2), pp. 353-377.
Grubb, M., Muller, B. and Butler, L. (2011). The Relationship between Carbon Dioxide
Emissions and Economic Growth, Oxbridge Study on CO2-GDP Relationships, Phase
1 Results.
Garmann, S. (2014). Do government Ideology and Fragmentation Matter for Reducing CO2
Emissions? Empirical Evidence from OECD Countries, Ecological Economics, Vol.
105 (09), pp. 1-10.
Grunewald, N. and Martinez-Zarzoso, I. (2009). Driving Factors of Carbon Dioxide Emissions
and the Impact from Kyoto Protocol, CESifo Working Paper Series 2758, Munich.
Hilton, F.G. and Levinson, A. (1998). Factoring the Environmental Kuznets Curve: Evidence
from Automotive Lead Emissions, Journal of Environmental Economics and
Management, Vol. 35, pp. 126-141.
Halkos, G.E. and Tzeremes, N.G. (2013). Carbon Dioxide Emissions and Governance: A
Nonparametric Analysis for the G-20, Energy Economics, Vol. 40 (November), pp.
110-118.
Hansen, S. (1990). Macroeconomic Policies and Sustainable Development in the third World,
Journal of International Development, Vol. 2, pp. 533-557.
Harbaugh, W; Levinson, A. and Wilson, D. (2000). Re-examining the Empirical Evidence for
an Environmental Kuznets Curve, NBER Working Paper No. 7711.
23
Hughes, G. and Lovei, M. (1999). Economic Reform and Environmental Performance in
Transition Economies, World Bank Technical Paper No. 446, The World Bank,
Washington D.C.
IPCC (2014). Climate Change 2014: Synthesis Report, Intergovernmental Panel on Climate
Change, Geneva, Switzerland.
Iwata, H. and Okada, K. (2014). Greenhouse Gas Emissions and the Role of the Kyoto
Protocol, Environmental Economics and Policy Studies, Vol. 16 (4), pp. 325-342.
Jalil, S.A. and Habibullah, M.S. (2013). Impact of Kyoto Protocol and Institutional Factors on
Carbon Dioxide Emissions in Asia -Pacific Region, Journal of Emerging Economies
and Islamic Research, Vol. 1 (2), pp. 1-23.
Kiviet, J.F. (1995). On Bias, Inconsistency and Efficiency of Various Estimators in Dynamic
Panel Data Models, Journal of Econometrics, Vol. 68, 53-78.
Lopez, R. and Mitra, S. (2000). Corruption, Pollution and the Kuznets Environment Curve,
Journal of Environmental Economics and Management, Vol.40 (2), pp.137-150.
Nepal, R. and Jamasb, T. (2012). Reforming the Power Sector in Transition: Do Institutions
Matter?, Energy Economics, Vol. 34 (5), pp. 1675-1682.
Nepal, R; Jamasb, T. and Tisdell, C.A. (2014). Market-Related Reforms and Increased Energy
Efficiency in Transition Countries: Empirical Evidence, Applied Economics, Vol. 46
(33), pp. 4125-4136.
Pellegrini, L. and Gerlagh, R. (2005). An Empirical Contribution to the Debate on Corruption,
Democracy and Environmental Policy, Working Paper N0 2005/08, Fondazione Eni
Enrico Mattei.
Perman, R. and Stern, D.I. (2004). Evidence from Panel Unit Root and Cointegration Tests that
Environmental Kuznets Curve Does Not Exist, Australian Journal of Agricultural and
Resource Economics, Vol. 47 (3), pp. 325-347.
Roodman, D. (2009). How to do xtabond2: An Introduction to Difference and System GMM
in Stata, Stata Journal, Vol. 9(1), pp. 86-136.
Seldon, T. and Song, D. (1994). Environmental Quality and Development: Is there a Kuznets
Curve for Air Pollution Emissions, Journal of Environmental Economics and
Management, Vol. 27, pp. 147-162.
Shafik, N. (1994). Economic Development and Environmental Quality, Oxford Economic
Papers, Vol. 46, pp. 757-773.
Soderholm, P. (2001). Environmental Policy in Transition Economies: Will Pollution Charges
Work? The Journal of Environment and Development, Vol. 10 (4), pp. 365-390.
24
Stern, D. I. (2004). The Rise and Fall of the Environmental Kuznets Curve, World
Development, Vol. 32 (8), pp. 1419-1439.
Stern, D.I. (2014). The Environmental Kuznets Curve: A Primer, CCEP Working Papers 1404,
Centre for Climate Economics and Policy, Crawford School of Public Policy, The
Australian National University.
Svejnar, J. (2002). Transition Economies: Performance and Challenge, The Journal of
Economic Perspectives, Vol. 16 (I), pp. 3-28.
Tamazian, A. and Rao, B.B. (2010). Do Economic, Financial and Institutional Developments
Matter for Environmental Degradation? Evidence from Transitional Economies,
Energy Economics, Vol. 32 (1), pp. 137-145.
Tisdell, C.A. (2001). Globalisation and Sustainability: environmental Kuznets Curve and the
WTO, Ecological Economics, Vol. 39 (2), pp. 185-196.
Williamson, J. (1993). Development and the Washington Consensus, World Development, Vol.
21(8), 1239-1336.
Wilsher, D. (2009). Reducing Carbon Emissions in the Electricity Sector: a Challenge for
Competition Policy Too? An Analysis of Experience to Date and Some Suggestions
for the Future, The Competition Law Review, Vol. 6 (1), pp. 31-49.
Zugravu, N., Millock, K. and Duchene, G. (2007). The Factors Behind CO2 Emissions
Reduction in Transition Economics, Working Papers No. 2008.58, Fondazione Eni
Enrico Mattei.
25
Appendix
Central Eastern Europe and Baltic
States (CEB)
South Eastern Europe (SEE)
Commonwealth of Independent States (CIS)
Others
Croatia**, Estonia*, Hungary*, Latvia*, Lithuania, Poland*, Slovak Republic* and Slovenia*
Albania***, Bosnia and Herzegovina***, Bulgaria*, FYR Macedonia** , Serbia, Romania* and Montenegro***
Armenia, Azerbaijan, Belarus, Georgia, Kazakhstan, Kyrgyzstan, Moldova, Russia, Tajikistan, Turkmenistan, Ukraine and Uzbekistan
Mongolia
*EU members, ** EU candidates and *** Potential EU candidates
Table A1: Countries included in the study
PGDP SREN PECS PVTI GRI OMLRI CMPI
PGDP 1.0 -0.34 0.64 0.5 0.6 0.4 0.6
SREN 1.0 0.45 0.4 -0.37 0.45 -0.38
PECS 1.0 0.43 0.46 0.44 -0.47
PVTI 1.0 0.63 0.64 0.62
GRI 1.0 0.63 0.52
OMLRI 1.0 0.6
CMPI 1.0
Table A2: Correlation matrix
26
PREVIOUS WORKING PAPERS IN THE SERIES
ECONOMICS, ECOLOGY AND ENVIRONMENT
For a list of working papers 1-100 in this series, visit the following website:
http://www.uq.edu.au/economics/PDF/staff/Clem_Tisdell_WorkingPapers.pdf or see lists in papers
101 on.
101. Knowledge and Willingness to Pay for the Conservation of Wildlife Species: Experimental
Results Evaluating Australian Tropical Species, by Clem Tisdell and Clevo Wilson, May 2004.
102. Antarctic Tourists, Wildlife and the Environment: Attractions and Reactions to Antarctica, by
Clem Tisdell, May 2004.
103. Birds in an Australian Rainforest: Their Attraction for Visitors and Visitors’ Ecological
Impacts, by Clem Tisdell and Clevo Wilson, May 2004.
104. Nature-Based Tourism and the Valuation of its Environmental Resources: Economic and Other
Aspects by Clem Tisdell, May 2004.
105. Glow Worms as a Tourist Attraction in Springbrook National Park: Visitor Attitudes and
Economic Issues, by Clem Tisdell, Clevo Wilson and David Merritt, July 2004.
106. Australian Tropical Reptile Species: Ecological Status, Public Valuation and Attitudes to their
Conservation and Commercial Use, by Clem Tisdell, Clevo Wilson and Hemanath Swarna
Nantha, August 2004.
107. Information and Wildlife Valuation: Experiments and Policy, by Clem Tisdell and Clevo
Wilson, August 2004.
108. What are the Economic Prospects of Developing Aquaculture in Queensland to Supply the Low
Price White Fillet Market? Lessons from the US Channel Catfish Industry, by Thorbjorn Lyster
and Clem Tisdell, October 2004.
109. Comparative Public Support for Conserving Reptile Species is High: Australian Evidence and
its Implications, by Clem Tisdell, Clevo Wilson and Hemanath Swarna Nantha, October 2004.
110. Dependence of public support for survival of wildlife species on their likeability by Clem
Tisdell, Clevo Wilson and Hemanath Swarna Nantha, October 2004.
111. Dynamic Processes in Contingent Valuation: A Case Study Involving the Mahogany Glider by
Clem Tisdell, Clevo Wilson and Hemanath Swarna Nantha, November 2004.
112. Economics, Wildlife Tourism and Conservation: Three Case Studies by Clem Tisdell and Clevo
Wilson, November 2004.
113. What Role Does Knowledge of Wildlife Play in Providing Support for Species’ Conservation
by Clevo Wilson and Clem Tisdell, December 2004.
114. Public Support for Sustainable Commercial Harvesting of Wildlife: An Australian Case Study
by Clem Tisdell, Clevo Wilson and Hemanath Swarna Nantha, December 2004.
115. Endangerment and Likeability of Wildlife Species: How Important are they for Proposed
Payments for Conservation by Clem Tisdell, Hemanath Swarna Nantha and Clevo Wilson,
December 2004.
116. How Knowledge Affects Payment to Conserve and Endangered Bird by Clevo Wilson and
Clem Tisdell, February 2005.
117. Public Choice of Species for the Ark: Phylogenetic Similarity and Preferred Wildlife Species
for Survival by Clem Tisdell, Clevo Wilson and Hemanath Swarna Nantha, March 2005.
118. Economic Incentives for Global Conservation of Wildlife: New International Policy Directions
by Clem Tisdell, March 2005.
119. Resource Entitlements of Indigenous Minorities, Their Poverty and Conservation of Nature:
Status of Australian Aborigines, Comparisons with India’s Tribals, Theory and Changing
Policies Globally by Clem Tisdell, March 2005.
120. Elephants and Polity in Ancient India as Exemplified by Kautilya’s Arthasastra (Science of
Polity) by Clem Tisdell, March 2005.
27
121. Sustainable Agriculture by Clem Tisdell, April 2005.
122. Dynamic Processes in the Contingent Valuation of an Endangered Mammal Species by Clem
Tisdell, Clevo Wilson and Hemanath Swarna Nantha, April 2005.
123. Knowledge about a Species’ Conservation Status and Funding for its Preservation: Analysis by
Clem Tisdell, June 2005.
124. Public Valuation of and Attitudes towards the Conservation and Use of the Hawksbill Turtle:
An Australian Case Study by Clem Tisdell, Hemanath Swarna Nantha and Clevo Wilson, June
2005.
125. Comparison of Funding and Demand for the Conservation of the Charismatic Koala with those
for the Critically Endangered Wombat Lasiorhinus krefftii by Clem Tisdell and Hemanath
Swarna Nantha, June 2005.
126. Management, Conservation and Farming of Saltwater Crocodiles: An Australian Case Study
of Sustainable Commercial Use by Clem Tisdell and Hemanath Swarna Nantha, August 2005.
127. Public Attitudes to the Use of Wildlife by Aboriginal Australians: Marketing of Wildlife and
its Conservation by Clem Tisdell and Hemanath Swarna Nantha, August 2005.
128. Linking Policies for Biodiversity Conservation with Advances in Behavioral Economics by
Clem Tisdell, August 2005.
129. Knowledge about a Species’ Conservation Status and Funding for its Preservation: Analysis by
Clem Tisdell, August 2005.
130. A Report on the Management of Saltwater Crocodiles (Crocodylus porosus) in the Northern
Territory: Results of a Survey of Pastoralists by Clem Tisdell, Clevo Wilson and Hemanath
Swarna Nantha, September 2005.
131. Crocodile Farms and Management of Saltwater Crocodiles in Northern Territory: Results of a
Survey of NT Crocodile Farmers Plus Analysis of Secondary Information by Clem Tisdell,
September 2005.
132. The Environment and the Selection of Aquaculture Species and Systems: An Economic
Analysis by Clem Tisdell, October 2005.
133. The History and Value of the Elephant in Sri Lankan Society by Ranjith Bandara and Clem
Tisdell, November 2005.
134. Economics of Controlling Livestock Diseases: Basic Theory by Clem Tisdell, November 2006.
135. Poverty, Political Failure and the Use of Open Access Resources in Developing Countries by
Clem Tisdell, November 2006.
136. Global Property Rights in Genetic Resources: An Economic Assessment by Clem Tisdell,
November 2006.
137. Notes on the Economics of Fish Biodiversity: Linkages between Aquaculture and Fisheries by
Clem Tisdell, November 2006.
138. Conservation of the Proboscis Monkey and the Orangutan in Borneo: Comparative Issues and
Economic Considerations by Clem Tisdell and Hemanath Swarna Nantha, March 2007.
139. Economic Change and Environmental Issues: Policy Reforms and Concerns in Australian
Agriculture, by Clem Tisdell, April 2007.
140. Institutional Economics and the Behaviour of Conservation Organizations: Implications for
Biodiversity Conservation by Clem Tisdell, March 2007
141. Poverty, Policy Reforms for Resource-use and Economic Efficiency: Neglected Issues by
Clem Tisdell, May 2007.
142. The State of the Environment and the Availability of Natural Resources by Clem Tisdell, May
2007.
143. Economics of Pearl Oyster Culture by Clem Tisdell and Bernard Poirine, July 2007.
144. The Economic Importance of Wildlife Conservation on the Otago Peninsula – 20 Years on by
Clem Tisdell, November, 2007.
145. Valuing the Otago Peninsula: The Economic Benefits of Conservation by Clem Tisdell,
November 2007.
146. Policy Choices about Agricultural Externalities and Sustainability: Diverse Approaches,
Options and Issues by Clem Tisdell, November, 2007.
147. Global Warming and the Future of Pacific Island Countries by Clem Tisdell, November 2007.
28
148. Complex Policy Choices about Agricultural Externalities: Efficiency, Equity and Acceptability
by Clem Tisdell, June 2008.
149. Wildlife Conservation and the Value of New Zealand’s Otago Peninsula: Economic Impacts
and Other Considerations by Clem Tisdell, June 2008.
150. Global Property Rights in Genetic Resources: Do They Involve Sound Economics? Will They
Conserve Nature and Biodiversity? By Clem Tisdell, August 2008.
151. Supply-side Policies to Conserve Biodiversity and Save the Orangutan from Oil Palm
Expansion: An Economic Assessment. By Clem Tisdell and Hemanath Swarna Nantha,
September, 2008.
152. The Orangutan-Oil Palm Conflict: Economic Constraints and Opportunities for Conservation
by Hemanath Swarna Nantha and Clem Tisdell, October 2008.
153. Economics, Ecology and the Development and Use of GMOs: General Considerations and
Biosafety Issues by Clem Tisdell, October 2008.
154. Agricultural Sustainability and the Introduction of Genetically Modified Organisms (GMOs)
by Clem Tisdell, February, 2009.
155. Notes on Biodiversity Conservation, The Rate of Interest and Discounting by Clem Tisdell,
April, 2009.
156. Is Posner’s Principle of Justice an Adequate Basis for Environmental Law? by Clem Tisdell,
June 2009.
157. The Sustainability of Cotton Production in China and Australia: Comparative Economic and
Environmental Issues By Xufu Zhao and Clem Tisdell, June 2009.
158. The Precautionary Principle Revisited: Its Interpretations and their Conservation Consequences
by Clem Tisdell, September, 2009.
159. The Production of Biofuels: Welfare and Environmental Consequence for Asia by Clem
Tisdell, September, 2009.
160. Environmental Governance, Globalisation and Economic Performance by Clem Tisdell,
November 2009.
161. Managing Forests for Sustainable Economic Development: Optimal Use and Conservation of
Forests by Clem Tisdell, February 2010.
162. Comparative Costs and Conservation Policies for the Survival of the Orangutan and Other
Species: Includes an Example by Clem Tisdell and Hemanath Swarna Nantha, May 2010.
163. Notes on the Economics of Control of Wildlife Pests by Clem Tisdell, May 2010
164. Are tourists rational? Destination decisions and other results from a survey of visitors to a North
Queensland natural site – Jourama Falls by Clem Tisdell, June 2010.
165. Conservation Value by Clem Tisdell, June 2010.
166. The Influence of Public Attitudes on Policies for Conserving Reptiles by Clem Tisdell, July
2010.
167. Core Issues in the Economics of Biodiversity Conservation by Clem Tisdell, July 2010.
168. The Survival of a Forest-Dependent Species and the Economics of Intensity of Logging: A Note
by Clem Tisdell, August 2010.
169. A Case Study of an NGOs Ecotourism Efforts: Findings Based on a Survey of Visitors to its
Tropical Nature Reserve by Clem Tisdell, August, 2010.
170. Sharing Nature’s Wealth through Wildlife Tourism: Its Economic, Sustainability and
Conservation Benefits by Clem Tisdell, August, 2010
171. Economic Growth and Transition in Vietnam and China and its Consequences for their
Agricultural Sectors: Policy and Agricultural Adjustment Issues by Clem Tisdell, September,
2010.
172. World Heritage Listing of Australian Natural Sites: Effects on Tourism, Economic Value and
Conservation by Clem Tisdell, October, 2010.
173. Antarctic tourism: Environmental concerns and the importance of Antarctica’s natural
attractions for tourists by Clem Tisdell, October 2010.
174. Sustainable Development and Intergenerational Equity: Issues Relevant to India and Globally
by Clem Tisdell, November 2010
175. Selective Logging and the Economics of Conserving Forest Wildlife Species e.g. Orangutans
by Clem Tisdell, September 2011.
29
176. Economics, Ecology and GMOs: Sustainability, Precaution and Related Issues by Clem Tisdell,
September 2011.
177. Economics of Controlling Vertebrate Wildlife: The Pest-Asset Dichotomy and Environmental
Conflict by Clem Tisdell. September 2011
178. Ecotourism Experiences Promoting Conservation and Changing Economic Values: The Case
of Mon Repos Turtles by Clem Tisdell, June 2012.
179. Sustainable Development Planning: Allowing for Future Generations, Time and Uncertainty by
Clem Tisdell, June 2012.
180. Biodiversity Change and Sustainable Development: New Perspectives by Clem Tisdell, June
2012.
181. Economic Benefits, Conservation and Wildlife Tourism by Clem Tisdell, June 2012.
182. Conserving Forest Wildlife and other Ecosystem Services: Opportunity Costs and the Valuation
of Alternative Logging Regimes by Clem Tisdell, June 2012.
183. Sustainable Agriculture – An Update by Clem Tisdell, December, 2012.
184. Ecosystem Services: A Re-examination of Some Procedures for Determining their Economic
Value by Clem Tisdell, December 2012.
185. Biodiversity Conservation: Concepts and Economic Issues with Chinese Examples by Clem
Tisdell, December 2012.
186. The Nature of Ecological and Environmental Economics and its Growing Importance by Clem
Tisdell, December 2012.
187. Sustaining Economic Development and the Value of Economic Production: Different Views
and Difficult Problems by Clem Tisdell, December 2012
188. Climate Change – Predictions, Economic Consequences, and the Relevance of Environmental
Kuznets Curves by Clem Tisdell, December 2012.
189. Managing Ecosystem Services for Human Benefit: Economic and Environmental Policy
Challenges by Clem Tisdell and Dayuan Xue, April 2013.
190. Nature-based Tourism in Developing Countries: Issues and Case Studies by Clem Tisdell. May
2013
191. Three Questionnaires Used in Evaluating the Economics of Conserving Australia’s Tropical
Wildlife Species and the Procedures Adopted by Clem Tisdell and Clevo Wilson, January 2014.
192. The Neolithic Revolution and Human Societies: Diverse Origins and Development Paths by
Serge Svizzero and Clem Tisdell. April 2014.
193. Genetic Erosion in Traditional Food Crops in the Pacific Islands: Background, Socioeconomic
Causes and Policy Issues by Clem Tisdell, April 2014.
194. The Opportunity Cost of Engaging in Reduced-Impact Logging to Conserve the Orangutan: A
Case Study of the Management of Deramakot Forest Reserve, Sabah, Malaysia by Hemanath
Swarna Nantha, April 2014.
195. The Financial and Political Opportunity Costs of Orangutan Conservation in the Face of Oil-
Palm Expansion by Hemanath Swarna Nantha, April 2014.
196. ‘Genetic Erosion in Traditional food Crops in the Pacific Islands: Background, Socioeconomic
Causes and Policy Issues’ – WP193 Amended by Clem Tisdell, July 2014.
197. Hunter-Gatherer Societies: Their Diversity and Evolutionary Processes by Serge Svizzero and
Clem Tisdell, August 2014.
198. Agricultural Development and Sustainability: A Review of Recent and Earlier Perspectives by
Clem Tisdell, January, 2015.
199. Marine Ecosystems and Climate Change: Economic Issues by Clem Tisdell, August 2015.
200. Parochial Conservation Practices and the Decline of the Koala by Clem Tisdell, Harriet Preece,
Sabah Abdullah and Hawthorne Beyer, October 2015.
201. The Economic Development and the Rise and Fall of Únĕtice Populations: A Case of
Ecologically Unsustainable Economic Growth? Initial Thoughts by Clem Tisdell and Serge
Svizzero, October 2016
202. Input Shortages and the Lack of Sustainability of Bronze Production by the Únĕtice by Serge
Svizzero and Clem Tisdell, November 2016