Embed Size (px)
Citation preview
East Asian Currency UnionEast Asian Currency Union
October 2006October 2006
JongJong--Wha LeeWha LeeKorea UniversityKorea University
andandRobert J. BarroRobert J. Barro
Harvard UniversityHarvard University
Motivation Motivation Are Current Exchange Rate Arrangements Are Current Exchange Rate Arrangements
in East Asia Appropriate?in East Asia Appropriate?
Before the crisis, most East Asian economies Before the crisis, most East Asian economies adopted adopted de factode facto U.S. dollar peg systems.U.S. dollar peg systems.After the financial crisis, most of the crisisAfter the financial crisis, most of the crisis--affected affected East Asian economies switched to floating East Asian economies switched to floating exchangeexchange--rate regimes. rate regimes. But, they tend to intervene heavily in the foreign But, they tend to intervene heavily in the foreign exchange market.exchange market.
―― ‘‘fear of floatingfear of floating’’ ((CalvoCalvo and Reinhart, 2002), and Reinhart, 2002), ―― ‘‘exportexport--led growth strategyled growth strategy’’ (Dooley et al., 2003)(Dooley et al., 2003)
The instability of US dollar and the need for intraThe instability of US dollar and the need for intra--region exchange rate stability ask for a new viable region exchange rate stability ask for a new viable regime.regime.
Motivation (Continued)Motivation (Continued)Can a Currency Union be a Choice for Can a Currency Union be a Choice for
East Asia?East Asia?
McKinnon and McKinnon and MundellMundell have proposed a have proposed a currency union with the US dollar as the common currency union with the US dollar as the common currency. currency. Others suggest East Asia can emulate the Others suggest East Asia can emulate the European experience of monetary integration, European experience of monetary integration, leading eventually to the formation of an East leading eventually to the formation of an East AsiaAsia--wide Monetary Union with a new currency.wide Monetary Union with a new currency.There has been a trend toward evolution of There has been a trend toward evolution of currency unions in the world due to: currency unions in the world due to: (i) trade and financial globalization, and (i) trade and financial globalization, and (ii) emphasis by monetary authorities of price (ii) emphasis by monetary authorities of price stability over macroeconomic stabilization. stability over macroeconomic stabilization. ((AlesinaAlesina, Barro and , Barro and TenreyroTenreyro (2002))(2002))
Purpose of the Paper (I)Purpose of the Paper (I)
Assess the feasibility of a common currency Assess the feasibility of a common currency arrangement in East Asia, particularly arrangement in East Asia, particularly compared to the euro areacompared to the euro area–– We investigate whether East Asia meets the We investigate whether East Asia meets the
traditional OCA criteria: trade integration, the traditional OCA criteria: trade integration, the symmetry of output and price shocks across symmetry of output and price shocks across countries, and commitment to price stability.countries, and commitment to price stability.
–– We will also discuss financial integration and We will also discuss financial integration and political proximity among the East Asian political proximity among the East Asian countries, particularly compared to those of countries, particularly compared to those of European countries. European countries.
Purpose of the Paper (II)Purpose of the Paper (II)
Estimate the welfare effects of joining a Estimate the welfare effects of joining a currency union for individual East Asian currency union for individual East Asian economies.economies.–– We calculate welfare effects of various types of We calculate welfare effects of various types of
currency unions, such as a dollar bloc, Euro bloc, currency unions, such as a dollar bloc, Euro bloc, Yen bloc, and a new regional currency bloc, for Yen bloc, and a new regional currency bloc, for individual East Asian economies. individual East Asian economies.
–– We compare potential benefits from increasing We compare potential benefits from increasing trade with potential costs from the loss of trade with potential costs from the loss of monetary policy independence.monetary policy independence.
–– We present estimation results from calibrations of We present estimation results from calibrations of a representative consumer model. a representative consumer model.
Benefits and Costs of Currency UnionsBenefits and Costs of Currency Unions
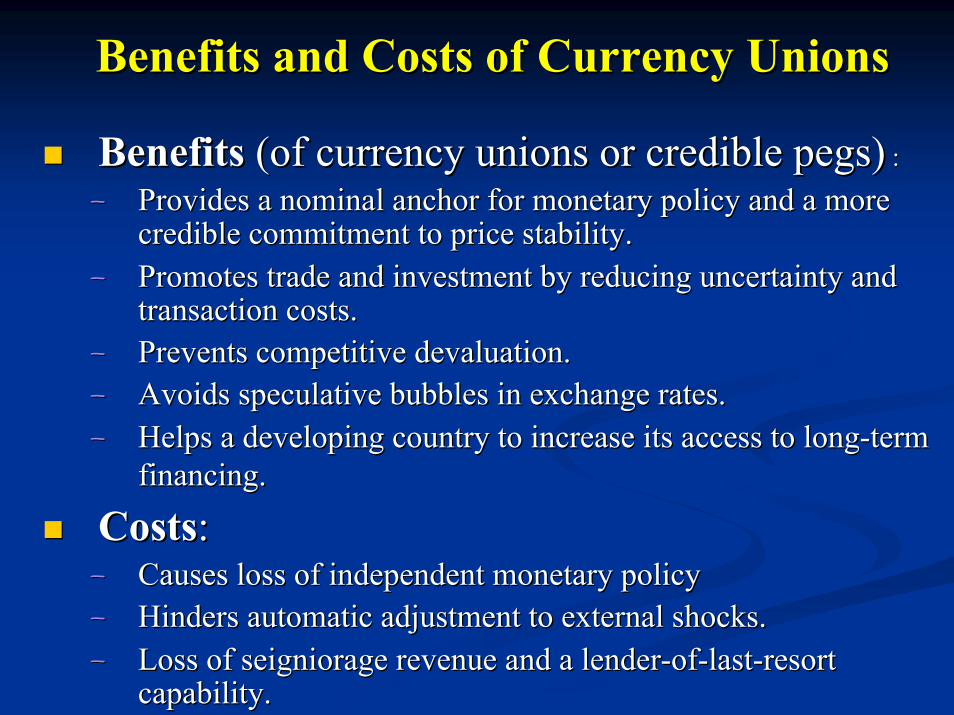
Benefits Benefits (of currency unions or credible pegs)(of currency unions or credible pegs) ::
–– Provides a nominal anchor for monetary policy and a more Provides a nominal anchor for monetary policy and a more credible commitment to price stability.credible commitment to price stability.
–– Promotes trade and investment by reducing uncertainty and Promotes trade and investment by reducing uncertainty and transaction costs.transaction costs.
–– Prevents competitive devaluation. Prevents competitive devaluation. –– Avoids speculative bubbles in exchange rates. Avoids speculative bubbles in exchange rates. –– Helps a developing country to increase its access to longHelps a developing country to increase its access to long--term term
financing.financing.
CostsCosts::–– Causes loss of independent monetary policyCauses loss of independent monetary policy–– Hinders automatic adjustment to external shocks. Hinders automatic adjustment to external shocks. –– Loss of seigniorage revenue and a lenderLoss of seigniorage revenue and a lender--ofof--lastlast--resort resort
capability.capability.
Optimum Currency Area (OCA) Optimum Currency Area (OCA) CriteriaCriteria
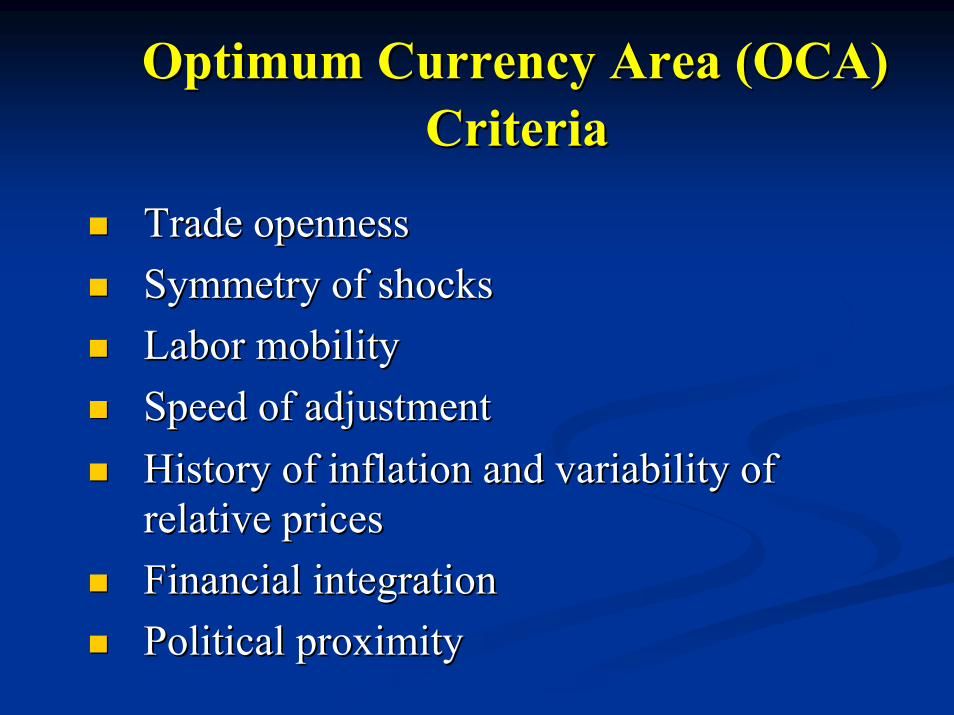
Trade opennessTrade opennessSymmetry of shocksSymmetry of shocksLabor mobilityLabor mobilitySpeed of adjustmentSpeed of adjustmentHistory of inflation and variability of History of inflation and variability of relative pricesrelative pricesFinancial integrationFinancial integrationPolitical proximityPolitical proximity
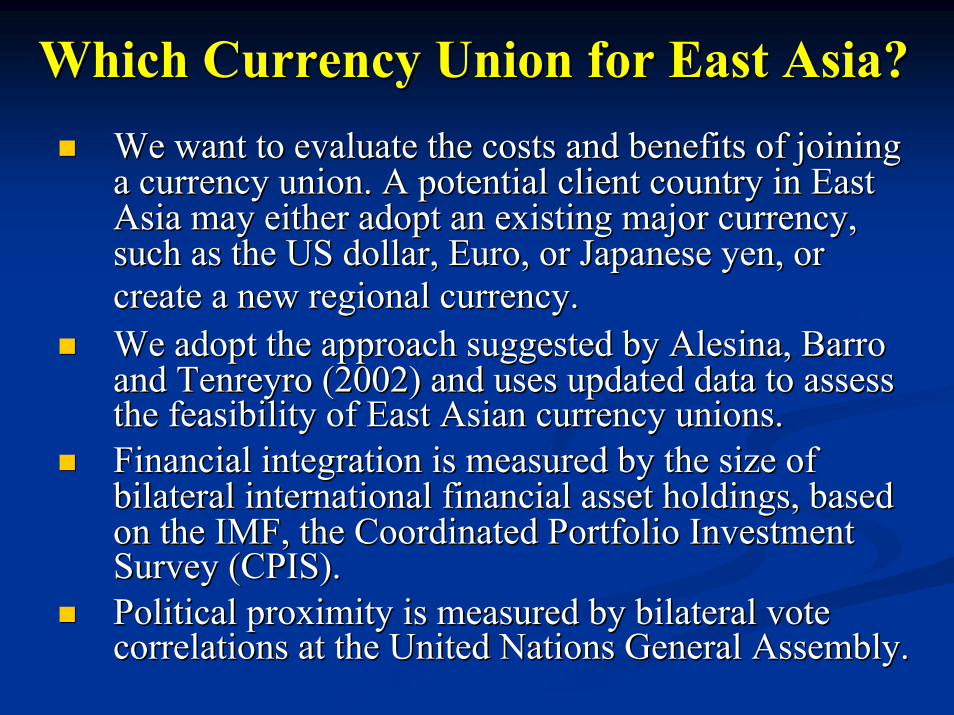
Which Currency Union for East Asia?Which Currency Union for East Asia?We want to evaluate the costs and benefits of joining We want to evaluate the costs and benefits of joining a currency union. A potential client country in East a currency union. A potential client country in East Asia may either adopt an existing major currency, Asia may either adopt an existing major currency, such as the US dollar, Euro, or Japanese yen, or such as the US dollar, Euro, or Japanese yen, or create a new regional currency.create a new regional currency.We adopt the approach suggested by We adopt the approach suggested by AlesinaAlesina, Barro , Barro and and TenreyroTenreyro (2002) and uses updated data to assess (2002) and uses updated data to assess the feasibility of East Asian currency unions.the feasibility of East Asian currency unions.Financial integration is measured by the size of Financial integration is measured by the size of bilateral international financial asset holdings, based bilateral international financial asset holdings, based on the IMF, the Coordinated Portfolio Investment on the IMF, the Coordinated Portfolio Investment Survey (CPIS). Survey (CPIS). Political proximity is measured by bilateral vote Political proximity is measured by bilateral vote correlations at the United Nations General Assembly. correlations at the United Nations General Assembly.
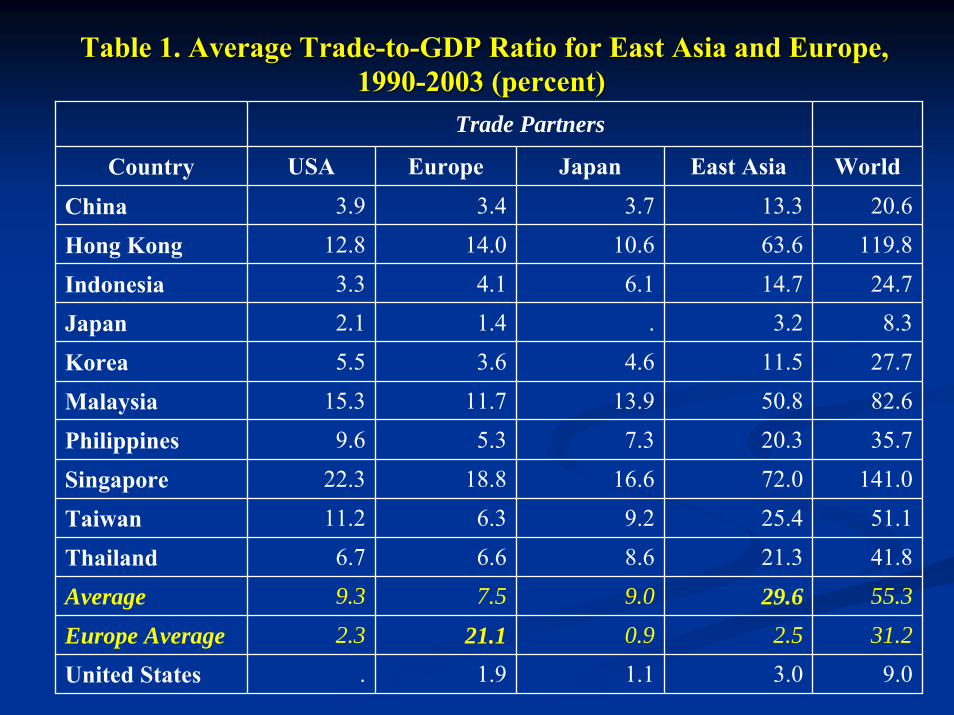
Table Table 1. Average Trade1. Average Trade--toto--GDP Ratio for East Asia and Europe, GDP Ratio for East Asia and Europe, 19901990--2003 (percent)2003 (percent)
Trade Partners
Country USA Europe Japan East Asia World
China 3.9 3.4 3.7 13.3 20.6
Hong Kong 12.8 14.0 10.6 63.6 119.8
Indonesia 3.3 4.1 6.1 14.7 24.7
Japan 2.1 1.4 . 3.2 8.3
Korea 5.5 3.6 4.6 11.5 27.7
Malaysia 15.3 11.7 13.9 50.8 82.6
Philippines 9.6 5.3 7.3 20.3 35.7
Singapore 22.3 18.8 16.6 72.0 141.0
Taiwan 11.2 6.3 9.2 25.4 51.1
Thailand 6.7 6.6 8.6 21.3 41.8
Average 9.3 7.5 9.0 29.6 55.3
Europe Average 2.3 21.1 0.9 2.5 31.2
United States . 1.9 1.1 3.0 9.0
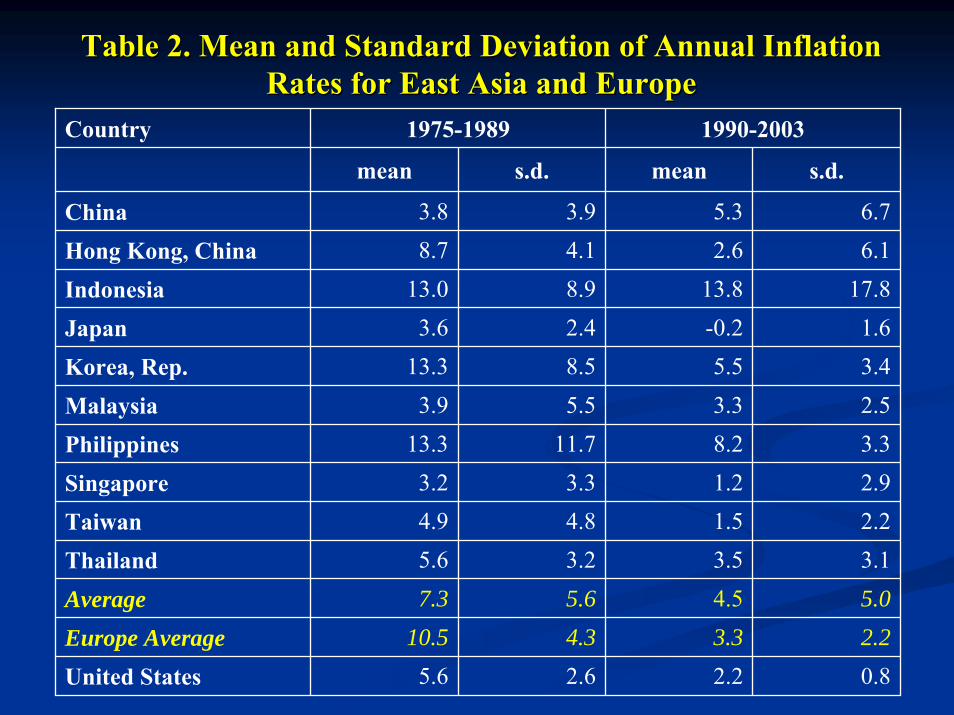
Table 2. Mean and Standard Deviation of Annual Inflation Table 2. Mean and Standard Deviation of Annual Inflation Rates for East Asia and EuropeRates for East Asia and Europe
Country 1975-1989 1990-2003
mean s.d. mean s.d.
China 3.8 3.9 5.3 6.7
Hong Kong, China 8.7 4.1 2.6 6.1
Indonesia 13.0 8.9 13.8 17.8
Japan 3.6 2.4 -0.2 1.6
Korea, Rep. 13.3 8.5 5.5 3.4
Malaysia 3.9 5.5 3.3 2.5
Philippines 13.3 11.7 8.2 3.3
Singapore 3.2 3.3 1.2 2.9 Taiwan 4.9 4.8 1.5 2.2
Thailand 5.6 3.2 3.5 3.1
Average 7.3 5.6 4.5 5.0
Europe Average 10.5 4.3 3.3 2.2
United States 5.6 2.6 2.2 0.8
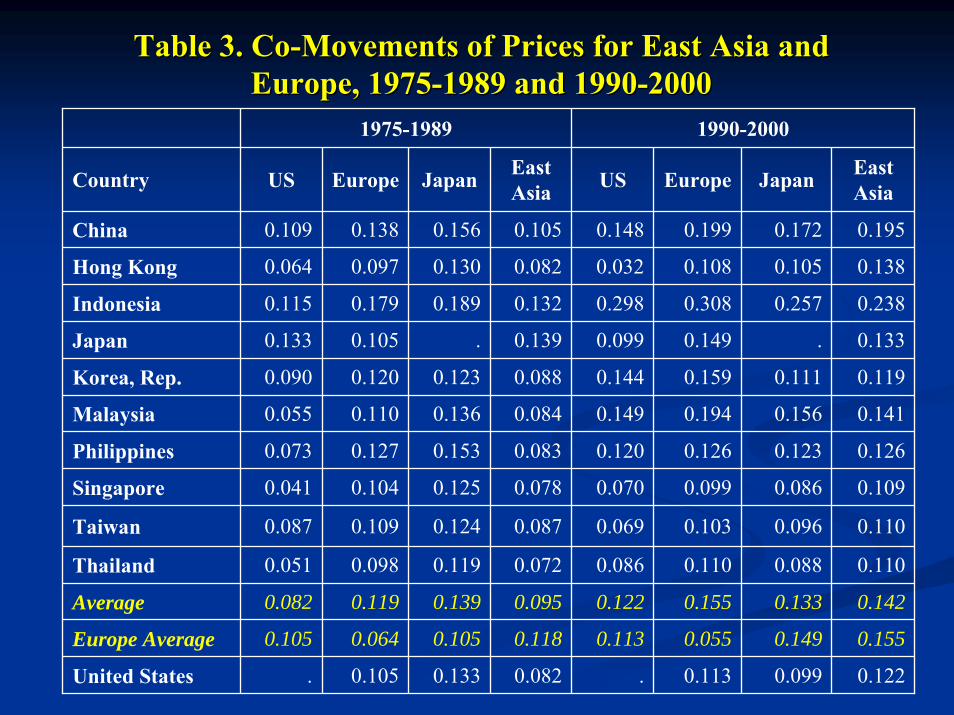
Table 3. CoTable 3. Co--Movements of Prices for East Asia and Movements of Prices for East Asia and Europe, 1975Europe, 1975--1989 and 19901989 and 1990--20002000
1975-1989 1990-2000
Country US Europe Japan East Asia US Europe Japan East
Asia
China 0.109 0.138 0.156 0.105 0.148 0.199 0.172 0.195
Hong Kong 0.064 0.097 0.130 0.082 0.032 0.108 0.105 0.138
Indonesia 0.115 0.179 0.189 0.132 0.298 0.308 0.257 0.238
Japan 0.133 0.105 . 0.139 0.099 0.149 . 0.133
Korea, Rep. 0.090 0.120 0.123 0.088 0.144 0.159 0.111 0.119
Malaysia 0.055 0.110 0.136 0.084 0.149 0.194 0.156 0.141
Philippines 0.073 0.127 0.153 0.083 0.120 0.126 0.123 0.126
Singapore 0.041 0.104 0.125 0.078 0.070 0.099 0.086 0.109
Taiwan 0.087 0.109 0.124 0.087 0.069 0.103 0.096 0.110
Thailand 0.051 0.098 0.119 0.072 0.086 0.110 0.088 0.110
Average 0.082 0.119 0.139 0.095 0.122 0.155 0.133 0.142
Europe Average 0.105 0.064 0.105 0.118 0.113 0.055 0.149 0.155
United States . 0.105 0.133 0.082 . 0.113 0.099 0.122
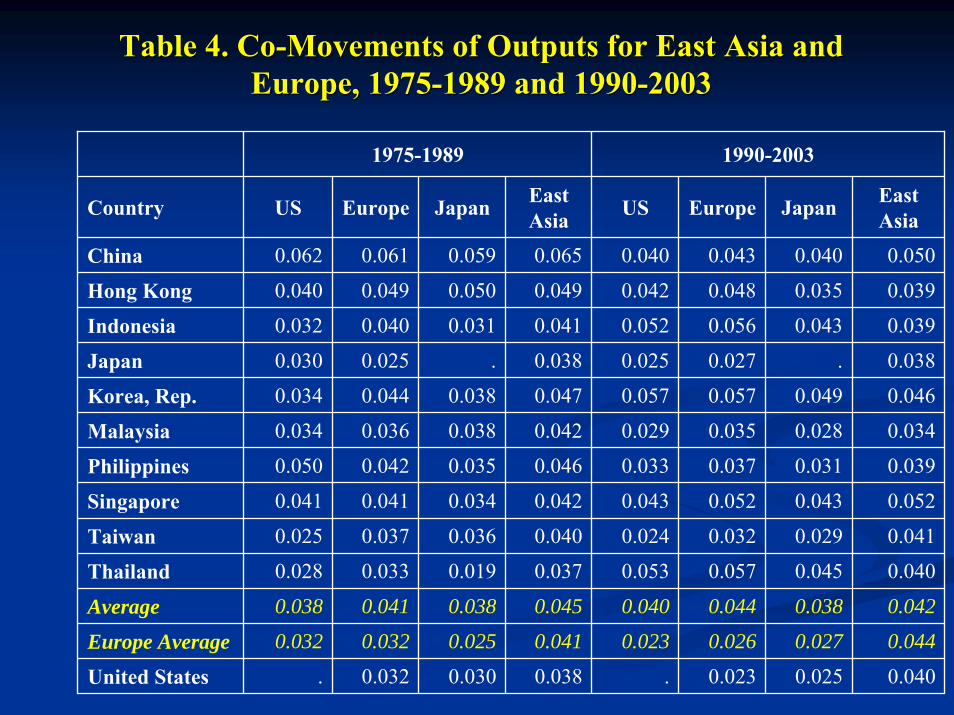
Table 4. CoTable 4. Co--Movements of Outputs for East Asia and Movements of Outputs for East Asia and Europe, 1975Europe, 1975--1989 and 19901989 and 1990--20032003
1975-1989 1990-2003
Country US Europe Japan East Asia US Europe Japan East
Asia
China 0.062 0.061 0.059 0.065 0.040 0.043 0.040 0.050
Hong Kong 0.040 0.049 0.050 0.049 0.042 0.048 0.035 0.039
Indonesia 0.032 0.040 0.031 0.041 0.052 0.056 0.043 0.039
Japan 0.030 0.025 . 0.038 0.025 0.027 . 0.038
Korea, Rep. 0.034 0.044 0.038 0.047 0.057 0.057 0.049 0.046
Malaysia 0.034 0.036 0.038 0.042 0.029 0.035 0.028 0.034
Philippines 0.050 0.042 0.035 0.046 0.033 0.037 0.031 0.039
Singapore 0.041 0.041 0.034 0.042 0.043 0.052 0.043 0.052
Taiwan 0.025 0.037 0.036 0.040 0.024 0.032 0.029 0.041
Thailand 0.028 0.033 0.019 0.037 0.053 0.057 0.045 0.040
Average 0.038 0.041 0.038 0.045 0.040 0.044 0.038 0.042
Europe Average 0.032 0.032 0.025 0.041 0.023 0.026 0.027 0.044
United States . 0.032 0.030 0.038 . 0.023 0.025 0.040
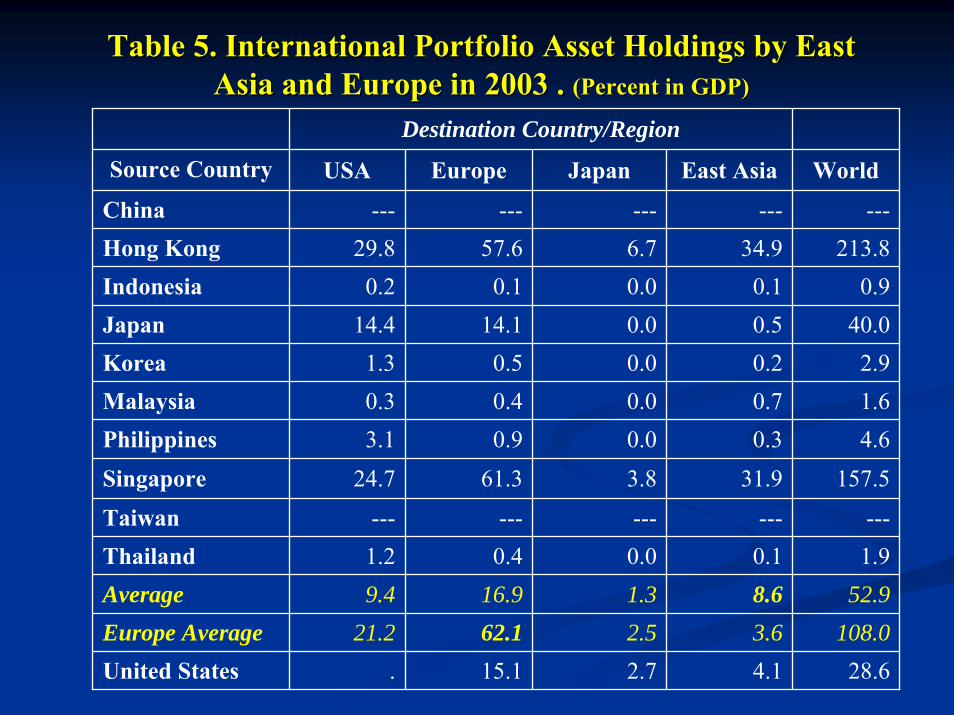
Table 5. International Portfolio Asset Holdings by East Table 5. International Portfolio Asset Holdings by East Asia and Europe in 2003 . Asia and Europe in 2003 . (Percent in GDP)(Percent in GDP)
Destination Country/Region
Source Country USA Europe Japan East Asia World
China --- --- --- --- ---Hong Kong 29.8 57.6 6.7 34.9 213.8 Indonesia 0.2 0.1 0.0 0.1 0.9 Japan 14.4 14.1 0.0 0.5 40.0 Korea 1.3 0.5 0.0 0.2 2.9 Malaysia 0.3 0.4 0.0 0.7 1.6 Philippines 3.1 0.9 0.0 0.3 4.6 Singapore 24.7 61.3 3.8 31.9 157.5
Taiwan --- --- --- --- ---Thailand 1.2 0.4 0.0 0.1 1.9 Average 9.4 16.9 1.3 8.6 52.9 Europe Average 21.2 62.1 2.5 3.6 108.0 United States . 15.1 2.7 4.1 28.6
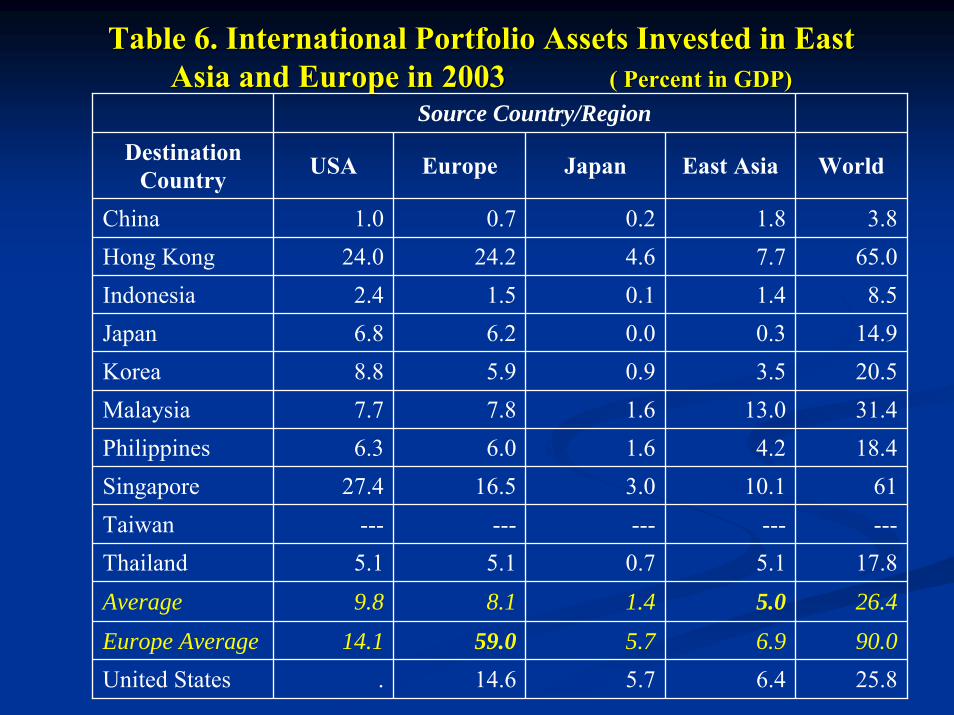
Table 6. International Portfolio Assets Invested in East Table 6. International Portfolio Assets Invested in East Asia and Europe in 2003 Asia and Europe in 2003 ( Percent in GDP)( Percent in GDP)
Source Country/Region Destination
Country USA Europe Japan East Asia World
China 1.0 0.7 0.2 1.8 3.8Hong Kong 24.0 24.2 4.6 7.7 65.0Indonesia 2.4 1.5 0.1 1.4 8.5Japan 6.8 6.2 0.0 0.3 14.9Korea 8.8 5.9 0.9 3.5 20.5Malaysia 7.7 7.8 1.6 13.0 31.4Philippines 6.3 6.0 1.6 4.2 18.4Singapore 27.4 16.5 3.0 10.1 61Taiwan --- --- --- --- ---Thailand 5.1 5.1 0.7 5.1 17.8Average 9.8 8.1 1.4 5.0 26.4
Europe Average 14.1 59.0 5.7 6.9 90.0 United States . 14.6 5.7 6.4 25.8
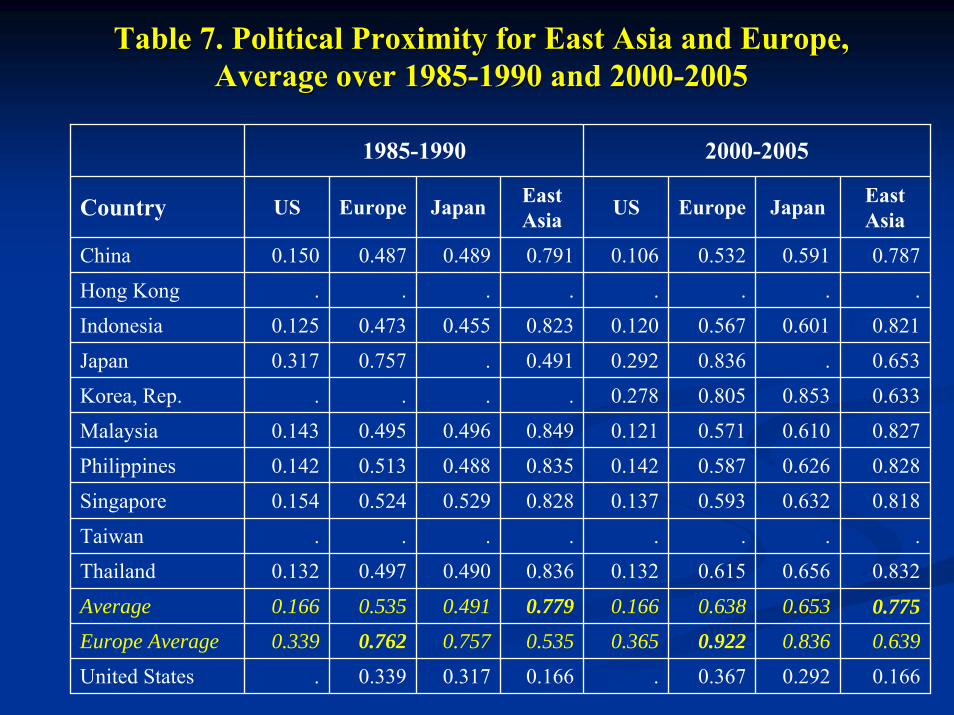
Table 7. Political Proximity for East Asia and Europe, Table 7. Political Proximity for East Asia and Europe, Average over 1985Average over 1985--1990 and 20001990 and 2000--20052005
1985-1990 2000-2005
Country US Europe Japan East Asia US Europe Japan East
Asia
China 0.150 0.487 0.489 0.791 0.106 0.532 0.591 0.787
Hong Kong . . . . . . . .
Indonesia 0.125 0.473 0.455 0.823 0.120 0.567 0.601 0.821
Japan 0.317 0.757 . 0.491 0.292 0.836 . 0.653
Korea, Rep. . . . . 0.278 0.805 0.853 0.633
Malaysia 0.143 0.495 0.496 0.849 0.121 0.571 0.610 0.827
Philippines 0.142 0.513 0.488 0.835 0.142 0.587 0.626 0.828
Singapore 0.154 0.524 0.529 0.828 0.137 0.593 0.632 0.818
Taiwan . . . . . . . .
Thailand 0.132 0.497 0.490 0.836 0.132 0.615 0.656 0.832
Average 0.166 0.535 0.491 0.779 0.166 0.638 0.653 0.775 Europe Average 0.339 0.762 0.757 0.535 0.365 0.922 0.836 0.639
United States . 0.339 0.317 0.166 . 0.367 0.292 0.166
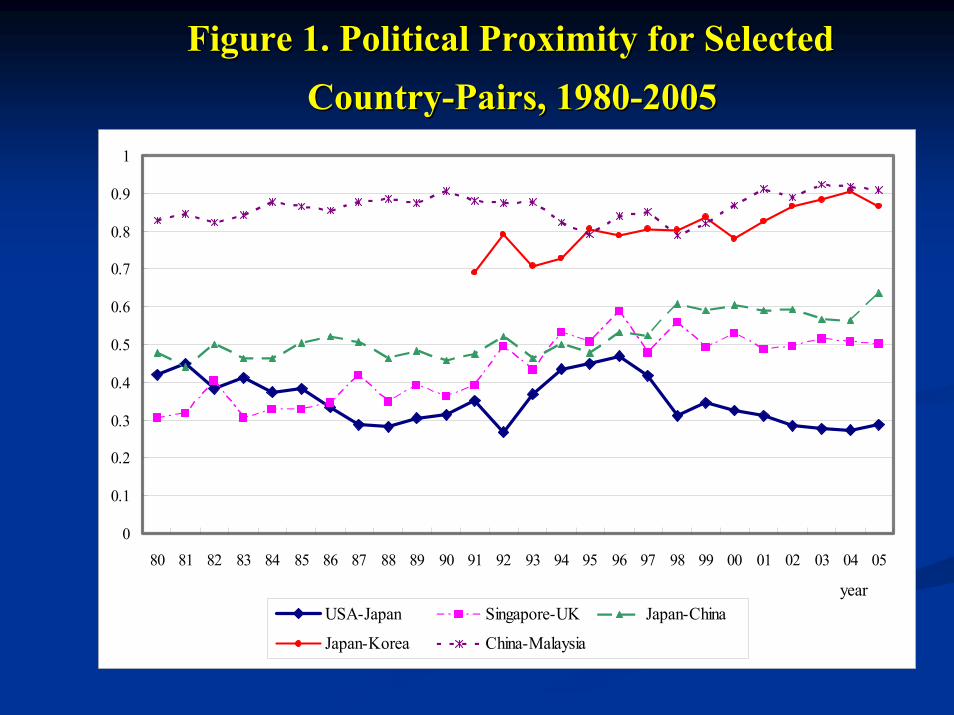
Figure 1. Political Proximity for Selected Figure 1. Political Proximity for Selected CountryCountry--Pairs, 1980Pairs, 1980--20052005
0
0.1
0.2
0.3
0.4
0.5
0.6
0.7
0.8
0.9
1
80 81 82 83 84 85 86 87 88 89 90 91 92 93 94 95 96 97 98 99 00 01 02 03 04 05
yearUSA-Japan Singapore-UK Japan-China
Japan-Korea China-Malaysia
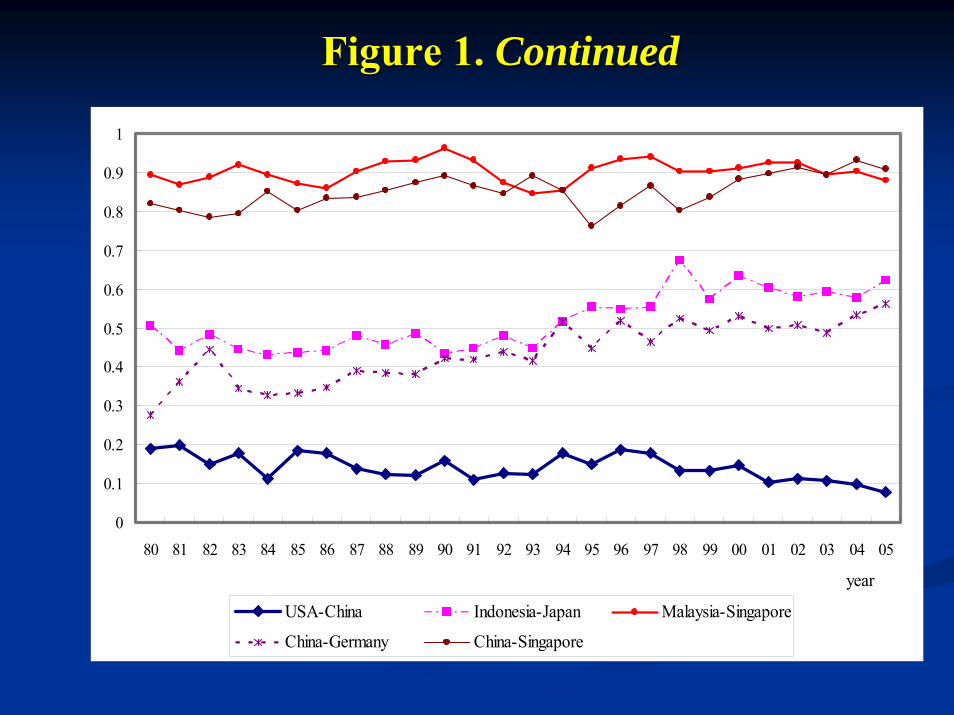
Figure 1. Figure 1. ContinuedContinued
0
0.1
0.2
0.3
0.4
0.5
0.6
0.7
0.8
0.9
1
80 81 82 83 84 85 86 87 88 89 90 91 92 93 94 95 96 97 98 99 00 01 02 03 04 05
year
USA-China Indonesia-Japan Malaysia-Singapore
China-Germany China-Singapore
Summary: Is East Asia an OCA?Summary: Is East Asia an OCA?East Asia is quite favorable for a currency union in terms of East Asia is quite favorable for a currency union in terms of its substantial degree of intraits substantial degree of intra--region trade.region trade.
East Asia has less favorable conditions for a currency union, East Asia has less favorable conditions for a currency union, particularly compared to Europe, in terms of business cycle particularly compared to Europe, in terms of business cycle synchronization and financial integration.synchronization and financial integration.
Political proximity in East Asia (Political proximity in East Asia (except Japanexcept Japan) seems fairly ) seems fairly high (comparable to that in Europe in the 1980s).high (comparable to that in Europe in the 1980s).
It is not clear which currency, if they opt for a currency It is not clear which currency, if they opt for a currency union, East Asian economies should choose as an anchor. union, East Asian economies should choose as an anchor.
The endogeineity of OCA criteria: country characteristics The endogeineity of OCA criteria: country characteristics affecting OCA conditions can be endogenously determined.affecting OCA conditions can be endogenously determined.
Quantitative Analysis of the Welfare Effects of East Quantitative Analysis of the Welfare Effects of East Asian Currency UnionsAsian Currency Unions
We calculate welfare effects of a dollar bloc, Euro bloc, Yen We calculate welfare effects of a dollar bloc, Euro bloc, Yen bloc, and a new regional currency bloc for East Asia.bloc, and a new regional currency bloc for East Asia.
We compare their potential benefits from joining a currency We compare their potential benefits from joining a currency union with their potential costs (relative to those of floating union with their potential costs (relative to those of floating exchange rate regime). exchange rate regime).
A currency union, by creating additional trade between A currency union, by creating additional trade between member countries, increases growth of output and member countries, increases growth of output and consumption. The loss of monetary policy independence leads consumption. The loss of monetary policy independence leads to higher degree of consumption fluctuations. to higher degree of consumption fluctuations.
Based on calibrations of a representative consumer model, we Based on calibrations of a representative consumer model, we estimate the welfare gains from increasing consumption estimate the welfare gains from increasing consumption growth and the welfare costs of increasing consumption growth and the welfare costs of increasing consumption volatility from both normal disturbances and rare disasters.volatility from both normal disturbances and rare disasters.

A Model of a Representative ConsumerA Model of a Representative Consumer
A representative consumer with a CRRA utility function,A representative consumer with a CRRA utility function,
A stochastic consumption stream follows a random walk process:A stochastic consumption stream follows a random walk process:
--εtt is is ‘‘normalnormal’’ disturbance, disturbance, iidiid loglog--normal. normal. -- vvtt is lowis low--probability disasters, such as World War, and financial probability disasters, such as World War, and financial crises, with a small probability (p), but big consumption contracrises, with a small probability (p), but big consumption contraction ction (b) ((b) (RietzRietz, 1988 and Barro, 2006)., 1988 and Barro, 2006).
probability probability ee--pp: : vvtt= 0, probability 1= 0, probability 1-- ee--pp: : vvtt = log(1= log(1--b).b).
The expected utility is rewritten by The expected utility is rewritten by UUt = V= V··(C(Ct))11--θθ/(1/(1--θθ),),
1/V = 1/V = ρρ+ (+ (θθ--1)1)·γ·γ–– (1/2)(1/2)··((θθ--1)1)2·σ·σ22 –– pp··((1((1--b)b)11--θθ –– 1)1)
1
0[ ( 1)/(1 )]i
t t t ii
U E e Cρ θ θ∞
− −+
=
= − −∑
1tV
t t tC C e eγ ε−=
A Model of a Representative Consumer: A Model of a Representative Consumer: ContinuedContinued
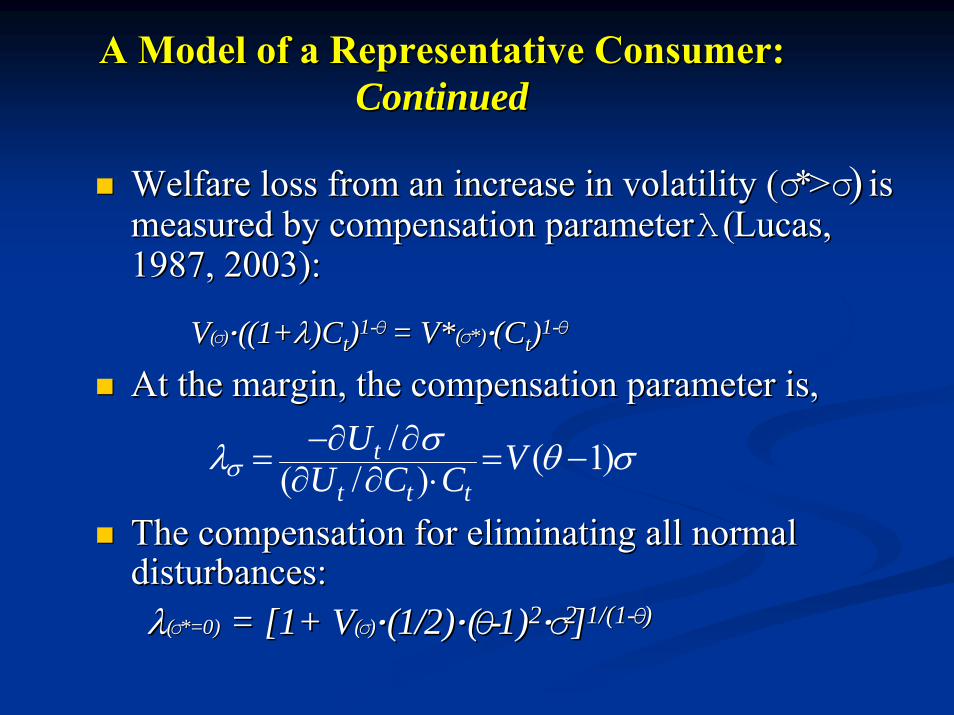
Welfare loss from an increase in volatility (Welfare loss from an increase in volatility (σσ*> *> σσ)) is is measured by compensation parameter measured by compensation parameter λλ (Lucas, (Lucas, 1987, 2003):1987, 2003):
VV((σσ))··((1+((1+λλ)C)Ctt))11--θθ = V*= V*((σσ*)*)··(C(Ctt))11--θθ
At the margin, the compensation parameter is, At the margin, the compensation parameter is,
The compensation for eliminating all normal The compensation for eliminating all normal disturbances:disturbances:λλ((σσ*=0)*=0) = [1+ V= [1+ V((σσ))··(1/2)(1/2)··((θθ--1)1)22·σ·σ22]]1/(11/(1--θθ))
/ ( 1)( / )t
t t t
U VU C Cσσλ θ σ−∂ ∂= = −
∂ ∂ ⋅
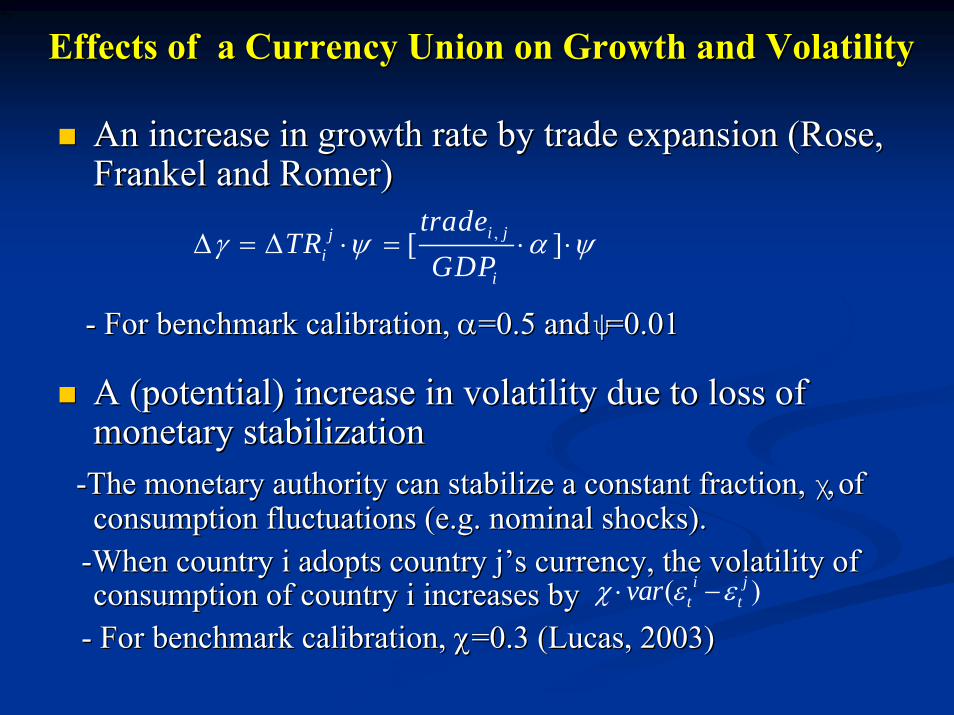
Effects of a Currency Union on Growth and VolatilityEffects of a Currency Union on Growth and Volatility
An increase in growth rate by trade expansion (Rose, An increase in growth rate by trade expansion (Rose, Frankel and Frankel and RomerRomer))
-- For benchmark calibration, For benchmark calibration, αα=0.5 and =0.5 and ψψ=0.01=0.01
A (potential) increase in volatility due to loss of A (potential) increase in volatility due to loss of monetary stabilizationmonetary stabilization
--The monetary authority can stabilize a constant fraction, The monetary authority can stabilize a constant fraction, χχ, of , of consumption fluctuations (e.g. nominal shocks).consumption fluctuations (e.g. nominal shocks).
--When country i adopts country When country i adopts country jj’’ss currency, the volatility of currency, the volatility of consumption of country i increases by consumption of country i increases by
-- For benchmark calibration, For benchmark calibration, χχ=0.3 (Lucas, 2003)=0.3 (Lucas, 2003)
tε
,[ ]i jji
i
tradeTR
GDPγ ψ α ψΔ = Δ ⋅ = ⋅ ⋅
( )i jt tvarχ ε ε⋅ −
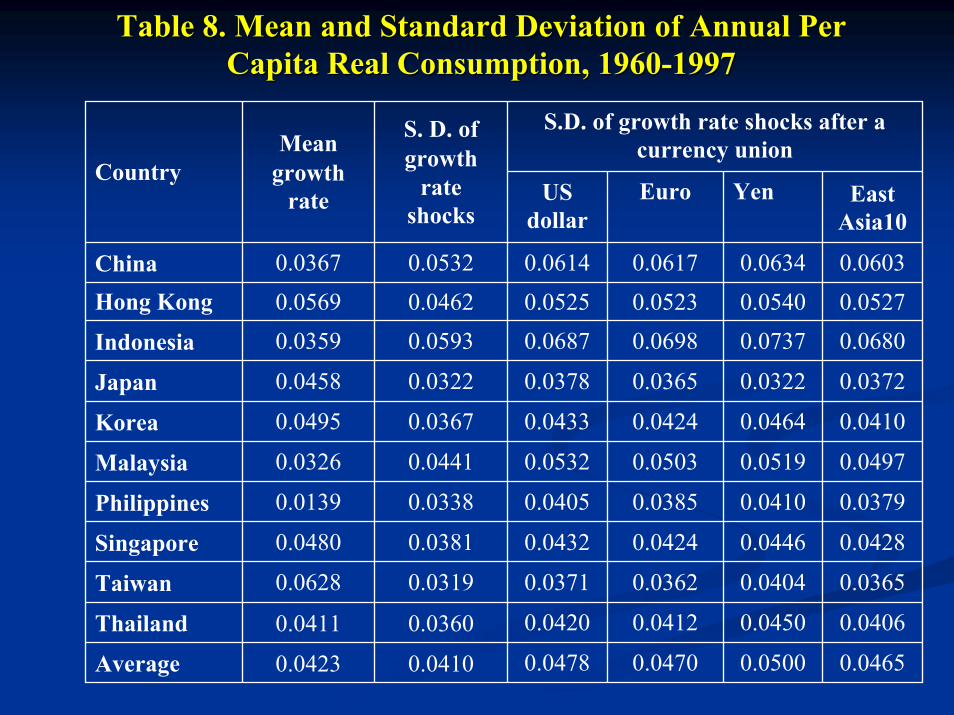
Table 8. Mean and Standard Deviation of Annual Per Table 8. Mean and Standard Deviation of Annual Per Capita Real Consumption, 1960Capita Real Consumption, 1960--19971997
S.D. of growth rate shocks after a currency union
CountryMean
growth rate
S. D. of growth
rate shocks
US dollar
Euro Yen East Asia10
China 0.0367 0.0532 0.0614 0.0617 0.0634 0.0603 Hong Kong 0.0569 0.0462 0.0525 0.0523 0.0540 0.0527
Indonesia 0.0359 0.0593 0.0687 0.0698 0.0737 0.0680
Japan 0.0458 0.0322 0.0378 0.0365 0.0322 0.0372
Korea 0.0495 0.0367 0.0433 0.0424 0.0464 0.0410
Malaysia 0.0326 0.0441 0.0532 0.0503 0.0519 0.0497
Philippines 0.0139 0.0338 0.0405 0.0385 0.0410 0.0379
Singapore 0.0480 0.0381 0.0432 0.0424 0.0446 0.0428
Taiwan 0.0628 0.0319 0.0371 0.0362 0.0404 0.0365
Thailand 0.0411 0.0360 0.0420 0.0412 0.0450 0.0406
Average 0.0423 0.0410 0.0478 0.0470 0.0500 0.0465
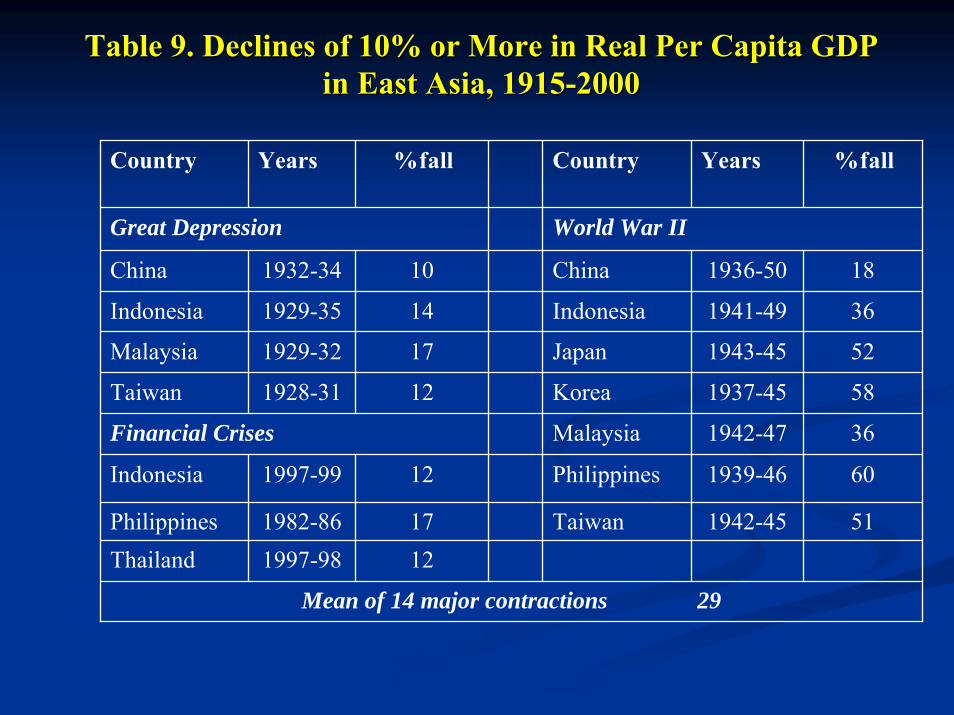
Table 9. Declines of 10% or More in Real Per Capita GDP Table 9. Declines of 10% or More in Real Per Capita GDP in East Asia, 1915in East Asia, 1915--20002000
Country Years %fall Country Years %fall
Great Depression World War II
China 1932-34 10 China 1936-50 18
Indonesia 1929-35 14 Indonesia 1941-49 36
Malaysia 1929-32 17 Japan 1943-45 52
Taiwan 1928-31 12 Korea 1937-45 58
Financial Crises Malaysia 1942-47 36
Indonesia 1997-99 12 Philippines 1939-46 60
Philippines 1982-86 17 Taiwan 1942-45 51Thailand 1997-98 12
Mean of 14 major contractions 29

Table 10. Compensating parameterTable 10. Compensating parameterProportionate change in initial consumptionProportionate change in initial consumption
(1) (2) (3)Marginal change in: Welfare effect Numerical value
normal s.d. (σ) V·(θ-1)·σ 1.1disaster probability (p) V·[(1-b)1-θ–1]/(θ-1) 5.1
disaster size (b) V⋅p·(1-b)-θ 0.6growth rate (γ) -V -8.6
(1) (2) (3)Change in: Welfare effect Numerical value
normal s.d. (σ=0) [1+ V·(1/2)·(θ-1)2·σ2]1/(1-θ) 2.1disaster probability (p=0) [1+ V· p·((1-b)1-θ – 1)]1/(1-θ) 8.5normal s.d. and disaster
probability (σ=b=0)[1+ V·(1/2)·(θ-1)2·σ2 +V· p·((1-b)1-θ – 1)]1/(1-θ)
10.3
A. Marginal Effect
B. Total Effect
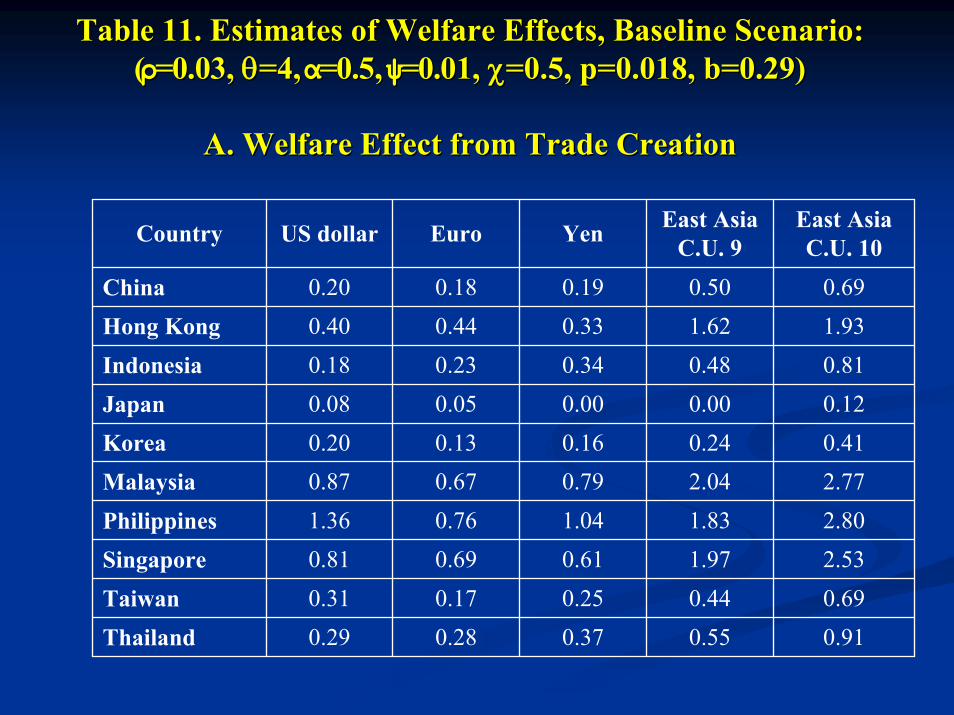
Table 11. Estimates of Welfare Effects, Baseline Scenario: Table 11. Estimates of Welfare Effects, Baseline Scenario: ((ρρ=0.03, =0.03, θθ=4, =4, αα=0.5, =0.5, ψψ=0.01, =0.01, χχ=0.5, p=0.018, b=0.29)=0.5, p=0.018, b=0.29)
A. Welfare Effect from Trade CreationA. Welfare Effect from Trade Creation
Country US dollar Euro Yen East Asia C.U. 9
East Asia C.U. 10
China 0.20 0.18 0.19 0.50 0.69 Hong Kong 0.40 0.44 0.33 1.62 1.93 Indonesia 0.18 0.23 0.34 0.48 0.81 Japan 0.08 0.05 0.00 0.00 0.12 Korea 0.20 0.13 0.16 0.24 0.41 Malaysia 0.87 0.67 0.79 2.04 2.77 Philippines 1.36 0.76 1.04 1.83 2.80 Singapore 0.81 0.69 0.61 1.97 2.53 Taiwan 0.31 0.17 0.25 0.44 0.69 Thailand 0.29 0.28 0.37 0.55 0.91
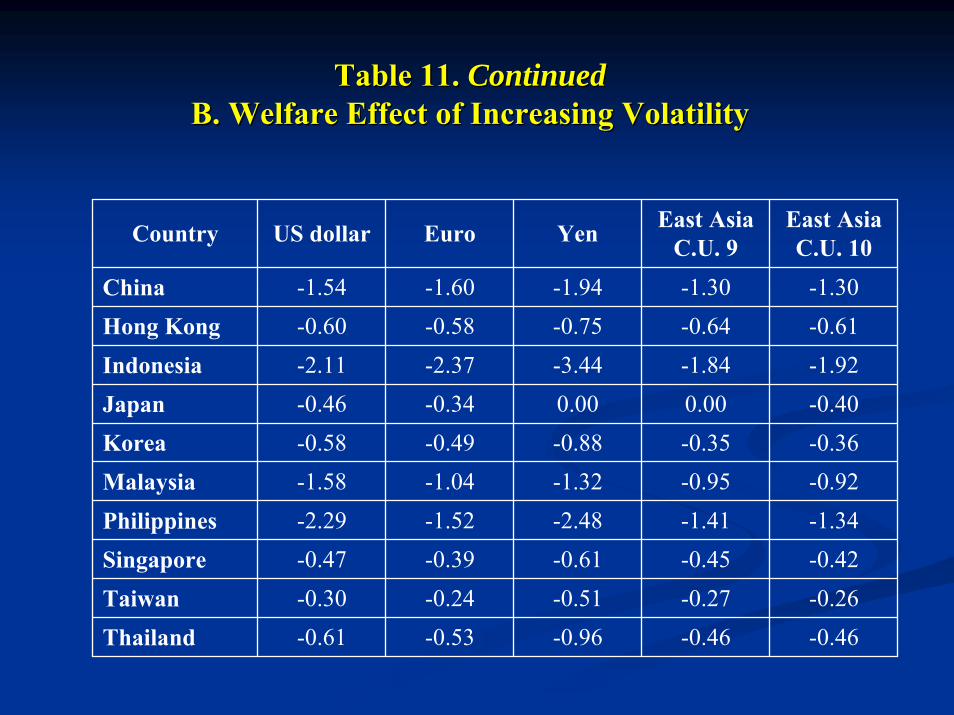
Table 11. Table 11. ContinuedContinuedB. Welfare Effect of Increasing VolatilityB. Welfare Effect of Increasing Volatility
Country US dollar Euro Yen East Asia C.U. 9
East Asia C.U. 10
China -1.54 -1.60 -1.94 -1.30 -1.30 Hong Kong -0.60 -0.58 -0.75 -0.64 -0.61 Indonesia -2.11 -2.37 -3.44 -1.84 -1.92 Japan -0.46 -0.34 0.00 0.00 -0.40 Korea -0.58 -0.49 -0.88 -0.35 -0.36 Malaysia -1.58 -1.04 -1.32 -0.95 -0.92 Philippines -2.29 -1.52 -2.48 -1.41 -1.34 Singapore -0.47 -0.39 -0.61 -0.45 -0.42 Taiwan -0.30 -0.24 -0.51 -0.27 -0.26 Thailand -0.61 -0.53 -0.96 -0.46 -0.46
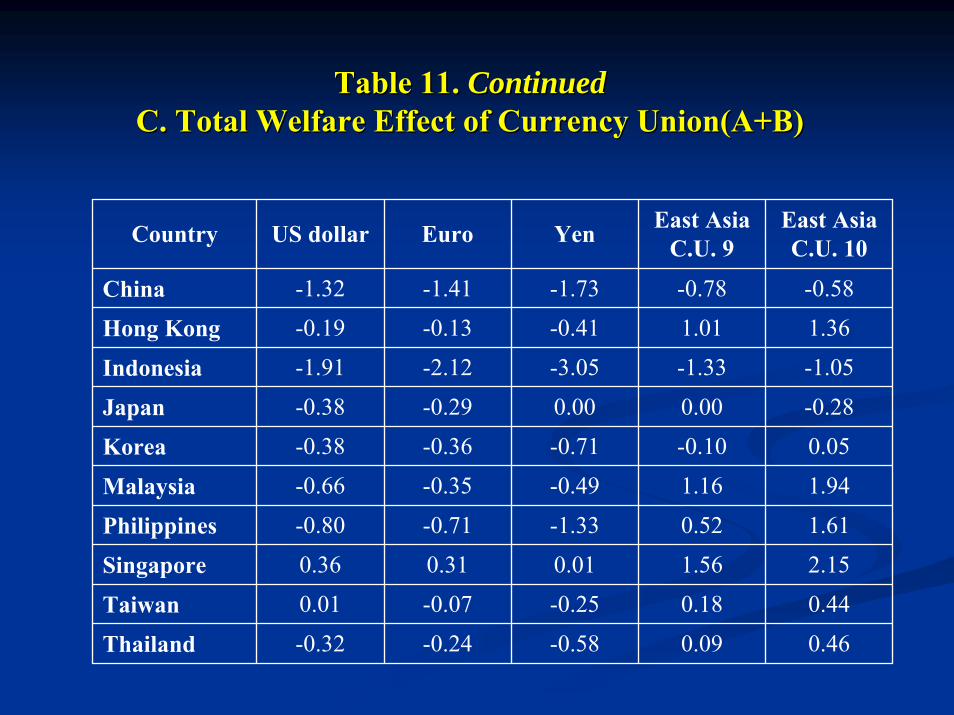
Table 11. Table 11. ContinuedContinuedC. Total Welfare Effect of Currency C. Total Welfare Effect of Currency Union(A+BUnion(A+B))
Country US dollar Euro Yen East Asia C.U. 9
East Asia C.U. 10
China -1.32 -1.41 -1.73 -0.78 -0.58
Hong Kong -0.19 -0.13 -0.41 1.01 1.36
Indonesia -1.91 -2.12 -3.05 -1.33 -1.05
Japan -0.38 -0.29 0.00 0.00 -0.28
Korea -0.38 -0.36 -0.71 -0.10 0.05
Malaysia -0.66 -0.35 -0.49 1.16 1.94
Philippines -0.80 -0.71 -1.33 0.52 1.61
Singapore 0.36 0.31 0.01 1.56 2.15
Taiwan 0.01 -0.07 -0.25 0.18 0.44
Thailand -0.32 -0.24 -0.58 0.09 0.46
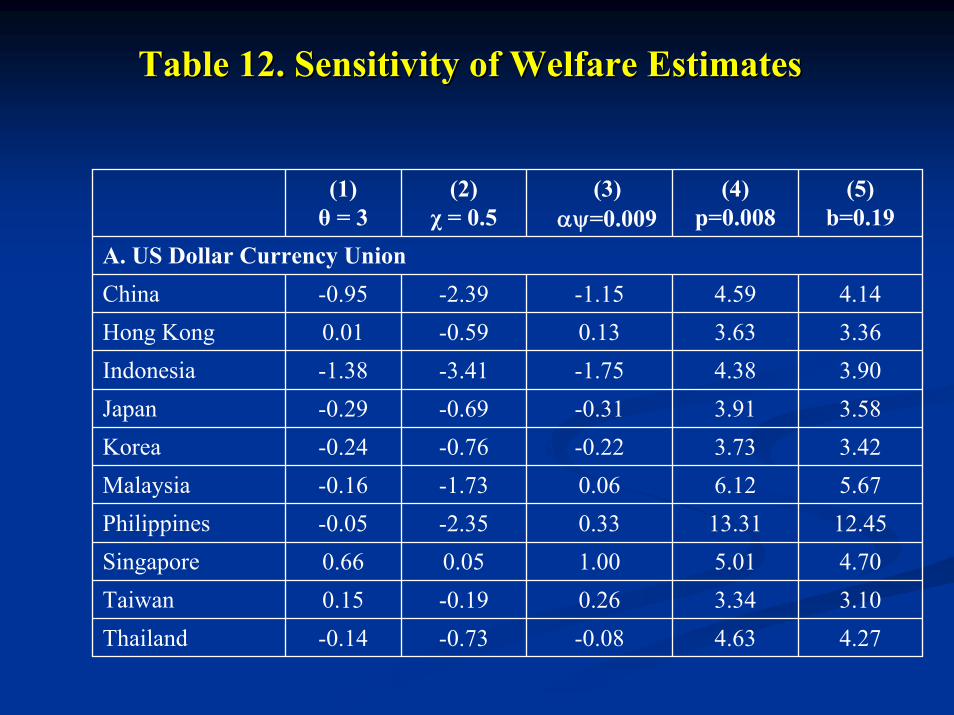
Table 12. Sensitivity of Welfare EstimatesTable 12. Sensitivity of Welfare Estimates
(1)θ = 3
(2)χ = 0.5
(3)αψ=0.009
(4)p=0.008
(5)b=0.19
A. US Dollar Currency UnionChina -0.95 -2.39 -1.15 4.59 4.14Hong Kong 0.01 -0.59 0.13 3.63 3.36Indonesia -1.38 -3.41 -1.75 4.38 3.90Japan -0.29 -0.69 -0.31 3.91 3.58Korea -0.24 -0.76 -0.22 3.73 3.42Malaysia -0.16 -1.73 0.06 6.12 5.67Philippines -0.05 -2.35 0.33 13.31 12.45Singapore 0.66 0.05 1.00 5.01 4.70Taiwan 0.15 -0.19 0.26 3.34 3.10Thailand -0.14 -0.73 -0.08 4.63 4.27
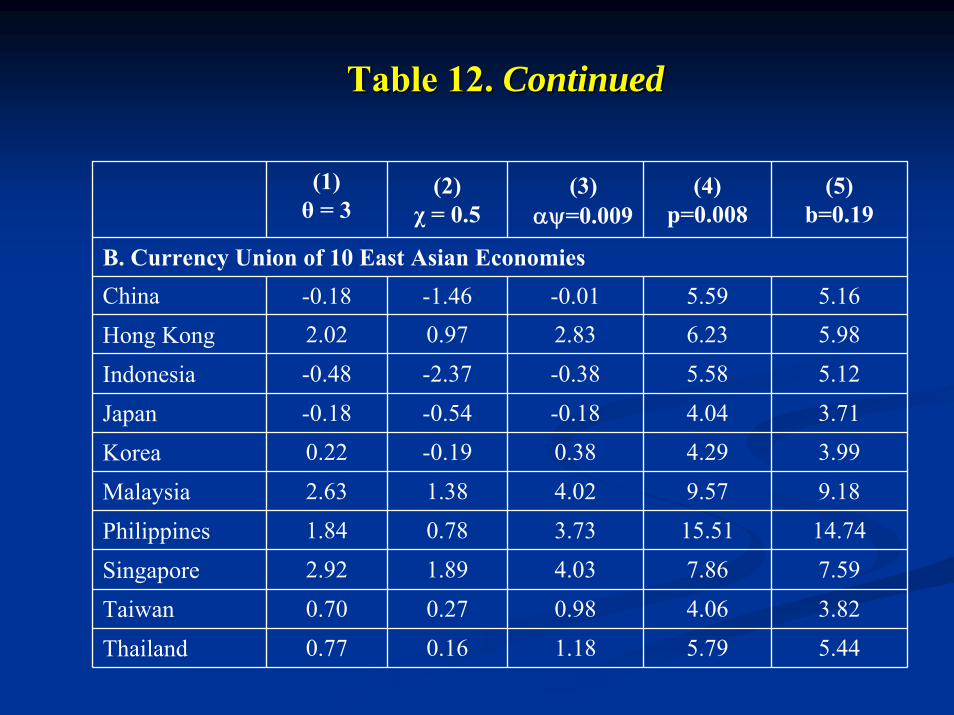
Table 12. Table 12. ContinuedContinued
(1)θ = 3
(2)χ = 0.5
(3)αψ=0.009
(4)p=0.008
(5)b=0.19
B. Currency Union of 10 East Asian EconomiesChina -0.18 -1.46 -0.01 5.59 5.16Hong Kong 2.02 0.97 2.83 6.23 5.98
Indonesia -0.48 -2.37 -0.38 5.58 5.12
Japan -0.18 -0.54 -0.18 4.04 3.71
Korea 0.22 -0.19 0.38 4.29 3.99
Malaysia 2.63 1.38 4.02 9.57 9.18
Philippines 1.84 0.78 3.73 15.51 14.74
Singapore 2.92 1.89 4.03 7.86 7.59
Taiwan 0.70 0.27 0.98 4.06 3.82
Thailand 0.77 0.16 1.18 5.79 5.44
Main Results from the EstimationMain Results from the Estimation
The welfare gain from increasing growth rate due to trade The welfare gain from increasing growth rate due to trade creation is estimated to be substantial. creation is estimated to be substantial. Because of their substantial degree of intraBecause of their substantial degree of intra--region trade, an region trade, an East Asian economy would benefit most from forming an East East Asian economy would benefit most from forming an East AsiaAsia--wide currency union, compared to joining a US dollar wide currency union, compared to joining a US dollar bloc, Euro bloc, or Yen bloc independently. bloc, Euro bloc, or Yen bloc independently. The potential welfare cost of increasing volatility due to loss The potential welfare cost of increasing volatility due to loss of independent monetary policy is also substantial as shocks of independent monetary policy is also substantial as shocks have a permanent effect on consumption.have a permanent effect on consumption.China, Indonesia, Japan, and Korea may lose even with China, Indonesia, Japan, and Korea may lose even with joining an East Asiajoining an East Asia--wide currency union. wide currency union. If joining a East Asia currency union eliminates the If joining a East Asia currency union eliminates the probability or size of disasters completely, all East Asian probability or size of disasters completely, all East Asian economies would get a net positive welfare gain.economies would get a net positive welfare gain.
Concluding RemarksConcluding RemarksJudging from OCA criteria, East Asia has less favorable Judging from OCA criteria, East Asia has less favorable conditions for a currency union, particularly compared to conditions for a currency union, particularly compared to Europe, in terms of business cycle synchronization and Europe, in terms of business cycle synchronization and financial integration. financial integration. The calibration results shows that most countries in East Asia The calibration results shows that most countries in East Asia would obtain a net welfare gain from forming a currency would obtain a net welfare gain from forming a currency union involving a broad group of East Asian economies. union involving a broad group of East Asian economies. The possible negative effect of increasing volatility on growth The possible negative effect of increasing volatility on growth may cause net welfare losses to larger East Asian economies, may cause net welfare losses to larger East Asian economies, especially China, Indonesia, Korea and Japan, even when they especially China, Indonesia, Korea and Japan, even when they join an East Asiajoin an East Asia--wide currency union. wide currency union. The important welfare consequences of a currency union The important welfare consequences of a currency union involve its influence on the probability and size of disasters involve its influence on the probability and size of disasters such as wars and financial crises in East Asia. such as wars and financial crises in East Asia. The prospect for an East Asian currency union will hinge on The prospect for an East Asian currency union will hinge on future developments of both economic and political future developments of both economic and political conditions, rather than current environments. conditions, rather than current environments.


![Methods of East Bloc Secret Intelligence Services[1]](https://img.pdfslide.us/doc/110x75/577c84c11a28abe054ba35cb/methods-of-east-bloc-secret-intelligence-services1.jpg)