Embed Size (px)
Citation preview

This paper is prepared for staffuse and is not for publication.The views expressed are those ofthe author and not necessarilythose of the Bank.
INTERNTIONAL aNK FOR RECONSTRUCTION AND DEVELOPMENT
Economics Department Wbrking Paper No. 1
EararkTeo Txes for Highwa in Developing, Countries
by
Per Eclund
June 6, 1967
Introduction
1. Public revenue is frequently earmarked by governments for thefinancing of a specific head of expenditure. One of the major objectivesin doing so is to impose a constraint in the allocation of funds in thehope of ensuring that the flow of revenue to this head of expeniditure isboth larger and more steady than might otherwise be the case. Any compre-hensive assessment of the device in any particular case must obviouslydepend upon the personal or political value judgments which are maderegarding the priority of the sector of expenditure being considered, thedesirability of restraining the free exercise of government choice indetermining the patterm of expenditure, etc.
2. There is, however, a prior and more objective question whichrequires answering before such a broad assessment of earmarking is under-taken. This is simply to determine whether it appears to be effectivein practice in achieving its objective of increasing expenditure on therelevant service. This study is a first and brief attempt to begin thisexamination on a systematic basis. It is made necessary by the fact thata priori analysis provides no convincing arguments one way or the other.On the one hand, some would argue that earmarking ensures a minimumlevel of expenditure for a government function, for which there is littleimmediate public support, th e avoiding the need for a repeated pressureon the legislature for funds.:.' Furthermore, it is added, earmarking, bylinking the tax to 2 designated function, may be one of the fewt ways toincrease taxation.2 On the other hand, it is argued that by conveyingthe impression that the revenue needs of the sector have been adequate-ly miiet by the earmarking provision, in fact there will frequently beless expenditure on the service, than might otherwise have been the case.
Elizabeth Deran: "Earmarking and Expenditures: A Survey anda New Test-" National Tax Journal, December 1965, p. 357.
2/ The benefit theory of taxation. Highway user charges linked tohighway developments provide one of the better illustrations.
Pub
lic D
iscl
osur
e A
utho
rized
Pub
lic D
iscl
osur
e A
utho
rized
Pub
lic D
iscl
osur
e A
utho
rized
Pub
lic D
iscl
osur
e A
utho
rized
Pub
lic D
iscl
osur
e A
utho
rized
Pub
lic D
iscl
osur
e A
utho
rized
Pub
lic D
iscl
osur
e A
utho
rized
Pub
lic D
iscl
osur
e A
utho
rized

-2
3. The direct significance of the study to Bank operations shouldbe readily apparent. At the most general level we make -- explicitly orimplicitly -- the value judgment that economic development should haveaccorded to it, the highest priority in national government policies. Thuswe have an interest in ensuring that budgetary expenditure of a develop-mental nature is as high as possible. In addition, the study is signifi-cant to Bank operations at the sector and project levels, where the speedof implementation of programmes and projects in which the Bank is involv-ed is frequently dependent upon the availability of funds to meet thelocal currency component of the expenditure.
4. The present study has examined the highway sector. This wasselected firstly because earmarking of taxes for highways is a commonphenomenon, and secondly because the operational experience of' the Bankin this field would facilitate the collection of data. With data bothfrom countries, which earmark revenue to highways and those whLich do not,the object of the study was to establish, if there is any statisticallysignificant relationship between total expenditure on roads, as a propor-tion of gross domestic capital formation; and:
a) The existence and non-existence of earmarked revenue for roads;
b) Earmarked taxes, as a proportion of gross domestic capitalformation.
5. Negatively, it should be emphasized that the study does not pur-port to examine whether investment in highways has been optimal or not. Thequestion of road user charges and their relation to highway expenditureha3 also been outside its scope. Farmarked taxes and user charges differ,firstly since road user charges are not necessarily earmarked for roaddevelopment, and secondly because taxes earmarked for roads are not alwayscharges upon road users, although the latter does appear to be most common.
6. It can be argued that earmarked taxes for roads, as a proportionof public investment, instead of a proportion of gross investment, wouldhave been a more operational concept. Gross investment rather than publicinvestment was chosen, because:
a) The problem of variations in the scope of the public sectorin the total investment aggregate is avoided; and
b) Data are more readily availabte for gross investment thanfor gross public inveatment_L1
1/ Accurate data on gross public investment are frequently not availablebecause of poor data of entities in the public sector outside therealm of the central government. Gross investment is often directlyestimated from the flow of commodities in an economy, without distinc-tion as to private and public sectors.

-3
Data and M"ethodology
7. The study covejq the time period 1955-65 and has been restrictedto developing countries*- The selection of countries was determined bythe availability of data. For each country., the main data collected were:
a) The annual expenditure on highways and bridges, including2,construction, maintenance and administration expenditure ,1
b) The amount of earmarWd taxes collected annually forhighway development;td
c) Gross domestic capital formation;
d) Gross National Product.
The sources were IBRD country reports and highway appraisal reports, toge-ther with files and working papers in the transportation division of theProjects Department, and in Area Departments. The data vary as to qualityand coverage. When budget and plan documents were relied on, actualexpenditures were used to the extent possible.
8. Where a country is adminiotered on a federal or decentralizedbasis, precaution was taken to get data representing total national expend-iture on highways and the total amount of earmarked taxes for roads. Dataon local expenditure were not available for all countries.2/
9. In obtaining data on earmarked taxes, it was necessary to distin-guish between the road funds composed entirely of earmarked taxes, thosewhich in addition receive contributions frori, the general budget and othersources, and thirdly those which have no earmarked elements. W/ The study hasbeen concerned only with the element which can properly be said to beearmarked.
10. Ideally, we would have wished 10-year time series for the period1955-65 to have been available for all countries. However, data of thiscoverage were available only for a limited nurnber of countries. Acceptabledata for the cross section analysis were found for 18 countries which haveearmarking for highways, and for 19 non-earmarking countries. For eachcountry and for each year, for which observations had been obtained, thepercentage of road expenditure to gross investment was calculated. Anaverage for the period was then taken for each country covering the period
1/ Witlh the exception of New Zealand,
2/ Excludes urban street and road expenditure.
3/ Argentina has been excluded from the analysis, since no datawere available for the Provinces' total road expenditure andearmarked revenue. Earmarking appears never to have been fullyaccepted in Argentina. (See Annex 5.)
/ Since 1962, Kenya has a road fund of the third category.

-4
for which observations were made. This was done both for the non-earmark-ing and the earmarking countries. For the latter, the average percentageof eannarked taxes to gross investment was calculated in the same manner.!
11. The analysis is presented in two parts: the first part presentsa cross section analysis and the second part a time series analysis. Inthe first part, road expenditure as a proportion of gross investment isanalyzed for the earmarking and the non-earmarking countries. The earmarkingcountries then are studied to determine if there is an observable relation-ship between on one hand, road expenditu:re as a proportiop of gross ipveot-ment, and on the other hand earmarked t,ages ao a proportion of grqss in-vestment. In the second part,,the time series of the earking oduntriesare examined in a similar way.
_~rvee stL'Lts
12. The survey showed that altogether no less than 31 developingcountries had or initiated legislation for the earmarking of taxes forhighways in the period 195-65, although lac5/of dita restricted the studyto the examination of 18 of these countries.- Earmarking for highwpysis more common than first expected. It is widespread in South Americawhere ten countries were found to have earmarking for this purpose. How-ever, in Central America, Costa Rica is the only country which employsearmarking. Earmarking is widespread in former French-ruled Africa,where nine earmarking countrios were found. Earmarking is less commonin forme- British ruled countries in Africa. In Egypt, earmarking stilltakes place, but it has been discontinued in Ghana, Kenya and Uganda.
13. The percentage of earmarked taxes to highway expenditurevaries considerably in the earmarking group with a mean proprotion of37 per cent. Peru comes closest to a 100 per cent coverage with 88 percent, followed by Ethiopia and New Zealand with 68 per cent and 62 per cent,
1/ Fiscal years do not agree everywhere with calendar years. Thereshould be little harm to the analysis, particularly since averagesfor the period are used in the cross-section analysis.
2/ The means were also calculated by the alternative method of takingthe percentage of accumulated road expenditure to accumulated grossinvestment, over the period. There was no significant difference inthe mean proportions of road expenditure to gross investment obtainedby the two methods; the two means of earmarked taxes to gross invest-ment were identical for the sample of earmarking countries.
3/ There may be others, but it would require the sending out of aquestionnaire to identify these. For alist of the earmarking countries,where data were lacking, see Table 3 - Annex 1.

respectively. (See T'kble 1 - Annex 1). The residual element of ex-penditure on roads in-the countries was met out of external aid, and/orallocations from the general budget.
Earmai AndNon-Eamaking Countries CrOSS Section Analysis14. The 18 earmarking countries were compared with the 19 inwhich no earmarking existed. Is thpre any significant difference in theratio of road expenditure to gross investment between the two groups?For the earmarking countries, thq average percentage of highwayr e;endi-ture"o gross investment i9 .9 percent with a standard eviat p of5.6.- The average for the non-e&rmaking group is lower, 8.1 percPntwith a standard deviation of 4.20 The average per capita incomes arenearly identical in the earmarking and non-earmarking group with means ofUS$ 287 and US$ 291 per capita, respectively. The median income in bothgroups is about US$ 200. It folows that the comparison betwen thg twogroups is not yiased on account of disparities in average incomes,-
15. The difference between the two samples was statistically test-ed with the t distribution, to determine whether the mean of the populationof earmarking countries is significantly different from that of thepopulation of non-earmarking countries. It was assumed that the propor-tions of road expenditure to gross investment are normally distj}buted,and secondly that the variances for both populations are equal.-AlthoUgh th# di't±erence in the mean proportions brings with it noMsuggestion that the ratio of road expenditure to gross investmdGtt id ihgeneral higher in earmarking, than in non-earmarking countries, it shouldbe emphasized that statistically the difference is not significant atany meaningful level of significance.
16. No appreciable difference in the average incomes was foundbetween the two groups. But is there any difference in the relationshipbetween GNP per capita, and road expenditure as a proportion of gross
1/ Within the earmarking group, Madagascar has by far the highestratio of highway expenditures to gross investment, 28&3 percent.When Madagascar is left out, the difference between the two groupsbecomes less marked: the mean for the earmarking countries is8.8 percent with a standard deviation of 3.3.2/ GNP per capita at factor cost obtained from IBRD World EcononicTables, November 1966.
3/ The hypothesis that the two populations have the same variance wastested, and found justified at a significance level as high as20 percent.

6-
investment, between the two groups, which might be attributed to theexistence of earmarking? Fbr the earmarking group the correl#tioncoefficient is 0.0; for the non-earmarking group it is -0.30.it Thedifference is small, but it suggests some support to the thesis thatearmarking imparts rigidity into the allocation of funds, in favor of theearmarked function. The negative correlation for the non-earmarkingcountries suggests that normally the ratio of road expenditure to grossinvestment decreases with rising income levels. This may reflect inpartb the fact, that a definition of road expenditure is used, whichexcludes urban atreet and road expenditure. Moreover, it might also re-flect a fundamental relationship between road expenditure and rising percapita incomes.
17. How is the relative allocation of funds to the road sectorinfluenced, when the earmarked revenue varies as a proportion of grossinvestment? The correlation coefficient between the ratio of road ex-penditure to gross investment and earmarked taxes as a percentage ofgross investment was found to be 0.722 , 3Yhe correlation coefficientis significantly different from zero. - In other words, as earmarkedtaxes for roads are increased in a country, and more than the increasein gross investment, it appears to be the case that the highway sectorroceivos a higher proportion of total investment. Since the regressioncoefficient is 1.5, the relationship can be expressed: When earmarkedtaxes for roads increase by one percent in relation to gross investment,this is associated with an increase in the proportion of road expenditureto gross investment of 1.5 percent.
18. I,' there a causal relationship here? To postulate this, wouldimplicitly assume that all relevant variables, except for eamarkedtaxes as a proportion of gross investment, behave identically in theearmarking countries. The correlation between O? per capita and roadexpenditure as a proportion of gross investment was found to be zero(see paragraph 16 above). It follows, that there is no meaningful rela-tionship between earmarked amounts as a percentage of gross investmentand GNP per capita (see Table 1 - Annex 1). Richer earmarking countriesdo not earmark relatively more (less) than poor ones. There is also noevidence that vehicles per capita bear an1 relationship to road expendi-ture as a proportion of gross investment,./ For these reasons, it is safe
l/ The difference between the two correlation coefficients is not sig-nificant at a significance level of 5 percent.2/ At a level of significance of one percent. The corresponding regressionequation is R = 4.8 + 1.5 T; where R = Road Expenditure, I = GrossInvestment aid T = Eaimark&d Taxes.
3/ When Madagascar is excluded, the correlation coefficient is 0.36,, andthe regression coefficient 0.58. This correlation coefficient is notsignificantly differetit from zero, at a level of significance of 5%.W This relationship was tested for the earmarking countries. Thecorrelation coefficient is zero. The data for vehicles per capita for1960 were obtained from U.N. Demographic and Statistical Yearbooks.

-7-
to say that different levels of income, mleasured either in GNP percViita or in vehicl-es per capita, do not bring in any distortions intothe examined relationship, which might modify the conclusion, that thereappears to be a causal relationship between a higher proportion ofearmarked taxes to gross inivestment, and a higher proj:.ortion of roadexpenditures to gross investment.
19. It is cleaxr how the causality works, when earmarking covers100 perclent of road expenditure- and earmarked taxes are the singlesource of funds, domestic as well as external, for highway expenditure.The tmT70 percentages become identical, as gross investment is the cormmondenorminator. Ilaen earmarling increases as a proportion of gross invest-mert,9 tVae ratio of road expenditure to gross investment will grow withthe same proportion. In fact, the average percentage of earmarked taxesto road expendituLre for the 18 countries in the earmarking group isonly 37 percent. Although earmarked taxes only cover a part of totalroad expenditure, it appears that the mere existence of earmiarking fanc-tions as a guarantee for a higher level of investment in the road sector.
20. There are also (when trying to explain t;his relationship)inmortalnt indirect effects oL earmarking, which should be kept in mind.An acceptled arid well functioning earmarking arrangement w7ill reduce therisk of discontin.uity of investment in the sector concerned. This villencourage the developmqent of entrepreneurial skills and improve longtberm planning. There is evidence that at tiimes entrepreneurial talentand not capi-tal and notu projects is the real bottleneck to highwayconstruction. Thle Iranian Road Study showed that, when suddenly fundsare niade available there may not be capable contractors to execute theworks.-" Evidence from Colombia and Ecuador supports this finding.2/WMien capable entrepreneurs have been the bottleneck in highway construc-tion, and earmarking of funds helps -to remove this obstacle, road expendi-ture will increase. Another factor must also be taken into account.It can be expected thaat improved long term planning wTill reduce construc-tion unit costs. This factor may work either towards reducing orincreasing total road expenditure, dependenlt upon the elasticity of demandfor road works. If the demand is very elastic with respect to prices,both factors will generate a higher level of road exoenditure.
1/ IBRD Economic Report EC-147, September 26, 1966. "An EconomicReappraisal of a Road Project". The First Iranian Road Loan of1959. (IRIS-222)
2/ In fact, a condition of the IBRD highway loan to Ecuador of 196ht,precisely provided for the setting up of a National Highway Fund,through wihich payments to contractors and suppliers would bechannelled . It is reported that this arrarngement has been help-ful in supporting the conitractor industry and improving highwayconstrruction iin Ecuador.

-8-
Time Series Analysis (Earmarking Countries)
21. The time series make it possible to limit the nuisancevariables, which bring in ancertainty in cross-section analysis.Instead of comparing earmarking and non-earmarking countries, countries
were studiod which started or onded their practice of earmarking, to
determine what impact this had on the percentage of road expenditureto gross investment. Five countries were looked at. Kenya, ivr.dagas-
car and Mauritania, all discontinued earmarking for roads, while it was
initiated in Chile and Costa Rica.
22. Ther-e is a clear correlation between the itntroduction ofearnarking and a higher relative level of road expenditure, and between
the discontinuance of it and a fall in the percentage of road expenditure
to gross investment. Longer time series and more cases would have been
desirable to make us more cornfident of this relationship. Still, the
picture is sufficiently clear to support and not contradict the thesis,
that earmarking for roads is associated with a higher relative alloca-
tion of funds for this function, than when earmarking does not take
place (see Annex 3).
23. It was worthwhile to plot the earmarked taxes as a percentageof gross investment, and road expenditure as a percentage of gross
investment, against each other, for seven countries in scatter-diagrams.
For five of these countries, Brazil, Ethiopia, Kenya, New Zealand and
Peru, there is a clear linear trend attesting to a pusitive relation-
ship between the two ratios. The fitting of a straight line to thO88
data was justified (see Annex 4). The correlation coefficients are
0.84, 0,89, 0.99, 0.83 and 0.65, repectively.L/ The weighted mean of
the regression coefficients is 1.7.- The subosample is small. None-theless, on the basis of the time series for these five countries, it isdemonstrated that when earmarked taxes increase (decrease) by one percent in relation to gross investment, road expen-iture as a proportionof gross investment increases (decreases) by 1.7 per cent, Thisresult does compare very favorably wi".h the relationship l:lg. obtainedin the cross-section analysis.
Conclusion
224. The cross-section analysis has shown that:
a) There in no statistically significant difference inthe proportion of road expenditure to gross investmentbetween the two samples of earmarking and non-earmarkingcountries, although there is a difference of 1.8 per-centage points.
1/ All are significantly different from zero at the one per cent level.
2/ Weighted by number of years,

-9-
b) The correlation coeff'icient between GNP per capita,and road expenditure as a proportion of gross invest-ment, is zero for the earmarking and -0.3 for thenon-earmarking countries; the diffarence for the twosamples is not significant.
c) There is a positive relationship between earmarkedtaxes as a proportion of gross investment, and roadexpenditure as a proportion of gross investment.The correlation coefficient obtained from the cross-section analysis is 0,7, and is significant. Ifshowever, Madagascar is excluded from the analysis apositive correlation is still obtained but it is notstatistically significant.
25g The time series analysis lend support to that:
a) Earmarking is associated with a somewhat higherdegree of road expenditure to gross investment, thanwhen earmarking does not take place.
b) There is a uniform relationship between ermarkedreventue and road expenditure, both as a proportionof gross investment.
26. Hence, the results from the cross-section analysis (24 a)and b)), and from the time series analysis (25 a)) point in the samedirection, that earmarking is associated with a higher spending on thefunction, than in the absence of earmarking. The significance tests,however, showed no significance with respect to the differences betweenearmarking and non-earmarking countries.
27. However, it must be recognized that in this testing the twomain assumptions are those of normal distribution of the variable exam.aned,and of a random sample in relation to the population. But there isanother factor which also linits the usefulness of these test; there isno way of bringing the size of the sample in relation to the population,to moderate or strengthen the conclusion. Obviously, the larger thesample is in relation to the population, the lesser becomes the relevanceof significance testing. This factor deserves to be kept clearly inmind in the interpretation of the results of our study,for nearly halfof the developing countries have been examined.
28. With respect to the earmarking countries., the cross-sectionanalysis (2l c)) supported by the time series analysis (25 b)) showedthat there is a positive correlation between eamarked taxes, as a pro-portion of gross investment, and road expenditure as a proportion ofgross investrment. Tentatively we would conclude that the analysis suggeststhat there is a positive relationship and a likely causality betweenthe armount earmarked and the amount spent on roads.

Table 1 - Annex 1
ELMARKIfG 3TUDYCR0S33-SECTION AUALYSI3
(Columns (3) to (6) are averages for the years indicated)
(1 2) (3) (4) (5) (6)Gross Domestic Road Expenditure Earmarked Taxes
Culp Vehicles Capital as a % of Earmarked as a % ofper per 1000 of Formation Gross Domestic Taxes Gross Domestic
Earmarking e Capita 1 , populatir as a % of Capital as a % of CapitalCountries Period (1964>- (1960)- _aP Formation Road Expenditure- Formation
Braz a/ 1955-64 216 17.2 16.5 13.3 43.0 5.7Chad!2 1963 70 2.4 13.7 8.9 18.8 2.1ChileS/ 1964-65 448 16.4 13.6 10.3 1.9 0.2Costa d/icaW 1961-63 360 23.5 15.5 8.4 7.8 0.6EgyptV/ 1961-65 138 3.5 16.9 1.9 25.0 0.5Ethiopa 1961-65 49 1.2 11.0 9,0 68.2 6.0Gabonk/ 1960-61 275 12.7 39.2 6.7 33.3 2.2
h/voxy Cast 1960-64 197 7.0 15.6 7.5 57.9 4.7Kenya- 1955-62 82 9,6 17.7 7.2 48.4 3.3Aadagascar/ 1956-63 83 7.8 9.1 28.3 33.2 11.6auritiaW 1958-59 138 2.7 9.0 12.9 22.4 3.1
New Ze land;/ 1955-65 1,757 270.3 24.3 11.6 61.6 7.1Niger-M 1960-65 75 1.0 11.2 12.4 8.6 1.0Paragig 1963-65 195 3.6 16.1 8.8 31.9 2.7Periw.! 1955-64 289 13.3 20.9 3.7 87.8 3.13aneg / 1963 165 11.3 10.3 12.9 30.9 4.0TFurkeyvf 1964 239 4.1 13.4 8.4 47.9 4.0Yuoalavia,D 1962-4 386 5.1 34.5 5.4 35.8 1.7
Average 287 22.9 17.1 9.9 36.9 3.5
1/ Source: GCIP at factor cost, IBRD Wbrld Economic Tables, November 1966.2/ U.N. Denographic and Statistical Yearboo!c, Tbtal Passenger and Conmercial Vehicles,3/ The percentages in column (5) obtained fromn Table 2, Annex 1. Dividing column (6)by
column (4) gives slightly different percentages for Chad & iHadagascar, due to the estimation procedures.3/- #/ See Table 2, Annex 1.

Table'l Annex 2
2R I STlDYNON EAMRIGCOUNTRIES
3 . '' 'GOSS SECTION ANALySIS(Coan (3) ad (4) are averages $or the years indicated )
Road Expendituresehicles p Gross Domestic as a % of Gross
GNP per 1000 of Capital mestic CapiFormCapita Pop-at Foration Formatin
CutyTime Capia Pfulaiam
El Salvador 1960-64 26k 11.9 1228 6.9
Ghana W 19 63-65 229 5.,7 17.4 2.1Greece c/ 1957-64 513 9.6 23.6 . 9.3
Quatemalae 1960-65 285 10.8 14.18 193
Honduras / 1959-65 193 5.8 14.1 13.1
India I 1956;-63 88 1.2 U.9 -r 9fan g/ 1960-65 206 6.17 -5.8 10.
Israel 1956-61 1,066 7.6 29.5 2.1
amaica 1958-64 432 72.22 21. 14Korea jF 198-65 U9 1.1 12.7 2.2
Nlau V 1957-65 38 1 . 14.638orocc 1/ 196Q-65 174 14.8 10.9 . 10.8
Ni9caragua f 1960-65 296 10.0 15.8 12.0Panama1958-63 446 22.5 17.3 12.0
Poruga 1 1962-65 342 23.6 18.0 3. 8
Tanania r -1960-65 .67 3.6 1U.7 10.296a 1961-65 109 3.7 20.52 0 5.
frmnidad & Totja|6; El 195l-65 .588 - 57.1 29.0 5.6
tanda ' 1962-65 77 4.6 13 7.7
Average 2u1 11.1 16.2 8.1
- V Source s GNPt at factor cost. IBE{D World Eiconomic Tables November 1966t
jySource s U.N. Demsographic and Statistical Yearbooks . Total Passenger and Commrcial Vehicles.
Ea - / 3e.Tab8e2--nez2

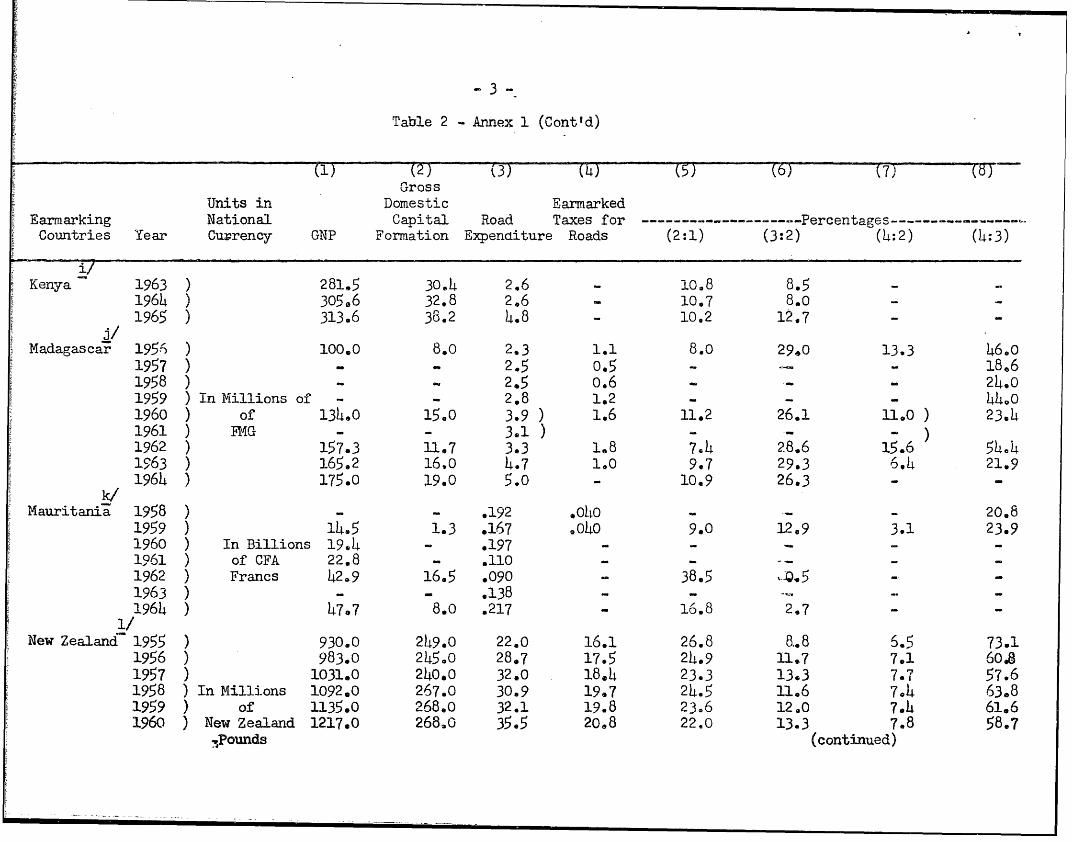
Table 2 - Annex 1
EAR1ARKITN- COUNTRIESGNP, GROSS INVESTMEIT, ROAD EXPT- DITUR, A-ND EAR.KARKED TAXES FOR ROADS
(In Current Market Prices)
()()(3) (14) 5)(6) (7)()Gross
Units in Domestic Earmarkedcarr-arkin7 National Capital Road Taxes for ----------- Percentages---------------Cou tries Year Currency GINP Formation Expenditure Roads (2:1) (3:2) (4:2) (4:3)
a!Brazil- 1955 ) 689,3 108.0 9.7 2.8 15.7 9.0 2.6 28.91956 ) 880.3 130.7 11.6 5.o 14.8 8.9 3.8 43.11957 ) 1053.2 160.4 21.9 10.9 15e2 13.7 6.8 149.81958 ) In Billions 1303.6 180.8 34.9 13.1 13.9 19.3 7.2 37.51959 ) of 1791.4 305.0 41.6 21.1 17.0 13.6 6.9 50.71950 ) Cruzeiros 2396.4 418.5 57.1 24.3 17.5 13.6 5.8 42.61961 ) 31475.1 6148.7 70.6 37.2 18.7 10.9 5.7 52,71962 ) 5435.6 1000.1 120.9 53.3 18.14 12.1 5.3 44.11963 ) 9519.8 1680.1 21469 96.7 17.6 14.7 5.8 39.21964 ) 18726.0 3106.5 524.0 216.4 16.6 16.9 1.0 41.3b/Chad 1961 ) 39.0 5.5 - 1141 - -4
1963 ) In Billions 50.0 6.7 .596 .138 13.4 8.9 2.1 23.21964 ) of - 1.098 .149 - 13.61965 ) CFA Francs - .676 .132 5- - 9.5.c/Chile 1964 ) In Millions 14816.0 2020.0 205.1 2.0 13.6 10.2 0.1 101965 ) of Escudos - 2650o0 275.8 7.0 10.4 0.3 2.5'd/Costa Rica 1961 ) In Millions 433.9 S%.2 5.0 .413 14.8 748 o.6 8.31962 ) of C.A. 474.41 76.3 5.6 .5141 16,1 7@3 0.7 9.71963 ) Pesos 516.6 81.1 8.3 .450 15.7 -20.2 0.6 5.4

Table 2 - Annex 1 (Cont'd)
F (1) (2) (3) (L) (5) (6 7 (d)Gross
Units in Domestic EarmarkedEarmarking National Capital Road Taxes for -------------- Percentages-----------------
Countries Year Currency GNP Formation Expenditure Roads (2:1) (3:2) (4:2) (4:3)
,Egypt 1961 ) 11461.1 218,2 ) 1.1 14.9 ) 0.5 )1962 ) In Millions 1512.8 239.8 ) 1.2 15.9 ) 0.5 )1963 ) of 1679.0 287.9 ) 5.2 1,3 17.1 ) 1l9 0.5 ) 25.01964 ) Egyptian 1880.9 363.7 ) 1,5 19,3 ) 0.4 )1965 ) Pounds 20143.9 358.4 ) 1.6 17.5 ) 0.14 )
f/lEthiopia 1961 ) 2512.0 246.3 25.8 15.9 9.8 _1o.5 6.5 61.7
1962 ) In Millions 2614.0 289e7 23.6 16.7 11.1 8.1 5.8 71.01963 ) of 2710.0 309.4 29.6 19.1 11.14 9.6 6.2 64e519614 Ethiopian 3056.8 327.2 32.2 20.3 10.7 9.8 6.2 63.11965 ) Dollars 31470.6 411[.Q 28.1 22.6 11.8 6.8 5.5 80.5
Gabon 1960 ) In Billions 31.6 12.4 .828 .271 39.2 6.7 2.2 32.71961 ) of CFA Francs 20.0 ° .977 .330 - - 33.8
h,/'Ivory Coast 1960 ) 1514.9 21.5 2.3 1.6 13.9 ) 7.2 67.1
1961 ) In Billions 172.5 29.0 2.3 1.1 16.8 ) 3.9 149.01962 ) of 182.6 21.8 2.3 1.2 11.9 7.0 5.5 52.31963 ) CFA F'rancs 208.1 32.5 2.3 1.2 15.6 ) 3.7 52.419614 ) 249.5 148.8 2.3 1.6 19.6 ) 3.3 68.7
Kenya 1955 ) 208.2 43.8 1.8 0.9 21.0 4.1 2.1 51.01956 ) 206.1 43.8 2.1 1.1 21.3 14.8 2.5 52.21957 ) In Millions 219.7, 45.7 2.14 1.1 20,8 5.3 2.14 46.5,1958 ) of 222.0 140.0 2.2 1.2 18,0 5. 3.0 53091959 ) EA. 229,2 140.3 2.0 1.1 17.6 5.0 2.8 55.91960 ) Pounds 241.7 41.4 2.8 1.3 1761 6.8 3.2 47.21961 ) 242.0 31.9 410 1.6 13^2 12.7 5.2 140.71962 ) 264.0 33.3 4.5 1,8 12.6 3.13 5.3 39,7
(continued)
-3-
Table 2 Annex 1 (Cont'd)
)(2) (3) (4) (5) (6) T7) )
GrossUnits in Domestic Earmarked
Earmarking National Capital Road Taxes for ------------------- Percentages-------------
Countries Year Currency GNP Formation Expenditure Roads (2:1) (34:2) (14:3)
Keny-a 1963 ) 281.5 30,14 2.6 i lO.8 8.51964 ) 305.6 32.8 2.6 10.7 8.o -
1965 ) 313.6 38.2 4.8 - 10.2 12.7 - -
j/Madagascar 195- ) 100.0 8.0 2.3 1.1 8.0 29,0 13.3 46.0
1957 ) 2.5 0.5 - - 18.61958 ) - - 2.5 0.6 . - 24.01959 ) In Millions of - - 2.8 1.2 - - - 44.0
1960 ) of 134.,0 15.0 3.9 ) 1.6 11.2 26.1 11,0 ) 23.4
1961) FMG - - 3.1) - )1962 ) 157.3 -1.7 3.3 1,8 714 28.6 15.6 54.41963 ) 165.2 16,0 4.7 1.0 9.7 29.3 6.14 21.9
1964 ) 175.0 L9.0 5.0 - 10.9 26.3 - -
k:/Mauritania 1958 ) - - .192 o040 - - - 20.8
1959 ) 114.5 1.3 167 o.04o 9.0 12.9 3.1 23.9
1960 ) In Billions 1947 - - - -
1961 ) of CFA 22.8 .110 - -
1962 ) Francs 42.9 16.5 .090 - 38.5 Q.5 - -
1963 ) - - .138 - -
1964 ) 47.7 8.0 .217 - 16.8 2.7 - -
1/New Zealand 1955 ) 930.0 249.0 22.0 16. 26.8 8.8 6.5 73.1
1956 ) 983.0 245.0 28.7 17.5 24.9 11.7 7.1 60.8
1957 ) 1031.0 240.0 32.0 18.4 23.3 13.3 7.7 57.6
1958 ) In Millions 1092.0 267.0 30.9 19.7 24.5 31.6 7.4 63,81959 ) of 1135.0 268.0 32.1 19.8 23.6 12.0 7.4 61.6
1960 ) New Zealand 1217.0 2683o 35.5 20,8 22.0 13.3 7.8 58.7.,Pounds (continued)

Table 2 Annex I (Cont'ci)
GrossUnits in Domestic Earmarked ---- ------- - Percentages -------- ----
Earmarking National Capital Road Taxes forCountries Year Currency GNP Formation Expenditure Roads (2:1) (3:2) (4:2) (4:3)
-17New Zealand 1961 ) Pounds 1311.0 324.0 36.5 21.7 24.7 11.3 6.7 59.5
1962 ) 1357.0 326.0 37.2 23.7 24,0 11.4 7.3 63,61963 ) 453.0 3236. 41.9 24.0 23e1 12.-5 7.1 57021964 ) 1595.0 4o4.o 43.3 26.0 24.3 10.7 6.4 60.11965 ) 1714.0 437.0 49.6 30.5 25.5 11.3 7.0 61.6
Niger 1960 ) 50.1 4.6 .507 042 9.2 11.0 0.9 8.31961 ) 54.1 5.1 .807 .008 9.4 15.8 0.2 1.01962 ) In Billions 61e6 9.9 .794 .080 16.1 8.0 0.8 10,11963 ) of 64.6 7.5 e - 11.6 - -
1964 ) CFA Francs 64.9 6.3 9.7 -
1965 ) - 6.3 .920 .136 - 14.6 2.2 14.8
Paraguay 1963 ) In Millions 46453.0 7072,0 474.0 166.0 15.2 6.7 2.3 35.01964 ) of 49641.0 77855.o 515.0 173.0 15,8 6.6 2.2 33.6
1965 ) Guaranies 52044.0 8955.0 1175.0 318.0 .17.2 13.1 3.6 27.1
Peru 1955 ) 30.2 5.8 .264 .190 19.2 4.6 3.3 71.81956 ) 33.5 7.2 .282 .201 21.5 3.9 2.8 71.3
195'f ) >%? 8.3 .3770 .324 23.2 4.5 3.9 87.41956 ) BI Billions 39.1 -8.2 .319 .324 21.0 3.9 3.9 101.41959 ) of 44.7 7.1 .369 .328 15.9 5.2 4,6 88.7'1960 ) Soles 54.2 10.7 .240 .334 19.7 2.2 3.1 139.3196a ) 61.4 12.6 .325 .354 20.5 2.v6 2.8 103,71962 ) 68.0 15.5 .510 .375 22.8 ..3. 7 5k T1963 ) 76.1D 16.9 .516 .393 22,2 3. - 23 76.11964 ) 85.2 19.2 .698 .418 22.5 - 3 59.7
-con1AWA&dJ

-5-
Table 2 Annex 1 (ContId)
(1) (2) (T3)- (4) (5) 6)(7) )Gzross
Urits in Domestic EanmarkedEarmarking National Capital Road Taxes for ---- -°- Percentages -°
Countries Year Currency GNP Formation Expenditure Roads (2:1) (3:2) (4:2) (4:3)
Senegal 1962 ) In Millions 162.7 15.4 2.6 .700 9.5 1L6.9 4.5 26.81?63 ) of 159.3 16.4 2.1 d652 10.3 12.9 4.0 30.91964 ) CFA Francs 164.2 16.5 3.6 .591 10.0 21.9 3.6 16.4
a'Turkey 1964 In Billions of
Liras 74.L 10.2 .841 .403 13.4 8.4 4.0 47.9r/
Yugoslavia 1962 ) 37.7 13.3 .703 .189 35.3 5.3 1.4 26.91963 ) In Billions 45.8 15,9 .863- 34.6 5.4 -
1964 ) of 60.9 20.1 1.108 .392 33.5 5.4 1.9 35.41965 ) lew Dinars 75.3 - 1.027 .463 - - , 45.1

Table 2 - Annex 1 (Cont'd)
Sources :
a/ GNP and GDOF : Brazil Economic Mission, 1966.
Road Expenditure : IBRD Economic Report, 1965.
Earmarked Taxes for Roads IBRD Projects Department.
b ( GDP used instead of GNP )
GDP (1961) : Draft Economic Report, 1966.
(1963) : Basic DataGDCF(1961) : Draft Economic Report, 1966
(1963) O Own estimate.Road Expenditure : BCEQM Report, 1965 and Premiere Plan Quinqueal, 19 -
Eamarked Taxes for Roads: Premiere Plan Quinquennal, 1966-70.
c/ GNP, GDCF and Road Expenditure : IBRD Economic Report, 1966.
Eamrarked Taxes for Roads: atimate obtained from Economic Secretariat OAS.
W IBRD Economic Report, 1967.Road Expenditure: Ten percent of total road expenditure own estimate to represent administration
expenditure.
IBRD Economic Report, 1966. Fixed Capital Formation used instead of GDCF.
Road Expenditure s Total road expenditure 1961-65 was I 26 million, IBRD Economic Report 1966.
Earmarked Taxes : Based on 15 percent of revenue fran busses operating outside
cities; earmarked revenue from 1961-63 is own estimate.
IBRD Projects Department.
GNP and GDCF : IBRD Economic Report, 1967.
Road Expenditure and Earmarked for Roads. Budget Data.
GNP and GDCF IBRD Economic Report, 1964 GDp used instead of GNP for 1960e 7IBRD estimate of GNP for 1961
Road Expenditure and Earmarked Taxes for Roads: Highway Appraisal Report,- 2964h

Table 2 Annex 1 ( Cont'd )
hJ ON?, GDCF and Road Expenditure: IBRD Econawic Report, 1967. Road Expendilture is a of totalroad expenditure 190-65
Earmarked Taxes for Roads: Budget Documents.
if GNP and GDCF,: IBRD Economic Report, 1967.Road Expenditure and Earmarked Taxes for Roads * Road Authority Annual Reports, and Budgets of
Kenya.
GDP used instead of GNP for 1956-6o.Road Expenditure Highway Appraisal Report, 1966. Eight percent of total road expenditure own
estimate to represent administration expenditure.Earmarked Taxes for Roads: IBRD Projects Department.
J GNP not available. GDP and GDCF from I4F? Report.Road Expenditure and Earmarked Taxes for Roads: Highway Appraisal Report, 1967. 1964 data are
estimates.
G ONP anid GDC: IBRD Economic Report, 1965.Road Expenditure : Reports of the National Roads Board, (New ZealaJnd) and'-IBD Economic Report
1962 - Appendix 7.Earmarked Taxes for Roads . Monthly Abstract of Statistics, June 1965.
(GDP used instead of GNP)Road Expenditure and Earmarked Taxes for Roads: Highway Appraisal Report; 1967.E-armarked Taxes : Own estimate of the share allocated to maintenance for 1960-63.IBRD Economic Report, 1965. 1965 data are estimates.
GNP and GIO : IERD Economic Report, 1965.Road ExPenditure and Earmarked Taxes for Roads IBRD Western HemisphereD4Dpartment.
PI (MDP used instead of GNP)GDP and GDCF from IMF Reports.Road Expenditure : Plan Quadriennal of Dev., 1961-64.tarmarked Taxes for Roads: Budget Documents.QDCF (1963) Provisional Data.
(1964) Mission EstimatesEarmarked Taxes for Roads 1962 : Estimate based on CFAF 350 mnillion for-s, onths. Only 1963
data were used for the crots-section analybis,since they representactual expenditure.
F .. ^

Ta'ole 2 - Aunex 1 (Cont'd)
GNP and GDCF: IBRD Economic Report, 1965.Road Expenditure and Earmarked Taxes for Roads : Highways and Highway Transportation in Turkey,
1966 (Ministry of Public Works, Ankara).
IBRD Economic Report, 1966.Gross Material Social Product used instead of GNP. Gross Investment in Fixed Assets used instead
of GDCF.Earmarked Taxes for Roads: IBRD Projects Department.

Table 2 - Annex 2
NON-ELRMARKING Co0fRI1SGNP, GROSS IN51VE T AND ROAD ENDITURE
(In current Market Prices)
Gr-ossUnits in DomesticNational Capital Rdad PercentagesCountry Year Carrency GNP Fbrmation penditure (2-1) (3:2)
a/EL Salvador 1060 ) 568.0 78.9 - 4.7 13.9 6.0
1961 ) MiMlions 5141.6 67.1 7.7 1214 11.51962 ) of 6h .9 69.2 6.1 10.6 8.81963 ) Pesos 602.8 81.0 3.4 13.4 4.21964 ) 756.0 105.1 4.2 13.9 4.0b/
Ga 1961 ) 1,210.0 228.0 3.1 18.8 1.31962 ) Millions 1,l01.0 207.0 3.8 15.9 a.,81963 ) of 1,428.0 252.0 2.2 17.6 0.91964 ) Cedis 1,615.0 295.0 6.4 18.3 2.21965 ) 1,886.0 310.0 10.2 16.4 3.3cS
Graece 1957 ) 74,286.0 15,242.0 345.0 20.5 2.31958 ) 77s044.0 17,764.0 636.0 23.1 3.61959 ) Millions 803184.0 19,104.0 7747.0 23.8 3.91960 ) of 96,955.0 243828.0 1.,234,0 25.6 5.01961 ) Drachmas 111.,256.0 283025.0 1,457.0. 25.2 5.21962 ) 118,994.0 28,486.0 1,231:10. 23.9 4.31963 ) 1329919.0 28,210.0 141440.0 21.2 5.11964 ) 150,078.0 37,900.0 1,959.0 25.3 5.2d/
Guateialaa 1960 ) 1,010.0 108.8 13.8 10.8 12.71%l ) Millions 1,031.0 116.3 11.2 11.3 9.71962 ) of 1,080.3 113.4 10.7 10.5 9.41963 ) C.A. Pesos 1,200.0 135.5 11.3 11.3 8.31964 ) 1,311.2 170.4 14.8 13.0 8.71965 ) - 1,409.8 194.3 13.5 13.8 -7.0

-2-
Table 2 - Annex 2
)(2) (3) (4) (5)Gross
Units in DomesticNational Capital Road Percentages
Country Year Currenc GNP Formation Expenditure (2:1) Q3:2e/
Honduras 1959 ) 375.0 48.0 .8.0 12.8 16.71960 ) 390.0 53.0 9.1 13.6 17.21961 ) 1iions 397.0 49.o 7.2 12.3 1471962 ) of 41t9.0 61.O 7.7 14.6 12.61963 ) C.A. 434,0 68.0 7.0 15.7 10.31964 ) Pesos 459.0 70.0 8.2 15.3 11.71965 ) 504.0 72.0 6.1 14.3 8.5
India 1956 ) 99.8 10.3 o.6 10.4 6.11957 ) 14.5 0.8 5.71958 ) 12.9 0.9 - 6.71959 ) Billions 13.3 0.8 - 5.91960 ) of 13.6 0.8 - 5.91961 ) Rupees 141.9 18.7 .9 13.2 4.81962 ) 148.7 17.6 1.2 11.8 6.31963 ) 158.4 19.5 1.2 12.3 6.1
-,/Iran 1960 ) 289.4 49.7 ) 17.2 )
1961 ) 317.8 58. )- 18.5 )1962 ) Billions 339.8 57.7 ) 5.5 17.0 ) 10.11963 ) of 348.9 45.4 ) 13.0 )1964 ) Rials 375.5 50.4 ) 13.4 )1965 ) 407.0 64.1 ) 15.7 )
Israel 1956 ) 2,534.0 740.0 16.2 29.2 2.21957 ) XMiUions 2,943.0 910.0 15.5 30.9 1.71958 ) of 3.,373.0 ls,005.0 20.8 29.8 2.11959 ) Israel 3,861.0 1,114.0 24.4 28.9 2.21960 ) Pounds 4346.0, 1,218.0 26.9 28.0 2o21961 ) 5,208.0' 1,565.o 30.5 30.0 1.9
3.
Table 2 Annex 2 (Cont'd)
Gross
Units i DomesticNational Capital Road Percentages
Conty ea Crrnc GPFormation Expenditure =2 -:1P ____
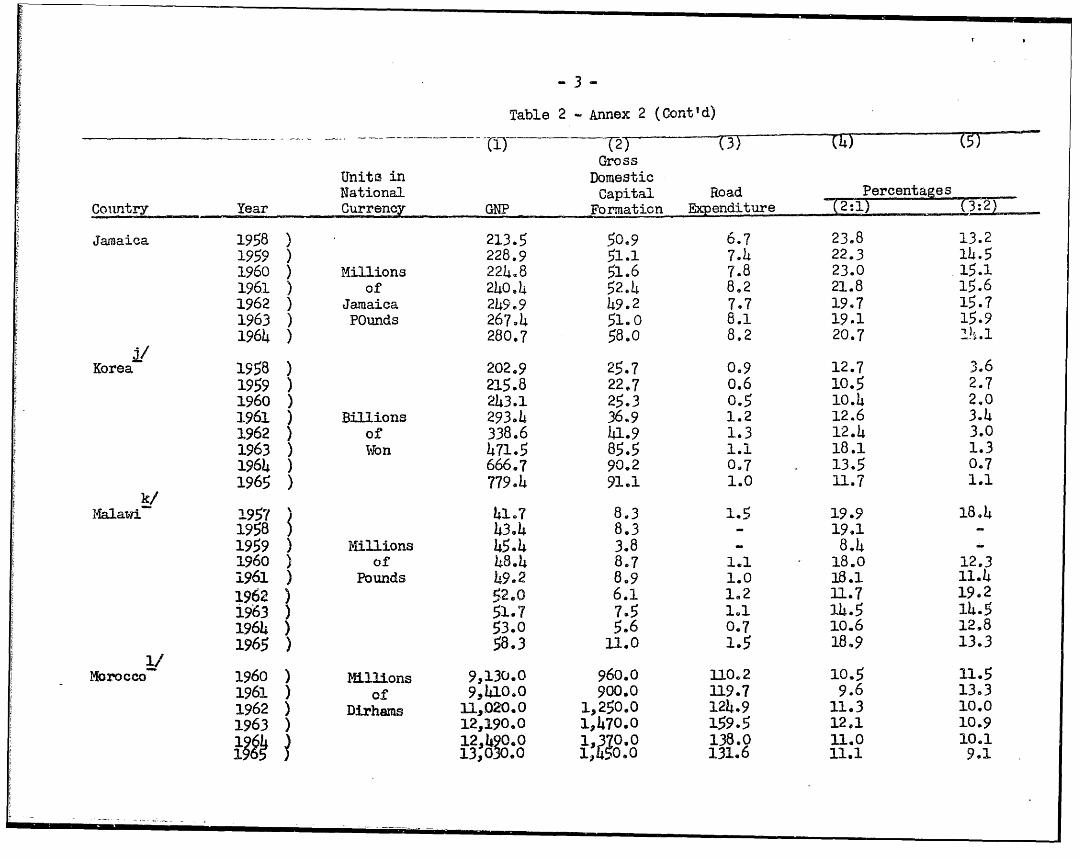
Jamaica 1958 ) 213.5 50.9 6.7 23.8 13.2
195 ) 228.9 51.1 7.4 22.3 14.5
1960 ) Millions 224.8 51.6 7.8 23.0 15.1
1961 ) of 240,4 52.4 8.2 21.8 15.6
1962 ) Jamaica 249.9 49.2 7.7 19.7 15.7
1963 ) POunds 267.4 51.0 8.1 19.1 15.9
1964 ) 280.7 58.0 8.2 20.7
Korea 1958 ) 202.9 25.7 0.9 12.7 3.6
1959 ) 215.8 22,7 0,6 10.5 2.7
1960 ) 243.1 25.3 0.5 10.4 2. 0
1961 ) Billions 293.4 36.9 1.2 12.6 3.4
1962 ) of 338.6 41.9 1.3 12.4 3.0
1963 ) Won 471.5 85.5 1.1 18.1 1.3
1964 666.7 90.2 0,7 . 13.5 0.7
1965 ) 779.4 91.1 1.0 11.7 1.1
k/Malawi 2.957 ) 41.7 8.3 1.5 19.9 1884
1958 ) 43.4 8.3 - 19.1
1959 ) Millions 45.4 3.8 8.4
1960 ) of 48.4 8.7 1.1 18.0 12.3
1961 ) Pounds -9.2 8.9 1.0 18.1 11.4
1962 ) 52,0 6.1 1.2 11.7 19.2
1963 ) 51.7 7.5 11 14.5 14.5
1964 ) 53.0 5.6 0.7 10.6 12.8
1965 ) 58.3 11.0 1.5 18.9 13.3
Morocco- 1960 ) Millions 9,130.0 960.0 1O1.2 10.5 11.5
1961 ) of 9,410,0 900.0 119.7 9.6 13.3
1962 ) Dirhams 11L,020.0 1,250.0 124.9 11.3 10.0
1963 ) 12,190.0 1,470.0 159.5 12.1 10.9
12, 049c e 0 .1 0.0 13810 11.1 9O.1
1 )04 13,030. 10, 131.6 11.1 9.1

-4-
Table 2 - Annex 2 (Cont'Id)
()(2) (3) (4)()Gross
Units, i8 n Domestic Percenta es
National Capital Road
Country- Year Currency GNP Formaation Expenditure(21(:)Counl
Nicarague7 1960 ) 351.2 47.3 7.4 13.5 15.6
1961 ) 373.0 51.4 6.7 13.8 13.0
1962 ) Mil1ions 413.5 60.3 7.2 14.6 11.9
1963 ) of 443.7 74.7 8.2 16.8 u.o
1964 ) C,A. Pesos 478.6 87.7 8.9 18.3 10.1
1965 ) 524.9 91.6 9.5 17.5 10.4
Panamna 1958 ) 371.2 52.1 7.3 14.0 14.0
1959 ) 390.3 54.8 6.7 14.0 12.2
1960 ) Millions 409.4 68.4 9.0 16.7 13.1
1961 ) of 455.5 88.8 8.3 19.5 9.3
1962 ) C. A. Pesos 494.3 96.4 11.1 19.5 11.5
1963 ) 543.3 107.7 12.5 19.8 11.6
o/
Portugal 1962 ) 83,077.0 15p662.0 658.0 18.9 4.2
1963 ) ilXions 89,332.0 15,704.o - 17.6
1964 ) or 97,538.0 17,605.0 18.0
1965 ) Escudos 107,543.0 18,794.0 625.0 17.5 3.3
Z,/
Tanzania 1960 ) 199.4 23.2 1.7 11.6 7.2
1961 ) 207.7 26,5 2.4 12.8 9.0
1962 ) Millions 226.4 24.4 3.1 10.8 12.8.
1963 ) or 249.4 24,3 3.0 9.7 12.3
1964 ) Pounds 262e9 30.1 3.1 U.5 10.3
1965 ) 262.9 36.9 3.3 14.0 8.9
Thailand 1961 ) 59.4 9.7 0.4 16.3 4.2
1962 ) Billions 64.8 2.L2 0.9 18.8 7.5
1963 ) of 68.4 15.2 0.7 22.2 4.9
1964 ) Baht 74.0 16.9 0.9 22.8 5.6
1965 ) 79.7 17.7 1.1 22.2 6.1

Table 2 - Annex 2 (Cont'd)
(1) (2) (3) (14) (5)Gross
Units in Domestic
National Capital Road, Percentages
Country Year Currency GNP Formation Ependiture 21 (3:2F
r/
Trinidad Re Tobago 1954 ) 408.1 91.7 7.8 22.5 8.5
1956 ) 521.2 125.5 10.5 214.1 8.14
1958 ) Millions 674.3 206.2 12.1 30.6 5.9
1959 ) of 728.6 249.3 12.9 34.2 5.2
1960 ) Trinidad 829.3 285.9 13.7 34.5 4.8
1961 ) and 888.14 256.3 14.2 28.8 5.5
1962 ) Tobago 948.1 298.2 13.0 31.5 4.4
1963 ) Dollars 996.9 285.5 11.5 28.6 4.0
1964 ) 13029.1 292.6 13.9 28.14 4.8
1965 ) 1,073.0 2889 14.3 26.9 4.9
3/
Uganda 1962 ) Miilions 202.5 17.7 2.0 8.7 11.4
1963 ) of 229.8 20.0 1.5 8.7 To5
1964 ) Pounds 254.14 24.2 1.5 9.5 6.0
1965 ) 291.0 32.3 1.9 11.1 5.9

-6-
So es:
a/ IBRD Economic Report, 1967.Road Expenditure: 10 percent of total road expenditure owr. estimate to represent administration expenditure.
b/ Ghana had a road fund before 1961-62, but no data are available for this period.GNP & Gross Domestic Capital Formation: IBRD Economic Report 1967.
Road Expenditure: 1961-63 - Economic Survey of the Republic of Ghana, 1963.7.5 percent of total road expenditure own estimate to represent administration expenditue.
1964-65 - IBRD Economic Report 1967.
c/ IBRD Economic Report 1965.
d/ IR Economic Report 1967.
e/ IBRD Economic Report 1967.Road Expenditure: 10 percent of total road expenditure own estimate to represent administration expenditure.
£f Reserve Bank of India Bulletin. Net Domestic Product used instead of GNP. Aggregate Investment used insteadof Gross Domestic Capital Formation.Road Expenditure: ID Projects Department.
IBRD Economic Report, 1967.Road Expendtture: The mean of road expenditures 196065 used. The mean of Gross Domestic Capital Formation
1960-65 used to get the percentage shown in column 5.
h/ GNP and Gross Domestic Capital-Formation: Statistical Abstract of Isreal.Road Expenditure.- IM Project Department.
/I Economic Report 1965. Gross Domestic Capital Foration for 164 is provsio l.
iBRD Economic Report 1966.Road Epeniture: Negigible local expenditure excluded. 1965 is a budget figure.
k/ f ID Economic Report 1967eRopd Expenditure: Figure for 1965 is an estimate.

'-7-
/ GNP & Gross Capital Formation - 1BRD Economic Report, 1966.Road Expenditure: Budget Docunents. Own estimate of administration expenditure.
m/ IBRD Economic Report, ( 966.Road &Venditure: 10 percent of total road expenditure own estimate to represent administration expenditure.
n/ INF Report 1966.Road Expenditure: Highway Appraisal Report 1966.
oa IBRD Economic Report 1967.
p/ IBRD Econonic Report 1967. Fixed Capital Fonration used instead of Gross Domestic Capital Formation. All
data refer to old Tanganyka territory.
j IBRD Economic Report 1966.Road Expenditure: Some provrincial expenditure on roads may be excluded.
r/ IBRD Economic Report 1966. GNP - Figures for 1963 and 1964 are provisional.
Road Expenditure: Central Goverment expenditure only., but it displays total investment in the country.
It includes negligible investment in waterways.
sl Until January 1., 1962 the Central Gov-errament in. Uganda earnarked grants to local-authorities for road maintenance,
IBRD Economic Report 1967. GDP used instead of GNP. Fixed Capital Formation used instead of Gross Domestic
Cipital Zcormation.Road Ex enditure: Data may be slightly distorted by the inclusion of interest payment.
-. . ... . .D , . .- . - - - - - . - - - - - - -- - - - - - - _ _ _ _ _

Table 3 -Anrex).
Countries which had Earmarked Taxes for Roads in the Periodunder Consideration but for which Data were Inco!pplete
1. Argentina (Seo Arnex 5)
2. Cameroon
3. Colombia
4. Congo Brazzavile
5. Dominican Republic 3/
6. Ecuador LV7. Liberia
8. Pakistan 6/
9. Philippines
10. Uruguay
In addition, Ghana and Uganda had eamarked taxes for a number of years.
They have been classified as non-eamarking countries after the discon-
tinuance of earmarking for roads.
I/ The road fund was discontinued in 1963-64 "As part of the extraordbeu?effort made by the Ministry of Finance this year to provide for abalanced budget for 1963-64, the allocation of revenue from taxes on
petroleum and motor vehicle licenses to a Road 5und, earmarked for the
finance of mkintenance,works and.. pap3.tareWpendditur6s on -roads andbridges. has been discontinmed. This revenue will be credited to
ordinary revenue in the future and the accumulated funds have beenutilized in part to balance the current budget."Source: The Econonry of the Federal Republic of Cameroon. Volume I,
1ain IBRD Report, April 8, 1964j, page 23.
2/ A NationaLHighway Fund was established in 1966, the setting-up wasencouraged by the IBRD. Previously,, a very small amount of revenuehad been earmarked for the maintenance of departmental roads.
3/ The legislation for earmarked taxes for roads was discontinued in 1966.
Source: INF.
v See page 10 of Main Report.
5/ Earmarking of tax':s for roads never appears to have functioned as intendedsince the earmarked revenue has been treated similarly to ordinary revenuo.
6/ Earmarking at the Central Govermnent level.

Annex 3
Earmarking CountriesTime Series Ana2ysis. Discontinuance and
Intatmof Eazking
1. Kenya discontinued its practice of earmarking for highwaqr
expenditure in 1962-63. In fact, an IB)RD recomnendation had been given
to this effect.- The percentage of road pxpenditiwe to gross invest-aent
fell fom 13.4% in 1962 to 8.0% in 1964. In 1965, it had increased to
12%. the same as in 1961. Gross investment also fell absolutely in these
two years largely because of uncertainty in conmection with the declaration
of independence. This instability makes it difficult to argue that there
is a direct connection between the abolishing of earmarked taxes and
the subsequent fall in road expenditure.
2. The road fund was discontinued in Madagascar at the end of 1963.
In 1964, the percentage of road expenditure to gross investment fell fmm
29.3 to 26.3%. In Mauritania -with the end of the Federation of French
West Africa in 1959, earmarking for roads ended. From 1959 to 1964 the
ratio of road expenditure to gross investment fell from 12.9% to 2.7%
with a drop to G.5/in 1962. Road expenditure even declined absolutely.,
not following a sharp increase in gross investment.e/
1/ It was argued that because of the budgetary situation., the arrange-ments for meeting maintenance costs. sh6uld be, decided.5annfia2y by theGoverunment, rather than by allocating receipts from specific taxesto the road fund.
Source: IBRD, the Economic Development of Kenya. Report of an EconomicSurvey Mtission, December 1962, p.131.
2/ An attempt to set up a new road fund was made inl 1964. Legislationwas passed, but the arrangement never worked. (Draft Appraisal ofRoad Project in Mauritania, 1967.

% of Ro-ad e'zsv0 0Vt 0ross Investn-vnt
- - _ _ F 1F-
_ T1
I 77 TLTZI -T- 1''4±I'I
I I j 111 iii
I . - F±1z1T±I-,{~2I 2 ::YVEiE'> VT 7L,F T II ~
-. 4 P
It .1 1 7
-7-T- -F .....J.. Iil
T-Ji TV' F 1 T,I1- i
LL+ 7 t

'~~ISG GCeOJD 0o q. 9rBr pg)lL2&V_Te jo c'
IIiiK H Lil ___ __ _
I F 44
HI -'I T4i "i I
42jjT' 4LiFF'- n 7 1 7J~ 1+- ATI~ i 1 !J~_JI
I I IH4LK F I__ II4-I if-F-' 'K I frni 7 jjHV i FT 1 .i -FFH 4iIuIL-~--v-4 1141 f
411 j-~Lji-H I r~t 1±1_II I 1~Fi .~ I I _________ _________ ~ jj~1 fi
I I f 1 1 jj iI If If,f' Il ' I,'II
f fi7I H-4 ii4I L_____LLL -~ HIfI ;~Li .4. 1Ff- '' f1I L II
IJI I IF1 ~ f f r~1 I 4.~I I4it 'If- I i Ir-- -F h I C.) f~i-IIfJfFr-
Hf IL 1 it r F---1h.~t~zJ1 +4 II ' I
2~ LllFf ~ I I Tliuih.4I ;F1II I t TI iIT
I I I C 0 _ I0 01X

~,U4sOUII V~
o~. arej~PU~a I0'
H I
IH i
__J $IIjzbI. 4 L Ij t II
41ri -- -T
4__ _ -- 4± 4-4L
1'' .- .-T
J-f
t 1xauuvJ - : Iatjv 'a
£ 13 . It, ,,N , 3H! O .I 0 t ___

H-- 3
F-T -!I ,9OJ
l4!mz,zf I4 ___ - X -ii- - - -~ LL i 1 -i-H-1, 1 11
- Jii+j FLW2IT mi -- 'I ily I - F
.I I I hIL I e X -r i
_-J
Lii
U AL-flF~4f~~41HI-4--I IFi±I
~ --- ~(l217i~r H V iihil ~JLLi~-4
OhLO"Fm-hI _1 ) aX
IP-

10 X 10 TO I HE INCH 46 077804 1 >4 . i -7 x I *:.1 .Fs Gr ii
KJEUFrCL a ESSER CO.
. Chart 5 - Annex 4P' >Peru
. C*f't;!;- -1- - t I t|- ti w-1- -8 -
&<X-1t
6i .. .. .- .-L
il,I -:,, -'i-HA- -f-,._
k . ' 'I - - -I_ _ _
+1 L. -H'l r LI-
I §i II .K. 1 I vrLlTh-
3 III I T ___
+- r i l i'I- - -- I-
_ro nvsten

10 X 10 T) TOHt iNCH A;1 07CC
KcurrrL t SrR c0.
_ Chart 6 Annex 4____________ AHadagascar _ _ __ _ _ _ _ _ _ _ _ _ _ _ _ _ _ _ _
. i 1.t Iii -i- -j I- I - - i - - l - F
* ; .~ .l -; -i~ I e - -- I - . -;.i|F4 - j X+ i __X
.r
ivL
26
Q .. 7 5 Fi + 2L Kn r-jz t o G a ±mL ii . t4~ I 1 .! _
14'4 + JL±j [ -FF[FrI
K -.- :--~jt LL±
27- L jL-L~~jLzr IF II ±iri___
Ij Ti Il ii V1
dp iI ±r F4 hr____ r - ji-t-; I_t,__
1 II!' -
0 10 35 20 % of Earmarked Taxes to Gross .Investment

X.uilseGu[ scoJD o0 GqZ3Bja:-- AJUrp E Jo % E I o
L4 Ii 111i 'II X 1 1
J=g-i A_ -°
(~~-ij 1e o -2 _iN tF
' *Ci ' Ti X OI It}'u
I . _
4' IIj I IT
IJ II
Fa-1i -4-
I-L-211 lI3_Suj V &L3J.1114 It
_ LLIieLO j9V HOJ ]tl IH- jv, IiVIIxLFo

Annex 5
Argenina
1 . In Argentina a shortage of funds caused its present ten-year
road program to be delayed by two years. It is reported that the major
cause of the delay was a 50% shortfall in earmarked revenues in 1961 due
to a new interpretation of the gasoline law; a further aggravation was
the default of the revenue collecting agency in making full payment of
the highway authority's legitimate revenue. 2/ Subsequentlys the devalu-
ation of the peso resulted in price increases, which raised the cost of
the program to nearly the double amount in pesos. Without a. proportiona4
increase in earmarked tax revenues, and without additiomal funds out of
the budget, the highway authority was unable to pay contractors on time,
which weakened its position to make contractors comply strictly with spec-
ifications and completion dates.
2. In 1965, extra budgetary increases in fuel taxes were proposed,
but never effected. A proportion of these tax receipts would have been
allocated to the National Road Fund.
3. It appeais tlat earmarking of funds for highway purposes never
really was accepted in Argentina. Earmarking never provided imach of a
guarantee for continuity in highway expenditure.
1 IBRD Economic Report, 1965, page 20.

October 6, 1967
Annex 6
Earmarkin Countries
Cross section anatysis
1. Simple re rion anas
The regression equation for the 18 earmarking countries is:
R = a + b T
I I
where R = Road expenditure, I Gross investment and T - Earmarked Taxes.
We obtain R - 4.8 + l,5 T (see page 6 above). The correlation coeffi-
Icient is 0.7 and is significantly different from zero at a level of sig-
nificance of one percent.
multiple regression analysis
When.GNP/capita is added as a second independent variable our
equation becomes R = a + b T + cZ; where Z = GNP/Capita; we obtain the
Ifollowing equation for all the eighteen earmarking countries. (Figures
within brackets express sampling errors of regression coefficients)
R = 5.2 + 1.5 T - 0.22Z; where Z - GNP/capita e.xpressed
I I in hundreds of US$
(0-3 ) (0.25)2
The coefficient of determination Ro is 050. The multipl.e
correlation coeffi-ient is significantly different from zero at a level
of significance of 1 percent. The partial correlation coefficient of
road expenditure/MDI regressed on (RIP/capita is 0.0. It is seen that CINP
per capita does not help in explaining more of the variation in the
dependent variable.
3. If New Zealand is excluded, our regression equation becomes:
R = 4.3 + 1,,6 T + 0.09Z 2
II R 0.50(0,4) ( 0 95)o
The multiple correlation coefficient is significantly different
from zero at a level of significance of 1 percent.
4. If Madagascar is excluded we obtain:
R = 7.0 + 0.6 T + OeOlZ 2
I I Ro =0.01
(0.4) (0.23)
The multiple correlation coefficient is not significantly i:;Y jre:i
from zero at a level of significance of 5 percent.

p2
5. Time Series Analysis
Analogously to the cross section analysis above, road expenditure/ODI was regressed upon earmarked taxes/GDI and GNP/capita for Brazil,Ethiopia, Kenya, New Zealand and Peru. aNP/capita was measured in domesticcurrency at constant prices. The earmarked taxes/GDI variable is signi-ficant at the . percent level for all countries but Peru, in explainingthe variation in the dependent variable. (See page 8 above, for theresults of the simple .rgres'sion afiasis) Our second independentvariable GNP/capita is not significant at thp 5 percent lev4 for any ofthe five countries. From this we chnclude tat the relev^ qua14pn isthe simple regression R f a + T.
6. .Analysis with dum variables
An additional multiple regression analysis was made to determinethe explanatory value of GNP/capita. To increase the number of observa-tions, the time series for the individual countries were groupedtogether by using dunmm variables. For each of our five countries, thedummy variable has the value of 1 for the number of observations, otherwiseit is 0. In a generalized form our equation becomes:
R - a + b T + cZ + d1 xl + d2 X2 + *-- + d5 5I Tf
GNP/capita was measured in US$ constant prices at 1964 exchange Vates.Again GNP/capita turned out as a non significant variable in explainingvariations in R, while T is strongly significant at the 1 percent level./
I IThe dummy variables were all non significant. We conclude that in
our subsample, there are no inter country characteristics which do explainthe relative allocation of funds to the road sector.
7. Spurious correlation
In principle our results may be biased because of spuriouzcorrelations since both highway expenditures and earmarked taxes havebeen divided by gross domestic investment. This eventualAty wars notconsidered very likely at the time of writing. But to con rinpi ourselves,a further test was made. The relative variability of M2I, road expendi-ture and earmarked taxes Tas calculated for five countries Brazil, Kenya,Madagascar, New Zealand and PeB. We obtain a relative index of variabi-lity through dividing the standard deviation of the time series by themean for the respective series. This allowed us to compare the relativevariability for each country of CtDI versus that of road expenditure andearmarked taxes. Of these five countries, only one, Peru, displayed alarger variability of GDI, than of both road expenditure and earmarkedtaxes, In other words for only 10 out of a total of 47 observations, mightwe suspect a substantial degree of spurious correlation. This evidenceshould be sufficient to satisfy us, that there are no significant distor-tions in our results because of spurious correlation,
l/ The test for serial correlation at the 5 percent level reveals no suchbias..