Embed Size (px)
Citation preview
1GROSS DOMESTIC PRODUCTStatistics Botswana
STATISTICS BOTSWANA
GROSS DOMESTIC PRODUCTQuarter 3, 2018
Statistics Botswana. Private Bag 0024 BotswanaTel: (267) 367 1300. Fax: (267) 395 2201. Email: [email protected] Website: www.statsbots.org.bw
Copyrights © Statistics Botswana 2018
2 3GROSS DOMESTIC PRODUCT GROSS DOMESTIC PRODUCTStatistics Botswana Statistics Botswana
Published by
STATISTICS BOTSWANAPrivate Bag 0024, GaboroneTel: 3671300 Fax: 3952201
E-mail: [email protected]: www.statsbots.org.bw
December 2018
Copyright © Statistics Botswana 2018
GROSS DOMESTIC PRODUCTQuarter 3, 2018
4 5GROSS DOMESTIC PRODUCT GROSS DOMESTIC PRODUCTStatistics Botswana Statistics Botswana
TABLE OF CONTENTS
TABLE OF CONTENTS.........................................................................................................................................................41. Preface.........................................................................................................................................................................52. Gross Domestic Product (GDP)..................................................................................................................................62.1 Revisions in this release..............................................................................................................................................62.2 Third quarter GDP.......................................................................................................................................................72.2.2 Components of GDP by Type of Expenditure.....................................................................................................83. Annual National Accounts.........................................................................................................................................83.1 Annual Percentage changes..................................................................................................................................83.2 Gross Domestic Expenditure....................................................................................................................................103.3 Compensation of Employees by Economic Activity (COE)...............................................................................113.4 GDP by Income approach.....................................................................................................................................113.5 Gross National Income (GNI).................................................................................................................................123.6 Gross National Disposable Income (GNDI)..........................................................................................................123.7 Gross Savings (GS)...................................................................................................................................................123.8 Consumption of Fixed Capital (CFC)....................................................................................................................133.9 Capital Stock............................................................................................................................................................134.0 Public and Private Capital Stock...........................................................................................................................13
Figure 1: Real GDP growth rates...................................................................................................................................7Figure 2: Components of Gross Domestic Expenditure at 2006 prices.....................................................................8Figure 3: Annual percentage change in real GDP....................................................................................................10Figure 4 : Components of Gross Domestic Expenditure at constant 2006 price...................................................11Figure 5: Relations between Value Added, Compensation of employees and Operating Surplus....................12Figure 6: Relations between GNI, GNDI and Savings...............................................................................................13Figure 7: Nominal and Real GDP Per Capita (Pula)..................................................................................................14
1. Preface
The statistical release contains the third quarter of 2018 Gross Domestic Product estimates by economic activity, components of final demand at current and constant prices as well as revised annual estimates.
Botswana’s National Accounts are compiled according to the 1993 System of National Accounts (1993 SNA). The accounts presented in this publication adhere to the enhanced General Data Dissemination System (e-GDDS) of the International Monetary Fund (IMF), which sets out standards on coverage, periodicity and timeliness of data.
The estimates are provisional and subject to change. First estimates are normally based on limited data and hence cannot be precise and absolute. The figures are revised after receiving finalized or audited data from companies in which some differences and inconsistencies in the previously published data may be observed.
These estimates are not seasonally adjusted hence the variations may differ depending on the quarters.
Gross Domestic Product (GDP) for the third quarter of 2018 reached P48, 912.3 million compared to P46, 967.4 million registered during the previous quarter. This represents a quarterly increase of 4.1 percent in nominal terms between the two periods. During the quarter under review, Trade, Hotels & Restaurants remained the major contributor to GDP by 18.3 percent followed by Mining & quarrying, General Government and Finance & Business services at 18.0, 14.2 and 13.8 percent respectively. The contribution of other sectors was below 7.0 percent with Water & Electricity being the lowest at 1.6 percent.
Real Gross Domestic Product for the third quarter of 2018 increased by 4.2 percent. The increase was attributed to the significant growth in real value added of Water & Electricity, Trade, Hotels & Restaurants and Transport & Communications by 42.6, 6.9 and 5.8 percent respectively.
Statistics Botswana acknowledges and appreciates the contribution of all stakeholders in the production of this report.
For more information and further enquiries, contact the Directorate of Stakeholder Relations at 3671300 or [email protected]. All Statistics Botswana outputs/publications are available on the website at www.statsbots.org.bw and at the Statistics Botswana Information Resource Center (Head-Office, Gaborone).
______________________Dr. Burton S. MguniStatistician GeneralDecember 2018

6 7GROSS DOMESTIC PRODUCT GROSS DOMESTIC PRODUCTStatistics Botswana Statistics Botswana
Real Gross Domestic Product Total Final Consumption Gross Fixed Capital Formation
Percentage Change
Quarter-on -Quarter Year-on- Year Quarter-on- QuarterYear-on
-Year Quarter-on -QuarterYear-on-
Year
First quarter 2014 -2.5 3.3 2.9 2.4 -0.7 9.3
Second quarter 2014 3.3 4.6 -4.5 3.5 -1.8 -3.5
Third quarter 2014 1.3 6.0 -0.5 6.1 -6.2 -5.7
Fourth quarter 2014 0.6 2.7 5.0 2.8 16.3 6.3
First quarter 2015 -2.4 2.8 2.3 2.1 -6.1 0.5
Second quarter 2015 0.2 -0.3 -3.1 3.6 7.8 10.4
Third quarter 2015 -3.9 -5.4 1.9 6.1 4.0 22.4
Fourth quarter 2015 2.6 -3.6 1.6 2.6 -2.0 3.2
First quarter 2016 3.5 2.3 2.3 2.6 -5.8 3.5
Second quarter 2016 1.8 3.9 -4.9 0.7 11.0 6.6
Third quarter 2016 -1.1 6.9 3.9 2.6 -1.4 1.1
Fourth quarter 2016 0.1 4.3 1.9 3.0 0.3 3.5
First quarter 2017 0.2 0.9 1.3 2.0 -12.6 -3.9
Second quarter 2017 1.8 0.9 -0.6 6.6 -4.2 -17.1
Third quarter 2017 1.5 3.5 3.3 6.0 7.6 -9.5
Fourth quarter 2017 2.8 6.4 1.4 5.4 6.5 -4.0
First quarter 2018 -1.6 4.5 0.6 4.7 -2.8 6.7
Second quarter 2018 2.5 5.2 0.6 6.0 1.3 12.8
Third quarter 2018 0.5 4.2 1.8 4.5 2.7 7.6
2. Gross Domestic Product (GDP)
2.1 Revisions in this release
Revisions have been made to the annual national accounts estimates published in December 2017 and quarterly Gross Domestic Product (GDP) estimates published in September 2018. The changes were due to the updated source data and have affected Agriculture, Mining, Manufacturing, Water & Electricity, Trade, Hotels & Restaurants, Transport & communications, Finance & Business services, General Government, Compensation of Employees by General Government.
Table A1: Revisions in real percentage changes for the same quarters of the previous year
Table A2: Key figures
2.2 Third quarter GDP
2.2.1 Production Account
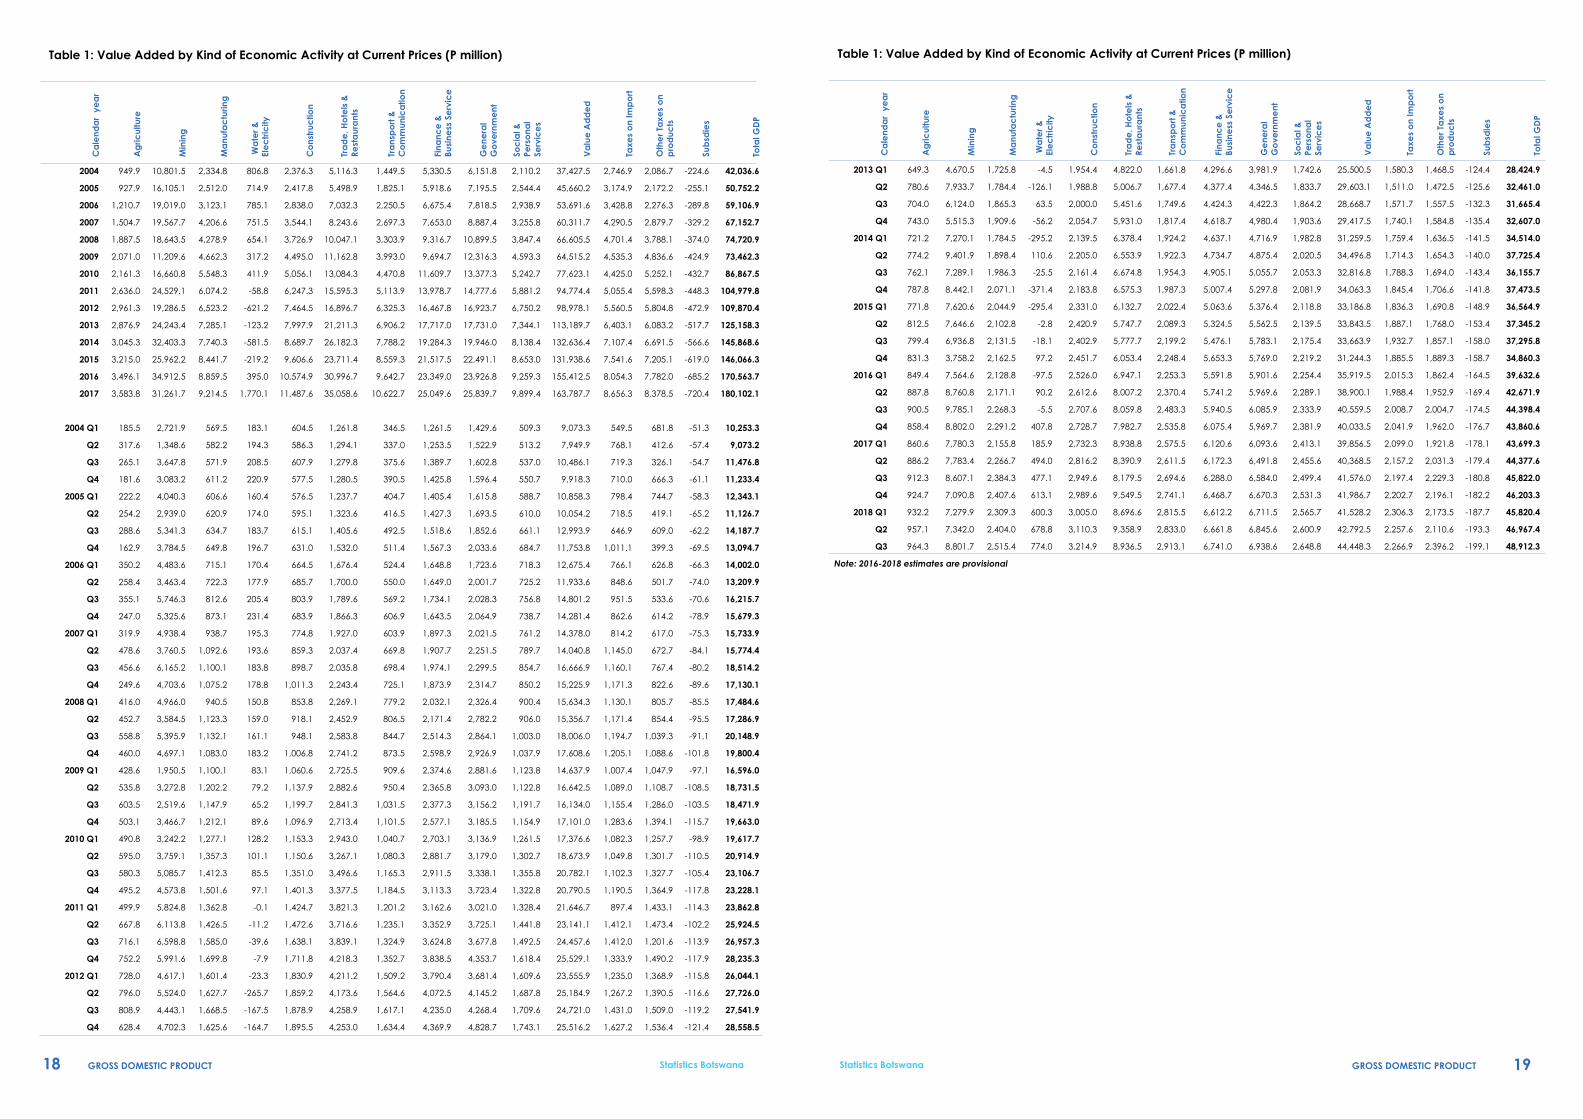
The estimated GDP at current prices for the third quarter of 2018 was P48, 912.3 million compared to P46, 967.4 million registered in the second quarter of 2018 (See Table 1).
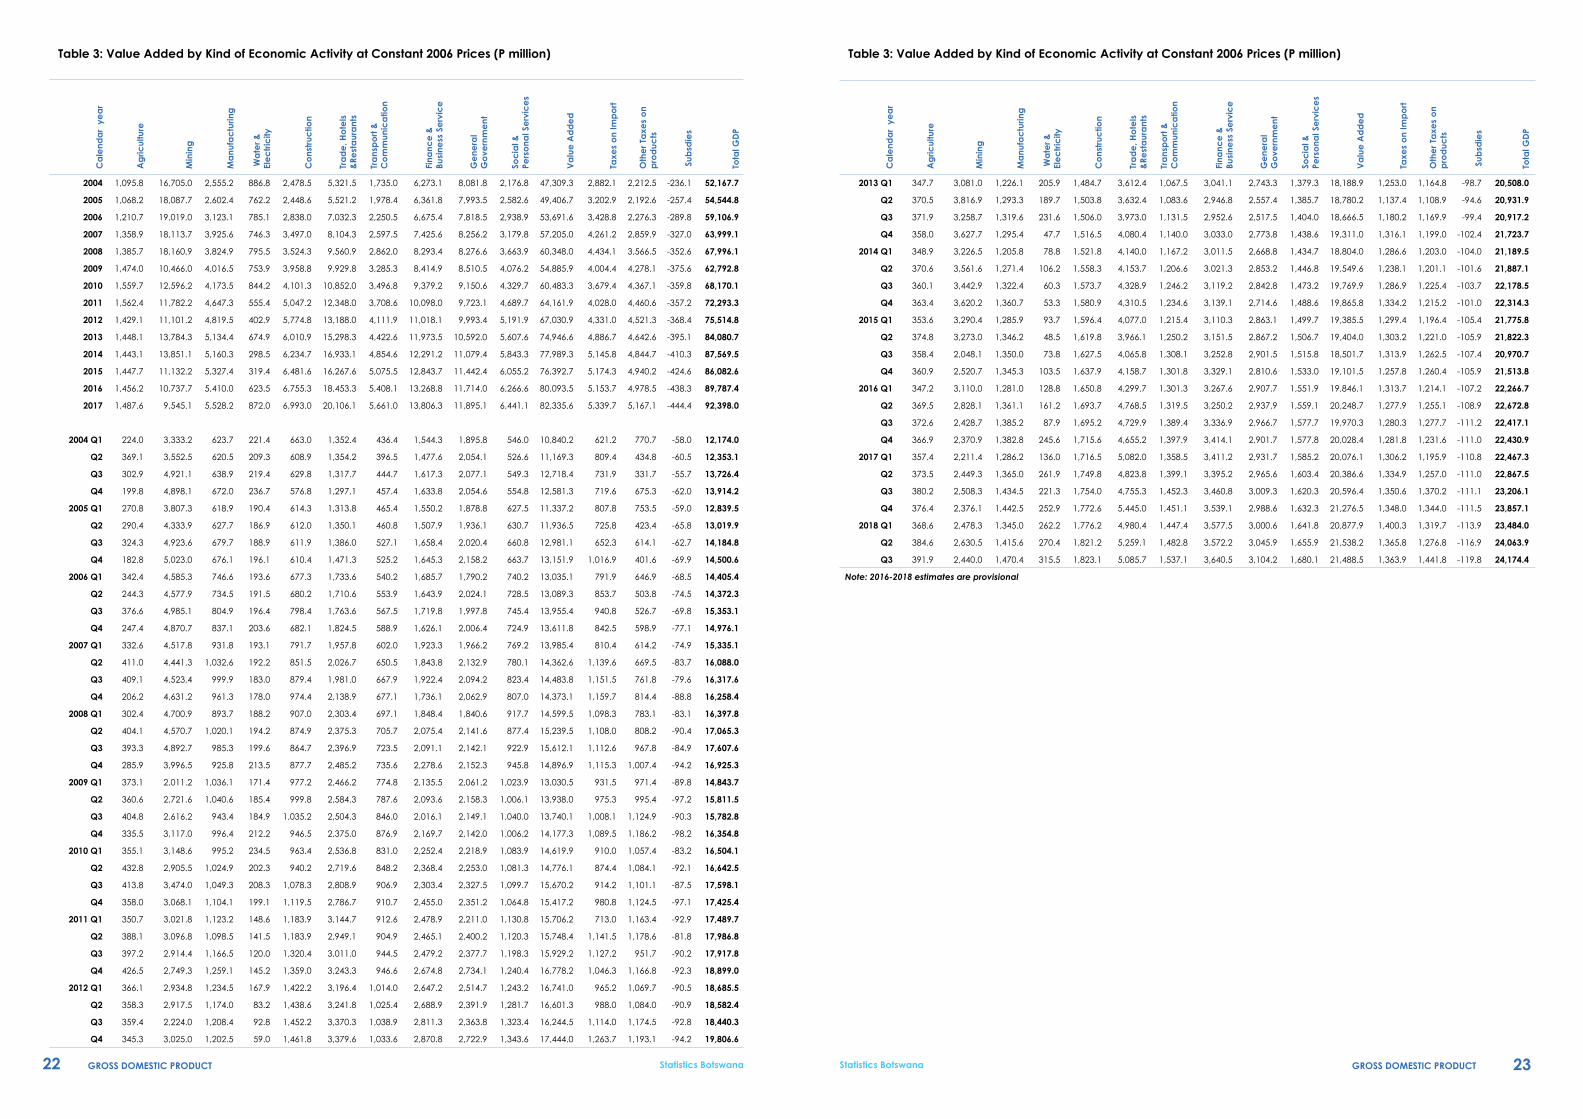
The estimated GDP at constant 2006 prices for the third quarter of 2018 was P24, 174.4 million compared to P24, 063.9 million recorded in the second quarter of 2018 (See Table 3).
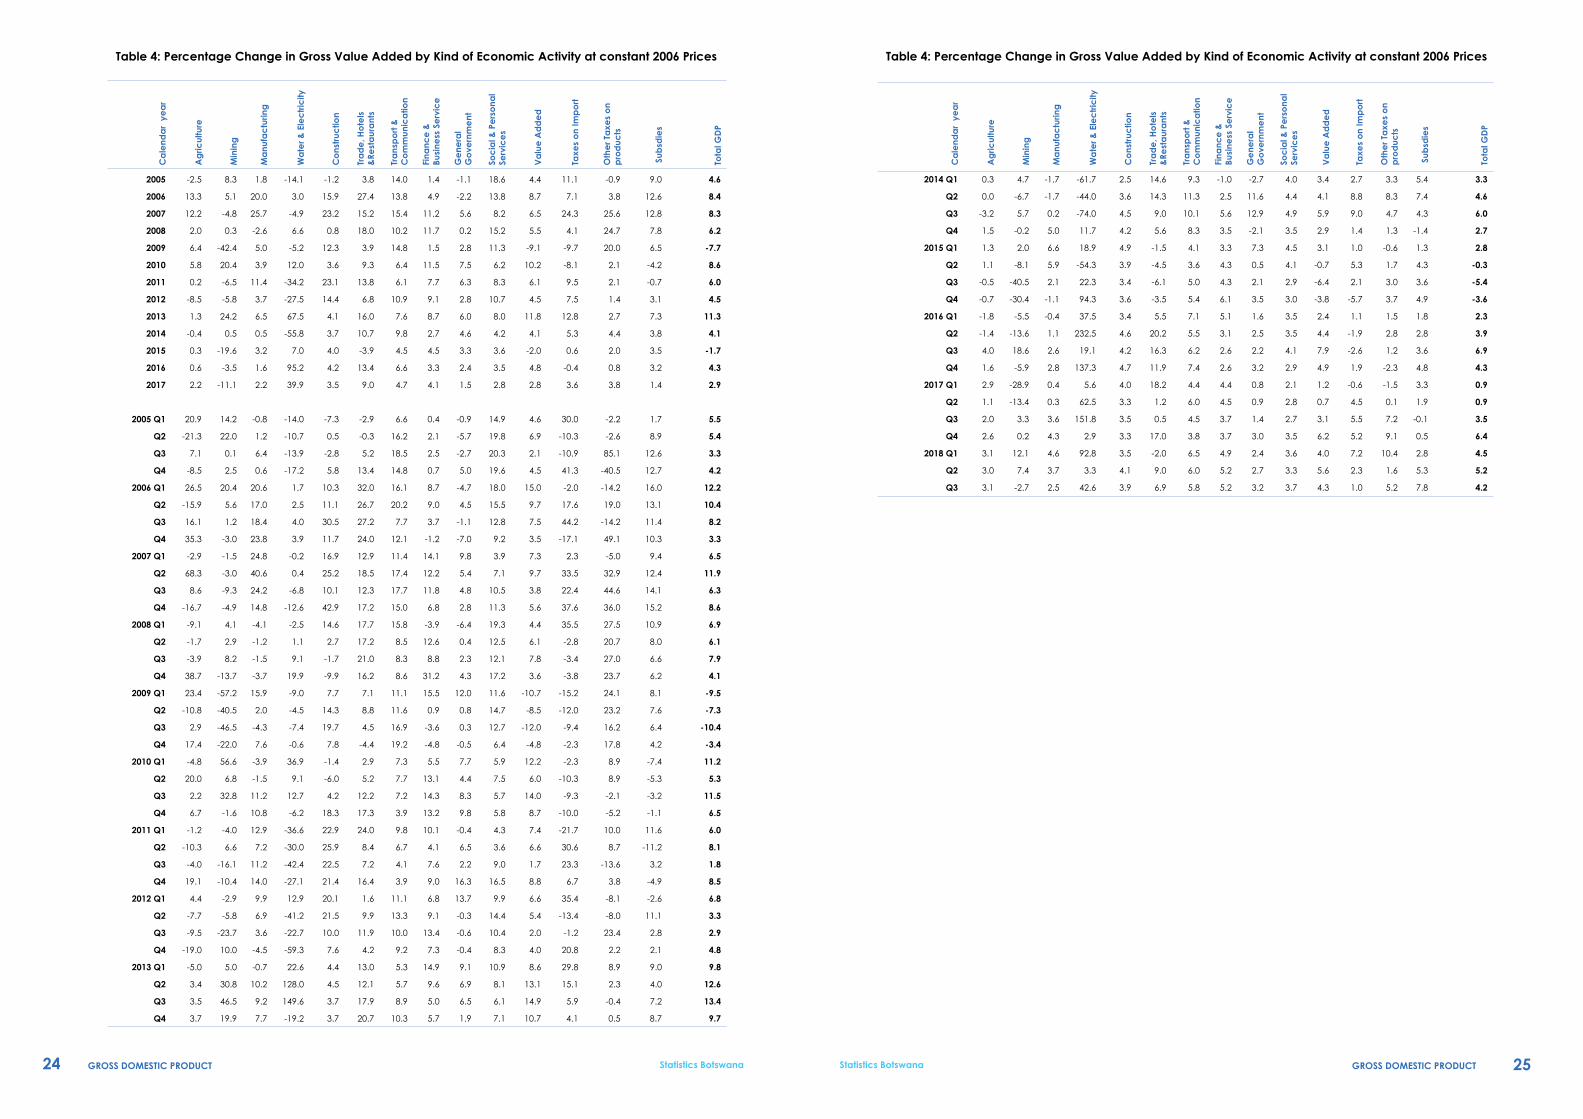
The domestic economy increased by 4.2 percent in the third quarter of 2018 compared to an increase of 3.5 percent recorded in the same quarter of 2017. The increase was attributed to real value added of Water & Electricity, Trade, Hotels & Restaurants and Transport & Communications which increased by 42.6, 6.9 and 5.8 percent respectively. All other industries recorded positive growths of more than 2.5 percent with the exception of mining which decreased by 2.7 percent (See Table 4).
Water and Electricity value added at constant 2006 prices for the third quarter of 2018 was P315.5 million compared to P221.3 million registered in the same quarter of 2017, recording an increase of 42.6 percent. In the third quarter of 2018, Electricity recorded a positive value added of P81.2 million compared to a negative value added of P10.0 million registered in the same quarter of 2017. Water sector recorded a value added of P236.3.9 million compared to P232.6 million registered in the same quarter of the previous year registering a slight increase of 1.6 percent. Water consumption in kilolitres from all Management Centers went down by 3.7 percent during the quarter under review. Even though the Utilities sector registered the highest growth, its contribution to GDP is still the lowest.
Trade, Hotels and Restaurants real value added increased by 6.9 percent in the third quarter of 2018 compared to an increase of 0.5 percent registered in the same quarter of the previous year. The positive growth is attributed to an increase in real value added of Wholesale, Retail Trade and Hotels & Restaurants sub sectors by 9.6, 7.7 and 7.3 percent respectively. The significant increase in the Wholesale value added is due to positive performance of downstream diamond industries during the quarter under review.
Transport and Communications value added increased by 5.8 percent in the third quarter of 2018. The growth was mainly attributed to the increase in real value added of Post & Communications, Air and Road transport by 6.9, 5.8 and 5.5 percent respectively.
The decrease in the real Mining value added of 2.7 percent was mainly driven by Diamond value added which decreased by 4.8 percent. Diamond production in carats decreased by 4.8 percent in the third quarter of 2018 compared to an increase of 33.0 percent recorded in the same quarter of 2017.
Non-mining GDP increased by 5.0 percent in the third quarter of 2018 compared to 3.5 percent registered in the same quarter of the previous year.
Publication September 2018 Publication December 2018
Industries 2017Q1 2017Q2 2017Q3 2017Q4 2018Q1 2018Q2 2017Q1 2017Q2 2017Q3 2017Q4 2018Q1 2018Q2 2018Q3
Agriculture 2.9 1.1 2.0 2.6 3.1 3.0 2.9 1.1 2.0 2.6 3.1 3.0 3.1
Mining -28.9 -13.5 3.2 0.2 12.1 7.4 -28.9 -13.4 3.3 0.2 12.1 7.4 -2.7
Manufacturing 0.2 0.0 3.3 4.1 4.4 3.6 0.4 0.3 3.6 4.3 4.6 3.7 2.5
Water & Electricity -47.9 7.2 15.7 -35.1 120.9 -7.4 5.6 62.5 151.8 2.9 92.8 3.3 42.6
Trade, Hotels & Restaurants 19.0 2.5 -9.3 18.1 -0.7 8.8 18.2 1.2 0.5 17.0 -2.0 9.0 6.9
Transport & Communications 4.4 6.0 4.5 3.8 6.5 5.9 4.4 6.0 4.5 3.8 6.5 6.0 5.8
Finance & Business Services 5.2 5.5 4.8 4.6 5.4 6.1 4.4 4.5 3.7 3.7 4.9 5.2 5.2
General Government 1.5 1.8 1.9 3.8 2.8 2.9 0.8 0.9 1.4 3.0 2.4 2.7 3.2
Total GDP 0.9 1.0 1.1 6.5 4.8 5.3 0.9 0.9 3.5 6.4 4.5 5.2 4.2

8 9GROSS DOMESTIC PRODUCT GROSS DOMESTIC PRODUCTStatistics Botswana Statistics Botswana
Figure 1: Real GDP growth rates2.2.2 Components of GDP by Type of Expenditure
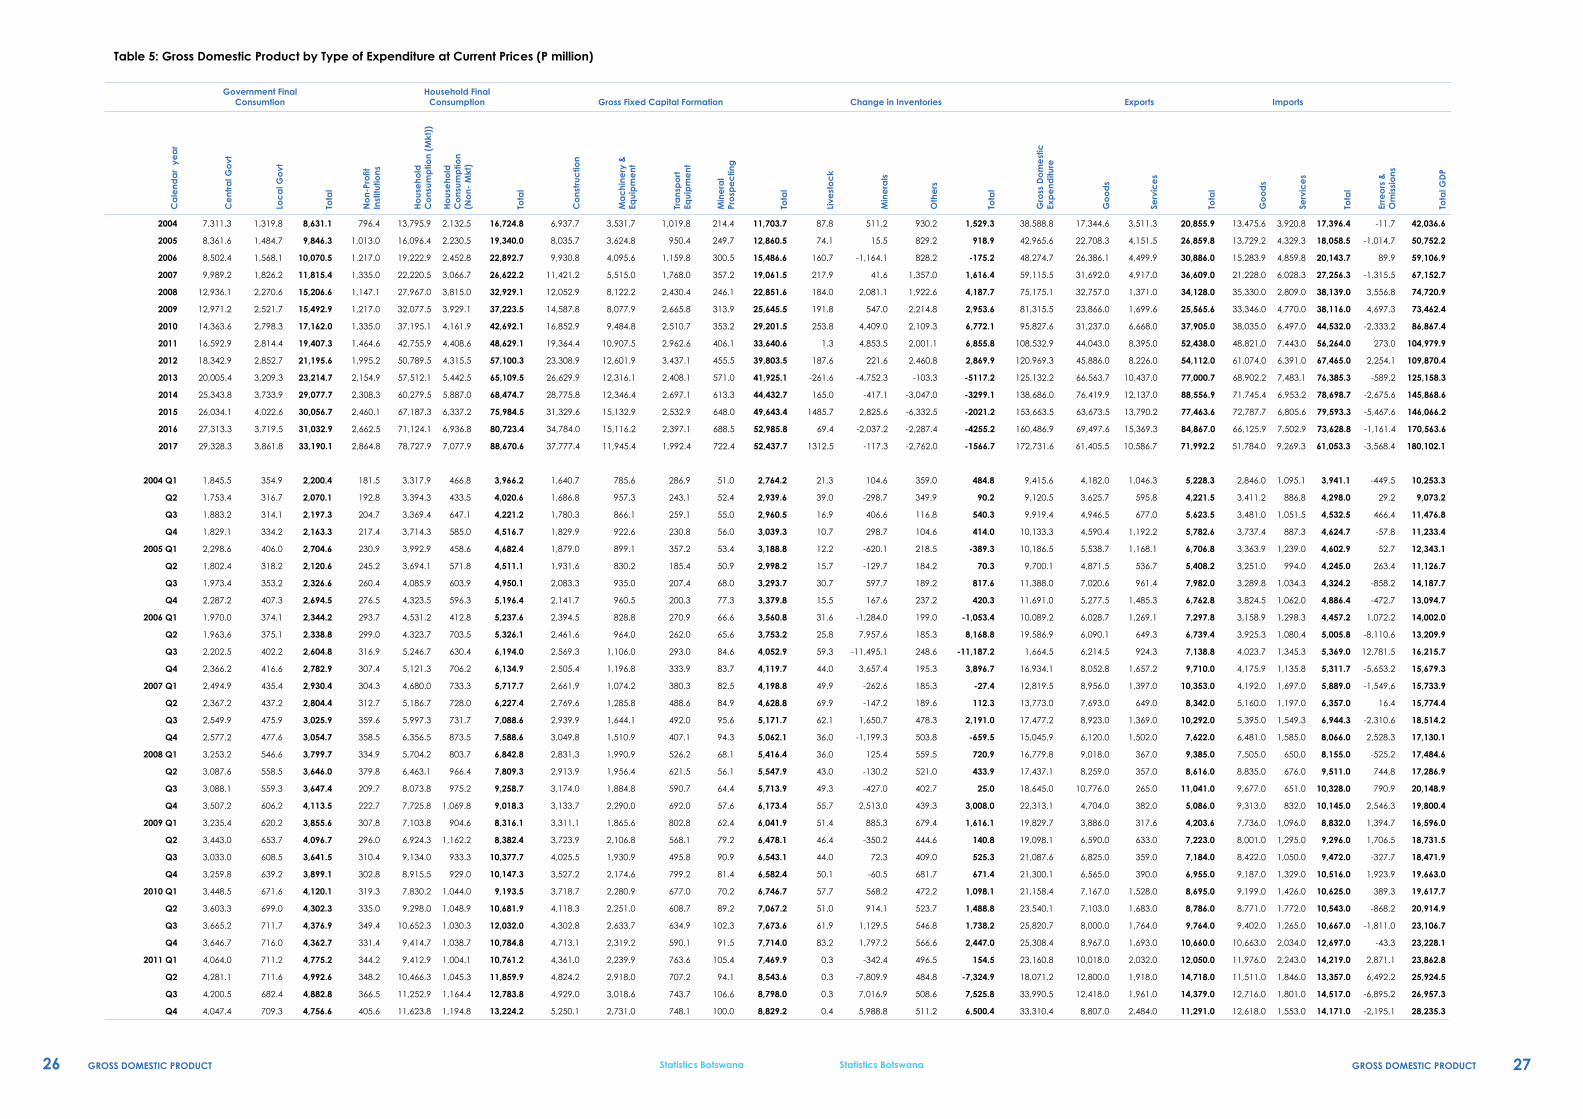
Total final consumption expenditure recorded an increase of 4.5 percent in the third quarter of 2018, whereas in the same quarter of the previous year it rose by 6.0 percent. Household final consumption increased by 3.8 percent, Government final consumption increased by 6.1 percent and Fixed capital formation increased by 7.6 percent in the quarter under review.
In the case of foreign trade, real exports of goods and services increased by 13.5 percent in the third quarter of 2018 compared to a decrease of 31.9 percent realized in the same quarter of 2017.
Imports of goods and services recorded an increase of 0.6 percent during the quarter under review, compared to 16.4 percent decline realized in the same quarter of the previous year.
Figure 2: Components of Gross Domestic Expenditure at 2006 prices
3. Annual National Accounts
3.1 Annual Percentage changes
Table A3: Key figures at constant 2006 prices
GDP at current prices stood at P180, 102.1 million in 2017 compared to P170, 563.7 million in 2016, recording an increase of 5.6 percent.
Real GDP increased by 2.9 percent in 2017 compared to 4.3 percent increase in 2016. The increase in real GDP was mainly attributed to Water & Electricity, Trade, Hotels & Restaurants, and Transport & Communications industries which recorded an increase in value added of 39.9, 9.0, and 4.7 percent respectively. (See table 4).
Trade, Hotels & Restaurants increase in real value added of 9.0 percent is attributed to the wholesale sub industry which comprises the downstream diamond industries. In 2017, the wholesale value added increased by 25.9 percent compared to 74.1 percent increase registered in 2016. During 2017, diamond prices remained relatively stable.
Water and Electricity value added at constant 2006 prices for the year 2017 was P872.0 million compared to P623.2 million registered in the previous year, recording an increase of 39.9 percent. In 2017, Electricity recorded a negative value added of P38.0 million compared to a negative value added of P183.1 million registered in the previous year. The improvement in the Electricity real value added is attributed to an increase in local electricity production by 17.9 percent and a decrease of 42.7 percent in electricity imports.
A decrease of 11.1 percent in the real value added of the Mining sector was mainly due to Copper/Nickel and Soda Ash value added which declined by 98.8 and 22.6 percent respectively. BCL and Tati Nickel copper mines were placed under provisional liquidation in October 2016. Soda Ash production in tonnes decreased by 20.0 percent because the mine was put under care and maintenance during the second quarter of 2017. During the year under review, diamond value added increased by 9.9 percent.
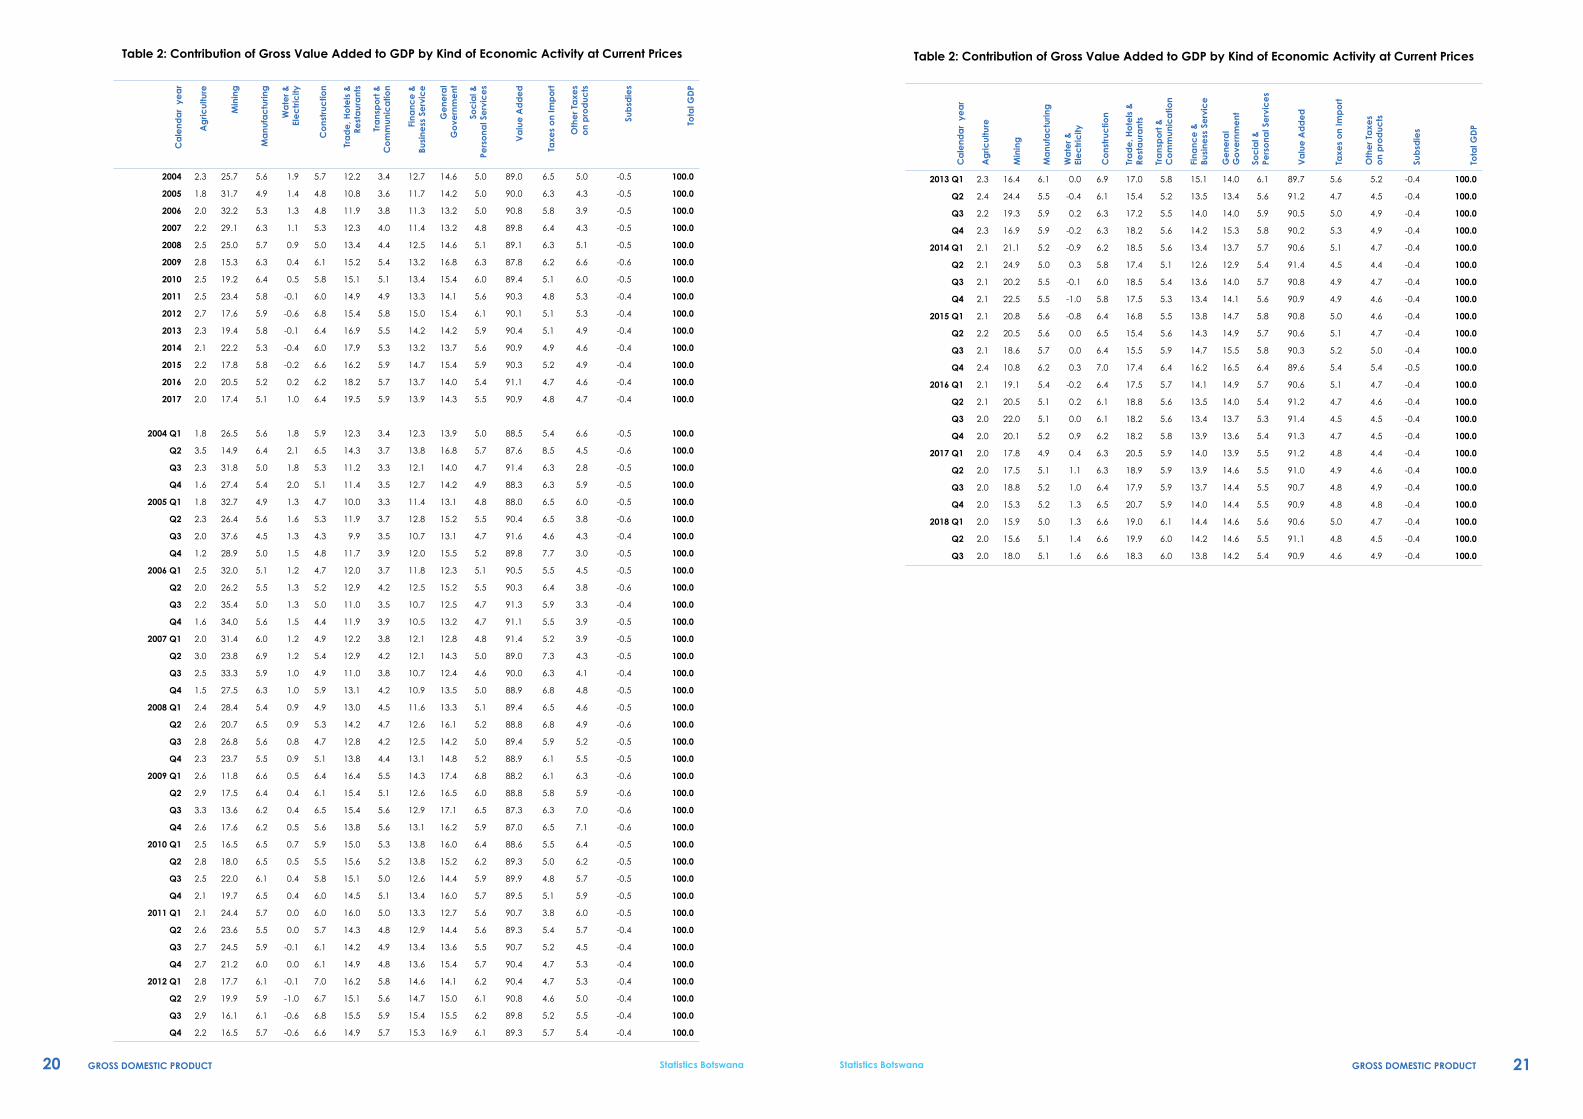
Contribution to GDP by industry is shown in Table 2. In 2017, Trade, Hotels & Restaurants and Mining industries remained major contributors to GDP, their contributions stood at 19.5 percent and 17.4 percent respectively.
Table A 4: Annual percentage change in Real GDP by Economic ActivityFigure 3: Annual percentage change in real GDP
2013
2014 2015 2016
2017
Total final consumption 11.3 3.6 3.6 2.3 5.0
Gross fixed capital for-mation
2.0 1.5 8.8 3.6 -8.8
Exports 37.8 7.7 -16.3 1.0 -12.8
Imports 10.0 0.2 2.3 -5.1 -23.4
Gross domestic product 11.3 4.1 -1.7 4.3 2.9
GDP per Capita 9.1 2.2 -3.3 2.7 1.3
2013 2014 2015 2016 2017
Agriculture 1.3 -0.4 0.3 0.6 2.2
Mining 24.2 0.5 -19.6 -3.5 -11.1
Manufacturing 6.5 0.5 3.2 1.6 2.2
Water & Electricity 67.5 -55.8 7.0 95.2 39.9
Construction 4.1 3.7 4.0 4.2 3.5
Trade, Hotels & Restaurants 16.0 10.7 -3.9 13.4 9.0
Transport and Communication 7.6 9.8 4.5 6.6 4.7
Business Service 8.7 2.7 4.5 3.3 4.1
General Government 6.0 4.6 3,3 2.4 1.5
Social and personal Services 8.0 4.2 3.6 3.5 2.8
Total Value Added 12.0 4.1 -2.0 4.8 2.8
Taxes Less Subsidies 7.7 4.9 1.1 0.0 3.8
Total GDP 11.3 4.1 -1.7 4.3 2.9

10 11GROSS DOMESTIC PRODUCT GROSS DOMESTIC PRODUCTStatistics Botswana Statistics Botswana
Table A6: Annual percentage changes in National Accounts Aggregates
3.3 Compensation of Employees by Economic Activity (COE)
Compensation of employees is the total remuneration payable by an enterprise to the employees for work done during the accounting period. There are three main components of compensation of employees; being wages & salaries in cash, wages & salaries in kind, and employer’s social contributions (consists of social contributions payable by the employer for the benefit of their employees).
Compensation of employees increased by 8.4 percent from a revised P39, 226.9 million in 2016 to P42, 530.9 million in 2017 (See Table 7).
3.4 GDP by Income approach
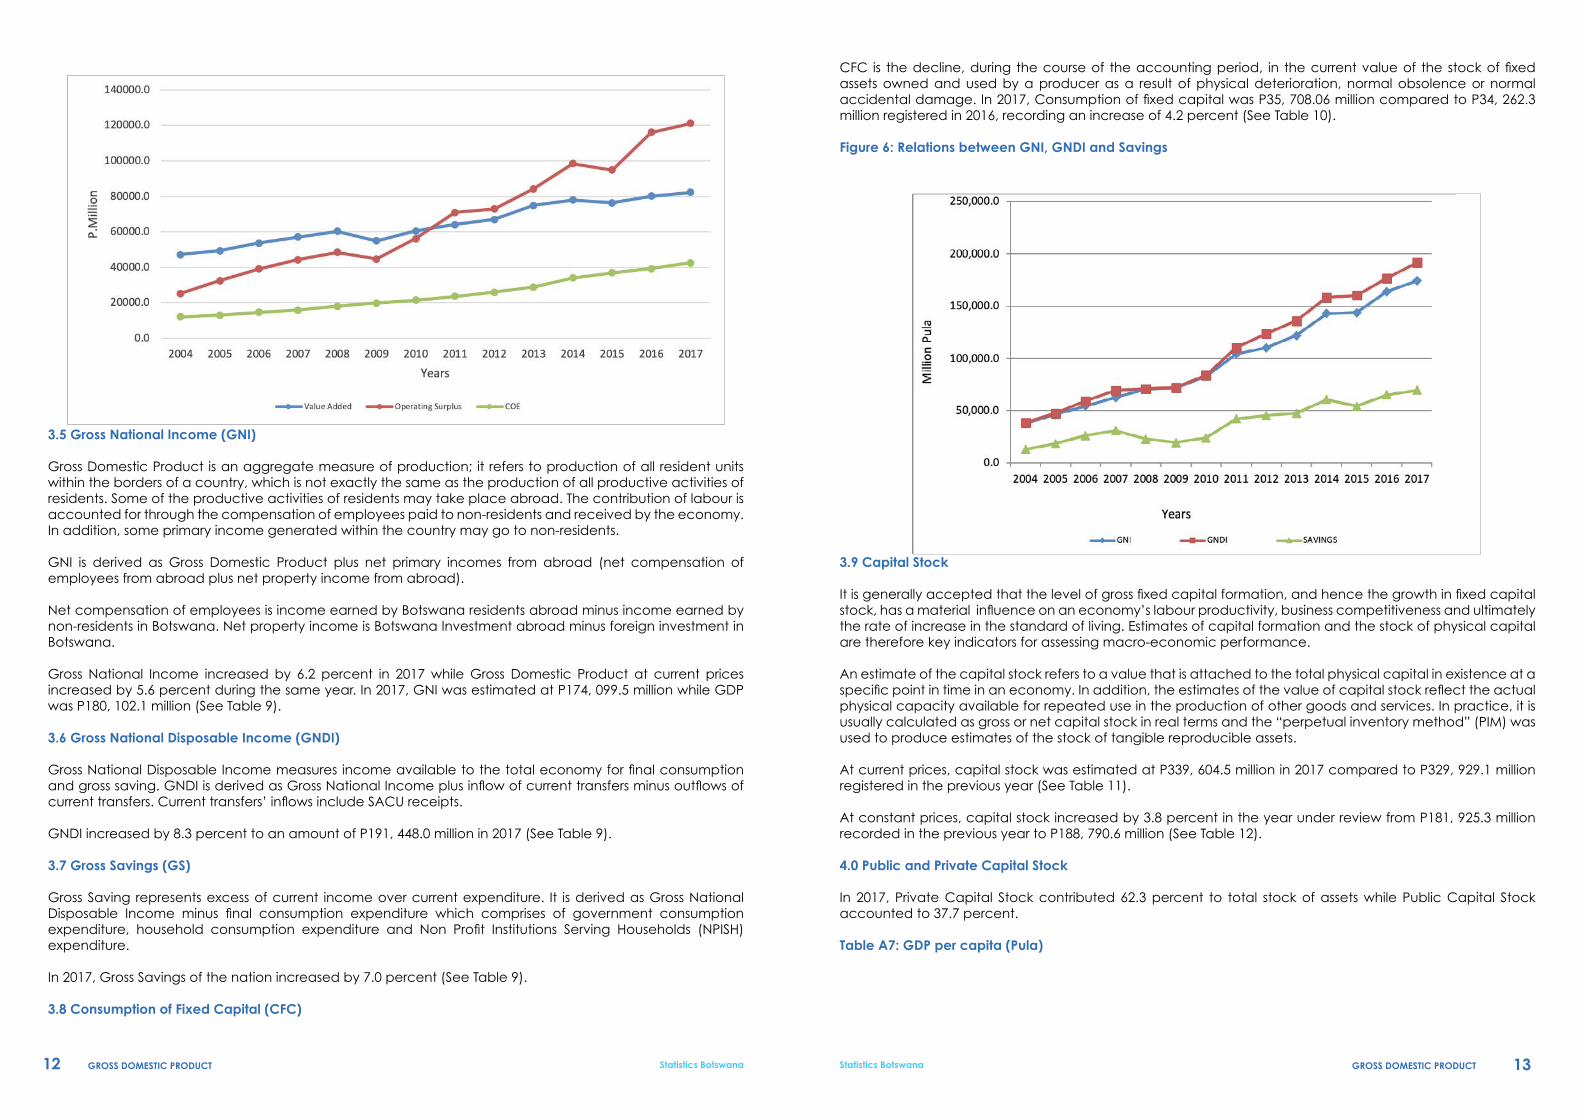
GDP by income approach is the sum of primary incomes distributed by resident producer units. This is calculated as the sum of compensation of employees by economic activity plus taxes on production plus consumption of fixed capital and operating surplus which is calculated as a residual. Operating surplus increased by 4.4 percent in 2017 (See T able 8).
Figure 5: Relations between Value Added, Compensation of employees and Operating Surplus
3.2 Gross Domestic Expenditure
Real Gross Domestic Expenditure growth was insignificant in 2017 accounting to 0.03 percent. Total final demand increased by 5.0 percent compared to 2.3 percent realised in 2016. Gross Fixed Capital Formation went down by 8.8 percent.
Table A 5: Annual percentage change in Real Domestic Expenditure
In case of foreign trade, Real exports of goods and services decreased by 12.8 percent in 2017 compared to an increase of 1.0 percent in 2016, while real imports of goods and services in 2017 declined by 23.4 percent as opposed to a decrease of 5.1 percent in 2016.
Figure 4 : Components of Gross Domestic Expenditure at constant 2006 price
2015 2016 2017
Total final consumption expenditure 3.5 2.3 5.0
Household final consumption expenditure 4.0 2.2 6.5
Final consumption of NPISH 3.2 3.0 3.3
Government final consumption expenditure 2.5 2.3 1.5
Gross Capital formation expenditure 8.8 3.6 -8.8
Gross Domestic expenditure 9.3 -0.3 0.03
2015 2016 2017
Gross National Income 0.7 14.1 6.2
Gross National Disposable Income 1.3 10.3 8.3
Gross Savings -10.7 20.0 7.0
Capital Stock 6.9 6.3 3.8
Consumption of Fixed Capital -0.5 15.0 4.2
Compensation of Employees 8.5 6.5 8.4
12 13GROSS DOMESTIC PRODUCT GROSS DOMESTIC PRODUCTStatistics Botswana Statistics Botswana
3.5 Gross National Income (GNI)
Gross Domestic Product is an aggregate measure of production; it refers to production of all resident units within the borders of a country, which is not exactly the same as the production of all productive activities of residents. Some of the productive activities of residents may take place abroad. The contribution of labour is accounted for through the compensation of employees paid to non-residents and received by the economy. In addition, some primary income generated within the country may go to non-residents.
GNI is derived as Gross Domestic Product plus net primary incomes from abroad (net compensation of employees from abroad plus net property income from abroad).
Net compensation of employees is income earned by Botswana residents abroad minus income earned by non-residents in Botswana. Net property income is Botswana Investment abroad minus foreign investment in Botswana.
Gross National Income increased by 6.2 percent in 2017 while Gross Domestic Product at current prices increased by 5.6 percent during the same year. In 2017, GNI was estimated at P174, 099.5 million while GDP was P180, 102.1 million (See Table 9).
3.6 Gross National Disposable Income (GNDI)
Gross National Disposable Income measures income available to the total economy for final consumption and gross saving. GNDI is derived as Gross National Income plus inflow of current transfers minus outflows of current transfers. Current transfers’ inflows include SACU receipts.
GNDI increased by 8.3 percent to an amount of P191, 448.0 million in 2017 (See Table 9).
3.7 Gross Savings (GS)
Gross Saving represents excess of current income over current expenditure. It is derived as Gross National Disposable Income minus final consumption expenditure which comprises of government consumption expenditure, household consumption expenditure and Non Profit Institutions Serving Households (NPISH) expenditure.
In 2017, Gross Savings of the nation increased by 7.0 percent (See Table 9).
3.8 Consumption of Fixed Capital (CFC)
CFC is the decline, during the course of the accounting period, in the current value of the stock of fixed assets owned and used by a producer as a result of physical deterioration, normal obsolence or normal accidental damage. In 2017, Consumption of fixed capital was P35, 708.06 million compared to P34, 262.3 million registered in 2016, recording an increase of 4.2 percent (See Table 10).
Figure 6: Relations between GNI, GNDI and Savings
3.9 Capital Stock
It is generally accepted that the level of gross fixed capital formation, and hence the growth in fixed capital stock, has a material influence on an economy’s labour productivity, business competitiveness and ultimately the rate of increase in the standard of living. Estimates of capital formation and the stock of physical capital are therefore key indicators for assessing macro-economic performance.
An estimate of the capital stock refers to a value that is attached to the total physical capital in existence at a specific point in time in an economy. In addition, the estimates of the value of capital stock reflect the actual physical capacity available for repeated use in the production of other goods and services. In practice, it is usually calculated as gross or net capital stock in real terms and the “perpetual inventory method” (PIM) was used to produce estimates of the stock of tangible reproducible assets.
At current prices, capital stock was estimated at P339, 604.5 million in 2017 compared to P329, 929.1 million registered in the previous year (See Table 11).
At constant prices, capital stock increased by 3.8 percent in the year under review from P181, 925.3 million recorded in the previous year to P188, 790.6 million (See Table 12).
4.0 Public and Private Capital Stock
In 2017, Private Capital Stock contributed 62.3 percent to total stock of assets while Public Capital Stock accounted to 37.7 percent.
Table A7: GDP per capita (Pula)

14 15GROSS DOMESTIC PRODUCT GROSS DOMESTIC PRODUCTStatistics Botswana Statistics Botswana
Figure 7: Nominal and Real GDP Per Capita (Pula)
Year Nominal GDP per capita Real GDP per capita
1994 7,869.20 22,793.40
1995 8,800.80 23,789.80
1996 10,550.80 24,562.50
1997 11,707.10 25,958.70
1998 12,615.70 25,437.90
1999 15,627.30 27,583.60
2000 17,991.20 27,814.80
2001 19,077.20 27,229.80
2002 20,097.50 28,349.60
2003 21,311.80 29,113.90
2004 23,650.10 29,350.00
2005 28,026.80 30,121.20
2006 32,038.30 32,038.30
2007 35,727.90 34,050.10
2008 39,021.10 35,509.20
2009 37,656.10 32,186.90
2010 43,705.90 34,298.60
2011 51,844.30 35,702.10
2012 53,116.00 36,507.00
2013 59,313.90 39,846.80
2014 67,867.9 40,743.3
2015 66,822.0 39,380.8
2016 76,840.9 40,450.2
2017 79,903.2 40,992.9
16 17GROSS DOMESTIC PRODUCT GROSS DOMESTIC PRODUCTStatistics Botswana Statistics Botswana
TABLESGROSS DOMESTIC PRODUCT
Quarter 3, 2018
TABLESGROSS DOMESTIC PRODUCT
Quarter 3, 2018
18 19GROSS DOMESTIC PRODUCT GROSS DOMESTIC PRODUCTStatistics Botswana Statistics Botswana
Table 1: Value Added by Kind of Economic Activity at Current Prices (P million)
Ca
lend
ar
yea
r
Ag
ricul
ture
Min
ing
Ma
nufa
ctu
ring
Wa
ter &
El
ec
tric
ity
Co
nstr
uctio
n
Tra
de
, Ho
tels
&
Rest
aur
ant
s
Tra
nsp
ort
&
Co
mm
unic
atio
n
Fina
nce
&
Busi
ness
Se
rvic
e
Ge
nera
l G
ove
rnm
ent
Soc
ial &
Pe
rso
nal
Serv
ice
s
Va
lue
Ad
de
d
Taxe
s o
n Im
po
rt
Oth
er T
axe
s o
n p
rod
ucts
Sub
sdie
s
Tota
l GD
P
2004 949.9 10,801.5 2,334.8 806.8 2,376.3 5,116.3 1,449.5 5,330.5 6,151.8 2,110.2 37,427.5 2,746.9 2,086.7 -224.6 42,036.6
2005 927.9 16,105.1 2,512.0 714.9 2,417.8 5,498.9 1,825.1 5,918.6 7,195.5 2,544.4 45,660.2 3,174.9 2,172.2 -255.1 50,752.2
2006 1,210.7 19,019.0 3,123.1 785.1 2,838.0 7,032.3 2,250.5 6,675.4 7,818.5 2,938.9 53,691.6 3,428.8 2,276.3 -289.8 59,106.9
2007 1,504.7 19,567.7 4,206.6 751.5 3,544.1 8,243.6 2,697.3 7,653.0 8,887.4 3,255.8 60,311.7 4,290.5 2,879.7 -329.2 67,152.7
2008 1,887.5 18,643.5 4,278.9 654.1 3,726.9 10,047.1 3,303.9 9,316.7 10,899.5 3,847.4 66,605.5 4,701.4 3,788.1 -374.0 74,720.9
2009 2,071.0 11,209.6 4,662.3 317.2 4,495.0 11,162.8 3,993.0 9,694.7 12,316.3 4,593.3 64,515.2 4,535.3 4,836.6 -424.9 73,462.3
2010 2,161.3 16,660.8 5,548.3 411.9 5,056.1 13,084.3 4,470.8 11,609.7 13,377.3 5,242.7 77,623.1 4,425.0 5,252.1 -432.7 86,867.5
2011 2,636.0 24,529.1 6,074.2 -58.8 6,247.3 15,595.3 5,113.9 13,978.7 14,777.6 5,881.2 94,774.4 5,055.4 5,598.3 -448.3 104,979.8
2012 2,961.3 19,286.5 6,523.2 -621.2 7,464.5 16,896.7 6,325.3 16,467.8 16,923.7 6,750.2 98,978.1 5,560.5 5,804.8 -472.9 109,870.4
2013 2,876.9 24,243.4 7,285.1 -123.2 7,997.9 21,211.3 6,906.2 17,717.0 17,731.0 7,344.1 113,189.7 6,403.1 6,083.2 -517.7 125,158.3
2014 3,045.3 32,403.3 7,740.3 -581.5 8,689.7 26,182.3 7,788.2 19,284.3 19,946.0 8,138.4 132,636.4 7,107.4 6,691.5 -566.6 145,868.6
2015 3,215.0 25,962.2 8,441.7 -219.2 9,606.6 23,711.4 8,559.3 21,517.5 22,491.1 8,653.0 131,938.6 7,541.6 7,205.1 -619.0 146,066.3
2016 3,496.1 34,912.5 8,859.5 395.0 10,574.9 30,996.7 9,642.7 23,349.0 23,926.8 9,259.3 155,412.5 8,054.3 7,782.0 -685.2 170,563.7
2017 3,583.8 31,261.7 9,214.5 1,770.1 11,487.6 35,058.6 10,622.7 25,049.6 25,839.7 9,899.4 163,787.7 8,656.3 8,378.5 -720.4 180,102.1
2004 Q1 185.5 2,721.9 569.5 183.1 604.5 1,261.8 346.5 1,261.5 1,429.6 509.3 9,073.3 549.5 681.8 -51.3 10,253.3
Q2 317.6 1,348.6 582.2 194.3 586.3 1,294.1 337.0 1,253.5 1,522.9 513.2 7,949.9 768.1 412.6 -57.4 9,073.2
Q3 265.1 3,647.8 571.9 208.5 607.9 1,279.8 375.6 1,389.7 1,602.8 537.0 10,486.1 719.3 326.1 -54.7 11,476.8
Q4 181.6 3,083.2 611.2 220.9 577.5 1,280.5 390.5 1,425.8 1,596.4 550.7 9,918.3 710.0 666.3 -61.1 11,233.4
2005 Q1 222.2 4,040.3 606.6 160.4 576.5 1,237.7 404.7 1,405.4 1,615.8 588.7 10,858.3 798.4 744.7 -58.3 12,343.1
Q2 254.2 2,939.0 620.9 174.0 595.1 1,323.6 416.5 1,427.3 1,693.5 610.0 10,054.2 718.5 419.1 -65.2 11,126.7
Q3 288.6 5,341.3 634.7 183.7 615.1 1,405.6 492.5 1,518.6 1,852.6 661.1 12,993.9 646.9 609.0 -62.2 14,187.7
Q4 162.9 3,784.5 649.8 196.7 631.0 1,532.0 511.4 1,567.3 2,033.6 684.7 11,753.8 1,011.1 399.3 -69.5 13,094.7
2006 Q1 350.2 4,483.6 715.1 170.4 664.5 1,676.4 524.4 1,648.8 1,723.6 718.3 12,675.4 766.1 626.8 -66.3 14,002.0
Q2 258.4 3,463.4 722.3 177.9 685.7 1,700.0 550.0 1,649.0 2,001.7 725.2 11,933.6 848.6 501.7 -74.0 13,209.9
Q3 355.1 5,746.3 812.6 205.4 803.9 1,789.6 569.2 1,734.1 2,028.3 756.8 14,801.2 951.5 533.6 -70.6 16,215.7
Q4 247.0 5,325.6 873.1 231.4 683.9 1,866.3 606.9 1,643.5 2,064.9 738.7 14,281.4 862.6 614.2 -78.9 15,679.3
2007 Q1 319.9 4,938.4 938.7 195.3 774.8 1,927.0 603.9 1,897.3 2,021.5 761.2 14,378.0 814.2 617.0 -75.3 15,733.9
Q2 478.6 3,760.5 1,092.6 193.6 859.3 2,037.4 669.8 1,907.7 2,251.5 789.7 14,040.8 1,145.0 672.7 -84.1 15,774.4
Q3 456.6 6,165.2 1,100.1 183.8 898.7 2,035.8 698.4 1,974.1 2,299.5 854.7 16,666.9 1,160.1 767.4 -80.2 18,514.2
Q4 249.6 4,703.6 1,075.2 178.8 1,011.3 2,243.4 725.1 1,873.9 2,314.7 850.2 15,225.9 1,171.3 822.6 -89.6 17,130.1
2008 Q1 416.0 4,966.0 940.5 150.8 853.8 2,269.1 779.2 2,032.1 2,326.4 900.4 15,634.3 1,130.1 805.7 -85.5 17,484.6
Q2 452.7 3,584.5 1,123.3 159.0 918.1 2,452.9 806.5 2,171.4 2,782.2 906.0 15,356.7 1,171.4 854.4 -95.5 17,286.9
Q3 558.8 5,395.9 1,132.1 161.1 948.1 2,583.8 844.7 2,514.3 2,864.1 1,003.0 18,006.0 1,194.7 1,039.3 -91.1 20,148.9
Q4 460.0 4,697.1 1,083.0 183.2 1,006.8 2,741.2 873.5 2,598.9 2,926.9 1,037.9 17,608.6 1,205.1 1,088.6 -101.8 19,800.4
2009 Q1 428.6 1,950.5 1,100.1 83.1 1,060.6 2,725.5 909.6 2,374.6 2,881.6 1,123.8 14,637.9 1,007.4 1,047.9 -97.1 16,596.0
Q2 535.8 3,272.8 1,202.2 79.2 1,137.9 2,882.6 950.4 2,365.8 3,093.0 1,122.8 16,642.5 1,089.0 1,108.7 -108.5 18,731.5
Q3 603.5 2,519.6 1,147.9 65.2 1,199.7 2,841.3 1,031.5 2,377.3 3,156.2 1,191.7 16,134.0 1,155.4 1,286.0 -103.5 18,471.9
Q4 503.1 3,466.7 1,212.1 89.6 1,096.9 2,713.4 1,101.5 2,577.1 3,185.5 1,154.9 17,101.0 1,283.6 1,394.1 -115.7 19,663.0
2010 Q1 490.8 3,242.2 1,277.1 128.2 1,153.3 2,943.0 1,040.7 2,703.1 3,136.9 1,261.5 17,376.6 1,082.3 1,257.7 -98.9 19,617.7
Q2 595.0 3,759.1 1,357.3 101.1 1,150.6 3,267.1 1,080.3 2,881.7 3,179.0 1,302.7 18,673.9 1,049.8 1,301.7 -110.5 20,914.9
Q3 580.3 5,085.7 1,412.3 85.5 1,351.0 3,496.6 1,165.3 2,911.5 3,338.1 1,355.8 20,782.1 1,102.3 1,327.7 -105.4 23,106.7
Q4 495.2 4,573.8 1,501.6 97.1 1,401.3 3,377.5 1,184.5 3,113.3 3,723.4 1,322.8 20,790.5 1,190.5 1,364.9 -117.8 23,228.1
2011 Q1 499.9 5,824.8 1,362.8 -0.1 1,424.7 3,821.3 1,201.2 3,162.6 3,021.0 1,328.4 21,646.7 897.4 1,433.1 -114.3 23,862.8
Q2 667.8 6,113.8 1,426.5 -11.2 1,472.6 3,716.6 1,235.1 3,352.9 3,725.1 1,441.8 23,141.1 1,412.1 1,473.4 -102.2 25,924.5
Q3 716.1 6,598.8 1,585.0 -39.6 1,638.1 3,839.1 1,324.9 3,624.8 3,677.8 1,492.5 24,457.6 1,412.0 1,201.6 -113.9 26,957.3
Q4 752.2 5,991.6 1,699.8 -7.9 1,711.8 4,218.3 1,352.7 3,838.5 4,353.7 1,618.4 25,529.1 1,333.9 1,490.2 -117.9 28,235.3
2012 Q1 728.0 4,617.1 1,601.4 -23.3 1,830.9 4,211.2 1,509.2 3,790.4 3,681.4 1,609.6 23,555.9 1,235.0 1,368.9 -115.8 26,044.1
Q2 796.0 5,524.0 1,627.7 -265.7 1,859.2 4,173.6 1,564.6 4,072.5 4,145.2 1,687.8 25,184.9 1,267.2 1,390.5 -116.6 27,726.0
Q3 808.9 4,443.1 1,668.5 -167.5 1,878.9 4,258.9 1,617.1 4,235.0 4,268.4 1,709.6 24,721.0 1,431.0 1,509.0 -119.2 27,541.9
Q4 628.4 4,702.3 1,625.6 -164.7 1,895.5 4,253.0 1,634.4 4,369.9 4,828.7 1,743.1 25,516.2 1,627.2 1,536.4 -121.4 28,558.5
Table 1: Value Added by Kind of Economic Activity at Current Prices (P million)
Ca
lend
ar
yea
r
Ag
ricul
ture
Min
ing
Ma
nufa
ctu
ring
Wa
ter &
El
ec
tric
ity
Co
nstr
uctio
n
Tra
de
, Ho
tels
&
Rest
aur
ant
s
Tra
nsp
ort
&
Co
mm
unic
atio
n
Fina
nce
&
Busi
ness
Se
rvic
e
Ge
nera
l G
ove
rnm
ent
Soc
ial &
Pe
rso
nal
Serv
ice
s
Va
lue
Ad
de
d
Taxe
s o
n Im
po
rt
Oth
er T
axe
s o
n p
rod
ucts
Sub
sdie
s
Tota
l GD
P
2013 Q1 649.3 4,670.5 1,725.8 -4.5 1,954.4 4,822.0 1,661.8 4,296.6 3,981.9 1,742.6 25,500.5 1,580.3 1,468.5 -124.4 28,424.9
Q2 780.6 7,933.7 1,784.4 -126.1 1,988.8 5,006.7 1,677.4 4,377.4 4,346.5 1,833.7 29,603.1 1,511.0 1,472.5 -125.6 32,461.0
Q3 704.0 6,124.0 1,865.3 63.5 2,000.0 5,451.6 1,749.6 4,424.3 4,422.3 1,864.2 28,668.7 1,571.7 1,557.5 -132.3 31,665.4
Q4 743.0 5,515.3 1,909.6 -56.2 2,054.7 5,931.0 1,817.4 4,618.7 4,980.4 1,903.6 29,417.5 1,740.1 1,584.8 -135.4 32,607.0
2014 Q1 721.2 7,270.1 1,784.5 -295.2 2,139.5 6,378.4 1,924.2 4,637.1 4,716.9 1,982.8 31,259.5 1,759.4 1,636.5 -141.5 34,514.0
Q2 774.2 9,401.9 1,898.4 110.6 2,205.0 6,553.9 1,922.3 4,734.7 4,875.4 2,020.5 34,496.8 1,714.3 1,654.3 -140.0 37,725.4
Q3 762.1 7,289.1 1,986.3 -25.5 2,161.4 6,674.8 1,954.3 4,905.1 5,055.7 2,053.3 32,816.8 1,788.3 1,694.0 -143.4 36,155.7
Q4 787.8 8,442.1 2,071.1 -371.4 2,183.8 6,575.3 1,987.3 5,007.4 5,297.8 2,081.9 34,063.3 1,845.4 1,706.6 -141.8 37,473.5
2015 Q1 771.8 7,620.6 2,044.9 -295.4 2,331.0 6,132.7 2,022.4 5,063.6 5,376.4 2,118.8 33,186.8 1,836.3 1,690.8 -148.9 36,564.9
Q2 812.5 7,646.6 2,102.8 -2.8 2,420.9 5,747.7 2,089.3 5,324.5 5,562.5 2,139.5 33,843.5 1,887.1 1,768.0 -153.4 37,345.2
Q3 799.4 6,936.8 2,131.5 -18.1 2,402.9 5,777.7 2,199.2 5,476.1 5,783.1 2,175.4 33,663.9 1,932.7 1,857.1 -158.0 37,295.8
Q4 831.3 3,758.2 2,162.5 97.2 2,451.7 6,053.4 2,248.4 5,653.3 5,769.0 2,219.2 31,244.3 1,885.5 1,889.3 -158.7 34,860.3
2016 Q1 849.4 7,564.6 2,128.8 -97.5 2,526.0 6,947.1 2,253.3 5,591.8 5,901.6 2,254.4 35,919.5 2,015.3 1,862.4 -164.5 39,632.6
Q2 887.8 8,760.8 2,171.1 90.2 2,612.6 8,007.2 2,370.4 5,741.2 5,969.6 2,289.1 38,900.1 1,988.4 1,952.9 -169.4 42,671.9
Q3 900.5 9,785.1 2,268.3 -5.5 2,707.6 8,059.8 2,483.3 5,940.5 6,085.9 2,333.9 40,559.5 2,008.7 2,004.7 -174.5 44,398.4
Q4 858.4 8,802.0 2,291.2 407.8 2,728.7 7,982.7 2,535.8 6,075.4 5,969.7 2,381.9 40,033.5 2,041.9 1,962.0 -176.7 43,860.6
2017 Q1 860.6 7,780.3 2,155.8 185.9 2,732.3 8,938.8 2,575.5 6,120.6 6,093.6 2,413.1 39,856.5 2,099.0 1,921.8 -178.1 43,699.3
Q2 886.2 7,783.4 2,266.7 494.0 2,816.2 8,390.9 2,611.5 6,172.3 6,491.8 2,455.6 40,368.5 2,157.2 2,031.3 -179.4 44,377.6
Q3 912.3 8,607.1 2,384.3 477.1 2,949.6 8,179.5 2,694.6 6,288.0 6,584.0 2,499.4 41,576.0 2,197.4 2,229.3 -180.8 45,822.0
Q4 924.7 7,090.8 2,407.6 613.1 2,989.6 9,549.5 2,741.1 6,468.7 6,670.3 2,531.3 41,986.7 2,202.7 2,196.1 -182.2 46,203.3
2018 Q1 932.2 7,279.9 2,309.3 600.3 3,005.0 8,696.6 2,815.5 6,612.2 6,711.5 2,565.7 41,528.2 2,306.3 2,173.5 -187.7 45,820.4
Q2 957.1 7,342.0 2,404.0 678.8 3,110.3 9,358.9 2,833.0 6,661.8 6,845.6 2,600.9 42,792.5 2,257.6 2,110.6 -193.3 46,967.4
Q3 964.3 8,801.7 2,515.4 774.0 3,214.9 8,936.5 2,913.1 6,741.0 6,938.6 2,648.8 44,448.3 2,266.9 2,396.2 -199.1 48,912.3
Note: 2016-2018 estimates are provisional
20 21GROSS DOMESTIC PRODUCT GROSS DOMESTIC PRODUCTStatistics Botswana Statistics Botswana
Table 2: Contribution of Gross Value Added to GDP by Kind of Economic Activity at Current Prices
Ca
lend
ar
yea
r
Ag
ricul
ture
Min
ing
Ma
nufa
ctu
ring
Wa
ter &
Ele
ctr
icity
Co
nstr
uctio
n
Tra
de
, Ho
tels
&Re
sta
ura
nts
Tra
nsp
ort
&C
om
mun
ica
tion
Fina
nce
&
Busi
ness
Se
rvic
e
Ge
nera
l G
ove
rnm
ent
Soc
ial &
Pe
rso
nal S
erv
ice
s
Va
lue
Ad
de
d
Taxe
s o
n Im
po
rt
Oth
er T
axe
so
n p
rod
ucts
Sub
sdie
s
Tota
l GD
P
2004 2.3 25.7 5.6 1.9 5.7 12.2 3.4 12.7 14.6 5.0 89.0 6.5 5.0 -0.5 100.0
2005 1.8 31.7 4.9 1.4 4.8 10.8 3.6 11.7 14.2 5.0 90.0 6.3 4.3 -0.5 100.0
2006 2.0 32.2 5.3 1.3 4.8 11.9 3.8 11.3 13.2 5.0 90.8 5.8 3.9 -0.5 100.0
2007 2.2 29.1 6.3 1.1 5.3 12.3 4.0 11.4 13.2 4.8 89.8 6.4 4.3 -0.5 100.0
2008 2.5 25.0 5.7 0.9 5.0 13.4 4.4 12.5 14.6 5.1 89.1 6.3 5.1 -0.5 100.0
2009 2.8 15.3 6.3 0.4 6.1 15.2 5.4 13.2 16.8 6.3 87.8 6.2 6.6 -0.6 100.0
2010 2.5 19.2 6.4 0.5 5.8 15.1 5.1 13.4 15.4 6.0 89.4 5.1 6.0 -0.5 100.0
2011 2.5 23.4 5.8 -0.1 6.0 14.9 4.9 13.3 14.1 5.6 90.3 4.8 5.3 -0.4 100.0
2012 2.7 17.6 5.9 -0.6 6.8 15.4 5.8 15.0 15.4 6.1 90.1 5.1 5.3 -0.4 100.0
2013 2.3 19.4 5.8 -0.1 6.4 16.9 5.5 14.2 14.2 5.9 90.4 5.1 4.9 -0.4 100.0
2014 2.1 22.2 5.3 -0.4 6.0 17.9 5.3 13.2 13.7 5.6 90.9 4.9 4.6 -0.4 100.0
2015 2.2 17.8 5.8 -0.2 6.6 16.2 5.9 14.7 15.4 5.9 90.3 5.2 4.9 -0.4 100.0
2016 2.0 20.5 5.2 0.2 6.2 18.2 5.7 13.7 14.0 5.4 91.1 4.7 4.6 -0.4 100.0
2017 2.0 17.4 5.1 1.0 6.4 19.5 5.9 13.9 14.3 5.5 90.9 4.8 4.7 -0.4 100.0
2004 Q1 1.8 26.5 5.6 1.8 5.9 12.3 3.4 12.3 13.9 5.0 88.5 5.4 6.6 -0.5 100.0
Q2 3.5 14.9 6.4 2.1 6.5 14.3 3.7 13.8 16.8 5.7 87.6 8.5 4.5 -0.6 100.0
Q3 2.3 31.8 5.0 1.8 5.3 11.2 3.3 12.1 14.0 4.7 91.4 6.3 2.8 -0.5 100.0
Q4 1.6 27.4 5.4 2.0 5.1 11.4 3.5 12.7 14.2 4.9 88.3 6.3 5.9 -0.5 100.0
2005 Q1 1.8 32.7 4.9 1.3 4.7 10.0 3.3 11.4 13.1 4.8 88.0 6.5 6.0 -0.5 100.0
Q2 2.3 26.4 5.6 1.6 5.3 11.9 3.7 12.8 15.2 5.5 90.4 6.5 3.8 -0.6 100.0
Q3 2.0 37.6 4.5 1.3 4.3 9.9 3.5 10.7 13.1 4.7 91.6 4.6 4.3 -0.4 100.0
Q4 1.2 28.9 5.0 1.5 4.8 11.7 3.9 12.0 15.5 5.2 89.8 7.7 3.0 -0.5 100.0
2006 Q1 2.5 32.0 5.1 1.2 4.7 12.0 3.7 11.8 12.3 5.1 90.5 5.5 4.5 -0.5 100.0
Q2 2.0 26.2 5.5 1.3 5.2 12.9 4.2 12.5 15.2 5.5 90.3 6.4 3.8 -0.6 100.0
Q3 2.2 35.4 5.0 1.3 5.0 11.0 3.5 10.7 12.5 4.7 91.3 5.9 3.3 -0.4 100.0
Q4 1.6 34.0 5.6 1.5 4.4 11.9 3.9 10.5 13.2 4.7 91.1 5.5 3.9 -0.5 100.0
2007 Q1 2.0 31.4 6.0 1.2 4.9 12.2 3.8 12.1 12.8 4.8 91.4 5.2 3.9 -0.5 100.0
Q2 3.0 23.8 6.9 1.2 5.4 12.9 4.2 12.1 14.3 5.0 89.0 7.3 4.3 -0.5 100.0
Q3 2.5 33.3 5.9 1.0 4.9 11.0 3.8 10.7 12.4 4.6 90.0 6.3 4.1 -0.4 100.0
Q4 1.5 27.5 6.3 1.0 5.9 13.1 4.2 10.9 13.5 5.0 88.9 6.8 4.8 -0.5 100.0
2008 Q1 2.4 28.4 5.4 0.9 4.9 13.0 4.5 11.6 13.3 5.1 89.4 6.5 4.6 -0.5 100.0
Q2 2.6 20.7 6.5 0.9 5.3 14.2 4.7 12.6 16.1 5.2 88.8 6.8 4.9 -0.6 100.0
Q3 2.8 26.8 5.6 0.8 4.7 12.8 4.2 12.5 14.2 5.0 89.4 5.9 5.2 -0.5 100.0
Q4 2.3 23.7 5.5 0.9 5.1 13.8 4.4 13.1 14.8 5.2 88.9 6.1 5.5 -0.5 100.0
2009 Q1 2.6 11.8 6.6 0.5 6.4 16.4 5.5 14.3 17.4 6.8 88.2 6.1 6.3 -0.6 100.0
Q2 2.9 17.5 6.4 0.4 6.1 15.4 5.1 12.6 16.5 6.0 88.8 5.8 5.9 -0.6 100.0
Q3 3.3 13.6 6.2 0.4 6.5 15.4 5.6 12.9 17.1 6.5 87.3 6.3 7.0 -0.6 100.0
Q4 2.6 17.6 6.2 0.5 5.6 13.8 5.6 13.1 16.2 5.9 87.0 6.5 7.1 -0.6 100.0
2010 Q1 2.5 16.5 6.5 0.7 5.9 15.0 5.3 13.8 16.0 6.4 88.6 5.5 6.4 -0.5 100.0
Q2 2.8 18.0 6.5 0.5 5.5 15.6 5.2 13.8 15.2 6.2 89.3 5.0 6.2 -0.5 100.0
Q3 2.5 22.0 6.1 0.4 5.8 15.1 5.0 12.6 14.4 5.9 89.9 4.8 5.7 -0.5 100.0
Q4 2.1 19.7 6.5 0.4 6.0 14.5 5.1 13.4 16.0 5.7 89.5 5.1 5.9 -0.5 100.0
2011 Q1 2.1 24.4 5.7 0.0 6.0 16.0 5.0 13.3 12.7 5.6 90.7 3.8 6.0 -0.5 100.0
Q2 2.6 23.6 5.5 0.0 5.7 14.3 4.8 12.9 14.4 5.6 89.3 5.4 5.7 -0.4 100.0
Q3 2.7 24.5 5.9 -0.1 6.1 14.2 4.9 13.4 13.6 5.5 90.7 5.2 4.5 -0.4 100.0
Q4 2.7 21.2 6.0 0.0 6.1 14.9 4.8 13.6 15.4 5.7 90.4 4.7 5.3 -0.4 100.0
2012 Q1 2.8 17.7 6.1 -0.1 7.0 16.2 5.8 14.6 14.1 6.2 90.4 4.7 5.3 -0.4 100.0
Q2 2.9 19.9 5.9 -1.0 6.7 15.1 5.6 14.7 15.0 6.1 90.8 4.6 5.0 -0.4 100.0
Q3 2.9 16.1 6.1 -0.6 6.8 15.5 5.9 15.4 15.5 6.2 89.8 5.2 5.5 -0.4 100.0
Q4 2.2 16.5 5.7 -0.6 6.6 14.9 5.7 15.3 16.9 6.1 89.3 5.7 5.4 -0.4 100.0
Table 2: Contribution of Gross Value Added to GDP by Kind of Economic Activity at Current Prices
Ca
lend
ar
yea
r
Ag
ricul
ture
Min
ing
Ma
nufa
ctu
ring
Wa
ter &
Ele
ctr
icity
Co
nstr
uctio
n
Tra
de
, Ho
tels
&Re
sta
ura
nts
Tra
nsp
ort
&C
om
mun
ica
tion
Fina
nce
&
Busi
ness
Se
rvic
e
Ge
nera
l G
ove
rnm
ent
Soc
ial &
Pe
rso
nal S
erv
ice
s
Va
lue
Ad
de
d
Taxe
s o
n Im
po
rt
Oth
er T
axe
so
n p
rod
ucts
Sub
sdie
s
Tota
l GD
P
2013 Q1 2.3 16.4 6.1 0.0 6.9 17.0 5.8 15.1 14.0 6.1 89.7 5.6 5.2 -0.4 100.0
Q2 2.4 24.4 5.5 -0.4 6.1 15.4 5.2 13.5 13.4 5.6 91.2 4.7 4.5 -0.4 100.0
Q3 2.2 19.3 5.9 0.2 6.3 17.2 5.5 14.0 14.0 5.9 90.5 5.0 4.9 -0.4 100.0
Q4 2.3 16.9 5.9 -0.2 6.3 18.2 5.6 14.2 15.3 5.8 90.2 5.3 4.9 -0.4 100.0
2014 Q1 2.1 21.1 5.2 -0.9 6.2 18.5 5.6 13.4 13.7 5.7 90.6 5.1 4.7 -0.4 100.0
Q2 2.1 24.9 5.0 0.3 5.8 17.4 5.1 12.6 12.9 5.4 91.4 4.5 4.4 -0.4 100.0
Q3 2.1 20.2 5.5 -0.1 6.0 18.5 5.4 13.6 14.0 5.7 90.8 4.9 4.7 -0.4 100.0
Q4 2.1 22.5 5.5 -1.0 5.8 17.5 5.3 13.4 14.1 5.6 90.9 4.9 4.6 -0.4 100.0
2015 Q1 2.1 20.8 5.6 -0.8 6.4 16.8 5.5 13.8 14.7 5.8 90.8 5.0 4.6 -0.4 100.0
Q2 2.2 20.5 5.6 0.0 6.5 15.4 5.6 14.3 14.9 5.7 90.6 5.1 4.7 -0.4 100.0
Q3 2.1 18.6 5.7 0.0 6.4 15.5 5.9 14.7 15.5 5.8 90.3 5.2 5.0 -0.4 100.0
Q4 2.4 10.8 6.2 0.3 7.0 17.4 6.4 16.2 16.5 6.4 89.6 5.4 5.4 -0.5 100.0
2016 Q1 2.1 19.1 5.4 -0.2 6.4 17.5 5.7 14.1 14.9 5.7 90.6 5.1 4.7 -0.4 100.0
Q2 2.1 20.5 5.1 0.2 6.1 18.8 5.6 13.5 14.0 5.4 91.2 4.7 4.6 -0.4 100.0
Q3 2.0 22.0 5.1 0.0 6.1 18.2 5.6 13.4 13.7 5.3 91.4 4.5 4.5 -0.4 100.0
Q4 2.0 20.1 5.2 0.9 6.2 18.2 5.8 13.9 13.6 5.4 91.3 4.7 4.5 -0.4 100.0
2017 Q1 2.0 17.8 4.9 0.4 6.3 20.5 5.9 14.0 13.9 5.5 91.2 4.8 4.4 -0.4 100.0
Q2 2.0 17.5 5.1 1.1 6.3 18.9 5.9 13.9 14.6 5.5 91.0 4.9 4.6 -0.4 100.0
Q3 2.0 18.8 5.2 1.0 6.4 17.9 5.9 13.7 14.4 5.5 90.7 4.8 4.9 -0.4 100.0
Q4 2.0 15.3 5.2 1.3 6.5 20.7 5.9 14.0 14.4 5.5 90.9 4.8 4.8 -0.4 100.0
2018 Q1 2.0 15.9 5.0 1.3 6.6 19.0 6.1 14.4 14.6 5.6 90.6 5.0 4.7 -0.4 100.0
Q2 2.0 15.6 5.1 1.4 6.6 19.9 6.0 14.2 14.6 5.5 91.1 4.8 4.5 -0.4 100.0
Q3 2.0 18.0 5.1 1.6 6.6 18.3 6.0 13.8 14.2 5.4 90.9 4.6 4.9 -0.4 100.0
22 23GROSS DOMESTIC PRODUCT GROSS DOMESTIC PRODUCTStatistics Botswana Statistics Botswana
Table 3: Value Added by Kind of Economic Activity at Constant 2006 Prices (P million)
Ca
lend
ar
yea
r
Ag
ricul
ture
Min
ing
Ma
nufa
ctu
ring
Wa
ter &
El
ec
tric
ity
Co
nstr
uctio
n
Tra
de
, Ho
tels
&
Rest
aur
ant
s
Tra
nsp
ort
&
Co
mm
unic
atio
n
Fina
nce
&
Busi
ness
Se
rvic
e
Ge
nera
l G
ove
rnm
ent
Soc
ial &
Pe
rso
nal S
erv
ice
s
Va
lue
Ad
de
d
Taxe
s o
n Im
po
rt
Oth
er T
axe
s o
n p
rod
ucts
Sub
sdie
s
Tota
l GD
P
2004 1,095.8 16,705.0 2,555.2 886.8 2,478.5 5,321.5 1,735.0 6,273.1 8,081.8 2,176.8 47,309.3 2,882.1 2,212.5 -236.1 52,167.7
2005 1,068.2 18,087.7 2,602.4 762.2 2,448.6 5,521.2 1,978.4 6,361.8 7,993.5 2,582.6 49,406.7 3,202.9 2,192.6 -257.4 54,544.8
2006 1,210.7 19,019.0 3,123.1 785.1 2,838.0 7,032.3 2,250.5 6,675.4 7,818.5 2,938.9 53,691.6 3,428.8 2,276.3 -289.8 59,106.9
2007 1,358.9 18,113.7 3,925.6 746.3 3,497.0 8,104.3 2,597.5 7,425.6 8,256.2 3,179.8 57,205.0 4,261.2 2,859.9 -327.0 63,999.1
2008 1,385.7 18,160.9 3,824.9 795.5 3,524.3 9,560.9 2,862.0 8,293.4 8,276.6 3,663.9 60,348.0 4,434.1 3,566.5 -352.6 67,996.1
2009 1,474.0 10,466.0 4,016.5 753.9 3,958.8 9,929.8 3,285.3 8,414.9 8,510.5 4,076.2 54,885.9 4,004.4 4,278.1 -375.6 62,792.8
2010 1,559.7 12,596.2 4,173.5 844.2 4,101.3 10,852.0 3,496.8 9,379.2 9,150.6 4,329.7 60,483.3 3,679.4 4,367.1 -359.8 68,170.1
2011 1,562.4 11,782.2 4,647.3 555.4 5,047.2 12,348.0 3,708.6 10,098.0 9,723.1 4,689.7 64,161.9 4,028.0 4,460.6 -357.2 72,293.3
2012 1,429.1 11,101.2 4,819.5 402.9 5,774.8 13,188.0 4,111.9 11,018.1 9,993.4 5,191.9 67,030.9 4,331.0 4,521.3 -368.4 75,514.8
2013 1,448.1 13,784.3 5,134.4 674.9 6,010.9 15,298.3 4,422.6 11,973.5 10,592.0 5,607.6 74,946.6 4,886.7 4,642.6 -395.1 84,080.7
2014 1,443.1 13,851.1 5,160.3 298.5 6,234.7 16,933.1 4,854.6 12,291.2 11,079.4 5,843.3 77,989.3 5,145.8 4,844.7 -410.3 87,569.5
2015 1,447.7 11,132.2 5,327.4 319.4 6,481.6 16,267.6 5,075.5 12,843.7 11,442.4 6,055.2 76,392.7 5,174.3 4,940.2 -424.6 86,082.6
2016 1,456.2 10,737.7 5,410.0 623.5 6,755.3 18,453.3 5,408.1 13,268.8 11,714.0 6,266.6 80,093.5 5,153.7 4,978.5 -438.3 89,787.4
2017 1,487.6 9,545.1 5,528.2 872.0 6,993.0 20,106.1 5,661.0 13,806.3 11,895.1 6,441.1 82,335.6 5,339.7 5,167.1 -444.4 92,398.0
2004 Q1 224.0 3,333.2 623.7 221.4 663.0 1,352.4 436.4 1,544.3 1,895.8 546.0 10,840.2 621.2 770.7 -58.0 12,174.0
Q2 369.1 3,552.5 620.5 209.3 608.9 1,354.2 396.5 1,477.6 2,054.1 526.6 11,169.3 809.4 434.8 -60.5 12,353.1
Q3 302.9 4,921.1 638.9 219.4 629.8 1,317.7 444.7 1,617.3 2,077.1 549.3 12,718.4 731.9 331.7 -55.7 13,726.4
Q4 199.8 4,898.1 672.0 236.7 576.8 1,297.1 457.4 1,633.8 2,054.6 554.8 12,581.3 719.6 675.3 -62.0 13,914.2
2005 Q1 270.8 3,807.3 618.9 190.4 614.3 1,313.8 465.4 1,550.2 1,878.8 627.5 11,337.2 807.8 753.5 -59.0 12,839.5
Q2 290.4 4,333.9 627.7 186.9 612.0 1,350.1 460.8 1,507.9 1,936.1 630.7 11,936.5 725.8 423.4 -65.8 13,019.9
Q3 324.3 4,923.6 679.7 188.9 611.9 1,386.0 527.1 1,658.4 2,020.4 660.8 12,981.1 652.3 614.1 -62.7 14,184.8
Q4 182.8 5,023.0 676.1 196.1 610.4 1,471.3 525.2 1,645.3 2,158.2 663.7 13,151.9 1,016.9 401.6 -69.9 14,500.6
2006 Q1 342.4 4,585.3 746.6 193.6 677.3 1,733.6 540.2 1,685.7 1,790.2 740.2 13,035.1 791.9 646.9 -68.5 14,405.4
Q2 244.3 4,577.9 734.5 191.5 680.2 1,710.6 553.9 1,643.9 2,024.1 728.5 13,089.3 853.7 503.8 -74.5 14,372.3
Q3 376.6 4,985.1 804.9 196.4 798.4 1,763.6 567.5 1,719.8 1,997.8 745.4 13,955.4 940.8 526.7 -69.8 15,353.1
Q4 247.4 4,870.7 837.1 203.6 682.1 1,824.5 588.9 1,626.1 2,006.4 724.9 13,611.8 842.5 598.9 -77.1 14,976.1
2007 Q1 332.6 4,517.8 931.8 193.1 791.7 1,957.8 602.0 1,923.3 1,966.2 769.2 13,985.4 810.4 614.2 -74.9 15,335.1
Q2 411.0 4,441.3 1,032.6 192.2 851.5 2,026.7 650.5 1,843.8 2,132.9 780.1 14,362.6 1,139.6 669.5 -83.7 16,088.0
Q3 409.1 4,523.4 999.9 183.0 879.4 1,981.0 667.9 1,922.4 2,094.2 823.4 14,483.8 1,151.5 761.8 -79.6 16,317.6
Q4 206.2 4,631.2 961.3 178.0 974.4 2,138.9 677.1 1,736.1 2,062.9 807.0 14,373.1 1,159.7 814.4 -88.8 16,258.4
2008 Q1 302.4 4,700.9 893.7 188.2 907.0 2,303.4 697.1 1,848.4 1,840.6 917.7 14,599.5 1,098.3 783.1 -83.1 16,397.8
Q2 404.1 4,570.7 1,020.1 194.2 874.9 2,375.3 705.7 2,075.4 2,141.6 877.4 15,239.5 1,108.0 808.2 -90.4 17,065.3
Q3 393.3 4,892.7 985.3 199.6 864.7 2,396.9 723.5 2,091.1 2,142.1 922.9 15,612.1 1,112.6 967.8 -84.9 17,607.6
Q4 285.9 3,996.5 925.8 213.5 877.7 2,485.2 735.6 2,278.6 2,152.3 945.8 14,896.9 1,115.3 1,007.4 -94.2 16,925.3
2009 Q1 373.1 2,011.2 1,036.1 171.4 977.2 2,466.2 774.8 2,135.5 2,061.2 1,023.9 13,030.5 931.5 971.4 -89.8 14,843.7
Q2 360.6 2,721.6 1,040.6 185.4 999.8 2,584.3 787.6 2,093.6 2,158.3 1,006.1 13,938.0 975.3 995.4 -97.2 15,811.5
Q3 404.8 2,616.2 943.4 184.9 1,035.2 2,504.3 846.0 2,016.1 2,149.1 1,040.0 13,740.1 1,008.1 1,124.9 -90.3 15,782.8
Q4 335.5 3,117.0 996.4 212.2 946.5 2,375.0 876.9 2,169.7 2,142.0 1,006.2 14,177.3 1,089.5 1,186.2 -98.2 16,354.8
2010 Q1 355.1 3,148.6 995.2 234.5 963.4 2,536.8 831.0 2,252.4 2,218.9 1,083.9 14,619.9 910.0 1,057.4 -83.2 16,504.1
Q2 432.8 2,905.5 1,024.9 202.3 940.2 2,719.6 848.2 2,368.4 2,253.0 1,081.3 14,776.1 874.4 1,084.1 -92.1 16,642.5
Q3 413.8 3,474.0 1,049.3 208.3 1,078.3 2,808.9 906.9 2,303.4 2,327.5 1,099.7 15,670.2 914.2 1,101.1 -87.5 17,598.1
Q4 358.0 3,068.1 1,104.1 199.1 1,119.5 2,786.7 910.7 2,455.0 2,351.2 1,064.8 15,417.2 980.8 1,124.5 -97.1 17,425.4
2011 Q1 350.7 3,021.8 1,123.2 148.6 1,183.9 3,144.7 912.6 2,478.9 2,211.0 1,130.8 15,706.2 713.0 1,163.4 -92.9 17,489.7
Q2 388.1 3,096.8 1,098.5 141.5 1,183.9 2,949.1 904.9 2,465.1 2,400.2 1,120.3 15,748.4 1,141.5 1,178.6 -81.8 17,986.8
Q3 397.2 2,914.4 1,166.5 120.0 1,320.4 3,011.0 944.5 2,479.2 2,377.7 1,198.3 15,929.2 1,127.2 951.7 -90.2 17,917.8
Q4 426.5 2,749.3 1,259.1 145.2 1,359.0 3,243.3 946.6 2,674.8 2,734.1 1,240.4 16,778.2 1,046.3 1,166.8 -92.3 18,899.0
2012 Q1 366.1 2,934.8 1,234.5 167.9 1,422.2 3,196.4 1,014.0 2,647.2 2,514.7 1,243.2 16,741.0 965.2 1,069.7 -90.5 18,685.5
Q2 358.3 2,917.5 1,174.0 83.2 1,438.6 3,241.8 1,025.4 2,688.9 2,391.9 1,281.7 16,601.3 988.0 1,084.0 -90.9 18,582.4
Q3 359.4 2,224.0 1,208.4 92.8 1,452.2 3,370.3 1,038.9 2,811.3 2,363.8 1,323.4 16,244.5 1,114.0 1,174.5 -92.8 18,440.3
Q4 345.3 3,025.0 1,202.5 59.0 1,461.8 3,379.6 1,033.6 2,870.8 2,722.9 1,343.6 17,444.0 1,263.7 1,193.1 -94.2 19,806.6
Table 3: Value Added by Kind of Economic Activity at Constant 2006 Prices (P million)
Ca
lend
ar
yea
r
Ag
ricul
ture
Min
ing
Ma
nufa
ctu
ring
Wa
ter &
El
ec
tric
ity
Co
nstr
uctio
n
Tra
de
, Ho
tels
&
Rest
aur
ant
s
Tra
nsp
ort
&
Co
mm
unic
atio
n
Fina
nce
&
Busi
ness
Se
rvic
e
Ge
nera
l G
ove
rnm
ent
Soc
ial &
Pe
rso
nal S
erv
ice
s
Va
lue
Ad
de
d
Taxe
s o
n Im
po
rt
Oth
er T
axe
s o
n p
rod
ucts
Sub
sdie
s
Tota
l GD
P
2013 Q1 347.7 3,081.0 1,226.1 205.9 1,484.7 3,612.4 1,067.5 3,041.1 2,743.3 1,379.3 18,188.9 1,253.0 1,164.8 -98.7 20,508.0
Q2 370.5 3,816.9 1,293.3 189.7 1,503.8 3,632.4 1,083.6 2,946.8 2,557.4 1,385.7 18,780.2 1,137.4 1,108.9 -94.6 20,931.9
Q3 371.9 3,258.7 1,319.6 231.6 1,506.0 3,973.0 1,131.5 2,952.6 2,517.5 1,404.0 18,666.5 1,180.2 1,169.9 -99.4 20,917.2
Q4 358.0 3,627.7 1,295.4 47.7 1,516.5 4,080.4 1,140.0 3,033.0 2,773.8 1,438.6 19,311.0 1,316.1 1,199.0 -102.4 21,723.7
2014 Q1 348.9 3,226.5 1,205.8 78.8 1,521.8 4,140.0 1,167.2 3,011.5 2,668.8 1,434.7 18,804.0 1,286.6 1,203.0 -104.0 21,189.5
Q2 370.6 3,561.6 1,271.4 106.2 1,558.3 4,153.7 1,206.6 3,021.3 2,853.2 1,446.8 19,549.6 1,238.1 1,201.1 -101.6 21,887.1
Q3 360.1 3,442.9 1,322.4 60.3 1,573.7 4,328.9 1,246.2 3,119.2 2,842.8 1,473.2 19,769.9 1,286.9 1,225.4 -103.7 22,178.5
Q4 363.4 3,620.2 1,360.7 53.3 1,580.9 4,310.5 1,234.6 3,139.1 2,714.6 1,488.6 19,865.8 1,334.2 1,215.2 -101.0 22,314.3
2015 Q1 353.6 3,290.4 1,285.9 93.7 1,596.4 4,077.0 1,215.4 3,110.3 2,863.1 1,499.7 19,385.5 1,299.4 1,196.4 -105.4 21,775.8
Q2 374.8 3,273.0 1,346.2 48.5 1,619.8 3,966.1 1,250.2 3,151.5 2,867.2 1,506.7 19,404.0 1,303.2 1,221.0 -105.9 21,822.3
Q3 358.4 2,048.1 1,350.0 73.8 1,627.5 4,065.8 1,308.1 3,252.8 2,901.5 1,515.8 18,501.7 1,313.9 1,262.5 -107.4 20,970.7
Q4 360.9 2,520.7 1,345.3 103.5 1,637.9 4,158.7 1,301.8 3,329.1 2,810.6 1,533.0 19,101.5 1,257.8 1,260.4 -105.9 21,513.8
2016 Q1 347.2 3,110.0 1,281.0 128.8 1,650.8 4,299.7 1,301.3 3,267.6 2,907.7 1,551.9 19,846.1 1,313.7 1,214.1 -107.2 22,266.7
Q2 369.5 2,828.1 1,361.1 161.2 1,693.7 4,768.5 1,319.5 3,250.2 2,937.9 1,559.1 20,248.7 1,277.9 1,255.1 -108.9 22,672.8
Q3 372.6 2,428.7 1,385.2 87.9 1,695.2 4,729.9 1,389.4 3,336.9 2,966.7 1,577.7 19,970.3 1,280.3 1,277.7 -111.2 22,417.1
Q4 366.9 2,370.9 1,382.8 245.6 1,715.6 4,655.2 1,397.9 3,414.1 2,901.7 1,577.8 20,028.4 1,281.8 1,231.6 -111.0 22,430.9
2017 Q1 357.4 2,211.4 1,286.2 136.0 1,716.5 5,082.0 1,358.5 3,411.2 2,931.7 1,585.2 20,076.1 1,306.2 1,195.9 -110.8 22,467.3
Q2 373.5 2,449.3 1,365.0 261.9 1,749.8 4,823.8 1,399.1 3,395.2 2,965.6 1,603.4 20,386.6 1,334.9 1,257.0 -111.0 22,867.5
Q3 380.2 2,508.3 1,434.5 221.3 1,754.0 4,755.3 1,452.3 3,460.8 3,009.3 1,620.3 20,596.4 1,350.6 1,370.2 -111.1 23,206.1
Q4 376.4 2,376.1 1,442.5 252.9 1,772.6 5,445.0 1,451.1 3,539.1 2,988.6 1,632.3 21,276.5 1,348.0 1,344.0 -111.5 23,857.1
2018 Q1 368.6 2,478.3 1,345.0 262.2 1,776.2 4,980.4 1,447.4 3,577.5 3,000.6 1,641.8 20,877.9 1,400.3 1,319.7 -113.9 23,484.0
Q2 384.6 2,630.5 1,415.6 270.4 1,821.2 5,259.1 1,482.8 3,572.2 3,045.9 1,655.9 21,538.2 1,365.8 1,276.8 -116.9 24,063.9
Q3 391.9 2,440.0 1,470.4 315.5 1,823.1 5,085.7 1,537.1 3,640.5 3,104.2 1,680.1 21,488.5 1,363.9 1,441.8 -119.8 24,174.4
Note: 2016-2018 estimates are provisional
24 25GROSS DOMESTIC PRODUCT GROSS DOMESTIC PRODUCTStatistics Botswana Statistics Botswana
Table 4: Percentage Change in Gross Value Added by Kind of Economic Activity at constant 2006 Prices
Ca
lend
ar
yea
r
Ag
ricul
ture
Min
ing
Ma
nufa
ctu
ring
Wa
ter &
Ele
ctr
icity
Co
nstr
uctio
n
Tra
de
, Ho
tels
&
Rest
aur
ant
s
Tra
nsp
ort
&
Co
mm
unic
atio
n
Fina
nce
&
Busi
ness
Se
rvic
e
Ge
nera
l G
ove
rnm
ent
Soc
ial &
Pe
rso
nal
Serv
ice
s
Va
lue
Ad
de
d
Taxe
s o
n Im
po
rt
Oth
er T
axe
s o
n p
rod
ucts
Sub
sdie
s
Tota
l GD
P
2005 -2.5 8.3 1.8 -14.1 -1.2 3.8 14.0 1.4 -1.1 18.6 4.4 11.1 -0.9 9.0 4.6
2006 13.3 5.1 20.0 3.0 15.9 27.4 13.8 4.9 -2.2 13.8 8.7 7.1 3.8 12.6 8.4
2007 12.2 -4.8 25.7 -4.9 23.2 15.2 15.4 11.2 5.6 8.2 6.5 24.3 25.6 12.8 8.3
2008 2.0 0.3 -2.6 6.6 0.8 18.0 10.2 11.7 0.2 15.2 5.5 4.1 24.7 7.8 6.2
2009 6.4 -42.4 5.0 -5.2 12.3 3.9 14.8 1.5 2.8 11.3 -9.1 -9.7 20.0 6.5 -7.7
2010 5.8 20.4 3.9 12.0 3.6 9.3 6.4 11.5 7.5 6.2 10.2 -8.1 2.1 -4.2 8.6
2011 0.2 -6.5 11.4 -34.2 23.1 13.8 6.1 7.7 6.3 8.3 6.1 9.5 2.1 -0.7 6.0
2012 -8.5 -5.8 3.7 -27.5 14.4 6.8 10.9 9.1 2.8 10.7 4.5 7.5 1.4 3.1 4.5
2013 1.3 24.2 6.5 67.5 4.1 16.0 7.6 8.7 6.0 8.0 11.8 12.8 2.7 7.3 11.3
2014 -0.4 0.5 0.5 -55.8 3.7 10.7 9.8 2.7 4.6 4.2 4.1 5.3 4.4 3.8 4.1
2015 0.3 -19.6 3.2 7.0 4.0 -3.9 4.5 4.5 3.3 3.6 -2.0 0.6 2.0 3.5 -1.7
2016 0.6 -3.5 1.6 95.2 4.2 13.4 6.6 3.3 2.4 3.5 4.8 -0.4 0.8 3.2 4.3
2017 2.2 -11.1 2.2 39.9 3.5 9.0 4.7 4.1 1.5 2.8 2.8 3.6 3.8 1.4 2.9
2005 Q1 20.9 14.2 -0.8 -14.0 -7.3 -2.9 6.6 0.4 -0.9 14.9 4.6 30.0 -2.2 1.7 5.5
Q2 -21.3 22.0 1.2 -10.7 0.5 -0.3 16.2 2.1 -5.7 19.8 6.9 -10.3 -2.6 8.9 5.4
Q3 7.1 0.1 6.4 -13.9 -2.8 5.2 18.5 2.5 -2.7 20.3 2.1 -10.9 85.1 12.6 3.3
Q4 -8.5 2.5 0.6 -17.2 5.8 13.4 14.8 0.7 5.0 19.6 4.5 41.3 -40.5 12.7 4.2
2006 Q1 26.5 20.4 20.6 1.7 10.3 32.0 16.1 8.7 -4.7 18.0 15.0 -2.0 -14.2 16.0 12.2
Q2 -15.9 5.6 17.0 2.5 11.1 26.7 20.2 9.0 4.5 15.5 9.7 17.6 19.0 13.1 10.4
Q3 16.1 1.2 18.4 4.0 30.5 27.2 7.7 3.7 -1.1 12.8 7.5 44.2 -14.2 11.4 8.2
Q4 35.3 -3.0 23.8 3.9 11.7 24.0 12.1 -1.2 -7.0 9.2 3.5 -17.1 49.1 10.3 3.3
2007 Q1 -2.9 -1.5 24.8 -0.2 16.9 12.9 11.4 14.1 9.8 3.9 7.3 2.3 -5.0 9.4 6.5
Q2 68.3 -3.0 40.6 0.4 25.2 18.5 17.4 12.2 5.4 7.1 9.7 33.5 32.9 12.4 11.9
Q3 8.6 -9.3 24.2 -6.8 10.1 12.3 17.7 11.8 4.8 10.5 3.8 22.4 44.6 14.1 6.3
Q4 -16.7 -4.9 14.8 -12.6 42.9 17.2 15.0 6.8 2.8 11.3 5.6 37.6 36.0 15.2 8.6
2008 Q1 -9.1 4.1 -4.1 -2.5 14.6 17.7 15.8 -3.9 -6.4 19.3 4.4 35.5 27.5 10.9 6.9
Q2 -1.7 2.9 -1.2 1.1 2.7 17.2 8.5 12.6 0.4 12.5 6.1 -2.8 20.7 8.0 6.1
Q3 -3.9 8.2 -1.5 9.1 -1.7 21.0 8.3 8.8 2.3 12.1 7.8 -3.4 27.0 6.6 7.9
Q4 38.7 -13.7 -3.7 19.9 -9.9 16.2 8.6 31.2 4.3 17.2 3.6 -3.8 23.7 6.2 4.1
2009 Q1 23.4 -57.2 15.9 -9.0 7.7 7.1 11.1 15.5 12.0 11.6 -10.7 -15.2 24.1 8.1 -9.5
Q2 -10.8 -40.5 2.0 -4.5 14.3 8.8 11.6 0.9 0.8 14.7 -8.5 -12.0 23.2 7.6 -7.3
Q3 2.9 -46.5 -4.3 -7.4 19.7 4.5 16.9 -3.6 0.3 12.7 -12.0 -9.4 16.2 6.4 -10.4
Q4 17.4 -22.0 7.6 -0.6 7.8 -4.4 19.2 -4.8 -0.5 6.4 -4.8 -2.3 17.8 4.2 -3.4
2010 Q1 -4.8 56.6 -3.9 36.9 -1.4 2.9 7.3 5.5 7.7 5.9 12.2 -2.3 8.9 -7.4 11.2
Q2 20.0 6.8 -1.5 9.1 -6.0 5.2 7.7 13.1 4.4 7.5 6.0 -10.3 8.9 -5.3 5.3
Q3 2.2 32.8 11.2 12.7 4.2 12.2 7.2 14.3 8.3 5.7 14.0 -9.3 -2.1 -3.2 11.5
Q4 6.7 -1.6 10.8 -6.2 18.3 17.3 3.9 13.2 9.8 5.8 8.7 -10.0 -5.2 -1.1 6.5
2011 Q1 -1.2 -4.0 12.9 -36.6 22.9 24.0 9.8 10.1 -0.4 4.3 7.4 -21.7 10.0 11.6 6.0
Q2 -10.3 6.6 7.2 -30.0 25.9 8.4 6.7 4.1 6.5 3.6 6.6 30.6 8.7 -11.2 8.1
Q3 -4.0 -16.1 11.2 -42.4 22.5 7.2 4.1 7.6 2.2 9.0 1.7 23.3 -13.6 3.2 1.8
Q4 19.1 -10.4 14.0 -27.1 21.4 16.4 3.9 9.0 16.3 16.5 8.8 6.7 3.8 -4.9 8.5
2012 Q1 4.4 -2.9 9.9 12.9 20.1 1.6 11.1 6.8 13.7 9.9 6.6 35.4 -8.1 -2.6 6.8
Q2 -7.7 -5.8 6.9 -41.2 21.5 9.9 13.3 9.1 -0.3 14.4 5.4 -13.4 -8.0 11.1 3.3
Q3 -9.5 -23.7 3.6 -22.7 10.0 11.9 10.0 13.4 -0.6 10.4 2.0 -1.2 23.4 2.8 2.9
Q4 -19.0 10.0 -4.5 -59.3 7.6 4.2 9.2 7.3 -0.4 8.3 4.0 20.8 2.2 2.1 4.8
2013 Q1 -5.0 5.0 -0.7 22.6 4.4 13.0 5.3 14.9 9.1 10.9 8.6 29.8 8.9 9.0 9.8
Q2 3.4 30.8 10.2 128.0 4.5 12.1 5.7 9.6 6.9 8.1 13.1 15.1 2.3 4.0 12.6
Q3 3.5 46.5 9.2 149.6 3.7 17.9 8.9 5.0 6.5 6.1 14.9 5.9 -0.4 7.2 13.4
Q4 3.7 19.9 7.7 -19.2 3.7 20.7 10.3 5.7 1.9 7.1 10.7 4.1 0.5 8.7 9.7
Table 4: Percentage Change in Gross Value Added by Kind of Economic Activity at constant 2006 Prices
Ca
lend
ar
yea
r
Ag
ricul
ture
Min
ing
Ma
nufa
ctu
ring
Wa
ter &
Ele
ctr
icity
Co
nstr
uctio
n
Tra
de
, Ho
tels
&
Rest
aur
ant
s
Tra
nsp
ort
&
Co
mm
unic
atio
n
Fina
nce
&
Busi
ness
Se
rvic
e
Ge
nera
l G
ove
rnm
ent
Soc
ial &
Pe
rso
nal
Serv
ice
s
Va
lue
Ad
de
d
Taxe
s o
n Im
po
rt
Oth
er T
axe
s o
n p
rod
ucts
Sub
sdie
s
Tota
l GD
P
2014 Q1 0.3 4.7 -1.7 -61.7 2.5 14.6 9.3 -1.0 -2.7 4.0 3.4 2.7 3.3 5.4 3.3
Q2 0.0 -6.7 -1.7 -44.0 3.6 14.3 11.3 2.5 11.6 4.4 4.1 8.8 8.3 7.4 4.6
Q3 -3.2 5.7 0.2 -74.0 4.5 9.0 10.1 5.6 12.9 4.9 5.9 9.0 4.7 4.3 6.0
Q4 1.5 -0.2 5.0 11.7 4.2 5.6 8.3 3.5 -2.1 3.5 2.9 1.4 1.3 -1.4 2.7
2015 Q1 1.3 2.0 6.6 18.9 4.9 -1.5 4.1 3.3 7.3 4.5 3.1 1.0 -0.6 1.3 2.8
Q2 1.1 -8.1 5.9 -54.3 3.9 -4.5 3.6 4.3 0.5 4.1 -0.7 5.3 1.7 4.3 -0.3
Q3 -0.5 -40.5 2.1 22.3 3.4 -6.1 5.0 4.3 2.1 2.9 -6.4 2.1 3.0 3.6 -5.4
Q4 -0.7 -30.4 -1.1 94.3 3.6 -3.5 5.4 6.1 3.5 3.0 -3.8 -5.7 3.7 4.9 -3.6
2016 Q1 -1.8 -5.5 -0.4 37.5 3.4 5.5 7.1 5.1 1.6 3.5 2.4 1.1 1.5 1.8 2.3
Q2 -1.4 -13.6 1.1 232.5 4.6 20.2 5.5 3.1 2.5 3.5 4.4 -1.9 2.8 2.8 3.9
Q3 4.0 18.6 2.6 19.1 4.2 16.3 6.2 2.6 2.2 4.1 7.9 -2.6 1.2 3.6 6.9
Q4 1.6 -5.9 2.8 137.3 4.7 11.9 7.4 2.6 3.2 2.9 4.9 1.9 -2.3 4.8 4.3
2017 Q1 2.9 -28.9 0.4 5.6 4.0 18.2 4.4 4.4 0.8 2.1 1.2 -0.6 -1.5 3.3 0.9
Q2 1.1 -13.4 0.3 62.5 3.3 1.2 6.0 4.5 0.9 2.8 0.7 4.5 0.1 1.9 0.9
Q3 2.0 3.3 3.6 151.8 3.5 0.5 4.5 3.7 1.4 2.7 3.1 5.5 7.2 -0.1 3.5
Q4 2.6 0.2 4.3 2.9 3.3 17.0 3.8 3.7 3.0 3.5 6.2 5.2 9.1 0.5 6.4
2018 Q1 3.1 12.1 4.6 92.8 3.5 -2.0 6.5 4.9 2.4 3.6 4.0 7.2 10.4 2.8 4.5
Q2 3.0 7.4 3.7 3.3 4.1 9.0 6.0 5.2 2.7 3.3 5.6 2.3 1.6 5.3 5.2
Q3 3.1 -2.7 2.5 42.6 3.9 6.9 5.8 5.2 3.2 3.7 4.3 1.0 5.2 7.8 4.2
26 27GROSS DOMESTIC PRODUCT GROSS DOMESTIC PRODUCTStatistics Botswana Statistics Botswana
Table 5: Gross Domestic Product by Type of Expenditure at Current Prices (P million)
Government Final Consumtion
Household Final Consumption Gross Fixed Capital Formation Change in Inventories Exports Imports
Ca
lend
ar
yea
r
Ce
ntra
l Go
vt
Loc
al G
ovt
Tota
l
No
n-Pr
ofit
In
stitu
tions
Ho
use
hold
C
ons
ump
tion
(Mkt
))
Ho
use
hold
C
ons
ump
tion
(No
n- M
kt)
Tota
l
Co
nstr
uctio
n
Ma
chi
nery
&
Equi
pm
ent
Tra
nsp
ort
Eq
uip
me
nt
Min
era
l Pr
osp
ec
ting
Tota
l
Live
sto
ck
Min
era
ls
Oth
ers
Tota
l
Gro
ss D
om
est
ic
Exp
end
iture
Go
od
s
Serv
ice
s
Tota
l
Go
od
s
Serv
ice
s
Tota
l
Erre
ors
&
Om
issi
ons
Tota
l GD
P
2004 7,311.3 1,319.8 8,631.1 796.4 13,795.9 2,132.5 16,724.8 6,937.7 3,531.7 1,019.8 214.4 11,703.7 87.8 511.2 930.2 1,529.3 38,588.8 17,344.6 3,511.3 20,855.9 13,475.6 3,920.8 17,396.4 -11.7 42,036.6
2005 8,361.6 1,484.7 9,846.3 1,013.0 16,096.4 2,230.5 19,340.0 8,035.7 3,624.8 950.4 249.7 12,860.5 74.1 15.5 829.2 918.9 42,965.6 22,708.3 4,151.5 26,859.8 13,729.2 4,329.3 18,058.5 -1,014.7 50,752.2
2006 8,502.4 1,568.1 10,070.5 1,217.0 19,222.9 2,452.8 22,892.7 9,930.8 4,095.6 1,159.8 300.5 15,486.6 160.7 -1,164.1 828.2 -175.2 48,274.7 26,386.1 4,499.9 30,886.0 15,283.9 4,859.8 20,143.7 89.9 59,106.9
2007 9,989.2 1,826.2 11,815.4 1,335.0 22,220.5 3,066.7 26,622.2 11,421.2 5,515.0 1,768.0 357.2 19,061.5 217.9 41.6 1,357.0 1,616.4 59,115.5 31,692.0 4,917.0 36,609.0 21,228.0 6,028.3 27,256.3 -1,315.5 67,152.7
2008 12,936.1 2,270.6 15,206.6 1,147.1 27,967.0 3,815.0 32,929.1 12,052.9 8,122.2 2,430.4 246.1 22,851.6 184.0 2,081.1 1,922.6 4,187.7 75,175.1 32,757.0 1,371.0 34,128.0 35,330.0 2,809.0 38,139.0 3,556.8 74,720.9
2009 12,971.2 2,521.7 15,492.9 1,217.0 32,077.5 3,929.1 37,223.5 14,587.8 8,077.9 2,665.8 313.9 25,645.5 191.8 547.0 2,214.8 2,953.6 81,315.5 23,866.0 1,699.6 25,565.6 33,346.0 4,770.0 38,116.0 4,697.3 73,462.4
2010 14,363.6 2,798.3 17,162.0 1,335.0 37,195.1 4,161.9 42,692.1 16,852.9 9,484.8 2,510.7 353.2 29,201.5 253.8 4,409.0 2,109.3 6,772.1 95,827.6 31,237.0 6,668.0 37,905.0 38,035.0 6,497.0 44,532.0 -2,333.2 86,867.4
2011 16,592.9 2,814.4 19,407.3 1,464.6 42,755.9 4,408.6 48,629.1 19,364.4 10,907.5 2,962.6 406.1 33,640.6 1.3 4,853.5 2,001.1 6,855.8 108,532.9 44,043.0 8,395.0 52,438.0 48,821.0 7,443.0 56,264.0 273.0 104,979.9
2012 18,342.9 2,852.7 21,195.6 1,995.2 50,789.5 4,315.5 57,100.3 23,308.9 12,601.9 3,437.1 455.5 39,803.5 187.6 221.6 2,460.8 2,869.9 120,969.3 45,886.0 8,226.0 54,112.0 61,074.0 6,391.0 67,465.0 2,254.1 109,870.4
2013 20,005.4 3,209.3 23,214.7 2,154.9 57,512.1 5,442.5 65,109.5 26,629.9 12,316.1 2,408.1 571.0 41,925.1 -261.6 -4,752.3 -103.3 -5117.2 125,132.2 66,563.7 10,437.0 77,000.7 68,902.2 7,483.1 76,385.3 -589.2 125,158.3
2014 25,343.8 3,733.9 29,077.7 2,308.3 60,279.5 5,887.0 68,474.7 28,775.8 12,346.4 2,697.1 613.3 44,432.7 165.0 -417.1 -3,047.0 -3299.1 138,686.0 76,419.9 12,137.0 88,556.9 71,745.4 6,953.2 78,698.7 -2,675.6 145,868.6
2015 26,034.1 4,022.6 30,056.7 2,460.1 67,187.3 6,337.2 75,984.5 31,329.6 15,132.9 2,532.9 648.0 49,643.4 1485.7 2,825.6 -6,332.5 -2021.2 153,663.5 63,673.5 13,790.2 77,463.6 72,787.7 6,805.6 79,593.3 -5,467.6 146,066.2
2016 27,313.3 3,719.5 31,032.9 2,662.5 71,124.1 6,936.8 80,723.4 34,784.0 15,116.2 2,397.1 688.5 52,985.8 69.4 -2,037.2 -2,287.4 -4255.2 160,486.9 69,497.6 15,369.3 84,867.0 66,125.9 7,502.9 73,628.8 -1,161.4 170,563.6
2017 29,328.3 3,861.8 33,190.1 2,864.8 78,727.9 7,077.9 88,670.6 37,777.4 11,945.4 1,992.4 722.4 52,437.7 1312.5 -117.3 -2,762.0 -1566.7 172,731.6 61,405.5 10,586.7 71,992.2 51,784.0 9,269.3 61,053.3 -3,568.4 180,102.1
2004 Q1 1,845.5 354.9 2,200.4 181.5 3,317.9 466.8 3,966.2 1,640.7 785.6 286.9 51.0 2,764.2 21.3 104.6 359.0 484.8 9,415.6 4,182.0 1,046.3 5,228.3 2,846.0 1,095.1 3,941.1 -449.5 10,253.3
Q2 1,753.4 316.7 2,070.1 192.8 3,394.3 433.5 4,020.6 1,686.8 957.3 243.1 52.4 2,939.6 39.0 -298.7 349.9 90.2 9,120.5 3,625.7 595.8 4,221.5 3,411.2 886.8 4,298.0 29.2 9,073.2
Q3 1,883.2 314.1 2,197.3 204.7 3,369.4 647.1 4,221.2 1,780.3 866.1 259.1 55.0 2,960.5 16.9 406.6 116.8 540.3 9,919.4 4,946.5 677.0 5,623.5 3,481.0 1,051.5 4,532.5 466.4 11,476.8
Q4 1,829.1 334.2 2,163.3 217.4 3,714.3 585.0 4,516.7 1,829.9 922.6 230.8 56.0 3,039.3 10.7 298.7 104.6 414.0 10,133.3 4,590.4 1,192.2 5,782.6 3,737.4 887.3 4,624.7 -57.8 11,233.4
2005 Q1 2,298.6 406.0 2,704.6 230.9 3,992.9 458.6 4,682.4 1,879.0 899.1 357.2 53.4 3,188.8 12.2 -620.1 218.5 -389.3 10,186.5 5,538.7 1,168.1 6,706.8 3,363.9 1,239.0 4,602.9 52.7 12,343.1
Q2 1,802.4 318.2 2,120.6 245.2 3,694.1 571.8 4,511.1 1,931.6 830.2 185.4 50.9 2,998.2 15.7 -129.7 184.2 70.3 9,700.1 4,871.5 536.7 5,408.2 3,251.0 994.0 4,245.0 263.4 11,126.7
Q3 1,973.4 353.2 2,326.6 260.4 4,085.9 603.9 4,950.1 2,083.3 935.0 207.4 68.0 3,293.7 30.7 597.7 189.2 817.6 11,388.0 7,020.6 961.4 7,982.0 3,289.8 1,034.3 4,324.2 -858.2 14,187.7
Q4 2,287.2 407.3 2,694.5 276.5 4,323.5 596.3 5,196.4 2,141.7 960.5 200.3 77.3 3,379.8 15.5 167.6 237.2 420.3 11,691.0 5,277.5 1,485.3 6,762.8 3,824.5 1,062.0 4,886.4 -472.7 13,094.7
2006 Q1 1,970.0 374.1 2,344.2 293.7 4,531.2 412.8 5,237.6 2,394.5 828.8 270.9 66.6 3,560.8 31.6 -1,284.0 199.0 -1,053.4 10,089.2 6,028.7 1,269.1 7,297.8 3,158.9 1,298.3 4,457.2 1,072.2 14,002.0
Q2 1,963.6 375.1 2,338.8 299.0 4,323.7 703.5 5,326.1 2,461.6 964.0 262.0 65.6 3,753.2 25.8 7,957.6 185.3 8,168.8 19,586.9 6,090.1 649.3 6,739.4 3,925.3 1,080.4 5,005.8 -8,110.6 13,209.9
Q3 2,202.5 402.2 2,604.8 316.9 5,246.7 630.4 6,194.0 2,569.3 1,106.0 293.0 84.6 4,052.9 59.3 -11,495.1 248.6 -11,187.2 1,664.5 6,214.5 924.3 7,138.8 4,023.7 1,345.3 5,369.0 12,781.5 16,215.7
Q4 2,366.2 416.6 2,782.9 307.4 5,121.3 706.2 6,134.9 2,505.4 1,196.8 333.9 83.7 4,119.7 44.0 3,657.4 195.3 3,896.7 16,934.1 8,052.8 1,657.2 9,710.0 4,175.9 1,135.8 5,311.7 -5,653.2 15,679.3
2007 Q1 2,494.9 435.4 2,930.4 304.3 4,680.0 733.3 5,717.7 2,661.9 1,074.2 380.3 82.5 4,198.8 49.9 -262.6 185.3 -27.4 12,819.5 8,956.0 1,397.0 10,353.0 4,192.0 1,697.0 5,889.0 -1,549.6 15,733.9
Q2 2,367.2 437.2 2,804.4 312.7 5,186.7 728.0 6,227.4 2,769.6 1,285.8 488.6 84.9 4,628.8 69.9 -147.2 189.6 112.3 13,773.0 7,693.0 649.0 8,342.0 5,160.0 1,197.0 6,357.0 16.4 15,774.4
Q3 2,549.9 475.9 3,025.9 359.6 5,997.3 731.7 7,088.6 2,939.9 1,644.1 492.0 95.6 5,171.7 62.1 1,650.7 478.3 2,191.0 17,477.2 8,923.0 1,369.0 10,292.0 5,395.0 1,549.3 6,944.3 -2,310.6 18,514.2
Q4 2,577.2 477.6 3,054.7 358.5 6,356.5 873.5 7,588.6 3,049.8 1,510.9 407.1 94.3 5,062.1 36.0 -1,199.3 503.8 -659.5 15,045.9 6,120.0 1,502.0 7,622.0 6,481.0 1,585.0 8,066.0 2,528.3 17,130.1
2008 Q1 3,253.2 546.6 3,799.7 334.9 5,704.2 803.7 6,842.8 2,831.3 1,990.9 526.2 68.1 5,416.4 36.0 125.4 559.5 720.9 16,779.8 9,018.0 367.0 9,385.0 7,505.0 650.0 8,155.0 -525.2 17,484.6
Q2 3,087.6 558.5 3,646.0 379.8 6,463.1 966.4 7,809.3 2,913.9 1,956.4 621.5 56.1 5,547.9 43.0 -130.2 521.0 433.9 17,437.1 8,259.0 357.0 8,616.0 8,835.0 676.0 9,511.0 744.8 17,286.9
Q3 3,088.1 559.3 3,647.4 209.7 8,073.8 975.2 9,258.7 3,174.0 1,884.8 590.7 64.4 5,713.9 49.3 -427.0 402.7 25.0 18,645.0 10,776.0 265.0 11,041.0 9,677.0 651.0 10,328.0 790.9 20,148.9
Q4 3,507.2 606.2 4,113.5 222.7 7,725.8 1,069.8 9,018.3 3,133.7 2,290.0 692.0 57.6 6,173.4 55.7 2,513.0 439.3 3,008.0 22,313.1 4,704.0 382.0 5,086.0 9,313.0 832.0 10,145.0 2,546.3 19,800.4
2009 Q1 3,235.4 620.2 3,855.6 307.8 7,103.8 904.6 8,316.1 3,311.1 1,865.6 802.8 62.4 6,041.9 51.4 885.3 679.4 1,616.1 19,829.7 3,886.0 317.6 4,203.6 7,736.0 1,096.0 8,832.0 1,394.7 16,596.0
Q2 3,443.0 653.7 4,096.7 296.0 6,924.3 1,162.2 8,382.4 3,723.9 2,106.8 568.1 79.2 6,478.1 46.4 -350.2 444.6 140.8 19,098.1 6,590.0 633.0 7,223.0 8,001.0 1,295.0 9,296.0 1,706.5 18,731.5
Q3 3,033.0 608.5 3,641.5 310.4 9,134.0 933.3 10,377.7 4,025.5 1,930.9 495.8 90.9 6,543.1 44.0 72.3 409.0 525.3 21,087.6 6,825.0 359.0 7,184.0 8,422.0 1,050.0 9,472.0 -327.7 18,471.9
Q4 3,259.8 639.2 3,899.1 302.8 8,915.5 929.0 10,147.3 3,527.2 2,174.6 799.2 81.4 6,582.4 50.1 -60.5 681.7 671.4 21,300.1 6,565.0 390.0 6,955.0 9,187.0 1,329.0 10,516.0 1,923.9 19,663.0
2010 Q1 3,448.5 671.6 4,120.1 319.3 7,830.2 1,044.0 9,193.5 3,718.7 2,280.9 677.0 70.2 6,746.7 57.7 568.2 472.2 1,098.1 21,158.4 7,167.0 1,528.0 8,695.0 9,199.0 1,426.0 10,625.0 389.3 19,617.7
Q2 3,603.3 699.0 4,302.3 335.0 9,298.0 1,048.9 10,681.9 4,118.3 2,251.0 608.7 89.2 7,067.2 51.0 914.1 523.7 1,488.8 23,540.1 7,103.0 1,683.0 8,786.0 8,771.0 1,772.0 10,543.0 -868.2 20,914.9
Q3 3,665.2 711.7 4,376.9 349.4 10,652.3 1,030.3 12,032.0 4,302.8 2,633.7 634.9 102.3 7,673.6 61.9 1,129.5 546.8 1,738.2 25,820.7 8,000.0 1,764.0 9,764.0 9,402.0 1,265.0 10,667.0 -1,811.0 23,106.7
Q4 3,646.7 716.0 4,362.7 331.4 9,414.7 1,038.7 10,784.8 4,713.1 2,319.2 590.1 91.5 7,714.0 83.2 1,797.2 566.6 2,447.0 25,308.4 8,967.0 1,693.0 10,660.0 10,663.0 2,034.0 12,697.0 -43.3 23,228.1
2011 Q1 4,064.0 711.2 4,775.2 344.2 9,412.9 1,004.1 10,761.2 4,361.0 2,239.9 763.6 105.4 7,469.9 0.3 -342.4 496.5 154.5 23,160.8 10,018.0 2,032.0 12,050.0 11,976.0 2,243.0 14,219.0 2,871.1 23,862.8
Q2 4,281.1 711.6 4,992.6 348.2 10,466.3 1,045.3 11,859.9 4,824.2 2,918.0 707.2 94.1 8,543.6 0.3 -7,809.9 484.8 -7,324.9 18,071.2 12,800.0 1,918.0 14,718.0 11,511.0 1,846.0 13,357.0 6,492.2 25,924.5
Q3 4,200.5 682.4 4,882.8 366.5 11,252.9 1,164.4 12,783.8 4,929.0 3,018.6 743.7 106.6 8,798.0 0.3 7,016.9 508.6 7,525.8 33,990.5 12,418.0 1,961.0 14,379.0 12,716.0 1,801.0 14,517.0 -6,895.2 26,957.3
Q4 4,047.4 709.3 4,756.6 405.6 11,623.8 1,194.8 13,224.2 5,250.1 2,731.0 748.1 100.0 8,829.2 0.4 5,988.8 511.2 6,500.4 33,310.4 8,807.0 2,484.0 11,291.0 12,618.0 1,553.0 14,171.0 -2,195.1 28,235.3

28 29GROSS DOMESTIC PRODUCT GROSS DOMESTIC PRODUCTStatistics Botswana Statistics Botswana
Table 5: Gross Domestic Product by Type of Expenditure at Current Prices (P million)
Government Final Consumtion
Household Final Consumption Gross Fixed Capital Formation Change in Inventories Exports Imports
Ca
lend
ar
yea
r
Ce
ntra
l Go
vt
Loc
al G
ovt
Tota
l
No
n-Pr
ofit
In
stitu
tions
Ho
use
hold
C
ons
ump
tion
(Mkt
))
Ho
use
hold
C
ons
ump
tion
(No
n- M
kt)
Tota
l
Co
nstr
uctio
n
Ma
chi
nery
&
Equi
pm
ent
Tra
nsp
ort
Eq
uip
me
nt
Min
era
l Pr
osp
ec
ting
Tota
l
Live
sto
ck
Min
era
ls
Oth
ers
Tota
l
Gro
ss D
om
est
ic
Exp
end
iture
Go
od
s
Serv
ice
s
Tota
l
Go
od
s
Serv
ice
s
Tota
l
Erre
ors
&
Om
issi
ons
Tota
l GD
P
2012 Q1 4,371.3 707.4 5,078.8 479.9 9,325.5 1,116.2 10,921.7 5,712.3 3,053.4 836.4 118.8 9,720.9 45.4 712.8 637.8 1,396.0 27,117.4 9,783.0 1,975.0 11,758.0 12,823.0 1,521.0 14,344.0 1,512.7 26,044.1
Q2 4,931.2 711.3 5,642.5 489.3 13,148.6 1,048.1 14,686.0 5,372.4 3,251.4 961.2 93.9 9,678.8 50.2 -122.6 578.1 505.7 30,513.1 10,414.0 2,014.0 12,428.0 12,903.0 1,648.0 14,551.0 -664.0 27,726.0
Q3 4,470.0 710.5 5,180.5 519.9 13,589.5 1,002.9 15,112.3 5,906.6 3,146.8 832.8 119.7 10,005.9 60.9 -1,110.1 641.4 -407.8 29,890.9 13,556.0 1,961.0 15,517.0 19,499.0 1,925.0 21,424.0 3,557.9 27,541.9
Q4 4,570.3 723.5 5,293.8 506.1 14,725.9 1,148.3 16,380.3 6,317.7 3,150.3 806.8 123.1 10,397.8 31.1 741.5 603.4 1,376.0 33,447.9 12,133.0 2,276.0 14,409.0 15,849.0 1,297.0 17,146.0 -2,152.5 28,558.5
2013 Q1 4,839.4 750.0 5,589.4 518.3 13,874.1 1,218.7 15,611.1 6,497.2 2,509.3 586.0 140.5 9,733.1 -140.5 -4,500.8 718.1 -3,923.2 27,010.3 16,867.0 2,151.0 19,018.0 16,218.0 1,859.0 18,077.0 474.3 28,425.6
Q2 4,955.4 774.7 5,730.0 535.7 13,616.5 1,541.2 15,693.3 6,637.0 3,293.9 716.9 142.1 10,789.9 -70.1 -304.8 1,374.8 999.9 33,213.1 14,736.0 2,675.0 17,411.0 17,064.0 2,010.0 19,074.0 912.7 32,462.8
Q3 5,070.9 807.3 5,878.3 545.5 14,503.8 1,330.7 16,379.9 6,650.2 3,176.6 480.2 143.5 10,450.4 -30.2 -197.2 -2,420.8 -2,648.2 30,060.4 19,550.0 2,792.0 22,342.0 17,127.0 1,996.0 19,123.0 -1,613.7 31,665.7
Q4 5,139.7 877.4 6,017.1 555.5 15,517.8 1,351.9 17,425.2 6,845.6 3,336.2 625.0 144.9 10,951.8 -20.8 250.5 224.6 454.3 34,848.4 15,398.0 2,819.0 18,217.0 18,976.0 1,643.0 20,619.0 157.8 32,604.2
2014 Q1 5,996.4 895.3 6,891.7 565.3 14,174.6 1,363.5 16,103.5 6,994.6 3,189.6 626.6 149.2 10,960.1 -41.9 -120.9 70.0 -92.7 33,862.6 17,271.0 2,947.0 20,218.0 17,908.0 1,742.0 19,650.0 77.8 34,508.4
Q2 6,401.8 933.5 7,335.4 573.2 14,368.1 1,488.1 16,429.4 7,220.8 2,977.9 720.1 151.8 11,070.7 -17.0 -295.5 -498.4 -810.9 34,024.5 21,095.0 2,911.0 24,006.0 18,382.0 1,626.0 20,008.0 -304.1 37,718.4
Q3 6,496.0 956.5 7,452.5 580.8 15,515.2 1,524.7 17,620.7 7,250.6 2,392.8 686.7 153.6 10,483.7 53.7 189.0 -1,909.3 -1,666.6 33,890.3 19,845.0 3,099.0 22,944.0 17,774.0 1,631.0 19,405.0 -1,273.7 36,155.6
Q4 6,449.5 948.6 7,398.1 589.0 16,221.5 1,510.6 18,321.1 7,309.8 3,786.1 663.7 158.6 11,918.2 170.3 -189.8 -1,209.3 -1,228.8 36,408.6 18,383.0 3,181.0 21,564.0 17,670.0 1,952.0 19,622.0 -864.7 37,486.0
2015 Q1 6,357.9 962.7 7,320.6 596.6 15,718.3 1,539.3 17,854.2 7,547.4 3,267.7 578.3 163.6 11,557.0 332.8 89.3 -1,692.8 -1,270.7 35,461.1 19,510.0 2,723.0 22,233.0 18,171.0 1,688.0 19,859.0 -1,264.8 36,570.3
Q2 6,547.1 1,005.3 7,552.4 606.9 16,649.2 1,573.5 18,829.6 7,847.5 3,884.8 638.1 154.9 12,525.2 413.2 207.8 -2,335.9 -1,714.9 37,192.3 19,832.0 3,276.0 23,108.0 19,700.0 1,569.0 21,269.0 -1,701.7 37,329.7
Q3 6,497.5 1,021.8 7,519.3 620.8 16,935.2 1,568.9 19,124.9 7,889.4 4,155.2 637.6 161.3 12,843.5 411.7 782.1 460.3 1,654.1 41,141.8 11,852.0 3,372.0 15,224.0 17,803.0 1,548.0 19,351.0 225.5 37,240.2
Q4 6,631.6 1,032.8 7,664.4 635.8 17,968.4 1,596.3 20,200.5 8,045.3 3,825.2 679.0 168.2 12,717.6 328.0 1,746.4 -3,530.5 -1,456.1 39,126.4 12,334.0 3,324.0 15,658.0 16,119.0 1,558.0 17,677.0 -2,324.3 34,783.2
2016 Q1 6,691.2 1,069.2 7,760.4 646.1 16,930.8 1,692.3 19,269.2 8,315.7 3,201.5 503.6 173.4 12,194.2 162.3 -715.9 -2,447.1 -3,000.6 36,223.3 19,730.9 3,317.0 23,047.9 16,272.1 1,052.5 17,324.6 -2,447.1 39,499.5
Q2 6,856.2 1,064.8 7,921.0 657.6 17,214.8 1,713.2 19,585.6 8,598.4 3,884.7 598.5 165.7 13,247.3 38.1 -178.2 -5,905.4 -6,045.6 34,708.3 25,387.9 3,290.0 28,677.8 16,979.8 1,460.4 18,440.2 -2,505.4 42,440.5
Q3 6,507.8 1,072.1 7,579.9 671.5 18,486.1 1,724.8 20,882.4 8,899.4 3,850.1 725.8 171.2 13,646.5 -44.8 -1,189.3 -1,114.3 -2,348.4 39,760.4 18,911.1 3,303.5 22,214.6 15,513.6 1,256.4 16,770.1 -1,114.3 44,090.6
Q4 6,607.6 1,077.9 7,685.4 687.2 19,080.5 1,616.1 21,383.9 8,970.6 4,179.8 569.3 178.2 13,897.8 -86.2 46.2 -97.0 -137.0 42,830.1 16,167.5 3,903.3 20,070.8 17,078.3 2,068.1 19,146.4 -97.0 43,657.4
2017 Q1 6,753.1 1,105.7 7,858.8 695.1 19,454.8 1,689.1 21,838.9 8,979.5 2,811.0 398.3 182.0 12,370.8 -87.1 -158.0 -3,412.0 -3,657.0 38,411.5 17,289.0 3,603.0 20,892.0 11,567.0 1,487.0 13,054.0 -2,603.9 43,645.6
Q2 7,204.7 1,166.2 8,370.9 710.6 19,393.4 1,759.2 21,863.2 9,248.9 2,683.4 439.3 174.7 12,546.3 -94.8 327.9 -1,449.1 -1,216.1 41,564.4 14,821.4 3,753.1 18,574.5 13,907.0 1,777.5 15,684.5 -1,449.1 43,005.2
Q3 7,324.1 974.2 8,298.3 725.9 19,543.9 1,817.2 22,086.9 9,711.4 3,072.4 453.1 179.7 13,416.5 396.2 -363.9 -100.0 -67.7 43,734.0 13,271.1 2,539.5 15,810.6 12,962.6 2,510.0 15,472.6 1,749.9 45,822.0
Q4 7,611.1 986.5 8,597.6 733.2 19,784.3 1,812.5 22,330.0 9,837.6 3,463.2 687.2 186.0 14,174.0 442.6 76.8 -450.0 69.4 45,171.0 15,556.2 2,810.0 18,366.2 14,658.1 2,409.0 17,067.1 -266.8 46,203.3
2018 Q1 7,626.6 990.7 8,617.3 740.7 20,111.2 1,813.9 22,665.8 9,877.0 3,305.7 596.4 191.1 13,970.1 446.5 28.1 550.0 1,024.6 46,277.9 13,827.5 2,512.0 16,339.5 14,165.5 1,232.0 15,397.5 -1,399.5 45,820.4
Q2 7,809.0 1,014.2 8,823.2 750.4 20,487.9 1,857.0 23,095.2 10,222.7 3,086.7 578.7 186.2 14,074.2 450.4 855.2 -3,517.0 -2,211.4 43,781.2 18,934.5 2,365.0 21,299.5 14,555.4 1,543.0 16,098.4 -2,015.0 46,967.4
Q3 7,964.0 1,096.9 9,060.9 766.7 21,340.9 1,885.1 23,992.7 10,580.4 3,296.3 572.8 188.5 14,638.1 454.3 -632.6 -521.0 -699.3 46,992.4 16,106.1 2,562.3 18,668.4 14,459.7 1,728.0 16,187.7 -560.8 48,912.3
Note: 2016-2018 estimates are provisional
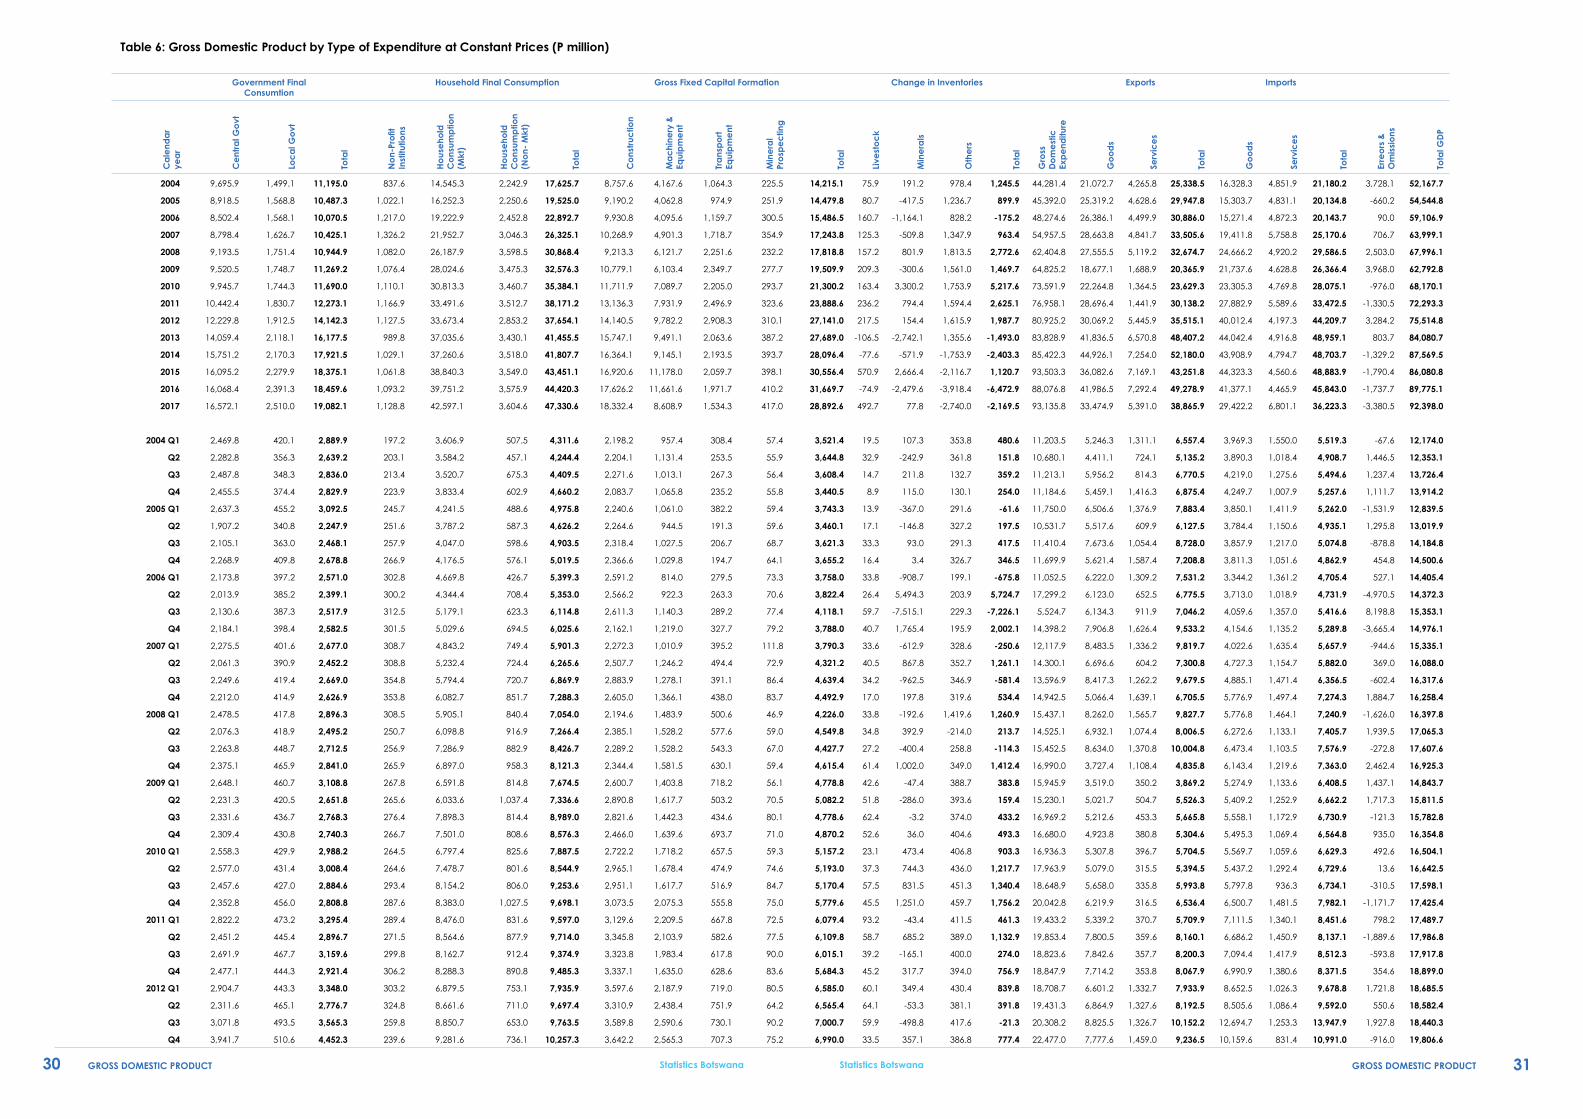
30 31GROSS DOMESTIC PRODUCT GROSS DOMESTIC PRODUCTStatistics Botswana Statistics Botswana
Table 6: Gross Domestic Product by Type of Expenditure at Constant Prices (P million)
Government Final Consumtion
Household Final Consumption Gross Fixed Capital Formation Change in Inventories Exports Imports
Ca
lend
ar
yea
r
Ce
ntra
l Go
vt
Loc
al G
ovt
Tota
l
No
n-Pr
ofit
In
stitu
tions
Ho
use
hold
C
ons
ump
tion
(Mkt
)
Ho
use
hold
C
ons
ump
tion
(No
n- M
kt)
Tota
l
Co
nstr
uctio
n
Ma
chi
nery
&
Equi
pm
ent
Tra
nsp
ort
Eq
uip
me
nt
Min
era
l Pr
osp
ec
ting
Tota
l
Live
sto
ck
Min
era
ls
Oth
ers
Tota
l
Gro
ss
Do
me
stic
Ex
pe
nditu
re
Go
od
s
Serv
ice
s
Tota
l
Go
od
s
Serv
ice
s
Tota
l
Erre
ors
&
Om
issi
ons
Tota
l GD
P
2004 9,695.9 1,499.1 11,195.0 837.6 14,545.3 2,242.9 17,625.7 8,757.6 4,167.6 1,064.3 225.5 14,215.1 75.9 191.2 978.4 1,245.5 44,281.4 21,072.7 4,265.8 25,338.5 16,328.3 4,851.9 21,180.2 3,728.1 52,167.7
2005 8,918.5 1,568.8 10,487.3 1,022.1 16,252.3 2,250.6 19,525.0 9,190.2 4,062.8 974.9 251.9 14,479.8 80.7 -417.5 1,236.7 899.9 45,392.0 25,319.2 4,628.6 29,947.8 15,303.7 4,831.1 20,134.8 -660.2 54,544.8
2006 8,502.4 1,568.1 10,070.5 1,217.0 19,222.9 2,452.8 22,892.7 9,930.8 4,095.6 1,159.7 300.5 15,486.5 160.7 -1,164.1 828.2 -175.2 48,274.6 26,386.1 4,499.9 30,886.0 15,271.4 4,872.3 20,143.7 90.0 59,106.9
2007 8,798.4 1,626.7 10,425.1 1,326.2 21,952.7 3,046.3 26,325.1 10,268.9 4,901.3 1,718.7 354.9 17,243.8 125.3 -509.8 1,347.9 963.4 54,957.5 28,663.8 4,841.7 33,505.6 19,411.8 5,758.8 25,170.6 706.7 63,999.1
2008 9,193.5 1,751.4 10,944.9 1,082.0 26,187.9 3,598.5 30,868.4 9,213.3 6,121.7 2,251.6 232.2 17,818.8 157.2 801.9 1,813.5 2,772.6 62,404.8 27,555.5 5,119.2 32,674.7 24,666.2 4,920.2 29,586.5 2,503.0 67,996.1
2009 9,520.5 1,748.7 11,269.2 1,076.4 28,024.6 3,475.3 32,576.3 10,779.1 6,103.4 2,349.7 277.7 19,509.9 209.3 -300.6 1,561.0 1,469.7 64,825.2 18,677.1 1,688.9 20,365.9 21,737.6 4,628.8 26,366.4 3,968.0 62,792.8
2010 9,945.7 1,744.3 11,690.0 1,110.1 30,813.3 3,460.7 35,384.1 11,711.9 7,089.7 2,205.0 293.7 21,300.2 163.4 3,300.2 1,753.9 5,217.6 73,591.9 22,264.8 1,364.5 23,629.3 23,305.3 4,769.8 28,075.1 -976.0 68,170.1
2011 10,442.4 1,830.7 12,273.1 1,166.9 33,491.6 3,512.7 38,171.2 13,136.3 7,931.9 2,496.9 323.6 23,888.6 236.2 794.4 1,594.4 2,625.1 76,958.1 28,696.4 1,441.9 30,138.2 27,882.9 5,589.6 33,472.5 -1,330.5 72,293.3
2012 12,229.8 1,912.5 14,142.3 1,127.5 33,673.4 2,853.2 37,654.1 14,140.5 9,782.2 2,908.3 310.1 27,141.0 217.5 154.4 1,615.9 1,987.7 80,925.2 30,069.2 5,445.9 35,515.1 40,012.4 4,197.3 44,209.7 3,284.2 75,514.8
2013 14,059.4 2,118.1 16,177.5 989.8 37,035.6 3,430.1 41,455.5 15,747.1 9,491.1 2,063.6 387.2 27,689.0 -106.5 -2,742.1 1,355.6 -1,493.0 83,828.9 41,836.5 6,570.8 48,407.2 44,042.4 4,916.8 48,959.1 803.7 84,080.7
2014 15,751.2 2,170.3 17,921.5 1,029.1 37,260.6 3,518.0 41,807.7 16,364.1 9,145.1 2,193.5 393.7 28,096.4 -77.6 -571.9 -1,753.9 -2,403.3 85,422.3 44,926.1 7,254.0 52,180.0 43,908.9 4,794.7 48,703.7 -1,329.2 87,569.5
2015 16,095.2 2,279.9 18,375.1 1,061.8 38,840.3 3,549.0 43,451.1 16,920.6 11,178.0 2,059.7 398.1 30,556.4 570.9 2,666.4 -2,116.7 1,120.7 93,503.3 36,082.6 7,169.1 43,251.8 44,323.3 4,560.6 48,883.9 -1,790.4 86,080.8
2016 16,068.4 2,391.3 18,459.6 1,093.2 39,751.2 3,575.9 44,420.3 17,626.2 11,661.6 1,971.7 410.2 31,669.7 -74.9 -2,479.6 -3,918.4 -6,472.9 88,076.8 41,986.5 7,292.4 49,278.9 41,377.1 4,465.9 45,843.0 -1,737.7 89,775.1
2017 16,572.1 2,510.0 19,082.1 1,128.8 42,597.1 3,604.6 47,330.6 18,332.4 8,608.9 1,534.3 417.0 28,892.6 492.7 77.8 -2,740.0 -2,169.5 93,135.8 33,474.9 5,391.0 38,865.9 29,422.2 6,801.1 36,223.3 -3,380.5 92,398.0
2004 Q1 2,469.8 420.1 2,889.9 197.2 3,606.9 507.5 4,311.6 2,198.2 957.4 308.4 57.4 3,521.4 19.5 107.3 353.8 480.6 11,203.5 5,246.3 1,311.1 6,557.4 3,969.3 1,550.0 5,519.3 -67.6 12,174.0
Q2 2,282.8 356.3 2,639.2 203.1 3,584.2 457.1 4,244.4 2,204.1 1,131.4 253.5 55.9 3,644.8 32.9 -242.9 361.8 151.8 10,680.1 4,411.1 724.1 5,135.2 3,890.3 1,018.4 4,908.7 1,446.5 12,353.1
Q3 2,487.8 348.3 2,836.0 213.4 3,520.7 675.3 4,409.5 2,271.6 1,013.1 267.3 56.4 3,608.4 14.7 211.8 132.7 359.2 11,213.1 5,956.2 814.3 6,770.5 4,219.0 1,275.6 5,494.6 1,237.4 13,726.4
Q4 2,455.5 374.4 2,829.9 223.9 3,833.4 602.9 4,660.2 2,083.7 1,065.8 235.2 55.8 3,440.5 8.9 115.0 130.1 254.0 11,184.6 5,459.1 1,416.3 6,875.4 4,249.7 1,007.9 5,257.6 1,111.7 13,914.2
2005 Q1 2,637.3 455.2 3,092.5 245.7 4,241.5 488.6 4,975.8 2,240.6 1,061.0 382.2 59.4 3,743.3 13.9 -367.0 291.6 -61.6 11,750.0 6,506.6 1,376.9 7,883.4 3,850.1 1,411.9 5,262.0 -1,531.9 12,839.5
Q2 1,907.2 340.8 2,247.9 251.6 3,787.2 587.3 4,626.2 2,264.6 944.5 191.3 59.6 3,460.1 17.1 -146.8 327.2 197.5 10,531.7 5,517.6 609.9 6,127.5 3,784.4 1,150.6 4,935.1 1,295.8 13,019.9
Q3 2,105.1 363.0 2,468.1 257.9 4,047.0 598.6 4,903.5 2,318.4 1,027.5 206.7 68.7 3,621.3 33.3 93.0 291.3 417.5 11,410.4 7,673.6 1,054.4 8,728.0 3,857.9 1,217.0 5,074.8 -878.8 14,184.8
Q4 2,268.9 409.8 2,678.8 266.9 4,176.5 576.1 5,019.5 2,366.6 1,029.8 194.7 64.1 3,655.2 16.4 3.4 326.7 346.5 11,699.9 5,621.4 1,587.4 7,208.8 3,811.3 1,051.6 4,862.9 454.8 14,500.6
2006 Q1 2,173.8 397.2 2,571.0 302.8 4,669.8 426.7 5,399.3 2,591.2 814.0 279.5 73.3 3,758.0 33.8 -908.7 199.1 -675.8 11,052.5 6,222.0 1,309.2 7,531.2 3,344.2 1,361.2 4,705.4 527.1 14,405.4
Q2 2,013.9 385.2 2,399.1 300.2 4,344.4 708.4 5,353.0 2,566.2 922.3 263.3 70.6 3,822.4 26.4 5,494.3 203.9 5,724.7 17,299.2 6,123.0 652.5 6,775.5 3,713.0 1,018.9 4,731.9 -4,970.5 14,372.3
Q3 2,130.6 387.3 2,517.9 312.5 5,179.1 623.3 6,114.8 2,611.3 1,140.3 289.2 77.4 4,118.1 59.7 -7,515.1 229.3 -7,226.1 5,524.7 6,134.3 911.9 7,046.2 4,059.6 1,357.0 5,416.6 8,198.8 15,353.1
Q4 2,184.1 398.4 2,582.5 301.5 5,029.6 694.5 6,025.6 2,162.1 1,219.0 327.7 79.2 3,788.0 40.7 1,765.4 195.9 2,002.1 14,398.2 7,906.8 1,626.4 9,533.2 4,154.6 1,135.2 5,289.8 -3,665.4 14,976.1
2007 Q1 2,275.5 401.6 2,677.0 308.7 4,843.2 749.4 5,901.3 2,272.3 1,010.9 395.2 111.8 3,790.3 33.6 -612.9 328.6 -250.6 12,117.9 8,483.5 1,336.2 9,819.7 4,022.6 1,635.4 5,657.9 -944.6 15,335.1
Q2 2,061.3 390.9 2,452.2 308.8 5,232.4 724.4 6,265.6 2,507.7 1,246.2 494.4 72.9 4,321.2 40.5 867.8 352.7 1,261.1 14,300.1 6,696.6 604.2 7,300.8 4,727.3 1,154.7 5,882.0 369.0 16,088.0
Q3 2,249.6 419.4 2,669.0 354.8 5,794.4 720.7 6,869.9 2,883.9 1,278.1 391.1 86.4 4,639.4 34.2 -962.5 346.9 -581.4 13,596.9 8,417.3 1,262.2 9,679.5 4,885.1 1,471.4 6,356.5 -602.4 16,317.6
Q4 2,212.0 414.9 2,626.9 353.8 6,082.7 851.7 7,288.3 2,605.0 1,366.1 438.0 83.7 4,492.9 17.0 197.8 319.6 534.4 14,942.5 5,066.4 1,639.1 6,705.5 5,776.9 1,497.4 7,274.3 1,884.7 16,258.4
2008 Q1 2,478.5 417.8 2,896.3 308.5 5,905.1 840.4 7,054.0 2,194.6 1,483.9 500.6 46.9 4,226.0 33.8 -192.6 1,419.6 1,260.9 15,437.1 8,262.0 1,565.7 9,827.7 5,776.8 1,464.1 7,240.9 -1,626.0 16,397.8
Q2 2,076.3 418.9 2,495.2 250.7 6,098.8 916.9 7,266.4 2,385.1 1,528.2 577.6 59.0 4,549.8 34.8 392.9 -214.0 213.7 14,525.1 6,932.1 1,074.4 8,006.5 6,272.6 1,133.1 7,405.7 1,939.5 17,065.3
Q3 2,263.8 448.7 2,712.5 256.9 7,286.9 882.9 8,426.7 2,289.2 1,528.2 543.3 67.0 4,427.7 27.2 -400.4 258.8 -114.3 15,452.5 8,634.0 1,370.8 10,004.8 6,473.4 1,103.5 7,576.9 -272.8 17,607.6
Q4 2,375.1 465.9 2,841.0 265.9 6,897.0 958.3 8,121.3 2,344.4 1,581.5 630.1 59.4 4,615.4 61.4 1,002.0 349.0 1,412.4 16,990.0 3,727.4 1,108.4 4,835.8 6,143.4 1,219.6 7,363.0 2,462.4 16,925.3
2009 Q1 2,648.1 460.7 3,108.8 267.8 6,591.8 814.8 7,674.5 2,600.7 1,403.8 718.2 56.1 4,778.8 42.6 -47.4 388.7 383.8 15,945.9 3,519.0 350.2 3,869.2 5,274.9 1,133.6 6,408.5 1,437.1 14,843.7
Q2 2,231.3 420.5 2,651.8 265.6 6,033.6 1,037.4 7,336.6 2,890.8 1,617.7 503.2 70.5 5,082.2 51.8 -286.0 393.6 159.4 15,230.1 5,021.7 504.7 5,526.3 5,409.2 1,252.9 6,662.2 1,717.3 15,811.5
Q3 2,331.6 436.7 2,768.3 276.4 7,898.3 814.4 8,989.0 2,821.6 1,442.3 434.6 80.1 4,778.6 62.4 -3.2 374.0 433.2 16,969.2 5,212.6 453.3 5,665.8 5,558.1 1,172.9 6,730.9 -121.3 15,782.8
Q4 2,309.4 430.8 2,740.3 266.7 7,501.0 808.6 8,576.3 2,466.0 1,639.6 693.7 71.0 4,870.2 52.6 36.0 404.6 493.3 16,680.0 4,923.8 380.8 5,304.6 5,495.3 1,069.4 6,564.8 935.0 16,354.8
2010 Q1 2,558.3 429.9 2,988.2 264.5 6,797.4 825.6 7,887.5 2,722.2 1,718.2 657.5 59.3 5,157.2 23.1 473.4 406.8 903.3 16,936.3 5,307.8 396.7 5,704.5 5,569.7 1,059.6 6,629.3 492.6 16,504.1
Q2 2,577.0 431.4 3,008.4 264.6 7,478.7 801.6 8,544.9 2,965.1 1,678.4 474.9 74.6 5,193.0 37.3 744.3 436.0 1,217.7 17,963.9 5,079.0 315.5 5,394.5 5,437.2 1,292.4 6,729.6 13.6 16,642.5
Q3 2,457.6 427.0 2,884.6 293.4 8,154.2 806.0 9,253.6 2,951.1 1,617.7 516.9 84.7 5,170.4 57.5 831.5 451.3 1,340.4 18,648.9 5,658.0 335.8 5,993.8 5,797.8 936.3 6,734.1 -310.5 17,598.1
Q4 2,352.8 456.0 2,808.8 287.6 8,383.0 1,027.5 9,698.1 3,073.5 2,075.3 555.8 75.0 5,779.6 45.5 1,251.0 459.7 1,756.2 20,042.8 6,219.9 316.5 6,536.4 6,500.7 1,481.5 7,982.1 -1,171.7 17,425.4
2011 Q1 2,822.2 473.2 3,295.4 289.4 8,476.0 831.6 9,597.0 3,129.6 2,209.5 667.8 72.5 6,079.4 93.2 -43.4 411.5 461.3 19,433.2 5,339.2 370.7 5,709.9 7,111.5 1,340.1 8,451.6 798.2 17,489.7
Q2 2,451.2 445.4 2,896.7 271.5 8,564.6 877.9 9,714.0 3,345.8 2,103.9 582.6 77.5 6,109.8 58.7 685.2 389.0 1,132.9 19,853.4 7,800.5 359.6 8,160.1 6,686.2 1,450.9 8,137.1 -1,889.6 17,986.8
Q3 2,691.9 467.7 3,159.6 299.8 8,162.7 912.4 9,374.9 3,323.8 1,983.4 617.8 90.0 6,015.1 39.2 -165.1 400.0 274.0 18,823.6 7,842.6 357.7 8,200.3 7,094.4 1,417.9 8,512.3 -593.8 17,917.8
Q4 2,477.1 444.3 2,921.4 306.2 8,288.3 890.8 9,485.3 3,337.1 1,635.0 628.6 83.6 5,684.3 45.2 317.7 394.0 756.9 18,847.9 7,714.2 353.8 8,067.9 6,990.9 1,380.6 8,371.5 354.6 18,899.0
2012 Q1 2,904.7 443.3 3,348.0 303.2 6,879.5 753.1 7,935.9 3,597.6 2,187.9 719.0 80.5 6,585.0 60.1 349.4 430.4 839.8 18,708.7 6,601.2 1,332.7 7,933.9 8,652.5 1,026.3 9,678.8 1,721.8 18,685.5
Q2 2,311.6 465.1 2,776.7 324.8 8,661.6 711.0 9,697.4 3,310.9 2,438.4 751.9 64.2 6,565.4 64.1 -53.3 381.1 391.8 19,431.3 6,864.9 1,327.6 8,192.5 8,505.6 1,086.4 9,592.0 550.6 18,582.4
Q3 3,071.8 493.5 3,565.3 259.8 8,850.7 653.0 9,763.5 3,589.8 2,590.6 730.1 90.2 7,000.7 59.9 -498.8 417.6 -21.3 20,308.2 8,825.5 1,326.7 10,152.2 12,694.7 1,253.3 13,947.9 1,927.8 18,440.3
Q4 3,941.7 510.6 4,452.3 239.6 9,281.6 736.1 10,257.3 3,642.2 2,565.3 707.3 75.2 6,990.0 33.5 357.1 386.8 777.4 22,477.0 7,777.6 1,459.0 9,236.5 10,159.6 831.4 10,991.0 -916.0 19,806.6
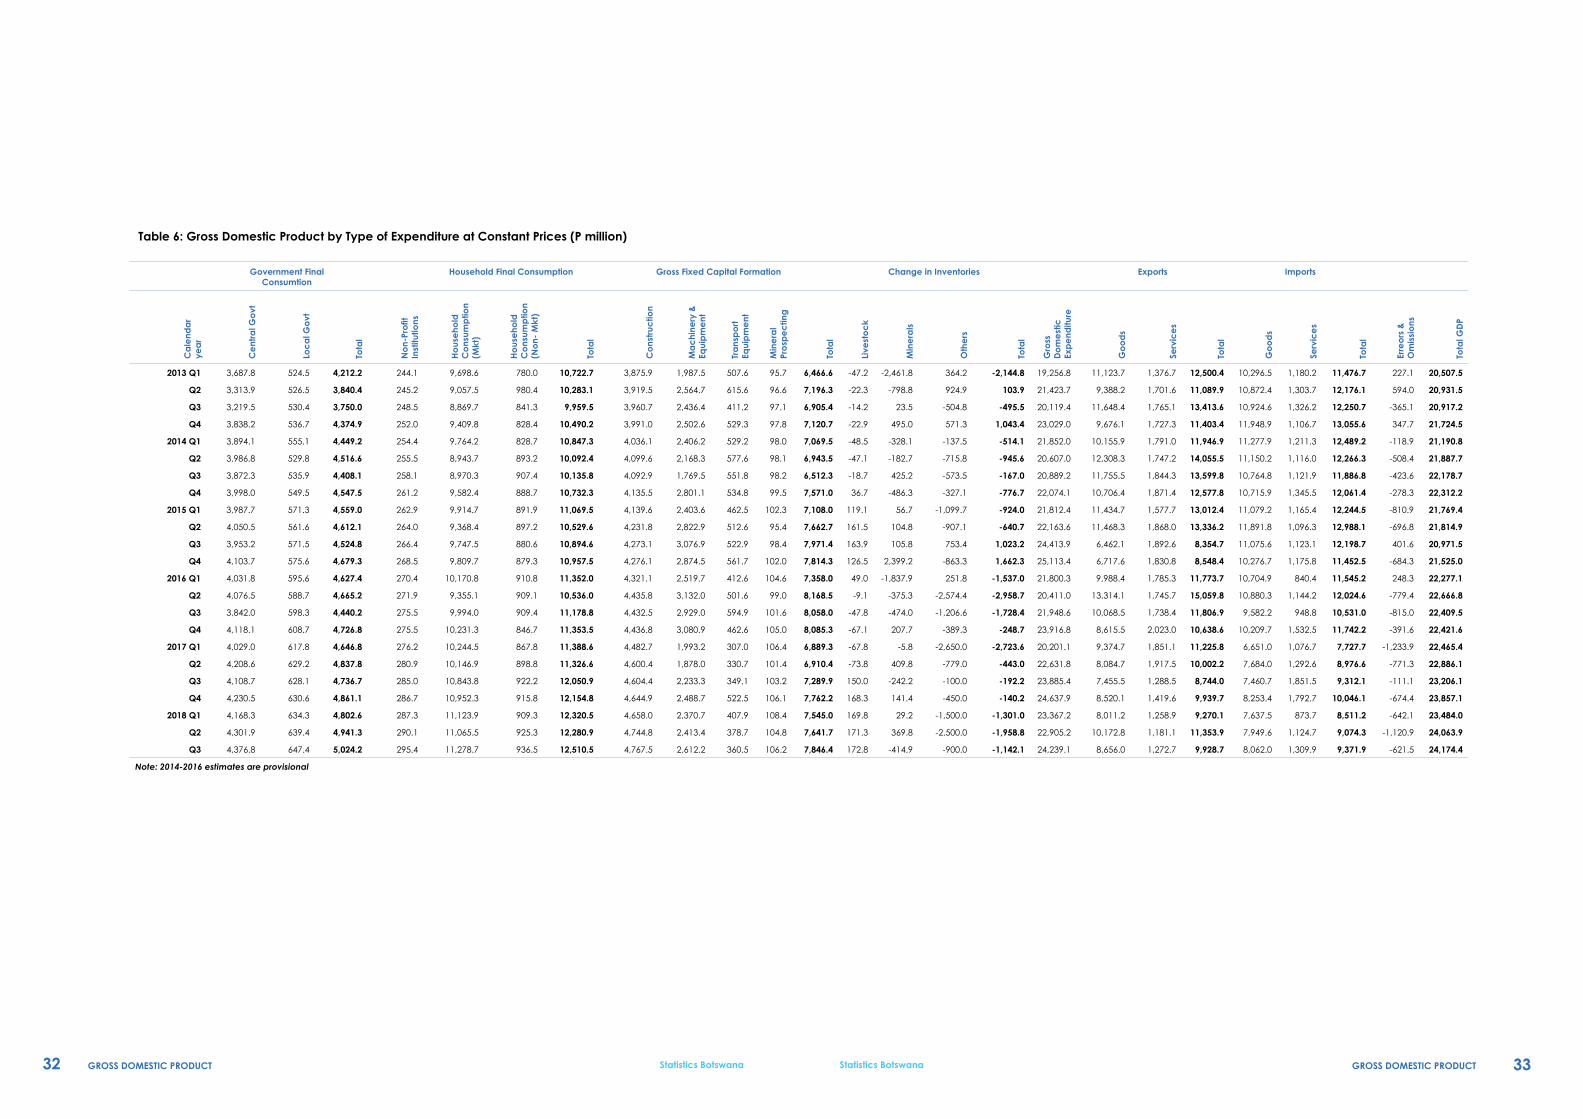
32 33GROSS DOMESTIC PRODUCT GROSS DOMESTIC PRODUCTStatistics Botswana Statistics Botswana
Table 6: Gross Domestic Product by Type of Expenditure at Constant Prices (P million)
Government Final Consumtion
Household Final Consumption Gross Fixed Capital Formation Change in Inventories Exports Imports
Ca
lend
ar
yea
r
Ce
ntra
l Go
vt
Loc
al G
ovt
Tota
l
No
n-Pr
ofit
In
stitu
tions
Ho
use
hold
C
ons
ump
tion
(Mkt
)
Ho
use
hold
C
ons
ump
tion
(No
n- M
kt)
Tota
l
Co
nstr
uctio
n
Ma
chi
nery
&
Equi
pm
ent
Tra
nsp
ort
Eq
uip
me
nt
Min
era
l Pr
osp
ec
ting
Tota
l
Live
sto
ck
Min
era
ls
Oth
ers
Tota
l
Gro
ss
Do
me
stic
Ex
pe
nditu
re
Go
od
s
Serv
ice
s
Tota
l
Go
od
s
Serv
ice
s
Tota
l
Erre
ors
&
Om
issi
ons
Tota
l GD
P
2013 Q1 3,687.8 524.5 4,212.2 244.1 9,698.6 780.0 10,722.7 3,875.9 1,987.5 507.6 95.7 6,466.6 -47.2 -2,461.8 364.2 -2,144.8 19,256.8 11,123.7 1,376.7 12,500.4 10,296.5 1,180.2 11,476.7 227.1 20,507.5
Q2 3,313.9 526.5 3,840.4 245.2 9,057.5 980.4 10,283.1 3,919.5 2,564.7 615.6 96.6 7,196.3 -22.3 -798.8 924.9 103.9 21,423.7 9,388.2 1,701.6 11,089.9 10,872.4 1,303.7 12,176.1 594.0 20,931.5
Q3 3,219.5 530.4 3,750.0 248.5 8,869.7 841.3 9,959.5 3,960.7 2,436.4 411.2 97.1 6,905.4 -14.2 23.5 -504.8 -495.5 20,119.4 11,648.4 1,765.1 13,413.6 10,924.6 1,326.2 12,250.7 -365.1 20,917.2
Q4 3,838.2 536.7 4,374.9 252.0 9,409.8 828.4 10,490.2 3,991.0 2,502.6 529.3 97.8 7,120.7 -22.9 495.0 571.3 1,043.4 23,029.0 9,676.1 1,727.3 11,403.4 11,948.9 1,106.7 13,055.6 347.7 21,724.5
2014 Q1 3,894.1 555.1 4,449.2 254.4 9,764.2 828.7 10,847.3 4,036.1 2,406.2 529.2 98.0 7,069.5 -48.5 -328.1 -137.5 -514.1 21,852.0 10,155.9 1,791.0 11,946.9 11,277.9 1,211.3 12,489.2 -118.9 21,190.8
Q2 3,986.8 529.8 4,516.6 255.5 8,943.7 893.2 10,092.4 4,099.6 2,168.3 577.6 98.1 6,943.5 -47.1 -182.7 -715.8 -945.6 20,607.0 12,308.3 1,747.2 14,055.5 11,150.2 1,116.0 12,266.3 -508.4 21,887.7
Q3 3,872.3 535.9 4,408.1 258.1 8,970.3 907.4 10,135.8 4,092.9 1,769.5 551.8 98.2 6,512.3 -18.7 425.2 -573.5 -167.0 20,889.2 11,755.5 1,844.3 13,599.8 10,764.8 1,121.9 11,886.8 -423.6 22,178.7
Q4 3,998.0 549.5 4,547.5 261.2 9,582.4 888.7 10,732.3 4,135.5 2,801.1 534.8 99.5 7,571.0 36.7 -486.3 -327.1 -776.7 22,074.1 10,706.4 1,871.4 12,577.8 10,715.9 1,345.5 12,061.4 -278.3 22,312.2
2015 Q1 3,987.7 571.3 4,559.0 262.9 9,914.7 891.9 11,069.5 4,139.6 2,403.6 462.5 102.3 7,108.0 119.1 56.7 -1,099.7 -924.0 21,812.4 11,434.7 1,577.7 13,012.4 11,079.2 1,165.4 12,244.5 -810.9 21,769.4
Q2 4,050.5 561.6 4,612.1 264.0 9,368.4 897.2 10,529.6 4,231.8 2,822.9 512.6 95.4 7,662.7 161.5 104.8 -907.1 -640.7 22,163.6 11,468.3 1,868.0 13,336.2 11,891.8 1,096.3 12,988.1 -696.8 21,814.9
Q3 3,953.2 571.5 4,524.8 266.4 9,747.5 880.6 10,894.6 4,273.1 3,076.9 522.9 98.4 7,971.4 163.9 105.8 753.4 1,023.2 24,413.9 6,462.1 1,892.6 8,354.7 11,075.6 1,123.1 12,198.7 401.6 20,971.5
Q4 4,103.7 575.6 4,679.3 268.5 9,809.7 879.3 10,957.5 4,276.1 2,874.5 561.7 102.0 7,814.3 126.5 2,399.2 -863.3 1,662.3 25,113.4 6,717.6 1,830.8 8,548.4 10,276.7 1,175.8 11,452.5 -684.3 21,525.0
2016 Q1 4,031.8 595.6 4,627.4 270.4 10,170.8 910.8 11,352.0 4,321.1 2,519.7 412.6 104.6 7,358.0 49.0 -1,837.9 251.8 -1,537.0 21,800.3 9,988.4 1,785.3 11,773.7 10,704.9 840.4 11,545.2 248.3 22,277.1
Q2 4,076.5 588.7 4,665.2 271.9 9,355.1 909.1 10,536.0 4,435.8 3,132.0 501.6 99.0 8,168.5 -9.1 -375.3 -2,574.4 -2,958.7 20,411.0 13,314.1 1,745.7 15,059.8 10,880.3 1,144.2 12,024.6 -779.4 22,666.8
Q3 3,842.0 598.3 4,440.2 275.5 9,994.0 909.4 11,178.8 4,432.5 2,929.0 594.9 101.6 8,058.0 -47.8 -474.0 -1,206.6 -1,728.4 21,948.6 10,068.5 1,738.4 11,806.9 9,582.2 948.8 10,531.0 -815.0 22,409.5
Q4 4,118.1 608.7 4,726.8 275.5 10,231.3 846.7 11,353.5 4,436.8 3,080.9 462.6 105.0 8,085.3 -67.1 207.7 -389.3 -248.7 23,916.8 8,615.5 2,023.0 10,638.6 10,209.7 1,532.5 11,742.2 -391.6 22,421.6
2017 Q1 4,029.0 617.8 4,646.8 276.2 10,244.5 867.8 11,388.6 4,482.7 1,993.2 307.0 106.4 6,889.3 -67.8 -5.8 -2,650.0 -2,723.6 20,201.1 9,374.7 1,851.1 11,225.8 6,651.0 1,076.7 7,727.7 -1,233.9 22,465.4
Q2 4,208.6 629.2 4,837.8 280.9 10,146.9 898.8 11,326.6 4,600.4 1,878.0 330.7 101.4 6,910.4 -73.8 409.8 -779.0 -443.0 22,631.8 8,084.7 1,917.5 10,002.2 7,684.0 1,292.6 8,976.6 -771.3 22,886.1
Q3 4,108.7 628.1 4,736.7 285.0 10,843.8 922.2 12,050.9 4,604.4 2,233.3 349.1 103.2 7,289.9 150.0 -242.2 -100.0 -192.2 23,885.4 7,455.5 1,288.5 8,744.0 7,460.7 1,851.5 9,312.1 -111.1 23,206.1
Q4 4,230.5 630.6 4,861.1 286.7 10,952.3 915.8 12,154.8 4,644.9 2,488.7 522.5 106.1 7,762.2 168.3 141.4 -450.0 -140.2 24,637.9 8,520.1 1,419.6 9,939.7 8,253.4 1,792.7 10,046.1 -674.4 23,857.1
2018 Q1 4,168.3 634.3 4,802.6 287.3 11,123.9 909.3 12,320.5 4,658.0 2,370.7 407.9 108.4 7,545.0 169.8 29.2 -1,500.0 -1,301.0 23,367.2 8,011.2 1,258.9 9,270.1 7,637.5 873.7 8,511.2 -642.1 23,484.0
Q2 4,301.9 639.4 4,941.3 290.1 11,065.5 925.3 12,280.9 4,744.8 2,413.4 378.7 104.8 7,641.7 171.3 369.8 -2,500.0 -1,958.8 22,905.2 10,172.8 1,181.1 11,353.9 7,949.6 1,124.7 9,074.3 -1,120.9 24,063.9
Q3 4,376.8 647.4 5,024.2 295.4 11,278.7 936.5 12,510.5 4,767.5 2,612.2 360.5 106.2 7,846.4 172.8 -414.9 -900.0 -1,142.1 24,239.1 8,656.0 1,272.7 9,928.7 8,062.0 1,309.9 9,371.9 -621.5 24,174.4
Note: 2014-2016 estimates are provisional
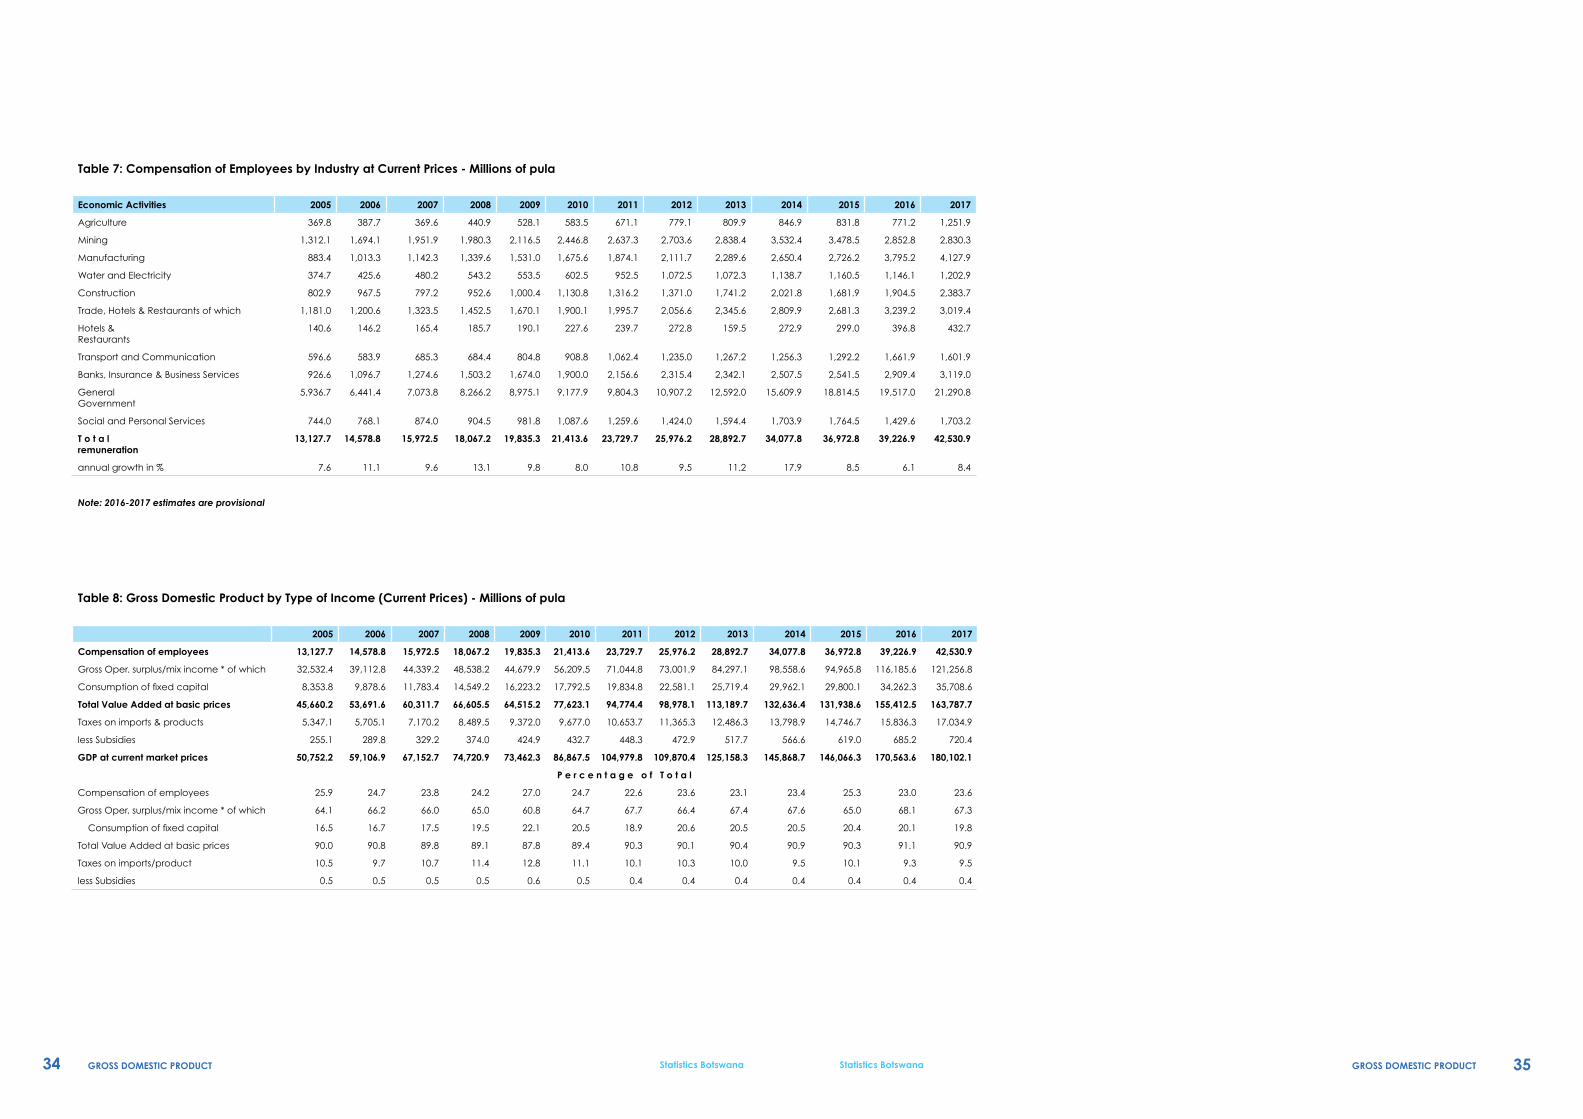
34 35GROSS DOMESTIC PRODUCT GROSS DOMESTIC PRODUCTStatistics Botswana Statistics Botswana
Table 8: Gross Domestic Product by Type of Income (Current Prices) - Millions of pula
2005 2006 2007 2008 2009 2010 2011 2012 2013 2014 2015 2016 2017
Compensation of employees 13,127.7 14,578.8 15,972.5 18,067.2 19,835.3 21,413.6 23,729.7 25,976.2 28,892.7 34,077.8 36,972.8 39,226.9 42,530.9
Gross Oper. surplus/mix income * of which 32,532.4 39,112.8 44,339.2 48,538.2 44,679.9 56,209.5 71,044.8 73,001.9 84,297.1 98,558.6 94,965.8 116,185.6 121,256.8
Consumption of fixed capital 8,353.8 9,878.6 11,783.4 14,549.2 16,223.2 17,792.5 19,834.8 22,581.1 25,719.4 29,962.1 29,800.1 34,262.3 35,708.6
Total Value Added at basic prices 45,660.2 53,691.6 60,311.7 66,605.5 64,515.2 77,623.1 94,774.4 98,978.1 113,189.7 132,636.4 131,938.6 155,412.5 163,787.7
Taxes on imports & products 5,347.1 5,705.1 7,170.2 8,489.5 9,372.0 9,677.0 10,653.7 11,365.3 12,486.3 13,798.9 14,746.7 15,836.3 17,034.9
less Subsidies 255.1 289.8 329.2 374.0 424.9 432.7 448.3 472.9 517.7 566.6 619.0 685.2 720.4
GDP at current market prices 50,752.2 59,106.9 67,152.7 74,720.9 73,462.3 86,867.5 104,979.8 109,870.4 125,158.3 145,868.7 146,066.3 170,563.6 180,102.1
P e r c e n t a g e o f T o t a l
Compensation of employees 25.9 24.7 23.8 24.2 27.0 24.7 22.6 23.6 23.1 23.4 25.3 23.0 23.6
Gross Oper. surplus/mix income * of which 64.1 66.2 66.0 65.0 60.8 64.7 67.7 66.4 67.4 67.6 65.0 68.1 67.3
Consumption of fixed capital 16.5 16.7 17.5 19.5 22.1 20.5 18.9 20.6 20.5 20.5 20.4 20.1 19.8
Total Value Added at basic prices 90.0 90.8 89.8 89.1 87.8 89.4 90.3 90.1 90.4 90.9 90.3 91.1 90.9
Taxes on imports/product 10.5 9.7 10.7 11.4 12.8 11.1 10.1 10.3 10.0 9.5 10.1 9.3 9.5
less Subsidies 0.5 0.5 0.5 0.5 0.6 0.5 0.4 0.4 0.4 0.4 0.4 0.4 0.4
Table 7: Compensation of Employees by Industry at Current Prices - Millions of pula
Economic Activities 2005 2006 2007 2008 2009 2010 2011 2012 2013 2014 2015 2016 2017
Agriculture 369.8 387.7 369.6 440.9 528.1 583.5 671.1 779.1 809.9 846.9 831.8 771.2 1,251.9
Mining 1,312.1 1,694.1 1,951.9 1,980.3 2,116.5 2,446.8 2,637.3 2,703.6 2,838.4 3,532.4 3,478.5 2,852.8 2,830.3
Manufacturing 883.4 1,013.3 1,142.3 1,339.6 1,531.0 1,675.6 1,874.1 2,111.7 2,289.6 2,650.4 2,726.2 3,795.2 4,127.9
Water and Electricity 374.7 425.6 480.2 543.2 553.5 602.5 952.5 1,072.5 1,072.3 1,138.7 1,160.5 1,146.1 1,202.9
Construction 802.9 967.5 797.2 952.6 1,000.4 1,130.8 1,316.2 1,371.0 1,741.2 2,021.8 1,681.9 1,904.5 2,383.7
Trade, Hotels & Restaurants of which 1,181.0 1,200.6 1,323.5 1,452.5 1,670.1 1,900.1 1,995.7 2,056.6 2,345.6 2,809.9 2,681.3 3,239.2 3,019.4
Hotels & Restaurants
140.6 146.2 165.4 185.7 190.1 227.6 239.7 272.8 159.5 272.9 299.0 396.8 432.7
Transport and Communication 596.6 583.9 685.3 684.4 804.8 908.8 1,062.4 1,235.0 1,267.2 1,256.3 1,292.2 1,661.9 1,601.9
Banks, Insurance & Business Services 926.6 1,096.7 1,274.6 1,503.2 1,674.0 1,900.0 2,156.6 2,315.4 2,342.1 2,507.5 2,541.5 2,909.4 3,119.0
General Government
5,936.7 6,441.4 7,073.8 8,266.2 8,975.1 9,177.9 9,804.3 10,907.2 12,592.0 15,609.9 18,814.5 19,517.0 21,290.8
Social and Personal Services 744.0 768.1 874.0 904.5 981.8 1,087.6 1,259.6 1,424.0 1,594.4 1,703.9 1,764.5 1,429.6 1,703.2
T o t a l remuneration
13,127.7 14,578.8 15,972.5 18,067.2 19,835.3 21,413.6 23,729.7 25,976.2 28,892.7 34,077.8 36,972.8 39,226.9 42,530.9
annual growth in % 7.6 11.1 9.6 13.1 9.8 8.0 10.8 9.5 11.2 17.9 8.5 6.1 8.4
Note: 2016-2017 estimates are provisional
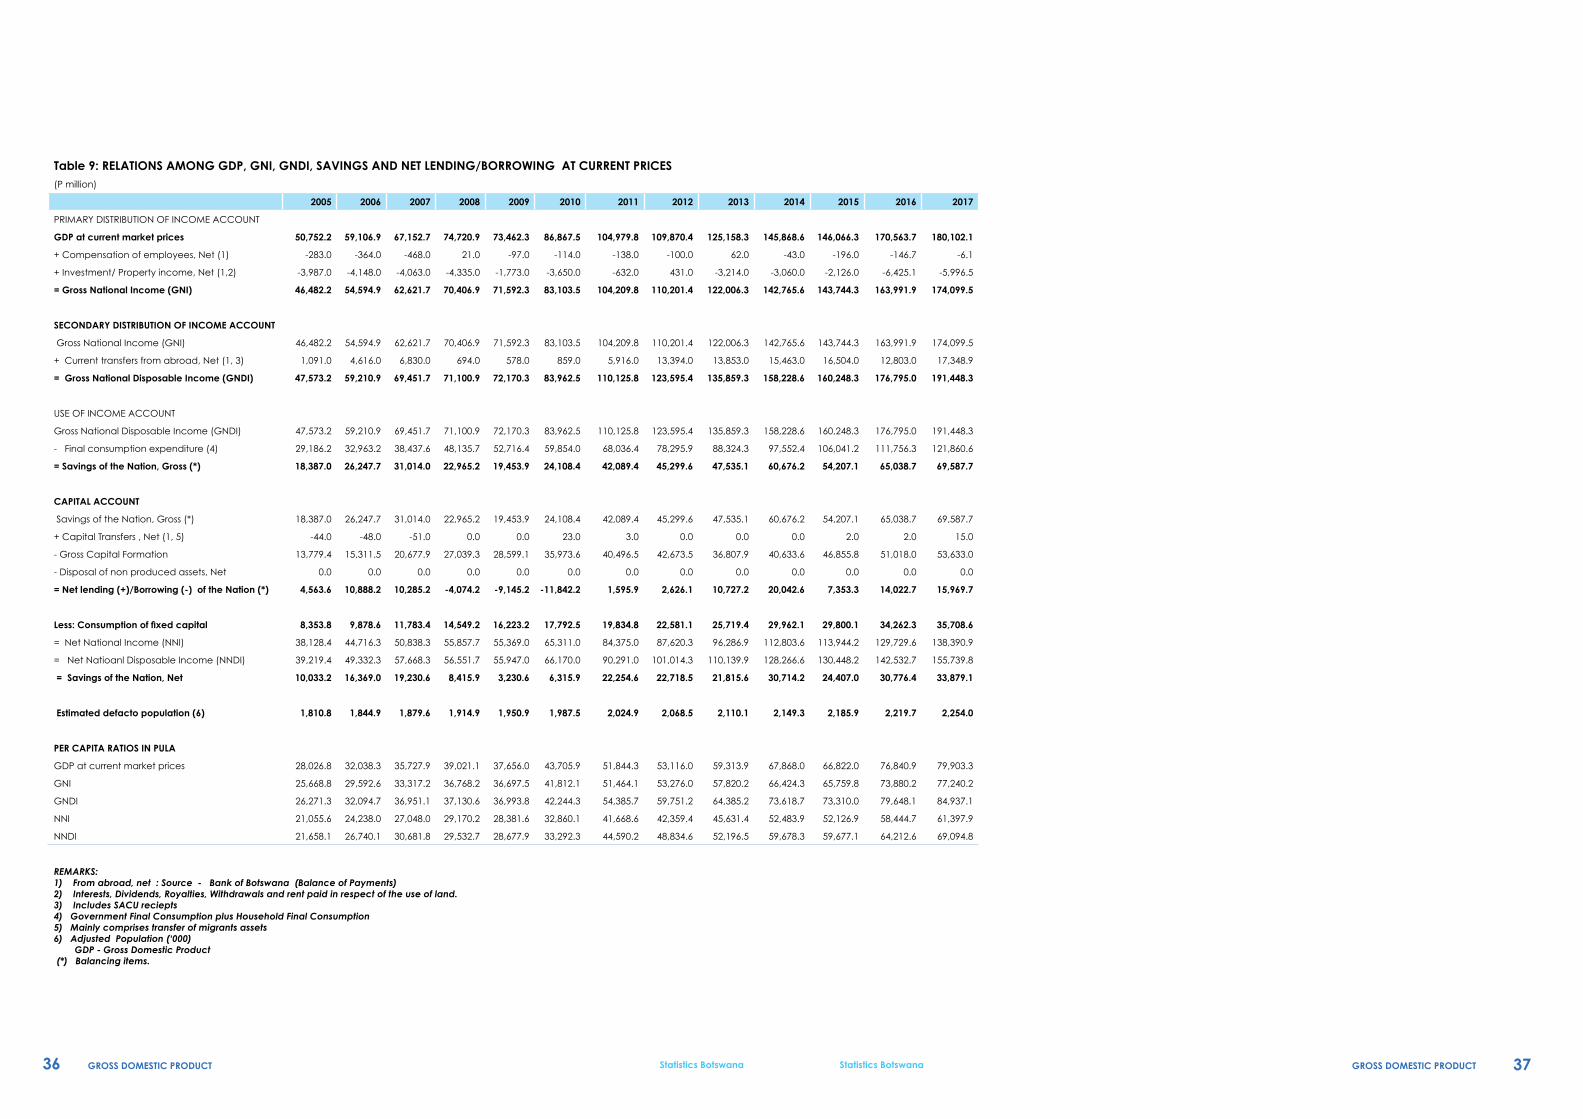
36 37GROSS DOMESTIC PRODUCT GROSS DOMESTIC PRODUCTStatistics Botswana Statistics Botswana
Table 9: RELATIONS AMONG GDP, GNI, GNDI, SAVINGS AND NET LENDING/BORROWING AT CURRENT PRICES(P million)
2005 2006 2007 2008 2009 2010 2011 2012 2013 2014 2015 2016 2017
PRIMARY DISTRIBUTION OF INCOME ACCOUNT
GDP at current market prices 50,752.2 59,106.9 67,152.7 74,720.9 73,462.3 86,867.5 104,979.8 109,870.4 125,158.3 145,868.6 146,066.3 170,563.7 180,102.1
+ Compensation of employees, Net (1) -283.0 -364.0 -468.0 21.0 -97.0 -114.0 -138.0 -100.0 62.0 -43.0 -196.0 -146.7 -6.1
+ Investment/ Property income, Net (1,2) -3,987.0 -4,148.0 -4,063.0 -4,335.0 -1,773.0 -3,650.0 -632.0 431.0 -3,214.0 -3,060.0 -2,126.0 -6,425.1 -5,996.5
= Gross National Income (GNI) 46,482.2 54,594.9 62,621.7 70,406.9 71,592.3 83,103.5 104,209.8 110,201.4 122,006.3 142,765.6 143,744.3 163,991.9 174,099.5
SECONDARY DISTRIBUTION OF INCOME ACCOUNT
Gross National Income (GNI) 46,482.2 54,594.9 62,621.7 70,406.9 71,592.3 83,103.5 104,209.8 110,201.4 122,006.3 142,765.6 143,744.3 163,991.9 174,099.5
+ Current transfers from abroad, Net (1, 3) 1,091.0 4,616.0 6,830.0 694.0 578.0 859.0 5,916.0 13,394.0 13,853.0 15,463.0 16,504.0 12,803.0 17,348.9
= Gross National Disposable Income (GNDI) 47,573.2 59,210.9 69,451.7 71,100.9 72,170.3 83,962.5 110,125.8 123,595.4 135,859.3 158,228.6 160,248.3 176,795.0 191,448.3
USE OF INCOME ACCOUNT
Gross National Disposable Income (GNDI) 47,573.2 59,210.9 69,451.7 71,100.9 72,170.3 83,962.5 110,125.8 123,595.4 135,859.3 158,228.6 160,248.3 176,795.0 191,448.3
- Final consumption expenditure (4) 29,186.2 32,963.2 38,437.6 48,135.7 52,716.4 59,854.0 68,036.4 78,295.9 88,324.3 97,552.4 106,041.2 111,756.3 121,860.6
= Savings of the Nation, Gross (*) 18,387.0 26,247.7 31,014.0 22,965.2 19,453.9 24,108.4 42,089.4 45,299.6 47,535.1 60,676.2 54,207.1 65,038.7 69,587.7
CAPITAL ACCOUNT
Savings of the Nation, Gross (*) 18,387.0 26,247.7 31,014.0 22,965.2 19,453.9 24,108.4 42,089.4 45,299.6 47,535.1 60,676.2 54,207.1 65,038.7 69,587.7
+ Capital Transfers , Net (1, 5) -44.0 -48.0 -51.0 0.0 0.0 23.0 3.0 0.0 0.0 0.0 2.0 2.0 15.0
- Gross Capital Formation 13,779.4 15,311.5 20,677.9 27,039.3 28,599.1 35,973.6 40,496.5 42,673.5 36,807.9 40,633.6 46,855.8 51,018.0 53,633.0
- Disposal of non produced assets, Net 0.0 0.0 0.0 0.0 0.0 0.0 0.0 0.0 0.0 0.0 0.0 0.0 0.0
= Net lending (+)/Borrowing (-) of the Nation (*) 4,563.6 10,888.2 10,285.2 -4,074.2 -9,145.2 -11,842.2 1,595.9 2,626.1 10,727.2 20,042.6 7,353.3 14,022.7 15,969.7
Less: Consumption of fixed capital 8,353.8 9,878.6 11,783.4 14,549.2 16,223.2 17,792.5 19,834.8 22,581.1 25,719.4 29,962.1 29,800.1 34,262.3 35,708.6
= Net National Income (NNI) 38,128.4 44,716.3 50,838.3 55,857.7 55,369.0 65,311.0 84,375.0 87,620.3 96,286.9 112,803.6 113,944.2 129,729.6 138,390.9
= Net Natioanl Disposable Income (NNDI) 39,219.4 49,332.3 57,668.3 56,551.7 55,947.0 66,170.0 90,291.0 101,014.3 110,139.9 128,266.6 130,448.2 142,532.7 155,739.8
= Savings of the Nation, Net 10,033.2 16,369.0 19,230.6 8,415.9 3,230.6 6,315.9 22,254.6 22,718.5 21,815.6 30,714.2 24,407.0 30,776.4 33,879.1
Estimated defacto population (6) 1,810.8 1,844.9 1,879.6 1,914.9 1,950.9 1,987.5 2,024.9 2,068.5 2,110.1 2,149.3 2,185.9 2,219.7 2,254.0
PER CAPITA RATIOS IN PULA
GDP at current market prices 28,026.8 32,038.3 35,727.9 39,021.1 37,656.0 43,705.9 51,844.3 53,116.0 59,313.9 67,868.0 66,822.0 76,840.9 79,903.3
GNI 25,668.8 29,592.6 33,317.2 36,768.2 36,697.5 41,812.1 51,464.1 53,276.0 57,820.2 66,424.3 65,759.8 73,880.2 77,240.2
GNDI 26,271.3 32,094.7 36,951.1 37,130.6 36,993.8 42,244.3 54,385.7 59,751.2 64,385.2 73,618.7 73,310.0 79,648.1 84,937.1
NNI 21,055.6 24,238.0 27,048.0 29,170.2 28,381.6 32,860.1 41,668.6 42,359.4 45,631.4 52,483.9 52,126.9 58,444.7 61,397.9
NNDI 21,658.1 26,740.1 30,681.8 29,532.7 28,677.9 33,292.3 44,590.2 48,834.6 52,196.5 59,678.3 59,677.1 64,212.6 69,094.8
REMARKS:1) From abroad, net : Source - Bank of Botswana (Balance of Payments)2) Interests, Dividends, Royalties, Withdrawals and rent paid in respect of the use of land.3) Includes SACU reciepts4) Government Final Consumption plus Household Final Consumption 5) Mainly comprises transfer of migrants assets6) Adjusted Population (‘000) GDP - Gross Domestic Product (*) Balancing items.
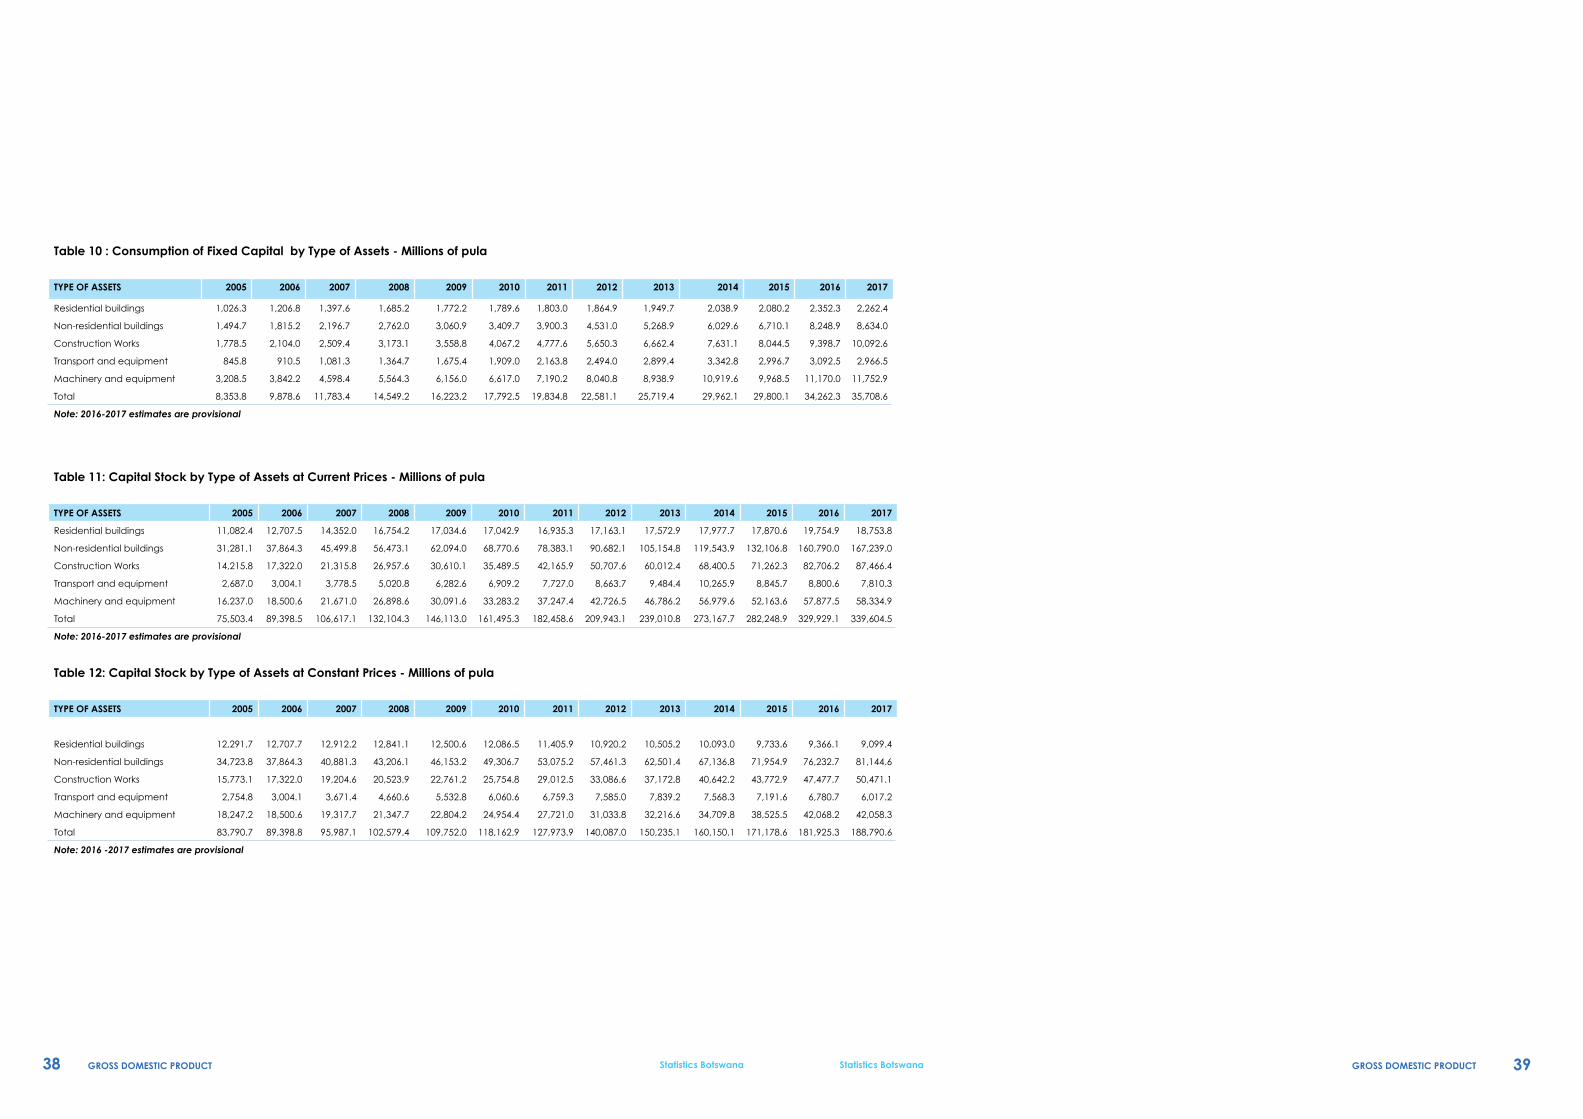
38 39GROSS DOMESTIC PRODUCT GROSS DOMESTIC PRODUCTStatistics Botswana Statistics Botswana
Table 11: Capital Stock by Type of Assets at Current Prices - Millions of pula
TYPE OF ASSETS 2005 2006 2007 2008 2009 2010 2011 2012 2013 2014 2015 2016 2017
Residential buildings 11,082.4 12,707.5 14,352.0 16,754.2 17,034.6 17,042.9 16,935.3 17,163.1 17,572.9 17,977.7 17,870.6 19,754.9 18,753.8
Non-residential buildings 31,281.1 37,864.3 45,499.8 56,473.1 62,094.0 68,770.6 78,383.1 90,682.1 105,154.8 119,543.9 132,106.8 160,790.0 167,239.0
Construction Works 14,215.8 17,322.0 21,315.8 26,957.6 30,610.1 35,489.5 42,165.9 50,707.6 60,012.4 68,400.5 71,262.3 82,706.2 87,466.4
Transport and equipment 2,687.0 3,004.1 3,778.5 5,020.8 6,282.6 6,909.2 7,727.0 8,663.7 9,484.4 10,265.9 8,845.7 8,800.6 7,810.3
Machinery and equipment 16,237.0 18,500.6 21,671.0 26,898.6 30,091.6 33,283.2 37,247.4 42,726.5 46,786.2 56,979.6 52,163.6 57,877.5 58,334.9
Total 75,503.4 89,398.5 106,617.1 132,104.3 146,113.0 161,495.3 182,458.6 209,943.1 239,010.8 273,167.7 282,248.9 329,929.1 339,604.5
Note: 2016-2017 estimates are provisional
Table 12: Capital Stock by Type of Assets at Constant Prices - Millions of pula
TYPE OF ASSETS 2005 2006 2007 2008 2009 2010 2011 2012 2013 2014 2015 2016 2017
Residential buildings 12,291.7 12,707.7 12,912.2 12,841.1 12,500.6 12,086.5 11,405.9 10,920.2 10,505.2 10,093.0 9,733.6 9,366.1 9,099.4
Non-residential buildings 34,723.8 37,864.3 40,881.3 43,206.1 46,153.2 49,306.7 53,075.2 57,461.3 62,501.4 67,136.8 71,954.9 76,232.7 81,144.6
Construction Works 15,773.1 17,322.0 19,204.6 20,523.9 22,761.2 25,754.8 29,012.5 33,086.6 37,172.8 40,642.2 43,772.9 47,477.7 50,471.1
Transport and equipment 2,754.8 3,004.1 3,671.4 4,660.6 5,532.8 6,060.6 6,759.3 7,585.0 7,839.2 7,568.3 7,191.6 6,780.7 6,017.2
Machinery and equipment 18,247.2 18,500.6 19,317.7 21,347.7 22,804.2 24,954.4 27,721.0 31,033.8 32,216.6 34,709.8 38,525.5 42,068.2 42,058.3
Total 83,790.7 89,398.8 95,987.1 102,579.4 109,752.0 118,162.9 127,973.9 140,087.0 150,235.1 160,150.1 171,178.6 181,925.3 188,790.6
Note: 2016 -2017 estimates are provisional
Table 10 : Consumption of Fixed Capital by Type of Assets - Millions of pula
TYPE OF ASSETS 2005 2006 2007 2008 2009 2010 2011 2012 2013 2014 2015 2016 2017
Residential buildings 1,026.3 1,206.8 1,397.6 1,685.2 1,772.2 1,789.6 1,803.0 1,864.9 1,949.7 2,038.9 2,080.2 2,352.3 2,262.4
Non-residential buildings 1,494.7 1,815.2 2,196.7 2,762.0 3,060.9 3,409.7 3,900.3 4,531.0 5,268.9 6,029.6 6,710.1 8,248.9 8,634.0
Construction Works 1,778.5 2,104.0 2,509.4 3,173.1 3,558.8 4,067.2 4,777.6 5,650.3 6,662.4 7,631.1 8,044.5 9,398.7 10,092.6
Transport and equipment 845.8 910.5 1,081.3 1,364.7 1,675.4 1,909.0 2,163.8 2,494.0 2,899.4 3,342.8 2,996.7 3,092.5 2,966.5
Machinery and equipment 3,208.5 3,842.2 4,598.4 5,564.3 6,156.0 6,617.0 7,190.2 8,040.8 8,938.9 10,919.6 9,968.5 11,170.0 11,752.9
Total 8,353.8 9,878.6 11,783.4 14,549.2 16,223.2 17,792.5 19,834.8 22,581.1 25,719.4 29,962.1 29,800.1 34,262.3 35,708.6
Note: 2016-2017 estimates are provisional

40 41GROSS DOMESTIC PRODUCT GROSS DOMESTIC PRODUCTStatistics Botswana Statistics Botswana
Table 13: Gross Fixed Capital Formation - Total Economy By Type Of Asset At Current Prices - Millions of pula
TYPE OF ASSETS 2005 2006 2007 2008 2009 2010 2011 2012 2013 2014 2015 2016 2017
Residential buildings 1,527.6 1,622.8 1,624.9 1,592.4 1,308.2 1,205.6 792.6 1,101.5 1,255.4 1,304.7 1,420.4 1,577.1 1,712.8
Non-residential buildings 4,009.2 4,955.7 5,554.5 5,800.6 7,026.0 7,808.0 9,465.6 11,452.9 13,748.6 14,288.4 15,556.0 17,271.2 18,757.5
Construction Works 2,748.7 3,652.8 4,599.0 4,906.0 6,567.6 8,192.3 9,512.2 11,894.2 13,259.2 13,796.0 15,001.2 16,624.2 18,029.6
Transport and equipment 950.4 1,159.8 1,768.0 2,430.4 2,665.8 2,510.7 2,962.6 3,437.1 3,206.9 2,697.1 2,532.9 2,397.1 1,976.2
Machinery and equipment 3,624.8 4,095.6 5,515.0 8,122.2 8,077.9 9,484.8 10,907.5 12,601.9 10,656.6 12,346.4 15,132.9 15,116.2 11,743.4
Gross Fixed Captal Formation 12,860.6 15,486.7 19,061.4 22,851.6 25,645.4 29,201.4 33,640.5 40,487.7 42,126.7 44,432.6 49,643.4 52,985.8 52,219.5
Livestock 74 160.7 217.9 184.0 191.8 253.8 1.3 187.6 -261.6 165.0 1,485.7 69.4 1,312.5
Minerals 15.5 -1,164.1 41.6 2,081.1 547.0 4,409.0 4,853.5 221.6 -4,752.3 -417.1 2,825.6 -2,037.2 -117.3
Other 829 828.2 1,357.0 1,922.6 2,214.8 2,109.3 2,001.1 2,460.8 -103.3 -3,047.0 -6,332.5 -2,287.4 -2,762.0
Changes in Inventories 918.9 -175.2 1,616.4 4,187.7 2,953.6 6,772.1 6,855.8 2,869.9 -5,117.2 -3,299.1 -2,021.2 -4,255.2 -1,566.7
GROSS CAPITAL FORMATION (GCF) 13,779.5 15,311.5 20,677.8 27,039.3 28,599.0 35,973.5 40,496.4 43,357.7 37,009.4 41,133.6 47,622.2 48,730.6 50,652.8
Gross Domestic Product (GDP) 50,752.2 59,106.9 67,152.7 74,720.9 73,462.4 86,867.4 104,979.9 109,870.4 125,158.3 145,868.6 146,066.2 170,563.6 180,101.9
Ratio GCF to GDP % 27.2 25.9 30.8 36.2 38.9 41.4 38.6 39.5 29.6 28.2 32.6 28.6 28.1
Note: 2016-2017 estimates are provisional
Table 14: Gross Fixed Capital Formation - Total Economy By Type Of Asset At Constant Prices - Millions of pula
TYPE OF ASSETS 2005 2006 2007 2008 2009 2010 2011 2012 2013 2014 2015 2016 2017
Residential buildings 1,694.3 1,622.8 1,461.9 1,220.5 960.0 855.0 533.8 700.9 750.5 732.5 773.7 747.7 831.0
Non-residential buildings 4,450.4 4,955.7 4,990.7 4,437.8 5,222.2 5,598.1 6,409.4 7,257.2 8,171.8 8,021.8 8,472.9 8,188.6 9,101.2
Construction Works 3,049.8 3,652.8 4,143.5 3,735.2 4,883.6 5,945.2 6,544.9 7,761.0 8,213.0 8,003.6 8,072.1 9,100.1 8,817.2
Transport and equipment 974.4 1,159.8 1,717.9 2,256.0 2,347.6 2,202.3 2,591.6 3,009.2 2,650.6 2,193.5 2,059.7 1,971.7 1,522.0
Machinery and equipment 4,073.6 4,095.6 4,916.1 6,446.1 6,121.6 7,111.3 8,117.8 9,153.2 7,338.0 9,145.1 11,178.0 11,661.6 8,463.8
Gross Fixed Captal Formation 14,242.4 15,486.7 17,230.0 18,095.6 19,535.1 21,711.9 24,197.6 27,881.4 27,123.9 28,096.4 30,556.4 31,669.8 28,735.1
Livestock 80.7 160.7 125.3 157.2 209.3 163.4 236.2 217.5 -106.5 -77.6 484.7 -10.5 492.7
Minerals -418 -1,164.1 -509.8 801.9 -300.6 3,300.2 794.4 154.4 -2,742.7 -569.9 2,622.6 -2,462.9 77.8
Other 1,236.7 828.2 1,347.9 1,813.5 1,561.0 1,753.9 1,594.4 1,615.9 1,355.6 -1,753.9 -2,116.7 655.7 -2,740.0
Changes in Inventories 899.9 -175.2 963.4 2,772.6 1,469.7 5,217.6 2,625.1 1,987.7 -1,493.6 -2,401.3 990.6 -1,817.6 -2,169.5
GROSS CAPITAL FORMATION (GCF) 15,142.3 15,311.6 18,193.5 20,868.2 21,004.8 26,929.5 26,822.6 29,869.2 25,630.3 25,695.1 31,547.0 29,852.1 26,565.6
Note: 2016 -2017 estimates are provisional
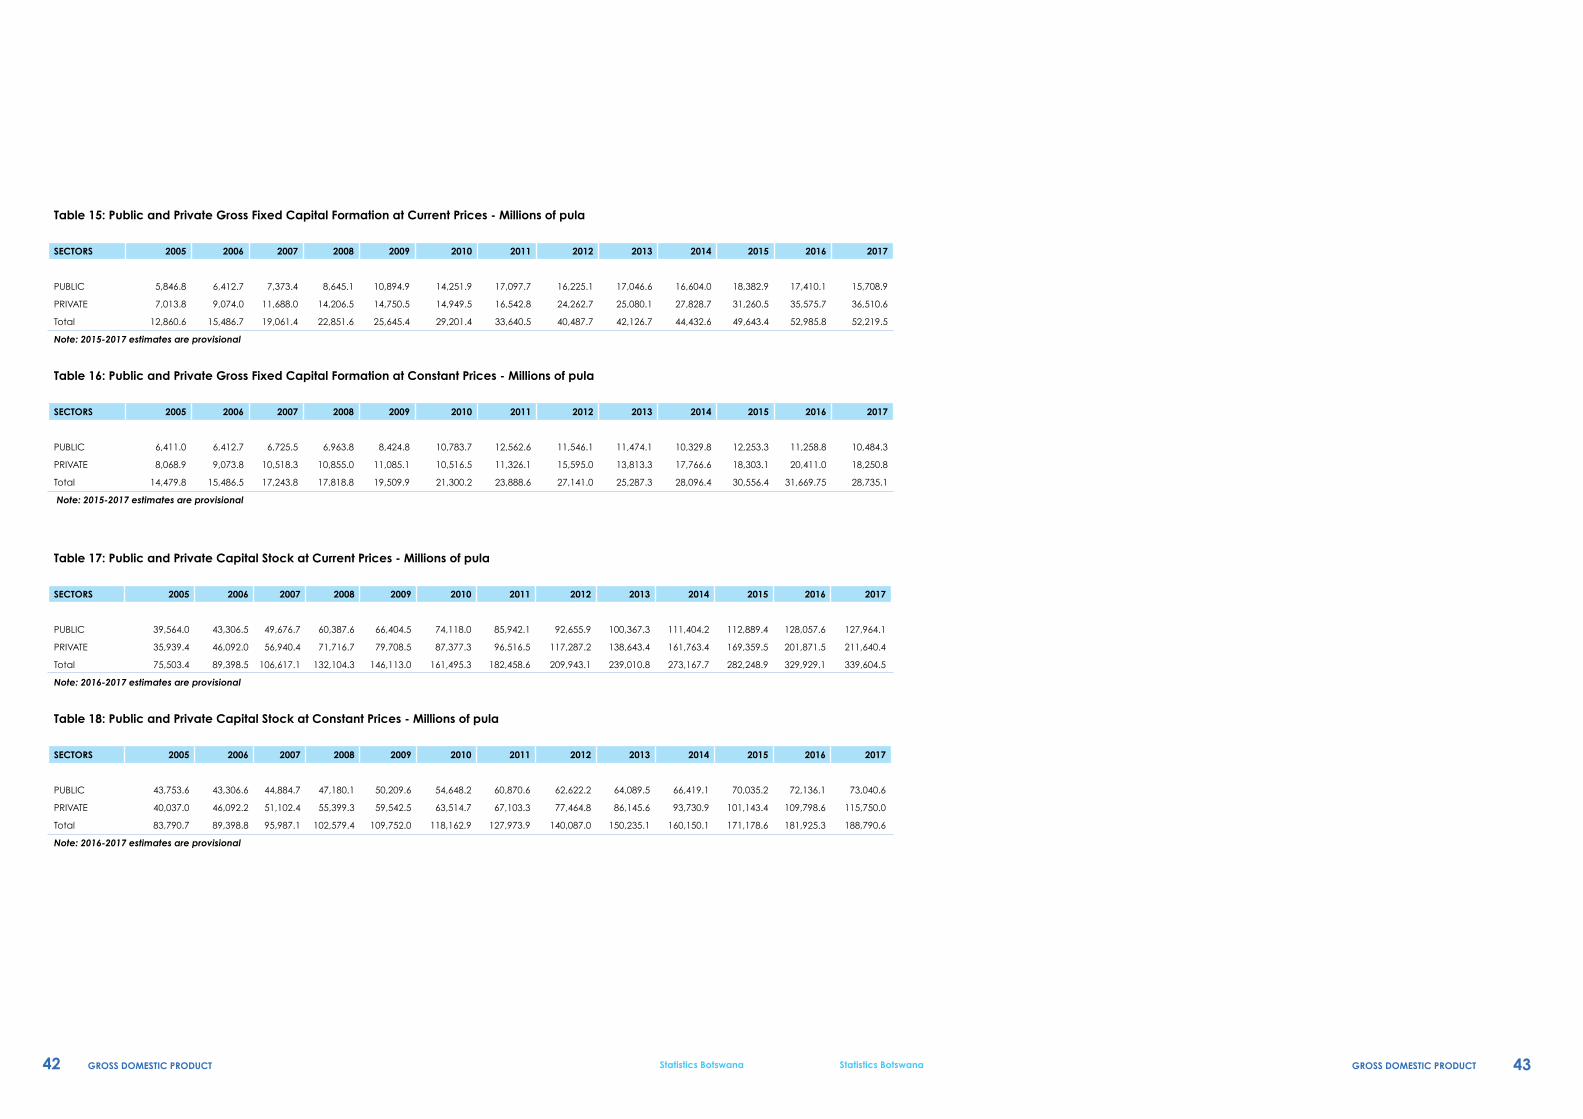
42 43GROSS DOMESTIC PRODUCT GROSS DOMESTIC PRODUCTStatistics Botswana Statistics Botswana
Table 15: Public and Private Gross Fixed Capital Formation at Current Prices - Millions of pula
SECTORS 2005 2006 2007 2008 2009 2010 2011 2012 2013 2014 2015 2016 2017
PUBLIC 5,846.8 6,412.7 7,373.4 8,645.1 10,894.9 14,251.9 17,097.7 16,225.1 17,046.6 16,604.0 18,382.9 17,410.1 15,708.9
PRIVATE 7,013.8 9,074.0 11,688.0 14,206.5 14,750.5 14,949.5 16,542.8 24,262.7 25,080.1 27,828.7 31,260.5 35,575.7 36,510.6
Total 12,860.6 15,486.7 19,061.4 22,851.6 25,645.4 29,201.4 33,640.5 40,487.7 42,126.7 44,432.6 49,643.4 52,985.8 52,219.5
Note: 2015-2017 estimates are provisional
Table 16: Public and Private Gross Fixed Capital Formation at Constant Prices - Millions of pula
SECTORS 2005 2006 2007 2008 2009 2010 2011 2012 2013 2014 2015 2016 2017
PUBLIC 6,411.0 6,412.7 6,725.5 6,963.8 8,424.8 10,783.7 12,562.6 11,546.1 11,474.1 10,329.8 12,253.3 11,258.8 10,484.3
PRIVATE 8,068.9 9,073.8 10,518.3 10,855.0 11,085.1 10,516.5 11,326.1 15,595.0 13,813.3 17,766.6 18,303.1 20,411.0 18,250.8
Total 14,479.8 15,486.5 17,243.8 17,818.8 19,509.9 21,300.2 23,888.6 27,141.0 25,287.3 28,096.4 30,556.4 31,669.75 28,735.1
Note: 2015-2017 estimates are provisional
Table 17: Public and Private Capital Stock at Current Prices - Millions of pula
SECTORS 2005 2006 2007 2008 2009 2010 2011 2012 2013 2014 2015 2016 2017
PUBLIC 39,564.0 43,306.5 49,676.7 60,387.6 66,404.5 74,118.0 85,942.1 92,655.9 100,367.3 111,404.2 112,889.4 128,057.6 127,964.1
PRIVATE 35,939.4 46,092.0 56,940.4 71,716.7 79,708.5 87,377.3 96,516.5 117,287.2 138,643.4 161,763.4 169,359.5 201,871.5 211,640.4
Total 75,503.4 89,398.5 106,617.1 132,104.3 146,113.0 161,495.3 182,458.6 209,943.1 239,010.8 273,167.7 282,248.9 329,929.1 339,604.5
Note: 2016-2017 estimates are provisional
Table 18: Public and Private Capital Stock at Constant Prices - Millions of pula
SECTORS 2005 2006 2007 2008 2009 2010 2011 2012 2013 2014 2015 2016 2017
PUBLIC 43,753.6 43,306.6 44,884.7 47,180.1 50,209.6 54,648.2 60,870.6 62,622.2 64,089.5 66,419.1 70,035.2 72,136.1 73,040.6
PRIVATE 40,037.0 46,092.2 51,102.4 55,399.3 59,542.5 63,514.7 67,103.3 77,464.8 86,145.6 93,730.9 101,143.4 109,798.6 115,750.0
Total 83,790.7 89,398.8 95,987.1 102,579.4 109,752.0 118,162.9 127,973.9 140,087.0 150,235.1 160,150.1 171,178.6 181,925.3 188,790.6
Note: 2016-2017 estimates are provisional