Embed Size (px)
Citation preview

© Unisa Press ISSN 0027-2639 Mousaion 28 (2) 2010 pp. 32–63
E-GOVERNANCE AND E-GOVERNMENTS IN AFRICA: A WEBOMETRICIAN’S PERCEPTION OF THE CHALLENGES, TRENDS AND ISSUES
Omwoyo Bosire OnyanchaDepartment of Information Science University of South [email protected] or [email protected]
ABSTRACTThis article uses content analysis and webometric approaches to examine the challenges associated with e-government and the presence and performance of African governments on the web, as well as to review and compare the availability and use of various types of information and communication technologies (ICTs) in making e-governance possible in the region. Results indicate that despite the challenges faced by countries in Africa, the presence of African governments on the web is improving, and a number of ICTs and related tools are becoming increasingly available; moreover, between 2000 and 2009, Africa experienced the second highest growth rate in terms of internet usage. There are few interlinkages between government websites, and most African governments are in the initial stages of e-governance uptake. External information to which the governments provide links includes freeware, news and general information (e.g. tourism). Recommendations for the effective implementation of e-governance are provided.
KEYWORDSe-government, e-governance, Africa, the web, webometrics, ICTs, internet, in-links, out-links, interlinkages.
1 INTRODUCTION
E-governance and e-Government are increasingly being emphasized as ways for governments to strengthen good governance. If implemented strategically, e-governance can not only improve efficiency, accountability and transparency of government processes, but it can also be a tool to empower citizens by enabling them to participate in
32

33
E-GOVERNANCE AND E-GOVERNMENTS IN AFRICA ...
the decision-making processes of governments (United Nations Development Programme – Regional Centre Bangkok 2009).
E-governance and e-government, two terms that have long been used interchangeably to indicate the same phenomenon, are increasingly becoming household terms as far as good governance and efficient, high-quality service provision by governments are concerned. However, confusion still reigns concerning the difference between the two. Backus (2001), for instance, argues that e-governance is more than just a government website on the internet, and that it should be thought of as the “application of electronic means in the interaction between government and citizens and government and businesses, as well as [the application of electronic means] in internal government operations”. Sheridan and Riley (2006) make the observation that e-governance and e-government denote two distinct concepts. They see e-governance as a “wider concept that defines and assesses the impacts technologies are having on the practice and administration of governments and the relationships between public servants and the wider society, such as dealings with the elected bodies or outside groups such as not for profits organizations, NGOs or private sector corporate entities” and e-government as “a narrower discipline dealing with the development of online services to the citizen, more the e of any particular government service – such as e-tax, e-transportation or e-health”. Godse and Garg (2007) also support a distinction between e-governance and e-government, stating that they cater for different audiences and are aimed at achieving different objectives. Based on Sheridan and Riley’s (2006) definitions of these two concepts, in this article e-governance will be used to refer to the use of information and communication technologies (ICTs) in the provision of the processes and systems that drive the online services offered to citizens, non-citizens and businesses by a given government. E-governance will therefore be used as a broader term under which e-government is subsumed.
While we agree that e-governance entails more than simply the ownership of a website, it is also true that the web is an important tool in the implementation and practice of effective e-governance. In his analysis of Gartner’s e-governance model, Backus (2001) observes that “e-governance means being present on the Web, providing the public with relevant information”. According to Gartner – a consultancy firm based in the USA (in Backus 2001) – this form of interaction should form the first phase of e-governance. In phase two, which largely involves the government–citizen interaction, people can ask questions via e-mail, use search engines, and download forms and documents. In phase three, transactions between the public and the government can be conducted electronically, particularly via the web, and people need no longer visit government offices. These transactions include services such as completing income tax returns, completing property tax forms, extending or renewing licences, obtaining visas and passports, and online voting (see Godse & Garg 2007). These and many other issues give credence to the argument that a government website, as an enabling tool, is vital for successful e-governance.

34
OMWOYO BOSIRE ONYANCHA
Governments throughout the world have embraced and engaged in the provision of electronic services in cyberspace as a way to cut down costs and improve service provision. As a starting point, several governments in Africa have initiated programmes, strategies and policies for the establishment of effective and operational e-governance in their respective countries. One of these strategies entails the development of government websites. The websites of some African governments (e.g. www.gov.za – South Africa) act as e-government portals, while others (e.g. http://www.e-government.go.ke/ – Kenya) separate government websites from e-government websites, while providing links to e-government websites on the home page of the main government website. Governments can now use the web to provide access to digitally based information and services to their citizens and business communities. In constructing their websites, these governments have linked them to other external websites. Similarly, external websites provide links to government websites. Web links are usually supplied to assist web users with access to particular websites, pages and/or documents.
According to various authors, links are not only a means to link documents; they have been extensively used to improve the performance of IR systems (Brin & Page, Kleinberg, and Lempel & Moran, in Bar-Ilan 2005:973). An analysis of the web links entails: a) measuring the quality and relevance of the set of links pointing to a given site (Bar-Ilan 2005); b) determining what pages in the collection are important to users; and c) determining what a page is about, and whether it is deemed to be important and deserves a ranking boost. Considered in the context of citations to scientific publications, web links can be viewed as a sign of appreciation of a web page or site. In addition, it is generally agreed that one of the key roles of citations is to provide a reader with a guide that he or she may use to explore the ideas presented in a published work. In the same way, links provide web users with a guide to other sites or web documents containing related or additional information about a topic, thereby improving the performance of the information retrieval systems mentioned earlier. Finally, web links indicate the effectiveness and extent of government–citizen or government–business interactions.
2 E-GOVERNANCE MODELSVarious e-governance models have been proposed by various people (see Backus 2001; Gartner in Backus 2001; Zwahr & Finger 2005). Whereas Backus modelled his e-governance on the e-commerce model (i.e. using e-commerce concepts), Zwahr and Finger (2005) based their model on three important concepts, namely information and technology as key drivers of state transformation; emerging pressures on government and public administration; and the magnitude of e-governance. Zwahr and Finger’s model takes into account four significant dimensions of e-governance, namely the level at which the transformation is taking or has taken place; the role-players in e-governance (the public and private sectors); the functionsperformed in e-governance (service delivery, policymaking and regulation); and the technology that is used to facilitate e-governance.
35
E-GOVERNANCE AND E-GOVERNMENTS IN AFRICA ...
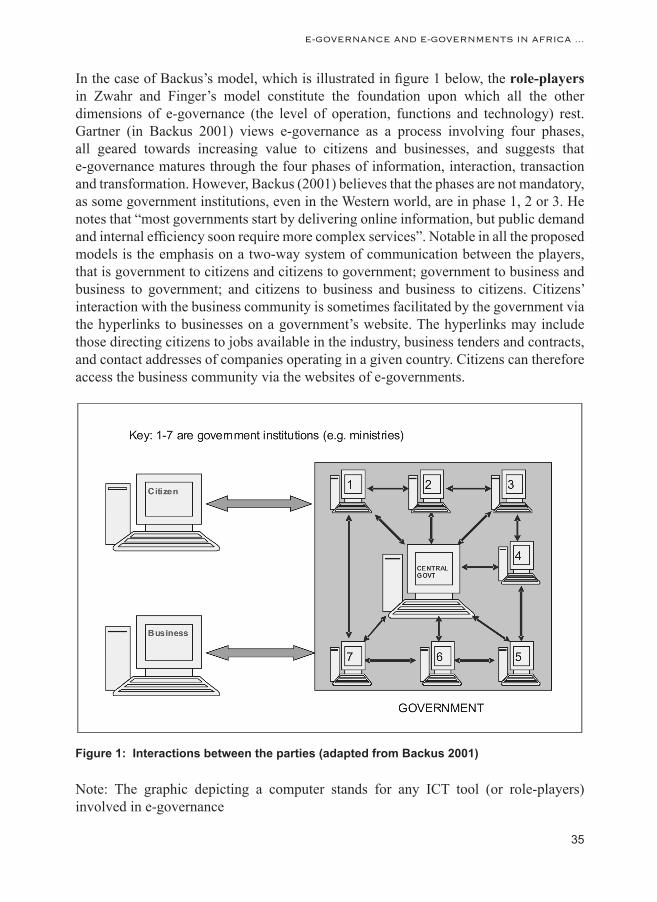
In the case of Backus’s model, which is illustrated in figure 1 below, the role-players in Zwahr and Finger’s model constitute the foundation upon which all the other dimensions of e-governance (the level of operation, functions and technology) rest. Gartner (in Backus 2001) views e-governance as a process involving four phases, all geared towards increasing value to citizens and businesses, and suggests that e-governance matures through the four phases of information, interaction, transaction and transformation. However, Backus (2001) believes that the phases are not mandatory, as some government institutions, even in the Western world, are in phase 1, 2 or 3. He notes that “most governments start by delivering online information, but public demand and internal efficiency soon require more complex services”. Notable in all the proposed models is the emphasis on a two-way system of communication between the players, that is government to citizens and citizens to government; government to business and business to government; and citizens to business and business to citizens. Citizens’ interaction with the business community is sometimes facilitated by the government via the hyperlinks to businesses on a government’s website. The hyperlinks may include those directing citizens to jobs available in the industry, business tenders and contracts, and contact addresses of companies operating in a given country. Citizens can therefore access the business community via the websites of e-governments.
Figure 1: Interactions between the parties (adapted from Backus 2001)
Note: The graphic depicting a computer stands for any ICT tool (or role-players) involved in e-governance

36
OMWOYO BOSIRE ONYANCHA
Government–citizen and/or government–business interaction is possible only if governments provide, on their websites, electronic or online services such as feedback possibilities or various forms (identity card applications, birth certificates, voter registration, etc). The website of the South African government provides perhaps the most detailed information about government services. The government, which is at an advanced stage of e-government, provides three types of services, namely a) services for citizens; b) services for organisations; and c) services for foreign nationals. Services for citizens include information relating to birth, parenting, education and training, the youth, relationships, living with a disability, the world of work, social benefits, a place to live, transport, travel outside South Africa, moving to or visiting South Africa, sports and recreation, citizenship, dealing with the law, retirement and old age, and death. Information specific to the business community (or organisations) includes how to start an organisation or business, tax, intellectual property, import and export, permits and licences, transport, labour issues, health and safety at the workplace, and discontinuing a business. The website provides foreign nationals with information about moving to, working in and entering South Africa. Kenya provides information relating to the following on its e-government website: e-citizenship, e-taxes and e-revenue, e-civil service, e-education and e-business in Kenya. The Kenyan government identifies communication within the government and communication with business and citizens as its core e-government activities. Some similar services and products were noted on the government websites of a few other countries (Republic of Tanzania, Ghana and Malawi). In its framework for the planning and implementation of e-governance, Oracle (2006) identifies components that are “mandatory in several activities that need to be accomplished for [the] successful implementation [of e-governance]”; these are: strategy, infrastructure, hardware, database management, enabling technologies, applications, middleware and workflow tools, implementation services, training, and maintenance and upgradings.
Generally, most African governments have followed Backus’ model of interactions among citizens, businesses and the government. However, the planning and implementation of e-government involve Oracle’s framework and Gartner’s and Zwahr and Finger’s models of e-governance. One aspect that has emerged from the analysis of the types of services provided, especially on the website of the South African government, is the interaction between citizens of one country and an external government. We could add the interaction between two governments. Whether these forms of service introduce new components to the e-governance model proposed by Backus (2001) is an area that requires investigation. The main question that arises is: should the external participants be grouped in the businesses category? Or should they be treated as new components of the model? An issue that requires attention when considering this question is regional cooperation (e.g. the East African Community’s legislative assembly and the African Union’s Pan African Parliament), which brings together several countries. Where, in the e-governance model, should these governments and institutions feature?

37
E-GOVERNANCE AND E-GOVERNMENTS IN AFRICA ...
3 PURPOSE OF THE STUDYThis article focuses on examining and outlining various challenges that African governments face in the planning and implementation of e-governance. The article also reviews and compares the availability and usage of ICTs and associated tools in selected countries in Africa. The study examines the visibility and performance of African governments on the web by identifying the number of governments in the region that have their own websites; the number of pages and links; the most targeted sites; page, directory, domain and site interlinkages; and interrelationships among the websites of different governments.
4 METHODS AND MATERIALSThe study reported on here employed both the content analysis and webometric approaches (specifically link analysis) to identify the challenges that governments face in the implementation of e-governance, and the presence and performance of African governments on the web. Content analysis is defined by the Bureau of Justice Assistance (s.a.) as a “set of procedures for collecting and organizing non-structured information into a standardized format [which] allows one to make inferences about the characteristics and meaning of written and otherwise recorded material”. Webometrics, on the other hand, is the “study of the quantitative aspects of the construction and use of information resources, structures and technologies on the Web drawing on bibliometric and informetric approaches” (Björneborn & Ingwersen 2004:1217). It is the application of bibliometric methods to the world wide web (WWW); bibliometrics is the use of mathematical and statistical methods to study the use of materials and services in a library, or to analyse the historical development of a specific body of literature, particularly its authorship, publication and use (Ikpaahindi 1985:163; Pritchard in Hertzel 1987:153; Rao & Neelameghan 1992:243; Prytherch in Diodato 1994; Reitz 2006).
The popularity of webometrics as a research method or technique is reflected in the number of studies that have been conducted recently. The application of webometrics in the study of patterns that manifest in information production and use on the WWW are taking centre stage in the field of library and information science in general, and in the subject domain of informetrics in particular. The majority of these studies are focused on assessing the visibility of and web-linkage among institutions of higher learning (see Thelwall 2002a, 2002b, 2002c, 2003; Thelwall & Wilkinson 2004; Vaughan, Kipp & Gao 2006; Cybermetrics Lab 2007; Onyancha & Ocholla 2007; Ortega, Aguillo, Cothey & Scharnhorst 2007; Onyancha & Ocholla 2008). However, few webometric studies have been conducted to evaluate links to businesses (Vaughan & You 2006); libraries (Zeinolabedinio, Maktabifard & Osareh s.a.; Onyancha, 2007a) and e-governments (Chisenga 2004; Onyancha 2007b).

38
OMWOYO BOSIRE ONYANCHA
Several documents were scanned for information relating to the challenges associated with e-governance in Africa. Existing statistics were used to support the arguments presented in the results section, especially with regard to the challenges associated with e-governance. Two specific internet sources were used to provide statistics about the availability of ICTs in Africa, and the extent of internet usage on the continent. These sources were:
• The Africa ICT Policy Monitor.1 This site is an initiative of the Association for Progressive Communications (APC). The primary goal of the APC Africa ICT Policy Monitor is to “enable African civil society organisations to engage in information and communication technologies (ICT) policy development to promote an Information Society based on social justice and human rights. The ultimate aim being that governments and policy makers recognise that access to and the use of ICTs is a basic human right”. Statistics provided on this website concerning the national ICT status are drawn from the World Bank, the International Telecommunication Union (ITU) and the United Nations Development Programme (UNDP).
• Internet Usage World Statistics. This is an international website providing up-to-date market research data, data on worldwide internet usage and population statistics for over 233 individual countries and world regions.
In the case of the link analysis method, a list of African countries was obtained from the internet. Various sources were used, including
African governments on the WWW (http://www.gksoft.com/govt/en/africa.html)African governments on the internet (http://www.uneca.org/aisi/NICI/africagovinternet.htm)Foreign governments – Africa (http://www.lib.umich.edu/govdocs/forafr.html)
Table 1: Countries and government website addresses included in the study
No. Country Government website address1 Benin http://www.gouv.bj
2 Botswana http://www.gov.bw/
3 Burkina Faso http://www.primature.gov.bf/
4 Burundi http://www.burundi.gov.bi/
5 Cameroon http://www.cameroon.gov.cm/
6 Cape Verde http://www.governo.cv/
7 Congo Brazzaville http://www.congo-site.com/
1 http://africa.rights.apc.org/ (Accessed 20 June 2007)

39
E-GOVERNANCE AND E-GOVERNMENTS IN AFRICA ...
No. Country Government website address8 Côte D’Ivoire http://www.pr.ci/
9 Djibouti http://www.republique-djibouti.com/
10 Egypt http://www.egypt.gov.eg/
11 Gambia http://www.gambia.gm/
12 Ghana http://www.ghana.gov.gh/
13 Guinea http://www.guinee.gov.gn
14 Kenya http://www.kenya.go.ke
15 Lesotho http://www.lesotho.gov.ls/
16 Libya http://www.gov.ly/
17 Madagascar http://www.madagascar.gov.mg/
18 Malawi http://www.malawi.gov.mw/
19 Mauritania http://www.mauritania.mr/
20 Mauritius http://www.gov.mu/
21 Mozambique http://www.mozambique.mz/
22 Namibia http://www.grnnet.gov.na/
23 Nigeria http://www.nigeria.gov.ng/
24 Senegal http://www.gouv.sn/
25 Sierra Leone http://www.sierraleone.gov.sl/
26 South Africa http://www.gov.za/
27 Swaziland http://www.gov.sz/
28 Tanzania http://www.tanzania.go.tz/
29 Togo http://www.republicoftogo.com/
30 Tunisia http://www.ministeres.tn/html/
31 Uganda http://www.government.go.ug/
32 Zimbabwe http://www.gta.gov.zw/
The government URLs (uniform resource locators) were identified from these sources, and before using web crawler software (software used to crawl the websites for links), each of the URLs was visited in order to verify its authenticity and existence, among other things. Only those countries with government portals were included in the analysis. Of the 53 independent states or countries in Africa, only 32 were found to own official government websites (see table 1). SocSciBot computer-aided tools were then used to crawl the government websites that could be accessed. At first the process was extremely slow, and on occasion the computer ran out of virtual memory. This compelled us to exclude all URLs that contained question marks, which may have contributed to an underestimation of the number of in- and out-links on the web pages on each of the government websites.

40
OMWOYO BOSIRE ONYANCHA
Some government websites (such as those of Benin, Cameroon, Uganda and Côte D’Ivoire), which were either under construction or inaccessible at the time of data collection (i.e. August 2008 to August 2009), were not crawled. Link analysis was employed to measure the total number of web pages, out-links, in-links and most targeted sites for each government, and to construct social networks. Data were analysed using SocSciBot Tools (version 1.3.347) for page and link counts; ADM (alternative document model) count summaries; known and unknown external links; and file, domain, directory and site from–to counts. In addition, the Pajek networks were subjected to non-metric multidimensional scaling (MDS) analyses in order to investigate similarities between the crawled government websites. The MDS program is one of the analytic technologies available within UCINET computer software. MDS finds a set of points in k-dimensional space in such a way that the Euclidean distances between these points correspond as closely as possible to a rank preserving transformation of the input proximities (Borgatti, Everett & Freeman 2002). In the analysis of the similarities between the items analysed, the program draws a set of the items close together on the MDS map, while the opposite is true when the dissimilarities option is selected. Microsoft Excel software was predominantly used to present the analysed data in tables and graphs, while Pajek computer-aided software was used to draw social networks.
5 FINDINGSThe findings are presented and discussed under the following six subheadings:
5.1 Availability and use of various types of ICTs in Africa5.2 Number of web pages and out-links in e-government websites5.3 In-links and out-links among the governments5.4 Government websites linking to one another5.5 Social networks and maps of government websites5.6 Most commonly targeted websites and generic top-level domains (gTLDs)
5.1 Availability and use of various types of ICTs in Africa
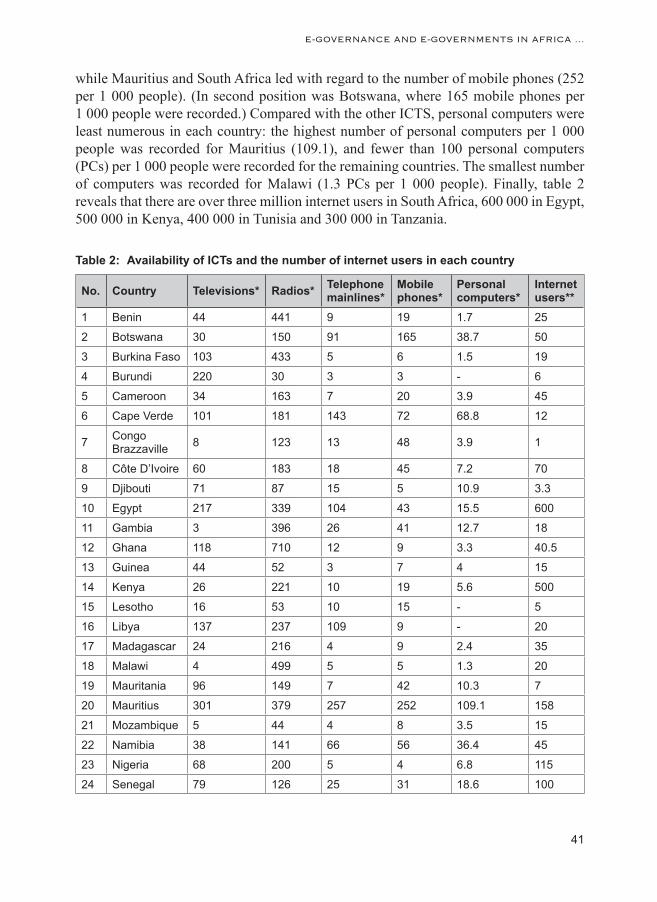
Table 2 provides statistics relating to the availability of various ICTs, namely television, radio, telephone lines, mobile phones and personal computers; and the number of internet users in selected countries. Table 2 indicates that Mauritius had the highest number of televisions (301 per 1 000 people) followed by Burundi (220), Egypt (217) and Tunisia (198), while Ghana led with 710 radios per 1 000 people, followed by Malawi (499), Benin (441), Burkina Faso (433), Tanzania (406) and Gambia (396). With regard to telephone landlines, Mauritius occupied first place (257 per 1 000 people), followed by Cape Verde (143), South Africa (112), Libya (109), Tunisia (109) and Egypt (104),
41
E-GOVERNANCE AND E-GOVERNMENTS IN AFRICA ...
while Mauritius and South Africa led with regard to the number of mobile phones (252 per 1 000 people). (In second position was Botswana, where 165 mobile phones per 1 000 people were recorded.) Compared with the other ICTS, personal computers were least numerous in each country: the highest number of personal computers per 1 000 people was recorded for Mauritius (109.1), and fewer than 100 personal computers (PCs) per 1 000 people were recorded for the remaining countries. The smallest number of computers was recorded for Malawi (1.3 PCs per 1 000 people). Finally, table 2 reveals that there are over three million internet users in South Africa, 600 000 in Egypt, 500 000 in Kenya, 400 000 in Tunisia and 300 000 in Tanzania.
Table 2: Availability of ICTs and the number of internet users in each country
No. Country Televisions* Radios* Telephone mainlines*
Mobile phones*
Personal computers*
Internet users**
1 Benin 44 441 9 19 1.7 25
2 Botswana 30 150 91 165 38.7 50
3 Burkina Faso 103 433 5 6 1.5 19
4 Burundi 220 30 3 3 - 6
5 Cameroon 34 163 7 20 3.9 45
6 Cape Verde 101 181 143 72 68.8 12
7 Congo Brazzaville 8 123 13 48 3.9 1
8 Côte D’Ivoire 60 183 18 45 7.2 70
9 Djibouti 71 87 15 5 10.9 3.3
10 Egypt 217 339 104 43 15.5 600
11 Gambia 3 396 26 41 12.7 18
12 Ghana 118 710 12 9 3.3 40.5
13 Guinea 44 52 3 7 4 15
14 Kenya 26 221 10 19 5.6 500
15 Lesotho 16 53 10 15 - 5
16 Libya 137 237 109 9 - 20
17 Madagascar 24 216 4 9 2.4 35
18 Malawi 4 499 5 5 1.3 20
19 Mauritania 96 149 7 42 10.3 7
20 Mauritius 301 379 257 252 109.1 158
21 Mozambique 5 44 4 8 3.5 15
22 Namibia 38 141 66 56 36.4 45
23 Nigeria 68 200 5 4 6.8 115
24 Senegal 79 126 25 31 18.6 100

42
OMWOYO BOSIRE ONYANCHA
No. Country Televisions* Radios* Telephone mainlines*
Mobile phones*
Personal computers*
Internet users**
25 Sierra Leone 13 259 5 6 - 7
26 South Africa 152 338 112 252 68.5 3 068
27 Swaziland 128 162 31 65 - 14
28 Tanzania 42 406 4 12 3.3 300
29 Togo 37 265 10 20 21.5 150
30 Tunisia 198 158 109 40 23.7 400
31 Uganda 27 127 3 14 3.1 60
32 Zimbabwe 30 362 19 24 12.1 100
TOTAL 77* 238* 39* 43* 15.6* 188**
Key: * Availability per 1 000 people ** Users in thousands(Source: APC s.a.)
Table 3 provides a detailed account of internet usage in Africa and compares this with the rest of the world. The leading region is Asia, which has over 704 million internet users, followed by Europe (402 million), North America (252 million), Latin America/Caribbean (176 million), Africa (66 million), the Middle East (48 million) and Oceania/Australia (21 million). The internet penetration rate, calculated as the number of users expressed as a percentage of the total population in a given geographic region, was highest in North America (73.90%) followed by Oceania/Australia (60.10%), while Africa came last, with a penetration rate of 6.70%. Africa has witnessed the second highest growth rate of internet usage (1 359.90%) since 2000. Others that recorded high growth rates, in descending order according to rate, include the Middle East (1 360.20%), Latin America/Caribbean (873.10%), Asia (516.10%), and Europe (282.90%).
Table 3: World internet usage and population statistics
World regions
Population (2007 est)*
Population % of world
Internet users
(Penetration) % population
Users % of world
Usage growth 2000–2009
Africa 991 002 342 14.6 % 65 903 900 6.70% 3.90% 1 359.90%
Asia 3 808 070 503 56.3 % 704 213 930 18.50% 42.20% 516.10%
Europe 803 850 858 11.9 % 402 380 474 50.10% 24.20% 282.90%
Middle East 202 687 005 3.0 % 47 964 146 23.70% 2.90% 1 360.20%
North America 340 831 831 5.0 % 251 735 500 73.90% 15.10% 132.90%

43
E-GOVERNANCE AND E-GOVERNMENTS IN AFRICA ...
World regions
Population (2007 est)*
Population % of world
Internet users
(Penetration) % population
Users % of world
Usage growth 2000–2009
Latin America/Caribbean
586 662 468 8.7 % 175 834 439 30.00% 10.50% 873.10%
Oceania / Australia 34 700 201 0.5 % 20 838 019 60.10% 1.20% 173.40%
WORLD TOTAL 6 767 805 208 100.0 % 1 668 870 408 24.70% 100.00% 362.30%
(Sources: APC s.a.; Miniwatts Marketing Group2 2009) NOTES: Internet usage and world population statistics as at 30 June 2009. Demographic (population) numbers are based on data published by the US Census Bureau.3
Internet usage information is taken from data published by Nielsen//NetRatings4 and by the International Telecommunications Union.5
5.2 Number of web pages and out-links in e-government websites
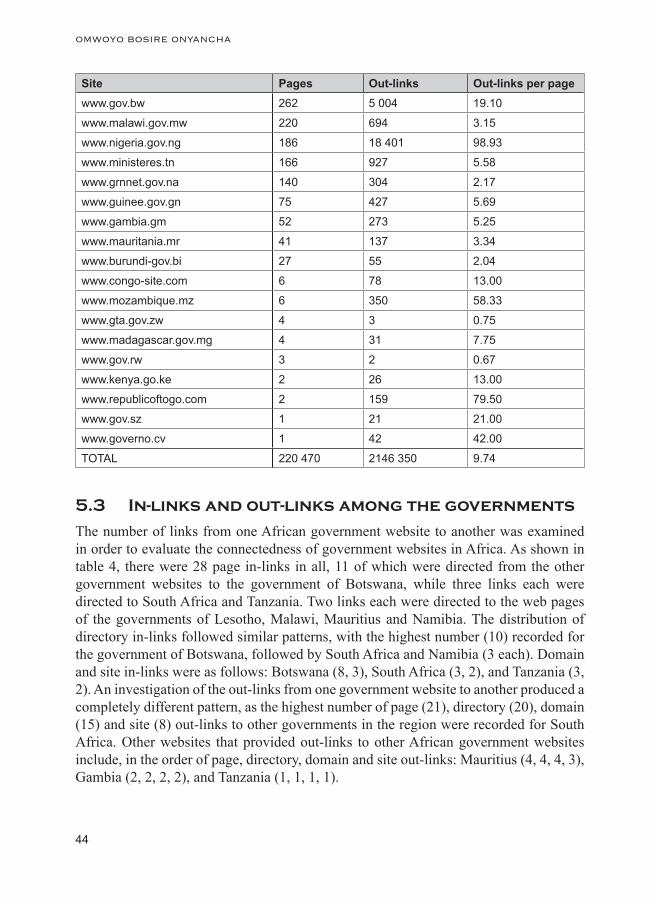
Table 4 shows 25 government websites in Africa that produced at least one web page. With regard to the number of web pages, South Africa led with 193 447, followed by Mauritius (17 689), Tanzania (3 658), Lesotho (2 869), Ghana (991) and Burkina Faso (353). In terms of the number of links pointing to external sites or pages, South Africa topped the list once again with 2 004 619 out-links. In second position was Mauritius, with 69 538 out-links, while Nigeria came third with 18 401. The average number of out-links per page was highest in Nigeria, with 98.93 out-links per page, followed by Togo (79.50), Mozambique (58.33) and Cape Verde (42.00).
Table 4: Number of web pages and out-links for each government website
Site Pages Out-links Out-links per pagewww.gov.za 193 447 2 004 619 10.36
www.gov.mu 17 689 69 538 3.93
www.tanzania.go.tz 3 658 13 167 3.60
www.lesotho.gov.ls 2 869 9 614 3.35
www.ghana.gov.gh 991 18 312 18.48
www.primature.gov.bf 353 1 258 3.56
www.egypt.gov.eg 265 2 908 10.97
2 www.internetworldstats.com (Accessed 5 November 2009) 3 http://www.census.gov/ (Accessed 5 November 2009)4 http://en-us.nielsen.com/tab/product_families/nielsen_netratings (Accessed 5 November 2009)5 http://www.itu.int/en/pages/default.aspx (Accessed 5 November 2009)
44
OMWOYO BOSIRE ONYANCHA
Site Pages Out-links Out-links per pagewww.gov.bw 262 5 004 19.10
www.malawi.gov.mw 220 694 3.15
www.nigeria.gov.ng 186 18 401 98.93
www.ministeres.tn 166 927 5.58
www.grnnet.gov.na 140 304 2.17
www.guinee.gov.gn 75 427 5.69
www.gambia.gm 52 273 5.25
www.mauritania.mr 41 137 3.34
www.burundi-gov.bi 27 55 2.04
www.congo-site.com 6 78 13.00
www.mozambique.mz 6 350 58.33
www.gta.gov.zw 4 3 0.75
www.madagascar.gov.mg 4 31 7.75
www.gov.rw 3 2 0.67
www.kenya.go.ke 2 26 13.00
www.republicoftogo.com 2 159 79.50
www.gov.sz 1 21 21.00
www.governo.cv 1 42 42.00
TOTAL 220 470 2146 350 9.74
5.3 In-links and out-links among the governments
The number of links from one African government website to another was examined in order to evaluate the connectedness of government websites in Africa. As shown in table 4, there were 28 page in-links in all, 11 of which were directed from the other government websites to the government of Botswana, while three links each were directed to South Africa and Tanzania. Two links each were directed to the web pages of the governments of Lesotho, Malawi, Mauritius and Namibia. The distribution of directory in-links followed similar patterns, with the highest number (10) recorded for the government of Botswana, followed by South Africa and Namibia (3 each). Domain and site in-links were as follows: Botswana (8, 3), South Africa (3, 2), and Tanzania (3, 2). An investigation of the out-links from one government website to another produced a completely different pattern, as the highest number of page (21), directory (20), domain (15) and site (8) out-links to other governments in the region were recorded for South Africa. Other websites that provided out-links to other African government websites include, in the order of page, directory, domain and site out-links: Mauritius (4, 4, 4, 3), Gambia (2, 2, 2, 2), and Tanzania (1, 1, 1, 1).

45
E-GOVERNANCE AND E-GOVERNMENTS IN AFRICA ...
Table 5: In-links and out-links among African government websites
Government URLPage in-links
Directory in-links
Domain in-links
Site in-links
Page out-links
Directory out-links
Domain out-links
Site out-links
gov.bw 11 10 8 3 0 0 0 0
primature.gov.bf 0 0 0 0 0 0 0 0
burundi.gov.bi 0 0 0 0 0 0 0 0
governo.cv 0 0 0 0 0 0 0 0
congo-site.com 0 0 0 0 0 0 0 0
egypt.gov.eg 0 0 0 0 0 0 0 0
ghana.gov.gh 0 0 0 0 0 0 0 0
guinee.gov.gn 0 0 0 0 0 0 0 0
kenya.go.ke 1 1 1 1 0 0 0 0
lesotho.gov.ls 2 2 1 1 0 0 0 0
madagascar.gov.mg 0 0 0 0 0 0 0 0
malawi.gov.mw 2 2 2 2 0 0 0 0
mauritania.mr 0 0 0 0 0 0 0 0
gov.mu 2 2 2 1 4 4 4 3
mozambique.mz 0 0 0 0 0 0 0 0
grnnet.gov.na 2 2 1 1 0 0 0 0
gov.za 3 3 3 2 21 20 15 8
gouv.sn 0 0 0 0 0 0 0 0
gov.sz 2 2 1 1 0 0 0 0
tanzania.go.tz 3 3 3 2 1 1 1 1
ministeres.tn 0 0 0 0 0 0 0 0
gta.gov.zw 0 0 0 0 0 0 0 0
nigeria.gov.ng 0 0 0 0 0 0 0 0
gouv.bj 0 0 0 0 0 0 0 0
cameroon.gov.cm 0 0 0 0 0 0 0 0
gambia.gm 0 0 0 0 2 2 2 2
gov.rw 0 0 0 0 0 0 0 0
republicoftogo.com 0 0 0 0 0 0 0 0
TOTAL 28 27 22 14 28 27 22 14

46
OMWOYO BOSIRE ONYANCHA
5.4 Government websites linking to one another
An analysis of which government websites provided links to others and the number of out-links each government provided is presented in table 6. The table reveals that the government of South Africa provided eight directory links, six domain links, nine file or page links and one site link to the website of the government of Botswana. Others produced two or fewer links as follows, in the order of directory, domain, file and site links: Mauritius to South Africa (2, 2, 2, 1); South Africa to Lesotho (2, 1, 2, 1); South Africa to Mauritius (2, 2, 2, 1); South Africa to Namibia (2, 1, 2, 1); South Africa to Swaziland (2, 1, 2, 1); and South Africa to Tanzania (2, 2, 2, 1). Average links, calculated against the total number of countries with home pages, namely 32, indicate that on average there were 0.84 directory links that pointed from one government web directory to another, while domain interlinkages produced an average number of 0.69 links. There was an average of 0.88 and 0.44 file or page links and site links respectively.
Table 6: Government websites that link to others
From To Directory links Domain links File links Site linksgov.za gov.bw 8 6 9 1
gov.mu gov.za 2 2 2 1
gov.za lesotho.gov.ls 2 1 2 1
gov.za gov.mu 2 2 2 1
gov.za grnnet.gov.na 2 1 2 1
gov.za gov.sz 2 1 2 1
gov.za tanzania.go.tz 2 2 2 1
gov.mu gov.bw 1 1 1 1
gov.mu tanzania.go.tz 1 1 1 1
gov.za kenya.go.ke 1 1 1 1
gov.za malawi.gov.mw 1 1 1 1
tanzania.go.tz malawi.gov.mw 1 1 1 1
gambia.gm gov.bw 1 1 1 1
gambia.gm gov.za 1 1 1 1
TOTAL 27 22 28 14
Average links 0.84 0.69 0.88 0.44
5.5 Social networks and maps of government websites
Social networks, defined as social structures made up of nodes (which are generally individuals or organisations) tied by one or more specific types of relations (Onyancha

47
E-GOVERNANCE AND E-GOVERNMENTS IN AFRICA ...
& Ocholla 2009; Wikipedia 2009), are becoming increasingly common in mapping web-based relationships between organisations, individuals and publications. The current study used Pajek visualisation software to map interlinkages among web pages, directories, domains and sites of various African governments. Figures 2 to 5 provide these interlinkages. Figure 2 illustrates site interlinkages: the South African government website provides the majority of links (9) to other websites (Botswana, Kenya, Lesotho, Mauritius, Malawi, Namibia, Swaziland and Tanzania), while the Gambian website provided site links to just two countries, namely Botswana and South Africa. The Mauritian website had only one link, which pointed to the South African website. The domain interlinkages map reflects similar patterns, but provides more informative interlinkages than the site interlinkage map.
Figure 3 illustrates 19 nodes representing domain names, while figure 2 comprises ten nodes that represent site URLs. In figure 3, South Africa is represented by six domain names: concourt.gov.za, dfa.gov.za, doj.gov.za, gcis.gov.za, info.gov.za and statssa.gov.za. Other domain names in the network are: Botswana (cso.gov.bw, gov.bw and gov.bw:4400); Gambia (gambia.gm); Kenya (kenya.go.ke); Lesotho (lesotho.gov.ls); Malawi (finance.malawi.gov.mw, malawi.gov.mw); Mauritius (attorneygeneral.gov.mu, gov.mu); Namibia (gmnet.gov.na); Swaziland (gov.sz); and Tanzania (tanzania.go.tz). Figures 4 and 5 denote directory and file or page interlinkages. Whereas figure 4 consists of 30 nodes representing directory names, the web pages in figure 5 are represented by 37 nodes that form 11 networks consisting of between two and 11 web pages.
Figure 2: Site interlinkages

48
OMWOYO BOSIRE ONYANCHA
Figure 3: Domain interlinkages
Figure 4: Directory interlinkages

49
E-GOVERNANCE AND E-GOVERNMENTS IN AFRICA ...
Figure 5: File or page interlinkages
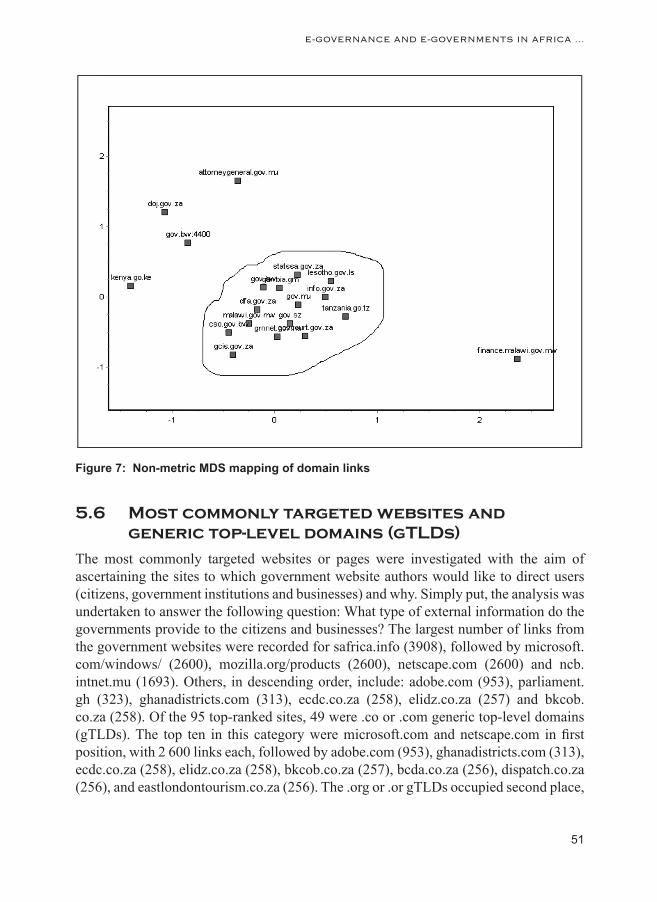
For the sake of triangulation, figures 2 to 5 were subjected to a non-metric multi-dimensional scaling analysis in order to find out how closely linked the entities (sites, domains, directories and pages) were to one another. However, page and directory non-metric MDS maps were not legible, and are consequently not supplied here. Figures 6 and 7 are non-metric MDS maps of site and domain names respectively. Figure 6 shows that South Africa, Botswana, Mauritius and Gambia are close to each other, while the Kenya and Swaziland sites are far from the rest of the government sites.

50
OMWOYO BOSIRE ONYANCHA
Figure 6: Non-metric MDS mapping of site links
Figure 7 reveals a large cluster consisting of 14 domain names, which include concourt.gov.za, cso.gov.bw, dfa.gov.za, gambia.gm, gcis.gov.za, gmnet.gov.na, gov.mu, gov.sz, gov.za, info.gov.za, lesotho.gov.ls, malawi.gov.mw, statssa.gov.za, and tanzania.go.tz. The domain names that are situated far from this cluster are attorneygeneral.gov.mu, doj.gov.za, finance.malawi.mw, gov.bw:4400 and kenya.go.ke.
51
E-GOVERNANCE AND E-GOVERNMENTS IN AFRICA ...
Figure 7: Non-metric MDS mapping of domain links
5.6 Most commonly targeted websites and generic top-level domains (gTLDs)
The most commonly targeted websites or pages were investigated with the aim of ascertaining the sites to which government website authors would like to direct users (citizens, government institutions and businesses) and why. Simply put, the analysis was undertaken to answer the following question: What type of external information do the governments provide to the citizens and businesses? The largest number of links from the government websites were recorded for safrica.info (3908), followed by microsoft.com/windows/ (2600), mozilla.org/products (2600), netscape.com (2600) and ncb.intnet.mu (1693). Others, in descending order, include: adobe.com (953), parliament.gh (323), ghanadistricts.com (313), ecdc.co.za (258), elidz.co.za (257) and bkcob.co.za (258). Of the 95 top-ranked sites, 49 were .co or .com generic top-level domains (gTLDs). The top ten in this category were microsoft.com and netscape.com in first position, with 2 600 links each, followed by adobe.com (953), ghanadistricts.com (313), ecdc.co.za (258), elidz.co.za (258), bkcob.co.za (257), bcda.co.za (256), dispatch.co.za (256), and eastlondontourism.co.za (256). The .org or .or gTLDs occupied second place,
52
OMWOYO BOSIRE ONYANCHA
with mozilla.org (2600), smartcape.org.za (240), ploty.org.za (163), joomla.org (108), nepad.org (108), lovelife.org.za (87), issa.org.za (68), nydt.org (67), savetheelephants.org (67), and aidshelpline.org.za (65) occupying the first ten places. There were six .ac or .edu gTLDs, namely pub.ac.za (182), ska.ac.za (138), nrf.ac.za (86), uct.ac.za (56), uwc.ac.za (45), and .sun.ac.za (40). Other commonly targeted gTLDs were .net and .info, which yielded five links and one link respectively. The .net gTLDs included ncb.intnet.mu (1693), sacities.net (257), southafrica.net (76), ethekwini.net (32) and salga.net (27), while safrica.info (3908) was the only .info gTLD.
6 DISCUSSION, CONCLUSIONS AND RECOMMENDATIONS
The content analysis of the existing statistical reports and other documents shows that African countries face a number of challenges in their planning and implementation of e-governance. In the first instance, Oracle (2006) identifies weaknesses associated with conceptualising, operating and maintaining systems of e-governance. These include social aspects (poor basic education, low literacy levels, poor IT literacy, different languages, lack of public acceptance of self-service models, and shortage of skills); political aspects (low budget allocation, absence of cyber laws, slow decision-making processes, inadequate hierarchical structures, short-term approaches owing to elections, and inadequate integration and reform agendas); economic aspects (a lack of investors and poor budget control); and technological aspects (shortage of IT skills, high internet costs, heterogeneous data, lack of IT standards and software licences). Tankoano (s.a.) observes that the clientele constitutes the main obstacle faced by e-governance. This obstacle is linked to a lack of sensitivity on the part of role-players; a low level of adaptation to these technologies by individuals, administration and businesses; resistance to change; and weak existing infrastructures. The United Nations Online Network in Public Administration and Finance (UNPAN) (2007) identifies the following as the most significant challenges facing e-governance in Africa: African leaders’ lack of a clear e-vision, or the capacity and will to create change; the lack of proper management and accountability structures; the lack of appropriate skills and training; unawareness of a culture of increased access to information; lack of commitment to high-level teamwork; the absence of policies governing a liberalised telecommunications sector; ineffective regulation, adoption and use of ICTs; curtailment of freedom of information, privacy and security; the absence of laws for the protection of intellectual property and copyright laws; the absence of policies to reduce the brain drain; inadequate monitoring and evaluation processes; technology-related challenges, such as privacy and data sharing, authentication, and building user trust; and access (making information widely available to citizens, etc). Other challenges include e-readiness in terms of data systems infrastructure, legal infrastructure, institutional infrastructure, human and technological
53
E-GOVERNANCE AND E-GOVERNMENTS IN AFRICA ...
Tabl
e 7:
Site
s m
ost c
omm
only
targ
eted
by
Afr
ican
gov
ernm
ents
Ran
kU
RL
Link
sR
ank
UR
LLi
nks
Ran
kU
RL
Link
s1
.saf
rica.
info
/3
908
22.e
ngin
eerin
gnew
s.co
.za/
113
41.tr
ees.
org.
za/
45
2.m
icro
soft.
com
/win
dow
s/2
600
23.jo
omla
.org
/10
841
.uw
c.ac
.za/
45
2.m
ozill
a.or
g/pr
oduc
ts/
2 60
023
.nep
ad.o
rg/
108
42.c
radl
eofh
uman
kind
.co.
za/
44
2.n
etsc
ape.
com
/2
600
24.lo
velif
e.or
g.za
/87
43.g
oogl
e.co
m/
42
3nc
b.in
tnet
.mu/
1 69
325
.nrf.
ac.z
a/86
43.s
unda
yind
epen
dent
.co.
za/
42
4.a
dobe
.com
/pro
dind
ex/
acro
bat/
953
26us
.i1.y
img.
com
/us.
yim
g.co
m/i/
fifa/
8444
.afri
ca-u
nion
.org
/41
5.p
arlia
men
t.gh/
323
27.id
c.co
.za/
7745
.sun
.ac.
za/
40
6.g
hana
dist
ricts
.com
/31
328
.sou
thaf
rica.
net/
7645
.uyf
.org
.za/
40
7.e
cdc.
co.z
a/25
829
.hea
vens
-abo
ve.c
om/
6846
.arc
.agr
ic.z
a/36
7.e
lidz.
co.z
a/25
829
.issa
.org
.za/
6846
.hri.
ca/p
artn
ers/
alp/
36
8.b
kcob
.co.
za/
257
29.li
mpo
pole
d.co
m/
6847
.els
enbu
rg.c
om/
34
8.s
aciti
es.n
et/
257
29.n
da.a
gric
.za/
6847
.new
tow
n.co
.za/
34
9.b
cda.
co.z
a/25
630
.me.
up.a
c.za
/spa
ce/
6747
.rese
rveb
ank.
co.z
a/34
9.d
ispa
tch.
co.z
a/25
630
.nyd
t.org
/hom
e.as
p67
48.u
sa.o
rg.z
a/33
9.e
astlo
ndon
tour
ism
.co.
za/
256
30.s
avet
heel
epha
nts.
org/
6749
.esk
om.c
o.za
/32
10.a
mat
olaw
ater
.co.
za/
254
3010
.156
.54.
252/
exch
ange
6749
.eth
ekw
ini.n
et/d
urba
n32
10.b
igm
edia
.co.
za/
254
31.a
idsh
elpl
ine.
org.
za/
6549
.judi
ciar
y.m
w/
32
10.e
lonl
ine.
co.z
a/25
432
.sta
tcou
nter
.com
/63
49.s
ahra
.org
.za/
32
11.c
bs.c
o.ls
/24
533
.bus
ines
sday
.co.
za/a
rticl
es/
6050
.sab
s.co
.za/
31
12.s
mar
tcap
e.or
g.za
/24
034
.ppo
live.
com
/ndm
c57
50.u
naid
s.or
g/31
13.s
ita.c
o.za
/18
534
.sol
ar.if
a.ha
wai
i.edu
/Tro
pica
l/57
51.c
apen
atur
e.co
.za/
30
14.p
ub.a
c.za
/18
235
.thet
a.or
g.za
/56
52.c
sir.c
o.za
/29

54
OMWOYO BOSIRE ONYANCHA
Ran
kU
RL
Link
sR
ank
UR
LLi
nks
Ran
kU
RL
Link
s
15.o
anda
.com
/con
verte
r/cl
assi
c17
935
.uct
.ac.
za/
5652
.dem
arca
tion.
org.
za/
29
16.a
mts
.co.
za/
178
35.w
amis
.co.
za/e
skom
/56
53.c
apefi
lmco
mm
issi
on.
co.z
a/28
16.b
lueb
erry
crea
tive.
co.z
a/17
836
.sed
a.or
g.za
/55
53.to
uris
mca
peto
wn.
co.z
a/28
16.c
nn.c
om/W
EAT
HE
R/
178
36ch
risw
ork.
gotd
ns.c
om/
5554
.cas
idra
.co.
za/
27
16.w
orld
-nan
o.co
m/
sout
hafri
ca/
178
37.jo
burg
.org
.za/
5354
.sal
ga.n
et/h
ome.
asp
27
17.p
olity
.org
.za/
pol/a
cts/
163
38.e
lect
ions
.org
.za/
5254
.wea
ther
sa.c
o.za
/27
18.c
psi.c
o.za
/14
639
.mil.
za/
4955
.arr
ivea
live.
co.z
a/26
19.s
ka.a
c.za
/13
840
.tac.
org.
za/
4855
.dur
bani
nves
tmen
t.co.
za/
26
20.m
indq
.bw
/13
741
.sah
rc.o
rg.z
a/45
55.n
da.a
gric
.za/
docs
/26
21.c
ount
erce
ntra
l.com
/12
341
.tota
l.co.
za/E
xter
nal_
cont
ent/
45

55
E-GOVERNANCE AND E-GOVERNMENTS IN AFRICA ...
infrastructure, e-readiness of the leadership and strategic thinking (Heeks 2002). Some of these challenges are reflected in tables 2 and 3, which show that not only are the ICT tools lacking, but the existing ones, such as the internet, are not fully utilised. For instance, at 3.6%, the internet penetration rate is lowest in Africa. The level of illiteracy in Africa is also said to be high: SIL International (s.a.) and APC (s.a.) provide statistics indicating the overall literacy rate in Africa to be below 60 per cent, with the highest rate being 85 to 90 per cent in Zimbabwe, and the lowest 10.6 to 17.1 per cent in Niger.
Table 2 reveals the radio to be the most common form of ICT in Africa, with 238 radios per 1 000 people having been recorded in the 32 selected African countries. In second position was the television (77 sets per 1 000 people), followed by the mobile phone (43), telephone landline (39) and personal computer (16). The total number of internet users in the countries investigated was 6 023 800 (approximately six million), which translates to an average of 188 000 people per country. Entertainment and news, which are the main services provided by radio and television, appeared to be the citizens’ preferred services, resulting in numerous people owning radios in the region. (Moreover, radios are generally cheaper than other ICTs.) However, radio and television are limited in that they offer only one-way communication, and do not therefore facilitate effective interaction between the government and its clientele. Citizens would find it difficult to “talk” back to the government, so to speak. Nevertheless, the call-in type of communication is becoming increasingly common during radio and TV talk shows, although this type of communication is generally initiated by programme presenters and not by “users”. However, it is worth noting that governments could use this service to improve service delivery. Fast gaining in the popularity stakes are mobile phones and personal computers. Generally, electronics (including mobile phones and personal computers) are becoming cheaper, and therefore more people can afford them. Some countries, such as Kenya, have abolished or drastically reduced the taxes levied on imported electronics, making it possible for most of the population not only to own these devices, but to own the most reliable ones – the type that can perform the greatest number of functions relating to e-governance, such as internet surfing, phone calls, FM radio services, entertainment, short message services and e-mail services. A development that deserves mention with regard to the use of mobile phones to communicate with the government is the launch of a presidential hotline by the President of South Africa, Jacob Zuma, on 7 October 2009, in order to improve communication with the public and deal effectively with service delivery bottlenecks (AllAfrica.com 2009). The media reported that during the first few days of its implementation, the hotline was inundated with callers registering complaints: the hotline received 7 261 calls between 09:00 and 12:00 (or 40 calls a minute) on its first day of implementation (Mail & Guardian 2009), leading to fears of the hotline being abused by the citizenry.

56
OMWOYO BOSIRE ONYANCHA
It is encouraging to note that compared with other geographic regions between 2000 and 2009, Africa experienced the second highest increase in internet usage (1 359.90%) after the Middle East. Given that the number of personal computers in Africa is low, the growth in internet usage witnessed over the past ten years could only mean that the African population is forced to share the relatively small number of available computers to access information on the internet. The role played by what are commonly known as “internet cafés” in the provision of internet access on the continent cannot be overemphasised. Although countries in Africa are struggling with meagre budgets, efforts are being made to improve the availability of internet services at all levels of governance, including in rural areas. This is well illustrated in recent ICT-related developments (APC s.a.) initiated by various governments, such as the formulation and enactment of ICT policies, the introduction and passing of parliamentary bills on improving internet access and the implementation of rural electrification programmes. It can be assumed that leaders have realised that ICTs (which include the internet) offer numerous opportunities which, if taken up by African governments, can improve e-governance tremendously.
Although not an absolute indicator of the amount of web information or measurement of web content, the number of web pages on a website may reflect how much information that website contains. The number of web pages is supplemented with the number of out-links. By providing links to external websites, pages or documents, the linking website or page provides additional information for its intended user(s). In this regard, the South African government could be said to offer more information than that of any other African country. The study revealed South Africa to be in the lead with 193 447 pages, while it provided a total of 2 004 619 out-links. An evaluation of the South African government’s website against the phases or stages of e-governance development indicates that South Africa is probably the only African country that is on the verge of attaining full e-governance status. Gartner (in Backus 2001) proposes four phases of e-governance, while Torres, Pina and Acerete (2006:281) identify five stages of e-government that may be used to measure the degree of development. Torres et al (2006:281), citing Moon, explain that stage 1 reflects the most basic form of e-government, with ICTs used to disseminate information simply through postings on the websites. Stage 2 entails two-way communication. During this stage, the government incorporates e-mail systems as well as information and data-transfer technologies. In stage 3, the government allows online service and financial transactions, in that way replacing public servants. In stage 4, the government attempts to integrate various government services both vertically and horizontally. Stage 5 involves the promotion of web-based political participation, in which government websites include e-governance tools such as e-democracy. The South African government has not fully met all the requirements as spelled out in the models of both Gartner (in Backus 2001) and Torres et al (2006), but an assessment of

57
E-GOVERNANCE AND E-GOVERNMENTS IN AFRICA ...
the South African government website reveals that stages 1 to 4 have been implemented, and stage 5 is in the process of being implemented (APC s.a.).
An analysis of the number of page, directory, domain, and site in-links and out-links among the websites investigated reveals very few intergovernment linkages. Table 5 shows that most of the government websites contained no links to or from the others. Only nine out of 28 government websites provided and/or received links to and/or from other government websites. Table 6 and figures 2 to 5 reveal similar patterns with regard to intergovernment linkages. These patterns have serious implications for the sharing and exchange of information among governments in the region and quick access to information by the entire African population. With the strengthening of the African Union and the possible establishment of the United States of Africa, it is hoped that the situation may improve. Poor levels of interconnectedness may also be attributed to the employment of non-professional website developers. There is definite merit in involving information professionals in the development of government websites, as they are not only custodians of information, but also scientists involved in information handling activities (such as information production, organisation, storage, and dissemination or transfer).
Besides illustrating the interlinkages between government websites in Africa, the social network maps identify the websites, domains, directories and pages that link to one another. For instance, in the case of domain interlinkages, the South African department of justice (doj.gov.za) and department of finance (dfa.gov.za) are among government departments (or domain names) that provided and/or received links to and/or from others. Others included the Mauritian attorney-general’s office and ministry of justice and human rights (attorneygeneral.gov.mu); the South African department of information (info.gov.za) and government communication and information system (gcis.gov.za); the central statistics office of Botswana (cso.gov.bw); Statistics South Africa (statssa.gov.za); the South African constitutional court (concourt.gov.za); and the ministry of finance and economic planning in Malawi (finance.malawi.gov.mw). The directory and page social networks provided further details about the nature, type and/or reasons for the linking patterns witnessed in the site and domain networks. Reasons for interlinking include the provision of information about governments and links to their contact details (doj.gov.za/alraesa/contacts/Kenya.htm; doj.gov.za/contacts/Mauritius.htm; etc). However, further research is necessary to study the specific reasons for linking. For instance, why does the Gambian statistics department provide links to the South African statistics department? Likewise, why does the Tanzanian statistics department receive a link from the government of Mauritius?
Figures 6 and 7 illustrate closely linked sites and domains respectively. Although figure 6 does not identify clear relationships between the government websites, it nevertheless shows that South Africa has a close link or relationship with Botswana, Mauritius and
58
OMWOYO BOSIRE ONYANCHA
Gambia, but not with Kenya, which is situated far from the rest of the countries. Similarly, Tanzania and Malawi are in close proximity, indicating a close link or relationship between them. Two factors may be influencing the patterns of linkages illustrated in figures 6 and 7, namely geographic proximity and bilateral relations between countries. For instance, countries in the Southern African Development Community (SADC) seem to provide links to one another. However, this interpretation requires further research to determine its validity. Figure 7, which was generated using the domain network in figure 3 with a stress value of 0.198 in 36 iterations, shows close relationships between several domains that formed a high cluster, as circled in the illustration. Elements in the cluster revolve around three South African domains, namely, the department of information (www.info.gov.za), the department of finance (www.dfa.gov.za), and the department of statistics (www.statssa.gov.za). Any close relationship between two domain names in the cluster, other than the three South African departments, therefore simply comes about because the domain names are linked to one of the South African government departments mentioned. Also worth noting is the presence of four domain names scattered across the top left corner of the scatter graph. They are the Mauritian attorney-general’s office (attorneygeneral.gov.mu), the chambers of the attorney-general of Botswana (gov.bw:4400), the Kenyan attorney-general’s office (kenya.go.ke) and the South African department of justice (doj.gov.za). The latter, through one of its sections (the Association of Law Reform Agencies of Eastern and Southern Africa) provides links to the named member institutions in different countries. The four domain names share a common theme: they are the legal advisory offices of governments or officers in charge of departments of justice.
External links were examined in order to determine the nature and type of external information that citizens can access through government websites and the institutions with links to government websites, in other words, the kind of external information to which African government websites direct their clientele (more particularly, their citizens). Table 7 shows that commercial companies (.co or .com) are the most commonly targeted institutions, followed by non-governmental organisations and academic institutions. It was also observed that the most commonly targeted website was http://www.safrica.info, South Africa’s gateway to investment, travel and country information, the purpose of which is to provide information about South Africa to the International Marketing Council of South Africa (IMC). The website is owned by the IMC, and it is likely that most of the links to this website originate from the website of the South African government. The second most targeted website was Microsoft Corporation’s Windows home page (http://www.microsoft.com/windows/). Microsoft Corporation is an American multinational computer technology corporation that manufactures, licenses and supports a wide range of software products for computing devices such as the Microsoft Windows operating system and Microsoft Office Suite

59
E-GOVERNANCE AND E-GOVERNMENTS IN AFRICA ...
productivity software. The large number of links to this home page could perhaps be attributed to the downloading of Windows operating software (OS) and Microsoft Office Suite files for installing or updating the OS and Suite files, or installing drivers for computer accessories such as printers, modems, external hard drives and so on. The provision of such information to citizens is vital, as it ensures that the computers used by citizens are operational and capable of interacting with the government at all times. Other sites include Mozilla and Netscape. These two companies are major developers of internet browser software that goes by the same names. When analysing the type of external links, it became apparent that governments had provided citizens with a variety of internet information resources and products, including freeware downloads (Netscape, Mozilla, Adobe Acrobat Reader, etc); news (cnn.com, engineeringnews.co.za, businessday.co.za, sundayindependent.co.za, etc); academic or educational sites (up.ac.za, uct.ac.za, uwc.ac.za, sun.ac.za, etc); general information (safrica.info); travel (safrica.info, sacities.net, southafrica.net, etc); and search engines (google.com). Also notable is that most of the external sites in table 7 are located in the countries investigated in this study. Foreign-based sites (i.e. located outside Africa) were few, perhaps because most African governments view their websites as marketing tools for their respective countries. In some instances, most of the companies that support a particular government website may be located within the country.
In conclusion, the presence of African governments in cyberspace is increasingly becoming a reality, as illustrated in table 1. The study reported on here bears out the view of Chisenga (2004), who observes that most African governments are finding their way into cyberspace through the construction of their own websites. Although the scope of the study did not make it possible to establish the use of most ICTs for e-governance, these tools can be effectively used by governments in the region to enhance the provision of services to the general public. However, it was noted that much needs to be done to ensure that these facilities are affordable and readily available to all. Efforts and initiatives such as the provision of telecentres, the formulation of ICT policies, the New Partnership for Africa’s Development (NEPAD) projects that aim to provide internet facilities in schools in Africa and rural electrification may result in the accelerated use of ICTs in e-governance in the region. In terms of the level or stage of e-governance development, it was observed that most countries in the region seem to be in early stages of development. Only the South African government has made significant progress in this context. Most of the governments studied had managed to provide information on their websites, which is only the first stage of e-governance development. These governments need to move to a higher level of e-governance development by introducing other services that would improve their interactions with citizens. Links to external sites need to be improved to enable citizens to access information in one sitting, without necessarily moving from one window (by closing

60
OMWOYO BOSIRE ONYANCHA
it) to another (by opening it). Website authors need to ensure that the links are updated regularly to avoid dead links, which may frustrate citizens in the process of accessing information. To assist users with queries, an electronic help desk that operates 24 hours a day, seven days a week, needs to be established. The impact of ICTs in transforming governance, not only in Africa but worldwide, is far reaching. The influence of ICTs on the way individuals and institutions interact is well summarised in the Kenyan Sunday Nation of 1 July 2007, where it is stated that “[i]nteraction is more immediate and more intense; people are joined every second of the day by the umbilical cord of technology. This has sped up the rate of change in values, power and authority relations within social units and so on.”
Zwahr and Finger (2004) write that ongoing e-government initiatives are proving the potential of ICTs to facilitate the emergence of new business models at the public–private sector interface. It is therefore recommended that African government leaders show goodwill (by providing an enabling political, social and economic environment) with regard to ICT policy formulation, and consider e-governance as an enabler as opposed to a competitor, thereby throwing their weight behind all initiatives that are geared towards achieving e-governance in the region.

61
E-GOVERNANCE AND E-GOVERNMENTS IN AFRICA ...
REFERENCESAllAfrica.com. 2009. South Africa: Zuma to officially launch hotline today. http://allafrica.com/
stories/200910070229.html (Accessed 2 November 2009).APC (Association for Progressive Communications). [s.a.] APC Africa ICT policy monitor:
compare national ICT statistics. http://africa.rights.apc.org/index.shtml?apc=se_1 (Accessed 25 October 2009).
Backus, M. 2001. E-governance in developing countries. IICD research brief, (1). http://www.ftpiicd.org/files/research/briefs/brief1.pdf (Accessed 20 October 2009).
Bar-Ilan, J. 2005. What do we know about links and linking? A framework for studying links in academic environments. Information Processing and Management 41(4):973–986.
Björneborn, L & Ingwersen, P. 2004. Towards a basic framework of webometrics. Journal of the American Society for Information Science and Technology 55(14):1216–1227.
Borgatti, SP, Everett, MG & Freeman, LC. 2002. Ucinet 6 for Windows. Harvard: Analytic Technologies.
Bureau of Justice Assistance. [s.a.]. Glossary. www.ojp.usdoj.gov/BJA/evaluation/glossary/glossary_c.htm (Accessed 20 June 2007).
Chisenga, J. 2004. African governments in cyberspace: are they bridging the content divide?, in Birungi, P & Musoke, MG, Towards a knowledge society for Africa. Proceedings of the 16th Standing Conference of Eastern, Central and Southern African Library and Information Associations (SCECSAL XVI), Kampala, Uganda, 5–9 July.
Cybermetrics Lab. 2007. Webometrics ranking of world universities. http://www.webometrics.info/ (Accessed 10 April 2008).
Diodato, V. 1994. Dictionary of bibliometrics. New York: Haworth.Godse, V & Garg, A. 2007. From e-government to e-governance. http://www.iceg.net/2007/
books/1/2_313.pdf (Accessed 25 October 2009).Heeks, R. 2002. eGovernance in Africa: promise and practice. http://idpm.man.ac.uk/wp/igov/
index.htm (Accessed 22 June 2008).Hertzel, D. 1987. Bibliometrics, history of the development of ideas, in Kent, A (ed), Encyclopaedia
of library and information science, vol 42. New York: Marcel Dekker:144–219.Ikpaahindi, L. 1985. An overview of bibliometrics: its measurements, laws and their applications.
LIBRI 35(2):163–177.Mail & Guardian. 2009. Zuma hotline inundated with calls. 14 September. http://www.mg.co.za/
article/2009-09-14-zuma-hotline-inundated-with-calls (Accessed 2 November 2009).Miniwatts Marketing Group. 2009. Internet world stats: usage and population statistics. http://
www.internetworldstats.com/stats6.htm (Accessed 5 November 2009). Onyancha, OB. 2007a. A webometric study of selected academic libraries in eastern and southern
Africa using a link analysis approach. South African Journal of Libraries and Information Science 73(1):25–39.
Onyancha, OB. 2007b. E-governance in eastern and southern Africa: a webometric study of the governments’ websites. International Review of Information Ethics 7(9). http://www.i-r-i-e.net/inhalt/007/33-onyancha.pdf (Accessed 24 May 2009).

62
OMWOYO BOSIRE ONYANCHA
Onyancha, OB & Ocholla, DN. 2007. The performance of South African and Kenyan universities on the World Wide Web: a web link analysis. Cybermetrics: International Journal of Scientometrics, Informetrics and Bibliometrics 11(1). http://www.cindoc.csic.es/cybermetrics/articles/v11i1p2.html (Accessed 27 June 2009).
Onyancha, OB & Ocholla, DN. 2008. A co-link analysis of institutions of higher learning in eastern and southern Africa: preliminary findings. Mousaion 26(1):46–70.
Onyancha, OB & Ocholla, DN. 2009. Subject content analysis of the HIV/AIDS research in eastern and southern Africa, 1981–2005. Mousaion 28(2):89–109.
Oracle. 2006. E-governance challenges for government. http://www.egovcenter.in/e-governance/egov_challenges.html (Accessed 20 July 2009).
Ortega, JL, Aguillo, I, Cothey, V & Scharnhorst, A. 2007. Maps of the academic web in the European higher education area: an exploration of visual web indicators. http://eprints.rclis.org/archive/00005038/01/Ortega_et_al_2007.pdf (Accessed 20 April 2007).
Rao, IKR & Neelameghan, A. 1992. From librametry to informetrics: an overview and Ranganathan’s contributions. LIBRI 42(3):242–257.
Reitz, JM. 2006. Online dictionary of library and information science. http://lu.com/odlis/odlis_b.cfm (Accessed 2 May 2009).
Sheridan, W & Riley, TB. 2006. Comparing e-government vs e-governance. http://www.gisdevelopment.net/magazine/years/2006/aug/46_1.htm (Accessed 30 October 2009).
SIL International [s.a.] Facts about illiteracy. www.sil.org/literacy/litfacts.htm (Accessed 4 July 2007).
Sunday Nation. 2007. The new James Bond, licensed to snoop. 7 January. Tankoano, J. [s.a.] E-readiness in Africa: ICT infrastructures for e-governance. http://unpan1.
un.org/intradoc/groups/public/documents/CAFRAD/UNPAN006613.pdf (Accessed 2 October 2009).
Thelwall, M. 2002a. A comparison of sources of links for academic web impact factor calculations. Journal of Documentation 58(1):66–78.
Thelwall, M. 2002b. An initial exploration of the link relationship between UK university web sites. ASLIB Proceedings 54(2):118–126.
Thelwall, M. 2002c. Evidence for the existence of geographic trends in university web site interlinking. Journal of Documentation 58(5):563–574.
Thelwall, M. 2003. Can Google’s pageRank be used to find the most important academic web pages? Journal of Documentation 59(2):205–217.
Thelwall, M & Wilkinson, D. 2004. Finding similar academic web sites with links, bibliometric couplings and colinks. Information Processing and Management 40:515–526.
Torres, L, Pina, V & Acerete, B. 2006. E-governance development in European cities: reshaping government’s relationship with citizens. An International Journal of Policy, Administration, and Institutions 19(2):277–302.
United Nations Development Programme – Regional Centre Bangkok. 2009. E-governance and e-government. http://www.apdip.net/projects/e-government (Accessed 25 October 2009).
63
E-GOVERNANCE AND E-GOVERNMENTS IN AFRICA ...
United Nations Online Network in Public Administration and Finance (UNPAN). 2007. The challenges of e-governance in Africa: the overall context and the role of e-government in the New Partnership for Africa’s Development (NEPAD) initiative. http://unpan1.un.org/intradoc/groups/public/documents/CAFRAD/UNPAN012561.pdf (Accessed 2 October 2009).
Vaughan, L & You, J. 2006. Comparing business competition based on web co-link data: the global market vs the Chinese market. Scientometrics 68(3):611–628.
Vaughan, L, Kipp, MEI & Gao, Y. 2006. Why are websites co-linked? The case of Canadian universities, in Moukdad, H (ed), Conference proceedings of the Canadian Association of Information Science. http://www.cais-acsi.ca/proceedings/2006/vaughan_2006.pdf (Accessed 31 May 2008).
Wikipedia. 2009. Social network. http://en.wikipedia.org/wiki/Social_networks (Accessed 5 November 2009).
Zeinolabedinio, MH, Maktabifard, L & Osareh, F. [s.a.] Collaboration analysis of world national library websites via webometric methods. http://eprints.rclis.org/archive/00006053/01/51a.pdf (Accessed 25 April 2008).
Zwahr, T & Finger, M. 2004. Towards virtual governance architecture: a perspective on information technology as a transformer of public institutions and governments. http://www2.epfl.ch/webdav/site/mir/shared/import/migration/zwahr_eChallenges04.pdf (Accessed 5 November 2009).
Zwahr, T & Finger, M. 2005. Enhancing the e-governance model: enterprise architecture as a potential methodology to build a holistic framework. http://www2.epfl.ch/webdav/site/mir/shared/import/migration/zwahr_pista04.pdf (Accessed 2 October 2009).