Embed Size (px)
Citation preview
Dynamics of the Saccharomyces cerevisiae Transcriptome during BreadDough Fermentation
Elham Aslankoohi,a,b Bo Zhu,a,b Mohammad Naser Rezaei,c Karin Voordeckers,a,b Dries De Maeyer,d Kathleen Marchal,d
Emmie Dornez,c Christophe M. Courtin,c Kevin J. Verstrepena,b
VIB Laboratory of Systems Biology, Leuven, Belgiuma; CMPG Laboratory of Genetics and Genomics, KU Leuven, Leuven, Belgiumb; Laboratory of Food Chemistry andBiochemistry and Leuven Food Science and Nutrition Research Centre (LFoRCe), KU Leuven, Leuven, Belgiumc; Center of Microbial and Plant Genetics, KU Leuven,Leuven, Belgiumd
The behavior of yeast cells during industrial processes such as the production of beer, wine, and bioethanol has been extensivelystudied. In contrast, our knowledge about yeast physiology during solid-state processes, such as bread dough, cheese, or cocoafermentation, remains limited. We investigated changes in the transcriptomes of three genetically distinct Saccharomyces cerevi-siae strains during bread dough fermentation. Our results show that regardless of the genetic background, all three strains ex-hibit similar changes in expression patterns. At the onset of fermentation, expression of glucose-regulated genes changes dra-matically, and the osmotic stress response is activated. The middle fermentation phase is characterized by the induction of genesinvolved in amino acid metabolism. Finally, at the latest time point, cells suffer from nutrient depletion and activate pathwaysassociated with starvation and stress responses. Further analysis shows that genes regulated by the high-osmolarity glycerol(HOG) pathway, the major pathway involved in the response to osmotic stress and glycerol homeostasis, are among the mostdifferentially expressed genes at the onset of fermentation. More importantly, deletion of HOG1 and other genes of this pathwaysignificantly reduces the fermentation capacity. Together, our results demonstrate that cells embedded in a solid matrix such asbread dough suffer severe osmotic stress and that a proper induction of the HOG pathway is critical for optimal fermentation.
Solid-state fermentation (SSF) is defined as fermentation in theabsence or near absence of free water, in which microbes grow
on a moist solid substrate (1). SSF is commonly used to producemany different kinds of food, including cheese, soy sauce, andbread (2). Similarly, SSF has also been used successfully for theproduction of several enzymes (3–6) and secondary metabolitessuch as antibiotics, mycotoxins, and biosurfactants, etc. (7). Fur-thermore, there is a renewed interest in using SSF for bioethanolproduction from agricultural crops and their products (8–10).
The main difference between SSF and liquid fermentationssuch as those used in the production of beer and wine is the re-duced level of free water in SSF. As a consequence, the movementof cells and diffusion of cellular metabolites and nutrients arelimited, which may result in local gradients of temperature, mois-ture, pH, nutrients, and waste products (11). Moreover, thegrowth, gene expression profile, and metabolism of fungi duringsolid-state fermentation are different from those during liquid-state fermentation (7, 12–14). This might be due to a differentcellular physiology of the fungi in the solid state compared to theliquid state.
Despite its industrial relevance, yeast physiology during solid-state fermentations is relatively understudied compared to liquidfermentations. This is especially the case for bread dough fermen-tation, where no data are available that describe yeast cell physiol-ogy during the fermentation process. This is at least partly due tothe technical difficulties associated with isolating representativecell samples from the solid fermentation matrix. Some studieshave attempted to gain insight into bread fermentation by mim-icking the process in liquid (15–17). Whereas such studies defi-nitely contributed to our knowledge, they change the single mostimportant parameter of SSFs (the solid state) and are therefore notan optimal model for the industrial SSF process.
Global gene expression analysis approaches such as microarray
analysis or transcriptome sequencing (RNA-seq) are powerfultools to obtain a snapshot of the cell’s transcriptome and therebygain insight into a cell’s physiological state. Several studies haveinvestigated the expression profile of yeast genes during liquidfermentation such as beer, wine, or even liquid model dough fer-mentation (15, 16, 18–23). Those studies showed that in general,the start of fermentation is associated with a loss of stress resis-tance due to the repression of stress-related genes by glucose orsucrose (24–26). Furthermore, in some cases, induction of path-ways associated with osmotic stress has also been observed, pre-sumably due to a high sugar concentration of the substrate (27).
Here, we optimized a method to isolate high-quality RNA sam-ples from Saccharomyces cerevisiae cells embedded in fermentingbread dough and thus studied changes in the yeast transcriptomethroughout the fermentation process. Using this method, wetracked changes in the transcriptomes of three genetically distinctS. cerevisiae strains during bread dough fermentation. Our resultsshow that all strains show similar expression trends, with somesubtle differences. In the first phase of fermentation, the cells needto adapt to the high osmolarity and nutrient concentration of the
Received 8 August 2013 Accepted 12 September 2013
Published ahead of print 20 September 2013
Address correspondence to Christophe M. Courtin,[email protected], or Kevin J. Verstrepen,[email protected].
Supplemental material for this article may be found at http://dx.doi.org/10.1128/AEM.02649-13.
Copyright © 2013, American Society for Microbiology. All Rights Reserved.
doi:10.1128/AEM.02649-13
The authors have paid a fee to allow immediate free access to this article.
December 2013 Volume 79 Number 23 Applied and Environmental Microbiology p. 7325–7333 aem.asm.org 7325
Dow
nloa
ded
from
http
s://j
ourn
als.
asm
.org
/jour
nal/a
em o
n 21
Dec
embe
r 20
21 b
y 18
0.19
7.13
4.19
8.
surrounding dough matrix. This initial adaptation phase is fol-lowed by an active fermentation phase, where cells first consumepreferred sugars such as glucose and sucrose before switching tomaltose. At the end of the short but vigorous fermentation, cellsexperience starvation and start building up stress resistance. Byinvestigating the effect of the deletion of genes that are highlyinduced at the start of dough fermentation, we find that the high-osmolarity glycerol (HOG) pathway is instrumental for adapta-tion to solid-state conditions.
MATERIALS AND METHODSStrains and microbial procedure. Three isolated commercial strainsfrom bread, wine, and the bioethanol industries were used for investiga-tion of changes in the yeast transcriptome during dough fermentation. Toselect these 3 strains, we screened 24 genetically distinct strains for theirdough fermentation capacity. The interdelta genetic fingerprinting assaywas done as described previously by Legras and Karst (28). The method isbased on the PCR amplification of interdelta regions using interdeltaprimers (delta 12 and delta 21) (28).
For follow-up on the results of the RNA-seq experiment, we made useof mutants with a single deletion of the genes of interest, available in theyeast deletion collection (S288c; Invitrogen). The deletion of each genewas confirmed by PCR.
Yeast cultures were grown under optimal conditions as described pre-viously, and standard procedures for isolation and manipulation of DNAwere used (29, 30). For dough preparation, the yeast cells were harvestedat early stationary phase and washed with water before inoculation intodough.
Flour characterization, dough preparation, and fermentation.Commercial flour obtained from Ceres (Vilvoorde, Belgium) was usedthroughout this study. Dough was prepared according to the straight-dough method described previously by Shogren and Finney (31), usingthe following formula: 100.0 g flour (on a 14% moisture basis), 6.0%(wt/wt) sucrose, 1.5% (wt/wt) sodium chloride, 52.0% (vol/wt) water,and 5.3% yeast. The ingredients were mixed in a 100-g pin bowl mixer(National Manufacturing, Lincoln, NE, USA) for 3 min 50 s. Next, thedough was divided into 10-g pieces, which were fermented in a fermenta-tion cabinet at 30°C with a relative humidity (RH) of 90% for 30, 60, and180 min.
Gas production measurement. The volume of gas produced by dif-ferent strains and mutants during dough fermentation was measured byusing a Risograph instrument (National Manufacturing). Balls of doughwere made as described above and were left to ferment for a maximum of180 min at 30°C in the Risograph instrument. Gas production was mea-sured continuously at 1-min intervals.
Sampling for RNA extraction. Multiple pieces of dough were pre-pared and fermented in a fermentation cabinet (30°C and 90% relativehumidity) for a maximum of 180 min. Samples were taken at 30, 60, and180 min after the onset of fermentation. The samples were frozen by usingliquid nitrogen and kept at �80°C before RNA extraction. Nonferment-ing yeast cells right before mixing with dough were used as the “0-min”sample. The experiment was performed in parallel for two biological rep-licates of each strain.
RNA isolation. We developed a method to isolate RNA from yeastcells embedded in bread dough based on standard methods for RNA iso-lation (29, 30) and a method described previously by Panadero et al. (32).Pieces of dough (0.5 g) were homogenized with 3.0 ml of ice-cold LETSbuffer (0.2 M LiCl, 0.02 M EDTA, 0.02 mM Tris-HCl [pH 8.0], 0.4% SDS)by using an Ultra-Turrax T10 Basic disperser (IKA Werke GmbH,Staufen, Germany). Aliquots of 0.5 ml of the dough suspension weretransferred into screw-cap microtubes containing 0.5 ml of phenol-chlo-roform-isoamyl alcohol (25:24:1) and 0.5 ml glass beads (acid-washedbeads, 425 to 600 �m in diameter). The suspension was mixed vigorouslythree times for 20 s by using a Fast Prep homogenizer (MP Biomedicals).After centrifugation at 17,900 � g for 10 min at 4°C, the upper phases
from 2 tubes were pooled in a microtube containing 0.5 ml chloroform-isoamyl alcohol (24:1). After thorough vortexing, phases were separatedby centrifugation at 17,900 � g for 10 min (at 4°C). The upper phase wastransferred into a clean microtube, and this step was repeated until theinterface between the aqueous and organic layers was clear after centrifu-gation. Total nucleic acids were precipitated with 1 ml ice-cold 100%ethanol and 25 �l 40% potassium acetate and kept at �20°C overnight.Samples were then thawed on ice the next day and were centrifuged at15,000 � g for 10 min. Each pellet was resuspended in 350 �l of RLT buffer(Qiagen GmbH, Hilden, Germany) plus 350 �l of 70% ethanol and wasloaded onto an RNeasy minicolumn (Qiagen). Column eluents werepooled, the A260/A280 ratio was used to estimate RNA purity, and thequality of RNA was checked on a 1.2% agarose–Tris-acetate-EDTA(TAE)–formaldehyde gel. In the case of impurities, a second precipitationwas done as described above, and the precipitate was washed by using 70%ethanol and resuspended in RNase-free water.
RNA-seq and data analysis. Illumina next-generation sequencingwith 100� coverage of the haploid S. cerevisiae genome was carried out forall samples, as described previously (33). After removal of the low-qualityreads and adaptors, RNA-seq reads (50 bp, single end) were aligned to theSaccharomyces cerevisiae S288c reference genome (version EF4.66) by us-ing TopHat 2.0.7 (34). Aligned reads were further visualized by usingTablet (35). Between 5 � 106 and 35 � 106 reads were aligned for eachsample. RPKM (reads per kilobase per million mapped reads) expressionvalues were calculated with Cufflinks 2.0.2 (36). Next, Cuffdiff was used todetermine differential expression by comparing transcript abundancesbetween pairs of duplicate experiments (see the supplemental material fordetails). Genes with significant differential expression (at least 2-foldchanges and a false discovery rate [FDR] value of �0.0001) were selectedfor further analysis.
Hierarchical clustering for heat map. After the removal of zero val-ues, RPKM values were log2 transformed and quantile normalized. Thiswas followed by hierarchical clustering with average linkage using Euclid-ian distance. Next, using the gPlots package in R, the log2-transformedvalues were plotted on a blue-yellow heat map, with saturation of colors at5% extreme values.
Categorization of expression profiles and Gene Ontology. Since wehave a short time series, we used template-matching clustering of theexpression data, using ORIClust (37). We performed the time-profileclustering on a specific filtered subset of genes, namely, those identified byedgeR to be differentially expressed in at least one time point compared totime point zero (38). We removed the rows where at least one of thesamples had an RPKM of zero, log2 transformed the data, and performeda quantile normalization. This subset of genes was analyzed by usingORIClust (ORICC2 algorithm) to assign the genes to meaningful time-dependent categories. Next, we used the Database for Annotation, Visu-alization, and Integrated Discovery (DAVID) (http://david.abcc.ncifcrf.gov/) to search for enriched gene sets in different clusters (39). TheFunctional Annotation Tool in the online version of DAVID was run byusing the default parameters, and the top 50 Gene Ontology (GO) termsin the Gene Ontology Biological Process category are reported (FDR �0.01).
Physical interaction network. A physical interaction network,G(V,E), models the interactome of an organism. In this network, theedges, E, represent the physical interactions between the different genes/gene products, V. Different layers of interactions are combined in thisnetwork, namely, protein-protein, protein-DNA, and phosphorylationinteractions (40). Each interaction in the network is scored with a proba-bility value. This value reflects the likelihood that the interaction trulyexists in the organism’s interactome (41, 42). To complement and anno-tate the interaction network, protein complex data were added to thenetwork (43).
PheNetic. PheNetic is an algorithm which extracts minimal connectedsubnetworks between a cause, a genetic perturbation, and its effects, dif-ferentially expressed genes (44). To this end, the algorithm selects from
Aslankoohi et al.
7326 aem.asm.org Applied and Environmental Microbiology
Dow
nloa
ded
from
http
s://j
ourn
als.
asm
.org
/jour
nal/a
em o
n 21
Dec
embe
r 20
21 b
y 18
0.19
7.13
4.19
8.

the network the edges which best connect the given cause to its effectthrough a regulatory path by maximizing the score S(D) in the equationbelow. A regulatory path is defined here as a path which can lead to dif-ferential expression from the given cause to an effect and thus a path inwhich the last edge is a protein-DNA edge.
S(D) � � �(x, y) � I
fr � P[regPath(x, y)�D]� � �D� � xC
In this equation, D is a subnetwork from G; I is the set of cause-effectpairs, where x corresponds to the cause and y corresponds to the effect; fris a reward function based on the degree of differential expression; andP[regPath(x,y)�D] is the probability that a regulatory path exists in theselected subnetwork D from x to y. Finally, xC is a constant cost factor,which allows us to define the size of the selected network.
Here, PheNetic was used with a path length of 5, with the 20 bestproofs for each of the 100 cause-effect pairs with the largest degree ofdifferential expression (44). No adjustments of the probabilities in thenetwork based on network centrality were performed.
Network visualization and analysis. Visualization and analysis of thenetwork were performed by using cytoscape (45), clueGO (46), andBiNGO (47). GO enrichments were performed by using a hypergeometrictest and a Benjamini-Hochberg correction (48). GO annotations for S.cerevisiae were downloaded from the Gene Ontology (49) website (version1.1600).
RNA-seq data. Sequencing data were deposited in the GenBank data-base under bioproject identifier PRJNA212389.
RESULTSStrain selection for dough fermentation and transcriptomeanalysis. To obtain a general picture of yeast cell physiology dur-ing bread dough fermentation, we studied the transcriptome ofyeast during this process. We selected three genetically distinct S.cerevisiae strains to investigate to what extent the responses arestrain specific. To select these strains, we first screened 24 S. cerevi-siae strains from different industrial applications (beer, wine, bio-ethanol, and bakery) with diverse genetic backgrounds (as esti-mated from an interdelta genetic fingerprinting assay [Fig. 1; seealso Materials and Methods]) for CO2 production during doughfermentation as an indication of their fermentation capacity indough. Based on the screening results, we selected three geneti-cally distinct strains that showed a similar and sufficient capacityto ferment bread dough for further investigation. The three strains
included a commonly used industrial baker’s yeast strain as well asa bioethanol strain and a wine strain, which are genetically verydifferent from the baker’s yeast strain but yield similar levels ofCO2 production during dough fermentation (Fig. 1A and B).
Yeast cells show a transient response during dough fermen-tation. Next, we investigated the transcriptional responses of thethree selected strains throughout bread dough fermentation. Wefirst optimized a method to extract high-quality RNA from yeastcells embedded in dough (see Materials and Methods for details).Next, we used RNA-seq to investigate changes in the transcrip-tomes of the strains at three different time points during the fer-mentation (30, 60, and 180 min after the start of fermentation)compared to the nonfermenting status (yeast cells harvested at theearly stationary phase right before inoculation into the dough [0-min sample]). For each yeast strain, two independent biologicalreplicates were analyzed.
The transcriptome data obtained from this experiment indi-cated that yeast cells show a strong response to the changing con-ditions during the fermentation process, with around half of thetotal number of genes (protein or RNA coding) showing �2-foldchanges in expression levels over the course of the fermentationprocess. Interestingly, the commercial baker’s yeast strain on av-erage showed smaller changes in its transcriptome, in terms ofboth the number of genes and the magnitude of changes, than thetwo other strains (Fig. 2A and B).
Further analysis revealed that the three strains showed a re-markably similar transcriptional profile during fermentation.Specifically, when all transcriptome data were clustered based onsimilarity (see Materials and Methods), samples obtained fromdifferent strains at the same time point always clustered together(Fig. 2C). Moreover, all biological replicates always clustered to-gether and yielded a very similar profile, suggesting that the anal-ysis was robust and reproducible.
We calculated the average mRNA quantities, as estimated bythe RPKM (reads per kilobase per million mapped reads) values,for each gene in replicate samples. Subsequently, the pairwiseEuclidean distances for those values of samples grouped either bystrain or by time point were calculated. A nonparametric Wil-
FIG 1 Three genetically distinct strains from different fermentation industries (wine, bread, and bioethanol) with an acceptable dough fermentation capacitywere selected. (A) The genetic relatedness of 24 strains from different fermentation industries was determined by an interdelta genetic fingerprinting assay. (B)CO2 production during dough fermentation indicates that all three strains can ferment dough at an acceptable rate.
Yeast Transcription during Solid-State Fermentation
December 2013 Volume 79 Number 23 aem.asm.org 7327
Dow
nloa
ded
from
http
s://j
ourn
als.
asm
.org
/jour
nal/a
em o
n 21
Dec
embe
r 20
21 b
y 18
0.19
7.13
4.19
8.
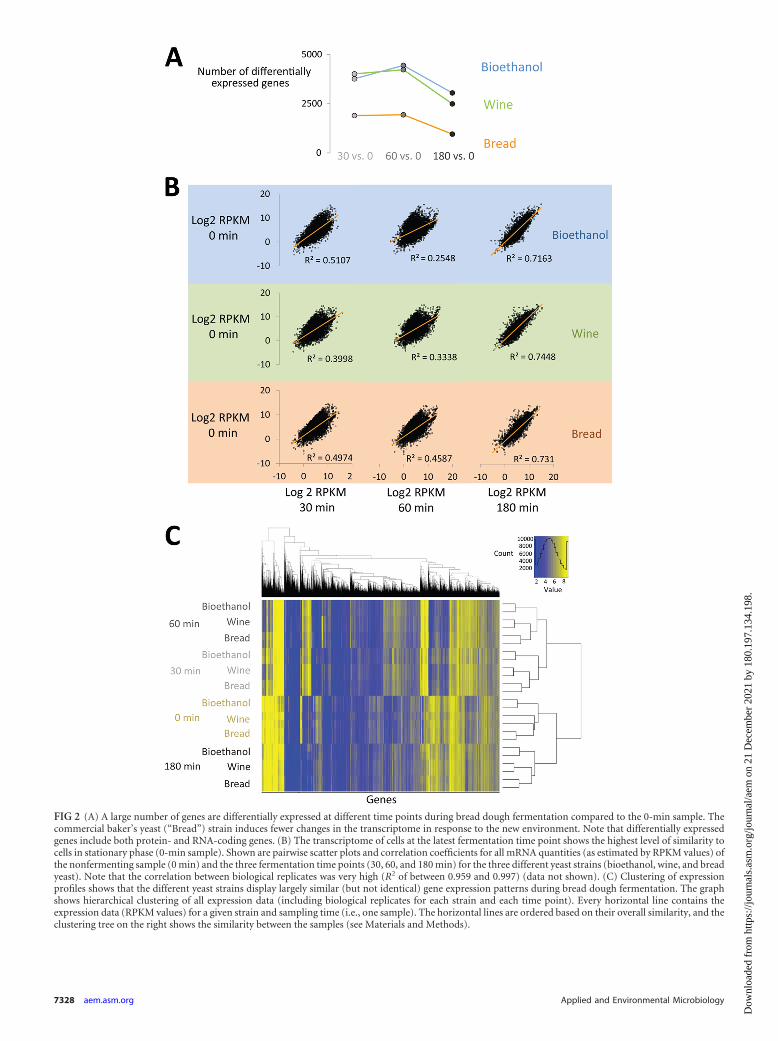
FIG 2 (A) A large number of genes are differentially expressed at different time points during bread dough fermentation compared to the 0-min sample. Thecommercial baker’s yeast (“Bread”) strain induces fewer changes in the transcriptome in response to the new environment. Note that differentially expressedgenes include both protein- and RNA-coding genes. (B) The transcriptome of cells at the latest fermentation time point shows the highest level of similarity tocells in stationary phase (0-min sample). Shown are pairwise scatter plots and correlation coefficients for all mRNA quantities (as estimated by RPKM values) ofthe nonfermenting sample (0 min) and the three fermentation time points (30, 60, and 180 min) for the three different yeast strains (bioethanol, wine, and breadyeast). Note that the correlation between biological replicates was very high (R2 of between 0.959 and 0.997) (data not shown). (C) Clustering of expressionprofiles shows that the different yeast strains display largely similar (but not identical) gene expression patterns during bread dough fermentation. The graphshows hierarchical clustering of all expression data (including biological replicates for each strain and each time point). Every horizontal line contains theexpression data (RPKM values) for a given strain and sampling time (i.e., one sample). The horizontal lines are ordered based on their overall similarity, and theclustering tree on the right shows the similarity between the samples (see Materials and Methods).
7328 aem.asm.org Applied and Environmental Microbiology
Dow
nloa
ded
from
http
s://j
ourn
als.
asm
.org
/jour
nal/a
em o
n 21
Dec
embe
r 20
21 b
y 18
0.19
7.13
4.19
8.
coxon test showed that the distances between samples grouped bytime point are smaller than the distances between samplesgrouped by strain (P � 10�5). This confirms that the three strainsshowed a similar response throughout the fermentation process,regardless of their genetic differences. This analysis also indicatesthat most genes show a transient response. Specifically, the sam-ples from nonfermenting yeast (0 min) and the last fermentation
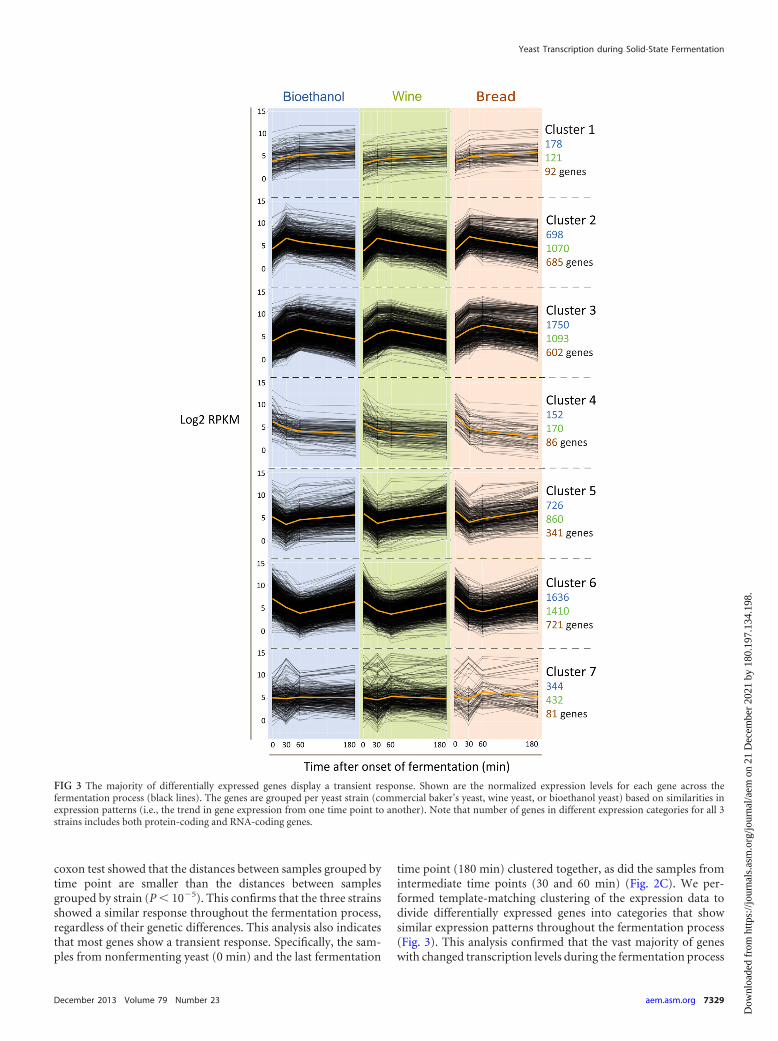
time point (180 min) clustered together, as did the samples fromintermediate time points (30 and 60 min) (Fig. 2C). We per-formed template-matching clustering of the expression data todivide differentially expressed genes into categories that showsimilar expression patterns throughout the fermentation process(Fig. 3). This analysis confirmed that the vast majority of geneswith changed transcription levels during the fermentation process
FIG 3 The majority of differentially expressed genes display a transient response. Shown are the normalized expression levels for each gene across thefermentation process (black lines). The genes are grouped per yeast strain (commercial baker’s yeast, wine yeast, or bioethanol yeast) based on similarities inexpression patterns (i.e., the trend in gene expression from one time point to another). Note that number of genes in different expression categories for all 3strains includes both protein-coding and RNA-coding genes.
Yeast Transcription during Solid-State Fermentation
December 2013 Volume 79 Number 23 aem.asm.org 7329
Dow
nloa
ded
from
http
s://j
ourn
als.
asm
.org
/jour
nal/a
em o
n 21
Dec
embe
r 20
21 b
y 18
0.19
7.13
4.19
8.

showed a transient response, either transient induction (clusters 2and 3) (Fig. 3) or transient repression (clusters 5 and 6) (Fig. 3).
The majority of differentially expressed genes are involved inmetabolic shifts and the response to nutrient levels. In order toobtain deeper insight into the transcriptional response of yeastcells during dough fermentation, we used the Gene Ontology clas-sification to check for enrichment of specific functionally relatedgene groups within the different sets of coregulated genes (Fig. 3).The analysis showed that cluster 2, the group with transiently up-regulated genes with maximum expression 30 min after the onsetof fermentation, is enriched for genes involved in ribosome bio-genesis, tRNA processing, and nuclear transport (P values for eachGO category can be found in Table S1 in the supplemental mate-rial). Cluster 3, the group of transiently upregulated genes withmaximum expression 60 min after the onset of fermentation, isenriched for genes involved in amino acid metabolism (especiallyaspartate family and sulfur amino acids), translation, and repro-duction of transposable elements. On the other hand, the group oftransiently repressed genes (clusters 5 and 6) (Fig. 3) containsgenes involved in aerobic respiration, the tricarboxylic acid (TCA)cycle, protein catabolic processes, and autophagy. Together, thesedata indicate a shift from respiration to fermentation between 0and 30 min and active fermentation and cell growth between 30and 60 min, followed by increased stress and nutrient depletiontoward the end of fermentation (180 min).
The HOG pathway is required to adapt to high osmolarity atthe onset of dough fermentation. Genes involved in glycerol ho-meostasis, such as GPD1, GPP1, and STL1, are among the mostupregulated genes in the beginning of fermentation in all 3 strains.Homeostasis of glycerol, the major osmolyte that is produced tobalance intracellular osmolarity in S. cerevisiae, is regulated by thehigh-osmolarity glycerol (HOG) pathway (the major pathway in-volved in the response to osmotic stress) (50, 51).
To investigate if the upregulation of these genes is importantfor efficient dough fermentation, we measured the dough fermen-tation performance of a set of 20 mutants (in the S288c back-ground) carrying deletions of these genes as well as other key genesinvolved in the response to osmotic stress and several other genesthat were highly upregulated at the onset of dough fermentation(see Table S2 in the supplemental material). The results indicatethat deletion of key genes involved in the response to osmoticstress, namely, HOG1, PBS2, GPD1, and GPP1, results in impaireddough fermentation and low activity of the mutants in doughfermentation. However, for the other tested mutants, no signifi-cant effect was observed (Fig. 4A).
To gain further mechanistic insight into how the HOG pathwaycould affect cellular responses during dough fermentation, a minimalcommon subnetwork selection algorithm, PheNetic (44), was ap-plied to the expression data. Briefly, a molecular interaction networkrepresenting the known interactome of yeast was compiled frompublicly available data. This network was used to identify the minimalcommon subnetwork that connects a perturbation to the differen-tially expressed genes through regulatory paths by using PheNetic(see Materials and Methods). The inferred subnetwork identifies theintermediary genes involved in signaling mechanisms, which do notnecessarily show altered expression levels but mediate the cellularresponse in the organism.
As the major changes in osmotic pressure occur when the cellsare inoculated in dough, we used the expression data obtainedafter 30 min of fermentation for this analysis. The minimal com-
mon subnetwork between HOG1, the downstream effector of theHOG pathway, and the 100 most differentially expressed genes foreach analyzed strain at the 30-min time point was generated byusing PheNetic.
The resulting subnetwork consists of 144 genes connected by195 interactions. Of 100 differentially expressed genes, 89 wereselected into the resulting network, which implies that PheNeticselected an additional 55 intermediary genes to connect HOG1 tothe corresponding differentially expressed genes.
Clear enrichments in genes involved in chromatin modifica-tion (GO:16586) with corrected P values of �1e�7 can be found(Fig. 4B). Additionally, the selected network displays enrichmentof genes related to stress response regulation (GO:80134) (P valueof 4e�3), oxoacid metabolism (GO:6114) (P value of 1e�2), andglycerol biosynthesis (GO:6114) (P value of 2e�4). Together, thisanalysis further confirmed the HOG pathway as a central regula-tor of the early response to SSF conditions and identified a massivetranscriptional reprogramming mechanism that may involvechromatin modification.
DISCUSSION
This study is the first to investigate the changes in the yeast transcrip-tome during dough fermentation under the actual conditions en-countered during bread production (solid state). Our results demon-strate that the yeast transcriptome changes dramatically duringdough fermentation. A large number of protein- and RNA-codinggenes are differentially expressed at the early, middle, and late timepoints during dough fermentation. Moreover, although geneticallydifferent strains show slight differences, for example, in the expres-sion levels of genes involved in biosynthesis of vitamins or aminoacids, the three strains induced similar transient changes in their tran-scriptomes, which suggests that the overall response is general regard-less of the genetic background. The fact that the commercial baker’syeast strain induced less-pronounced changes in its transcriptome, interms of both the number of genes and the magnitude of changes,than the two other strains might indicate a higher degree of adapta-tion of this strain for dough fermentation, although this remainsspeculative.
Analysis of the function of the various differentially expressedgenes yields insight into the physiological state of yeast cells as thedough fermentation process progresses. Overall, the cells showeda strong response to changing nutrient levels. At the onset of fer-mentation, the upregulation of ribosome biogenesis (RiBi) genesand the downregulation of genes associated with resistance tostress, such as genes involved in trehalose biosynthesis, indicate aresponse to nutrient level and glucose regulation (24–26). Thesechanges at the beginning of the fermentation process, along withthe downregulation of genes involved in the TCA cycle, aerobicrespiration, and oxidative phosphorylation, reflect a shift in thenutrient-depleted stationary-phase cells to active fermentation.
Generally, when faced with low water activity or high osmolar-ity, microbes accumulate different compatible solutes, such asions, amino acids, or polyols, to prevent water loss (52–54). In S.cerevisiae, the response to hyperosmotic stress is regulatedthrough a mitogen-activated protein (MAP) kinase pathway, theHOG pathway, which results in accumulation of glycerol (50, 51).Consistent with this, our analysis shows that genes involved inbiosynthesis of glycerol are among the most strongly upregulatedgenes at the onset of dough fermentation, suggesting that the cellsexperience a rather significant osmotic shock.
Aslankoohi et al.
7330 aem.asm.org Applied and Environmental Microbiology
Dow
nloa
ded
from
http
s://j
ourn
als.
asm
.org
/jour
nal/a
em o
n 21
Dec
embe
r 20
21 b
y 18
0.19
7.13
4.19
8.
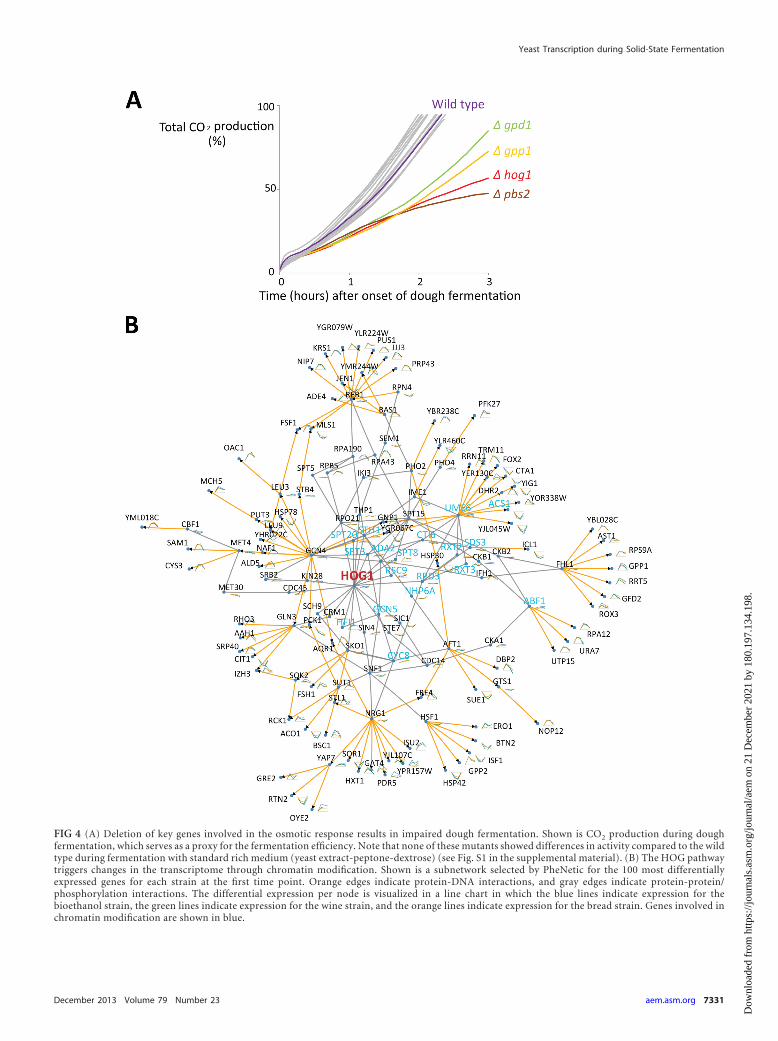
FIG 4 (A) Deletion of key genes involved in the osmotic response results in impaired dough fermentation. Shown is CO2 production during doughfermentation, which serves as a proxy for the fermentation efficiency. Note that none of these mutants showed differences in activity compared to the wildtype during fermentation with standard rich medium (yeast extract-peptone-dextrose) (see Fig. S1 in the supplemental material). (B) The HOG pathwaytriggers changes in the transcriptome through chromatin modification. Shown is a subnetwork selected by PheNetic for the 100 most differentiallyexpressed genes for each strain at the first time point. Orange edges indicate protein-DNA interactions, and gray edges indicate protein-protein/phosphorylation interactions. The differential expression per node is visualized in a line chart in which the blue lines indicate expression for thebioethanol strain, the green lines indicate expression for the wine strain, and the orange lines indicate expression for the bread strain. Genes involved inchromatin modification are shown in blue.
Yeast Transcription during Solid-State Fermentation
December 2013 Volume 79 Number 23 aem.asm.org 7331
Dow
nloa
ded
from
http
s://j
ourn
als.
asm
.org
/jour
nal/a
em o
n 21
Dec
embe
r 20
21 b
y 18
0.19
7.13
4.19
8.
AQR1 was the most upregulated gene in all three strains at theearliest time point. This gene codes for a cell membrane trans-porter that mediates excretion of amino acids under conditions inwhich, despite an abundant availability of carbon, cell growth islimited by a second factor such as the lack of an essential com-pound (55). In bread dough fermentation, osmotic stress is likelyto be the growth-restrictive factor that leads to a striking upregu-lation of AQR1. The observed induction of (retroviral) Ty ele-ments at the beginning of fermentation is more puzzling. Activa-tion of transposable elements in response to stress conditions waspreviously reported for different organisms (56–58). This activa-tion has been proposed to stimulate genetic variability that couldhelp the cell to adapt to environmental changes (59).
The middle fermentation phase is associated with increasedexpression levels of genes involved in amino acid and protein bio-synthesis. These changes indicate induction of cell growth andmay also imply further adaptation to osmotic stress (60, 61). Fi-nally, at the last stage of the fermentation process, cells upregulategenes involved in maltose metabolism, trehalose and glycogenbiosynthesis, autophagy, and protein catabolic processes. To-gether, these changes are indicative of glucose depletion and de-creased nutrient levels during dough fermentation. This observa-tion, together with the upregulation of genes involved in theresponse to heat at the latest time point, indicates a gradient ofnutrients and heat of the fermentation process in the microenvi-ronment surrounding cells as a result of poor diffusion of solutesand low thermal conductivity of the solid substrate.
Apart from genes with known function, it is important to men-tion that a large group of differentially expressed genes encodedputative proteins of unknown functions. This has also been ob-served by other studies of stress conditions (62, 63).
Finally, we show that deletion of key genes or targets of theHOG pathway results in impaired dough fermentation. This isconsistent with previously reported work that showed that muta-tions in central genes of this pathway, namely, PBS2 or HOG1,cause osmosensitivity and accumulation of reduced levels of glyc-erol (64). Moreover, network analysis showed that the HOG path-way plays a central role in transcriptome changes at the onset ofdough fermentation. The enrichment of the genes involved inchromatin modification in the network is consistent with a knownrole of chromatin-modifying enzymes and histone modificationsin the regulation of transcriptional changes in response to envi-ronmental changes and stress (65, 66).
Together, our results indicate that cells embedded in a solidmatrix such as bread dough suffer severe osmotic stress and that aproper induction of the HOG pathway is critical for optimal breaddough fermentation. These results indicate that this pathway andits targets may be good candidates for genetic modification orscreening in order to obtain improved strains for SSF in generaland dough fermentation in particular.
ACKNOWLEDGMENTS
We thank Verstrepen and Courtin laboratory members for their help andsuggestions.
Research in the laboratory of K.J.V. is supported by ERC starting grant241426, the VIB, the EMBO YIP program, HFSP research grant RGP0050/2013, the Fonds voor Wetenschappelijk Onderzoek-Vlaanderen (FWO)(Brussels, Belgium), and the IWT. We specifically acknowledge financialsupport from KU Leuven IDO project IDO/12/011 and from the FWO for
the postdoctoral fellowship of K.V. and E.D. and project funding(G.0544.10N).
REFERENCES1. Pandey A. 1992. Recent process developments in solid-state fermenta-
tion. Process Biochem. 27:109 –117.2. Pandey A, Soccol CR, Rodriguez-Leon J, Nigam P. 2001. Solid-state
fermentation in biotechnology: fundamentals and applications, 1st ed.Asiatech Publishers, New Delhi, India.
3. Pandey A, Selvakumar P, Soccol CR, Nigam P. 1999. Solid state fermen-tation for the production of industrial enzymes. Curr. Sci. 77:149 –162.
4. Selvakumar P, Ashakumary L, Pandey A. 1998. Biosynthesis of glu-coamylase from Aspergillus niger by solid-state fermentation using teawaste as the basis of a solid substrate. Bioresour. Technol. 65:83– 85.
5. Cen P, Xia L. 1999. Production of cellulase by solid-state fermentation, p69 –92. In Scheper T, Tsao GT (ed), Recent progress in bioconversion oflignocellulosics. Springer, Berlin, Germany.
6. Singh-Nee Nigam P, Singh D. 1996. Processing of agricultural wastes insolid state fermentation for microbial protein production. J. Sci. Ind. Res.55:373–380.
7. Robinson T, Singh D, Nigam P. 2001. Solid-state fermentation: a prom-ising microbial technology for secondary metabolite production. Appl.Microbiol. Biotechnol. 55:284 –289.
8. Mohanty SK, Behera S, Swain MR, Ray RC. 2009. Bioethanol produc-tion from mahula (Madhuca latifolia L.) flowers by solid-state fermenta-tion. Appl. Energy 86:640 – 644.
9. Rodríguez L, Toro M, Vazquez F, Correa-Daneri M, Gouiric S, VallejoM. 2010. Bioethanol production from grape and sugar beet pomaces bysolid-state fermentation. Int. J. Hydrogen Energy 35:5914 –5917.
10. Mazaheri D, Shojaosadati SA, Mousavi SM, Hejazi P, Saharkhiz S.2012. Bioethanol production from carob pods by solid-state fermentationwith Zymomonas mobilis. Appl. Energy 99:372–378.
11. Hölker U, Höfer M, Lenz J. 2004. Biotechnological advantages of labo-ratory-scale solid-state fermentation with fungi. Appl. Microbiol. Bio-technol. 64:175–186.
12. Pandey A, Soccol CR, Mitchell D. 2000. New developments in solid statefermentation. I. Bioprocesses and products. Process Biochem. 35:1153–1169.
13. Pandey A, Ashakumary L, Selvakumar P, Vijayalakshmi K. 1994. Influ-ence of water activity on growth and activity of Aspergillus niger for gly-coamylase production in solid-state fermentation. World J. Microbiol.Biotechnol. 10:485– 486.
14. López-Calleja A, Cuadra T, Barrios-González J, Fierro F, Fernández F.2012. Solid-state and submerged fermentations show different gene ex-pression profiles in cephalosporin C production by Acremonium chryso-genum. J. Mol. Microbiol. Biotechnol. 22:126 –134.
15. Backhus LE, DeRisi J, Brown PO, Bisson LF. 2001. Functional genomicanalysis of a commercial wine strain of Saccharomyces cerevisiae underdiffering nitrogen conditions. FEMS Yeast Res. 1:111–125.
16. Pérez-Torrado R, Panadero J, Hernández-López MJ, Prieto JA, Randez-Gil F. 2010. Global expression studies in baker’s yeast reveal target genesfor the improvement of industrially-relevant traits: the cases of CAF16 andORC2. Microb. Cell Fact. 9:56. doi:10.1186/1475-2859-9-56.
17. Cholet O, Hénaut A, Casaregola S, Bonnarme P. 2007. Gene expressionand biochemical analysis of cheese-ripening yeasts: focus on catabolism ofL-methionine, lactate, and lactose. Appl. Environ. Microbiol. 73:2561–2570.
18. James T, Campbell S, Donnelly D, Bond U. 2003. Transcription profileof brewery yeast under fermentation conditions. J. Appl. Microbiol. 94:432– 448.
19. Olesen K, Felding T, Gjermansen C, Hansen J. 2002. The dynamics ofthe Saccharomyces carlsbergensis brewing yeast transcriptome during aproduction-scale lager beer fermentation. FEMS Yeast Res. 2:563–573.
20. Marks VD, Merwe GK, Vuuren HJ. 2003. Transcriptional profiling ofwine yeast in fermenting grape juice: regulatory effect of diammoniumphosphate. FEMS Yeast Res. 3:269 –287.
21. Rossignol T, Dulau L, Julien A, Blondin B. 2003. Genome-wide moni-toring of wine yeast gene expression during alcoholic fermentation. Yeast20:1369 –1385.
22. Zuzuarregui A, Olmo M. 2004. Expression of stress response genes inwine strains with different fermentative behavior. FEMS Yeast Res. 4:699 –710.
Aslankoohi et al.
7332 aem.asm.org Applied and Environmental Microbiology
Dow
nloa
ded
from
http
s://j
ourn
als.
asm
.org
/jour
nal/a
em o
n 21
Dec
embe
r 20
21 b
y 18
0.19
7.13
4.19
8.
23. Tanaka F, Ando A, Nakamura T, Takagi H, Shima J. 2006. Functionalgenomic analysis of commercial baker’s yeast during initial stages ofmodel dough-fermentation. Food Microbiol. 23:717–728.
24. Van Dijck P, Colavizza D, Smet P, Thevelein JM. 1995. Differentialimportance of trehalose in stress resistance in fermenting and nonfer-menting Saccharomyces cerevisiae cells. Appl. Environ. Microbiol. 61:109 –115.
25. Versele M, Thevelein JM, Van Dijck P. 2004. The high general stressresistance of the Saccharomyces cerevisiae fil1 adenylate cyclase mutant(Cyr1Lys1682) is only partially dependent on trehalose, Hsp104 and over-expression of Msn2/4-regulated genes. Yeast 21:75– 86.
26. Verstrepen KJ, Iserentant D, Malcorps P, Derdelinckx G, Van Dijck P,Winderickx J, Pretorius IS, Thevelein JM, Delvaux FR. 2004. Glucoseand sucrose: hazardous fast-food for industrial yeast? Trends Biotechnol.22:531–537.
27. Remize F, Cambon B, Barnavon L, Dequin S. 2003. Glycerol formationduring wine fermentation is mainly linked to Gpd1p and is only partiallycontrolled by the HOG pathway. Yeast 20:1243–1253.
28. Legras JL, Karst F. 2003. Optimisation of interdelta analysis for Saccha-romyces cerevisiae strain characterisation. FEMS Microbiol. Lett. 221:249 –255.
29. Abelson JN, Simon MI, Guthrie C, Fink GR (ed). 2004. Guide to yeastgenetics and molecular biology. Elsevier, London, United Kingdom.
30. Amberg DC, Burke DJ, Strathern JN. 2005. Methods in yeast genetics: aCold Spring Harbor Laboratory course manual, 2005 ed. Cold SpringHarbor Laboratory Press, Cold Spring Harbor, NY.
31. Shogren M, Finney K. 1984. Bread-making test for 10 grams of flour.Cereal Chem. 61:418 – 423.
32. Panadero J, Randez-Gil F, Prieto JA. 2005. Validation of a flour-freemodel dough system for throughput studies of baker’s yeast. Appl. Envi-ron. Microbiol. 71:1142–1147.
33. Zhou X, Ren L, Meng Q, Li Y, Yu Y, Yu J. 2010. The next-generationsequencing technology and application. Protein Cell 1:520 –536.
34. Trapnell C, Pachter L, Salzberg SL. 2009. TopHat: discovering splicejunctions with RNA-Seq. Bioinformatics 25:1105–1111.
35. Milne I, Stephen G, Bayer M, Cock PJ, Pritchard L, Cardle L, Shaw PD,Marshall D. 2013. Using Tablet for visual exploration of second-generation sequencing data. Brief. Bioinformatics 14:193–202.
36. Trapnell C, Roberts A, Goff L, Pertea G, Kim D, Kelley DR, PimentelH, Salzberg SL, Rinn JL, Pachter L. 2012. Differential gene and transcriptexpression analysis of RNA-seq experiments with TopHat and Cufflinks.Nat. Protoc. 7:562–578.
37. Liu T, Lin N, Shi N, Zhang B. 2009. Information criterion-based clus-tering with order-restricted candidate profiles in short time-course mi-croarray experiments. BMC Bioinformatics 10:146. doi:10.1186/1471-2105-10-146.
38. Robinson MD, McCarthy DJ, Smyth GK. 2010. edgeR: a Bioconductorpackage for differential expression analysis of digital gene expression data.Bioinformatics 26:139 –140.
39. Dennis G, Jr, Sherman BT, Hosack DA, Yang J, Gao W, Lane HC,Lempicki RA. 2003. DAVID: database for annotation, visualization, andintegrated discovery. Genome Biol. 4:P3. doi:10.1186/gb-2003-4-5-p3.
40. Voordeckers K, De Maeyer D, Zande E, Vinces MD, Meert W, ClootsL, Ryan O, Marchal K, Verstrepen KJ. 2012. Identification of a complexgenetic network underlying Saccharomyces cerevisiae colony morphol-ogy. Mol. Microbiol. 86:225–239.
41. Yeang C-H, Ideker T, Jaakkola T. 2004. Physical network models. J.Comput. Biol. 11:243–262.
42. Yeger-Lotem E, Riva L, Su LJ, Gitler AD, Cashikar AG, King OD,Auluck PK, Geddie ML, Valastyan JS, Karger DR. 2009. Bridging high-throughput genetic and transcriptional data reveals cellular responses toalpha-synuclein toxicity. Nat. Genet. 41:316 –323.
43. Pu S, Wong J, Turner B, Cho E, Wodak SJ. 2009. Up-to-date cataloguesof yeast protein complexes. Nucleic Acids Res. 37:825– 831.
44. De Maeyer D, Renkens J, Cloots L, De Raedt L, Marchal K. 2013.PheNetic: network-based interpretation of unstructured gene lists in E.coli. Mol. Biosyst. 9:1594 –1603.
45. Smoot ME, Ono K, Ruscheinski J, Wang P-L, Ideker T. 2011. Cytoscape2.8: new features for data integration and network visualization. Bioinfor-matics 27:431– 432.
46. Bindea G, Mlecnik B, Hackl H, Charoentong P, Tosolini M, KirilovskyA, Fridman W-H, Pagès F, Trajanoski Z, Galon J. 2009. ClueGO: aCytoscape plug-in to decipher functionally grouped gene ontology andpathway annotation networks. Bioinformatics 25:1091–1093.
47. Maere S, Heymans K, Kuiper M. 2005. BiNGO: a Cytoscape plugin toassess overrepresentation of gene ontology categories in biological net-works. Bioinformatics 21:3448 –3449.
48. Benjamini Y, Hochberg Y. 1995. Controlling the false discovery rate: apractical and powerful approach to multiple testing. J. R. Stat. Soc. B Stat.Methodol. 57:289 –300.
49. Ashburner M, Ball CA, Blake JA, Botstein D, Butler H, Cherry JM,Davis AP, Dolinski K, Dwight SS, Eppig JT. 2000. Gene ontology: toolfor the unification of biology. Nat. Genet. 25:25–29.
50. Gustin MC, Albertyn J, Alexander M, Davenport K. 1998. MAP kinasepathways in the yeast Saccharomyces cerevisiae. Microbiol. Mol. Biol. Rev.62:1264 –1300.
51. Hohmann S. 2002. Osmotic stress signaling and osmoadaptation inyeasts. Microbiol. Mol. Biol. Rev. 66:300 –372.
52. Welsh DT. 2000. Ecological significance of compatible solute accumula-tion by micro-organisms: from single cells to global climate. FEMS Micro-biol. Rev. 24:263–290.
53. Ruijter GJ, Visser J, Rinzema A. 2004. Polyol accumulation by Aspergil-lus oryzae at low water activity in solid-state fermentation. Microbiology150:1095–1101.
54. Kets E, Teunissen P, De Bont J. 1996. Effect of compatible solutes onsurvival of lactic acid bacteria subjected to drying. Appl. Environ. Micro-biol. 62:259 –261.
55. Velasco I, Tenreiro S, Calderon IL, André B. 2004. Saccharomycescerevisiae Aqr1 is an internal-membrane transporter involved in excretionof amino acids. Eukaryot. Cell 3:1492–1503.
56. Grandbastien M-A, Audeon C, Bonnivard E, Casacuberta J, ChalhoubB, Costa A-P, Le Q, Melayah D, Petit M, Poncet C. 2005. Stressactivation and genomic impact of Tnt1 retrotransposons in Solanaceae.Cytogenet. Genome Res. 110:229 –241.
57. Lesage P, Todeschini A. 2005. Happy together: the life and times of Tyretrotransposons and their hosts. Cytogenet. Genome Res. 110:70 –90.
58. Oliver KR, Greene WK. 2009. Transposable elements: powerful facilita-tors of evolution. Bioessays 31:703–714.
59. McClintock B. 1984. The significance of responses of the genome to chal-lenge. Science 226:792– 801.
60. Uesono Y, Toh-e A. 2002. Transient inhibition of translation initiation byosmotic stress. J. Biol. Chem. 277:13848 –13855.
61. Rep M, Krantz M, Thevelein JM, Hohmann S. 2000. The transcriptionalresponse of Saccharomyces cerevisiae to osmotic shock: Hot1p andMsn2p/Msn4p are required for the induction of subsets of high osmolarityglycerol pathway-dependent genes. J. Biol. Chem. 275:8290 – 8300.
62. Alexandre H, Ansanay-Galeote V, Dequin S, Blondin B. 2001. Globalgene expression during short-term ethanol stress in Saccharomycescerevisiae. FEBS Lett. 498:98 –103.
63. Gasch AP, Spellman PT, Kao CM, Carmel-Harel O, Eisen MB, Storz G,Botstein D, Brown PO. 2000. Genomic expression programs in the re-sponse of yeast cells to environmental changes. Mol. Biol. Cell 11:4241.
64. Brewster JL, de Valoir T, Dwyer ND, Winter E, Gustin MC. 1993. Anosmosensing signal transduction pathway in yeast. Science 259:1760 –1763.
65. Alejandro-Osorio AL, Huebert DJ, Porcaro DT, Sonntag ME, Nill-asithanukroh S, Will JL, Gasch AP. 2009. The histone deacetylase Rpd3pis required for transient changes in genomic expression in response tostress. Genome Biol. 10:R57. doi:10.1186/gb-2009-10-5-r57.
66. Shivaswamy S, Iyer VR. 2008. Stress-dependent dynamics of global chro-matin remodeling in yeast: dual role for SWI/SNF in the heat shock stressresponse. Mol. Cell. Biol. 28:2221–2234.
Yeast Transcription during Solid-State Fermentation
December 2013 Volume 79 Number 23 aem.asm.org 7333
Dow
nloa
ded
from
http
s://j
ourn
als.
asm
.org
/jour
nal/a
em o
n 21
Dec
embe
r 20
21 b
y 18
0.19
7.13
4.19
8.