Embed Size (px)
Citation preview
Durham Research Online
Deposited in DRO:
09 March 2016
Version of attached �le:
Published Version
Peer-review status of attached �le:
Peer-reviewed
Citation for published item:
Martiniano, Rui and Ca�ell, Anwen and Holst, Malin and Hunter-Mann, Kurt and Montgomery, Janet andM�uldner, Gundula and McLaughlin, Russell L. and Teasdale, Matthew D. and van Rheenen, Wouter andVeldink, Jan H. and van den Berg, Leonard H. and Hardiman, Orla and Carroll, Maureen and Roskams, Steveand Oxley, John and Morgan, Colleen and Thomas, Mark G. and Barnes, Ian and McDonnell, Christine andCollins, Matthew J. and Bradley, Daniel G. (2016) 'Genomic signals of migration and continuity in Britainbefore the Anglo-Saxons.', Nature communications., 7 . p. 10326.
Further information on publisher's website:
http://dx.doi.org/10.1038/ncomms10326
Publisher's copyright statement:
Additional information:
Use policy
The full-text may be used and/or reproduced, and given to third parties in any format or medium, without prior permission or charge, forpersonal research or study, educational, or not-for-pro�t purposes provided that:
• a full bibliographic reference is made to the original source
• a link is made to the metadata record in DRO
• the full-text is not changed in any way
The full-text must not be sold in any format or medium without the formal permission of the copyright holders.
Please consult the full DRO policy for further details.
Durham University Library, Stockton Road, Durham DH1 3LY, United KingdomTel : +44 (0)191 334 3042 | Fax : +44 (0)191 334 2971
http://dro.dur.ac.uk
ARTICLE
Received 6 Jul 2015 | Accepted 25 Nov 2015 | Published 19 Jan 2016
Genomic signals of migration and continuityin Britain before the Anglo-SaxonsRui Martiniano1, Anwen Caffell2,3, Malin Holst2,4, Kurt Hunter-Mann5, Janet Montgomery3, Gundula Muldner6,
Russell L. McLaughlin1, Matthew D. Teasdale1, Wouter van Rheenen7, Jan H. Veldink7, Leonard H. van den Berg7,
Orla Hardiman8, Maureen Carroll9, Steve Roskams4, John Oxley10, Colleen Morgan4, Mark G. Thomas11,
Ian Barnes12, Christine McDonnell5, Matthew J. Collins4 & Daniel G. Bradley1
The purported migrations that have formed the peoples of Britain have been the focus of
generations of scholarly controversy. However, this has not benefited from direct analyses of
ancient genomes. Here we report nine ancient genomes (B1� ) of individuals from northern
Britain: seven from a Roman era York cemetery, bookended by earlier Iron-Age and later
Anglo-Saxon burials. Six of the Roman genomes show affinity with modern British Celtic
populations, particularly Welsh, but significantly diverge from populations from Yorkshire and
other eastern English samples. They also show similarity with the earlier Iron-Age genome,
suggesting population continuity, but differ from the later Anglo-Saxon genome. This pattern
concords with profound impact of migrations in the Anglo-Saxon period. Strikingly, one
Roman skeleton shows a clear signal of exogenous origin, with affinities pointing towards the
Middle East, confirming the cosmopolitan character of the Empire, even at its northernmost
fringes.
DOI: 10.1038/ncomms10326 OPEN
1 Smurfit Institute of Genetics, School of Genetics and Microbiology, Trinity College Dublin, Dublin 2, Ireland. 2 York Osteoarchaeology Ltd, 75 Main Street,Bishop Wilton, York YO42 1SR, UK. 3 Department of Archaeology, Dawson Building, Durham University, South Road, Durham DH1 3LE, UK. 4 BioArCh,Biology, S Block, Wentworth Way, York YO10 5DD, UK. 5 York Archaeological Trust for Excavation and Research Limited, 47 Aldwark, York YO1 7BX, UK.6 Department of Archaeology, University of Reading, Whiteknights PO Box 227, Reading RG6 6AB, UK. 7 Department of Neurology and Neurosurgery, BrainCenter Rudolf Magnus, University Medical Center Utrecht, Heidelberglaan 100, 3584 CX Utrecht, The Netherlands. 8 Academic Unit of Neurology, TrinityBiomedical Sciences Institute, Trinity College Dublin, Pearse Street, Dublin 2, Ireland. 9 Department of Archaeology, University of Sheffield Northgate House,West Street, Sheffield S1 4ET, UK. 10 City of York Council, York YO1 6GA, UK. 11 Research Department of Genetics, Evolution and Environment, UniversityCollege London, Gower Street, London WC1E 6BT, UK. 12 Department of Earth Sciences, Natural History Museum, Cromwell Road, London SW7 5BD, UK.Correspondence and requests for materials should be addressed to M.J.C. (email: [email protected]) or to D.G.B. (email: [email protected]).
NATURE COMMUNICATIONS | 7:10326 | DOI: 10.1038/ncomms10326 | www.nature.com/naturecommunications 1
Ancient genomics has the power to anchor the emergenceof modern genetic patterns to archaeological events but,to date, no such genome-scale data have emerged for the
Romano-British world, or indeed from any era in the British past.Extensive surveying of modern genomic variation in the BritishIsles has produced divergent interpretations of the migratoryhistory of the islands. An east–west gradient of Y chromosome,autosomal and mtDNA allele frequencies has been interpreted asreflecting the genetic legacy of substantial Anglo-Saxon invasionsfollowing the Roman period1–4. However, it is difficult todistinguish the effects of this much-debated event from othermigratory influences from northwest continental Europe, whetherthese are, for example, Germanic elements in the Late Romanarmy predating the Anglo-Saxon migrations or Scandinaviansettlers arriving some centuries afterwards5.
At its maximum, the Roman Empire stretched from AtlanticEurope to the Near East and from Northern Britain to the Sahara,incorporating an advanced transport infrastructure, which wouldhave enabled previously unprecedented levels of mobility6.Evidence for the presence of foreigners in Britain has beenbased on epigraphic sources, material culture and, more recently,bioarchaeological (isotopic) data7–9. However, there is no way ofknowing how representative the people mentioned in inscriptionsmight be; artefactual imports indicate contact beyond theprovince but may not point to movement of people; andisotopic baseline values in British data overlap considerablywith numerous other regions, including much of WesternEurope and the Mediterranean littoral10. Thus, measuring whomoved about the Roman Empire, and on what scale, remainschallenging.
To investigate the genetic identity of Britain in late BC and theearly centuries AD we report shotgun genomic sequencing of ninehuman genomes to coverage depth of B1� and analysis of thesein the context of extensive genome-wide data from modernpopulations. Seven ancient genomes are sampled from a cemeteryin Roman York dated between the second and the fourth centuryAD, one from an earlier Yorkshire Iron-Age burial (210 BC–40 AD)and one from a later neighbouring Anglo-Saxon burial(650–910 AD).
ResultsArchaeological samples. York (Eboracum), founded c. AD 71,became the Roman empire’s northernmost provincial capital inabout AD 200. Its southwest approach road was lined withtombstones and mausolea11 and excavations conducted therebetween 2004 and 2005 at Driffield Terrace revealed a cemeterydating from the second to the fourth century AD with a highincidence of decapitated remains12. After initial screening of eightindividuals chosen for DNA extraction, seven presented superiorendogenous DNA content. Near Melton, East Yorkshire, a firstcentury AD late Iron-Age settlement gave human remainspredominantly of adult females and non-adults13 from whichfive individuals were sampled. From these, the best preservedindividual with known date was M1489 (between 210 BC
and 40 AD). Norton Bishopsmill, dates to 650–910 AD and was aChristian Anglo-Saxon cemetery excavated in the village ofNorton, Teesside, northeast England14. We sampled 3 individualsfrom burials of 100 skeletons and selected the best preserved,NO3423, for the present study (Supplementary Notes 1 and 2 andSupplementary Fig. 1).
Sequencing results and sample contamination. Gamba et al.15
established that the dense internal centre of the inner ear petrousbone is an excellent source of preserved ancient DNA suitable forhigh-throughput sequencing. Accordingly, we sampled single
petrous bones, extracted DNA and made indexed Illuminasequencing libraries. After preliminary screening for endogenouscontent, nine samples were chosen for genome-level sequencing.On alignment to the human reference genome, reads showedmismatch patterns typical of archaeological DNA indicatingdeamination damage (Supplementary Fig. 6). Contaminationestimated from both mtDNA heterozygosity (1.82±0.47%) andX-chromosome contamination in male samples (0.79±0.21%)was low (Supplementary Note 2 and Supplementary Tables 5–7).
Sex determination and uniparental marker analysis. Using theratio between sequencing reads aligned to the X and Y chromo-somes16, it was possible to assign biological sex to each individual,confirming skeletal assessments: the Anglo-Saxon and eachRoman-period sample were male, whereas the Iron-Age samplewas female (Supplementary Fig. 7). Mitochondrial genomes wereretrieved for each sample with between 39� and 98� coverageand were assigned to known haplogroups (Table 1), which arecommon in present-day European populations17. Y-chromosomehaplogroups were determined for each male (Table 1): themajority (6/7) of Driffield Terrace samples belong to sub-lineagesof R1b-L52/L11, which reaches its highest frequencies (470%) inWestern European countries18. Sample 3DRIF-26, on the otherhand, despite belonging to the same burial context, presented alineage consistent with haplogroup J2-L228, which has a moderndistribution centred on the Middle East, but which is also presentin the Caucasus region, the Balkans and Italy19. The Anglo-Saxon(NO3423) sample was assigned to haplogroup I1-S107, which iswidespread in Nordic countries20.
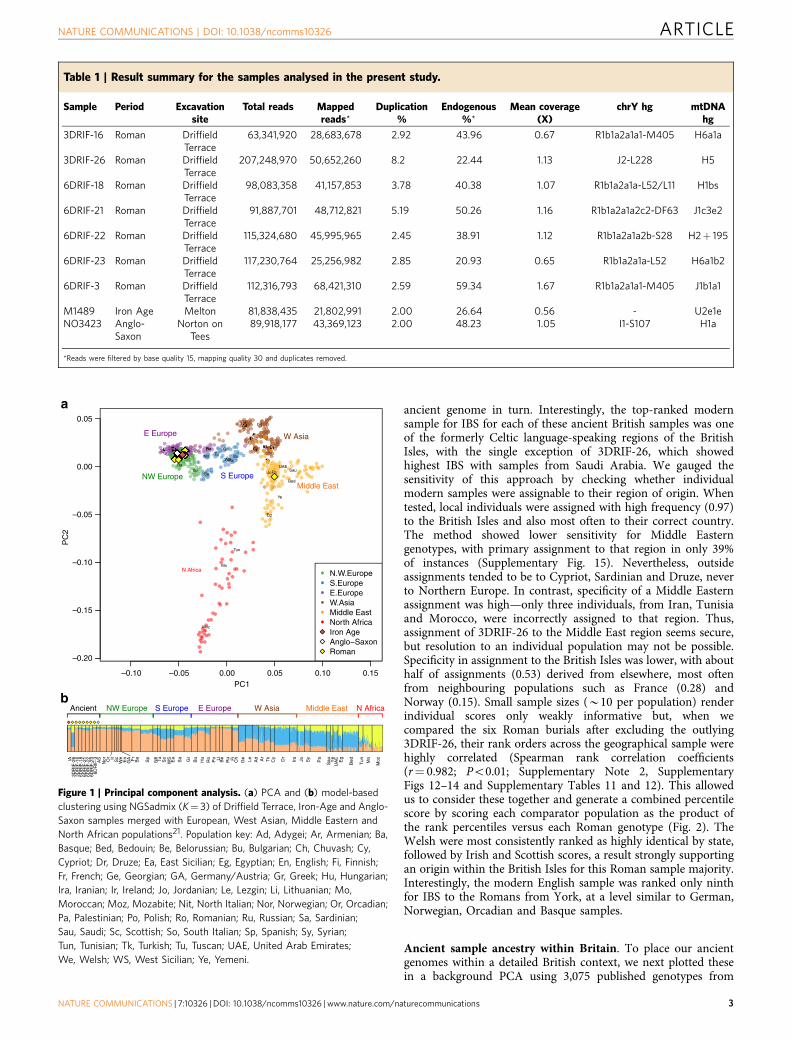
Affinity with global populations. We called between B210 andB400 thousand single-nucleotide polymorphisms (SNPs) withinour ancient samples that had previously been genotyped in a dataset of 780 European, West Asian, North African and MiddleEastern individuals21. Figure 1a shows a principal componentanalysis (PCA) where eight of nine ancient genomes cluster closeto a collection of northwest European samples. One York Roman3DRIF-26 gives a clear Middle Eastern signal, with closestneighbours of Palestinian, Jordanian and Syrian origin. Thisdichotomy is also apparent in maximum likelihood estimation ofindividual ancestries using NGSadmix (Fig. 1b). In this, when amodel of three ancestral populations is imposed across the entiresample, this analysis highlights three major geographicalfoci: Europe; North Africa; and West Asia/Middle East. TheEuropean ancestral component predominates in the majority ofancient samples (which show similar profiles to modernnorthwestern Europeans), whereas 3DRIF-26 again shows amajority West Asian/Middle Eastern component. Isotopicanalyses of the skeletons support this genetic differentiation of3DRIF-26 from the remainder of the individuals sampled.Strontium isotope ratios (87Sr/86Sr) vary mainly according togeological substrate, while oxygen isotope values (q18O), whichtrack locally available drinking water, reflect climatic andgeographic variables such as temperature, rainfall levels ordistance from the coast22. When we compared these ratios inour seven samples with other British Romans, 3DRIF-26 showedboth an unusually low 87Sr/86Sr ratio and an extreme q18Op value(Supplementary Fig. 2).
To maximize resolution of genetic affinity, for each ancientsample we performed pairwise comparisons with each modernsample and calculated the proportion of SNP positions at whichthese were identical by state (IBS). Only single-SNP alleles wereconsidered at each locus and were randomly sampled from thebiallelic genotype. Taking the median IBS score for each modernpopulation sample, we then ranked these for similarity to each
ARTICLE NATURE COMMUNICATIONS | DOI: 10.1038/ncomms10326
2 NATURE COMMUNICATIONS | 7:10326 | DOI: 10.1038/ncomms10326 | www.nature.com/naturecommunications
ancient genome in turn. Interestingly, the top-ranked modernsample for IBS for each of these ancient British samples was oneof the formerly Celtic language-speaking regions of the BritishIsles, with the single exception of 3DRIF-26, which showedhighest IBS with samples from Saudi Arabia. We gauged thesensitivity of this approach by checking whether individualmodern samples were assignable to their region of origin. Whentested, local individuals were assigned with high frequency (0.97)to the British Isles and also most often to their correct country.The method showed lower sensitivity for Middle Easterngenotypes, with primary assignment to that region in only 39%of instances (Supplementary Fig. 15). Nevertheless, outsideassignments tended to be to Cypriot, Sardinian and Druze, neverto Northern Europe. In contrast, specificity of a Middle Easternassignment was high—only three individuals, from Iran, Tunisiaand Morocco, were incorrectly assigned to that region. Thus,assignment of 3DRIF-26 to the Middle East region seems secure,but resolution to an individual population may not be possible.Specificity in assignment to the British Isles was lower, with abouthalf of assignments (0.53) derived from elsewhere, most oftenfrom neighbouring populations such as France (0.28) andNorway (0.15). Small sample sizes (B10 per population) renderindividual scores only weakly informative but, when wecompared the six Roman burials after excluding the outlying3DRIF-26, their rank orders across the geographical sample werehighly correlated (Spearman rank correlation coefficients(r¼ 0.982; Po0.01; Supplementary Note 2, SupplementaryFigs 12–14 and Supplementary Tables 11 and 12). This allowedus to consider these together and generate a combined percentilescore by scoring each comparator population as the product ofthe rank percentiles versus each Roman genotype (Fig. 2). TheWelsh were most consistently ranked as highly identical by state,followed by Irish and Scottish scores, a result strongly supportingan origin within the British Isles for this Roman sample majority.Interestingly, the modern English sample was ranked only ninthfor IBS to the Romans from York, at a level similar to German,Norwegian, Orcadian and Basque samples.
Ancient sample ancestry within Britain. To place our ancientgenomes within a detailed British context, we next plotted thesein a background PCA using 3,075 published genotypes from
Table 1 | Result summary for the samples analysed in the present study.
Sample Period Excavationsite
Total reads Mappedreads*
Duplication%
Endogenous%*
Mean coverage(X)
chrY hg mtDNAhg
3DRIF-16 Roman DriffieldTerrace
63,341,920 28,683,678 2.92 43.96 0.67 R1b1a2a1a1-M405 H6a1a
3DRIF-26 Roman DriffieldTerrace
207,248,970 50,652,260 8.2 22.44 1.13 J2-L228 H5
6DRIF-18 Roman DriffieldTerrace
98,083,358 41,157,853 3.78 40.38 1.07 R1b1a2a1a-L52/L11 H1bs
6DRIF-21 Roman DriffieldTerrace
91,887,701 48,712,821 5.19 50.26 1.16 R1b1a2a1a2c2-DF63 J1c3e2
6DRIF-22 Roman DriffieldTerrace
115,324,680 45,995,965 2.45 38.91 1.12 R1b1a2a1a2b-S28 H2þ 195
6DRIF-23 Roman DriffieldTerrace
117,230,764 25,256,982 2.85 20.93 0.65 R1b1a2a1a-L52 H6a1b2
6DRIF-3 Roman DriffieldTerrace
112,316,793 68,421,310 2.59 59.34 1.67 R1b1a2a1a1-M405 J1b1a1
M1489 Iron Age Melton 81,838,435 21,802,991 2.00 26.64 0.56 - U2e1eNO3423 Anglo-
SaxonNorton on
Tees89,918,177 43,369,123 2.00 48.23 1.05 I1-S107 H1a
*Reads were filtered by base quality 15, mapping quality 30 and duplicates removed.
NW Europe S Europe E Europe W Asia Middle East N AfricaAncient
IA3D
RIF
-26
3DR
IF-1
66D
RIF
-18
6DR
IF-2
16D
RIF
-22
6DR
IF-2
36D
RIF
-3 AS
Nor O
r Ir Sc
We
En
GA Fr
Ba
Sp
NIt
Tu
So
WS Ea
Sa Gr
Bu
Hu
Ro
Po Li Be
Ru Fi
Ch
Ge Le Ad Ar
Tk
Cy Dr
Ira Jo Sy
Pa
Sau Y
eU
AE Eg
Bed
Tun M
o
Moz
PC1
PC
2
Ad
Ar
Ba
Bed
Be BuCh Cy Dr
Ea
Eg
FiFr
Ge
GAGrHu
Ira
Ir
Jo
Le
Li
Mo
Moz
NItNorOr
Pa
Po RoRu
SaSau
ScSo
Sp
Sy
Tun
Tk
Tu
UAE
We
WS
Ye
N.W.EuropeS.EuropeE.EuropeW.AsiaMiddle EastNorth AfricaIron AgeAnglo−SaxonRoman
E Europe
NW Europe
N Africa
Middle East
W Asia
S Europe
0.05
0.00
–0.05
–0.10
–0.10
–0.15
–0.05 0.00 0.05 0.10 0.15
–0.20
Figure 1 | Principal component analysis. (a) PCA and (b) model-based
clustering using NGSadmix (K¼ 3) of Driffield Terrace, Iron-Age and Anglo-
Saxon samples merged with European, West Asian, Middle Eastern and
North African populations21. Population key: Ad, Adygei; Ar, Armenian; Ba,
Basque; Bed, Bedouin; Be, Belorussian; Bu, Bulgarian; Ch, Chuvash; Cy,
Cypriot; Dr, Druze; Ea, East Sicilian; Eg, Egyptian; En, English; Fi, Finnish;
Fr, French; Ge, Georgian; GA, Germany/Austria; Gr, Greek; Hu, Hungarian;
Ira, Iranian; Ir, Ireland; Jo, Jordanian; Le, Lezgin; Li, Lithuanian; Mo,
Moroccan; Moz, Mozabite; Nit, North Italian; Nor, Norwegian; Or, Orcadian;
Pa, Palestinian; Po, Polish; Ro, Romanian; Ru, Russian; Sa, Sardinian;
Sau, Saudi; Sc, Scottish; So, South Italian; Sp, Spanish; Sy, Syrian;
Tun, Tunisian; Tk, Turkish; Tu, Tuscan; UAE, United Arab Emirates;
We, Welsh; WS, West Sicilian; Ye, Yemeni.
NATURE COMMUNICATIONS | DOI: 10.1038/ncomms10326 ARTICLE
NATURE COMMUNICATIONS | 7:10326 | DOI: 10.1038/ncomms10326 | www.nature.com/naturecommunications 3
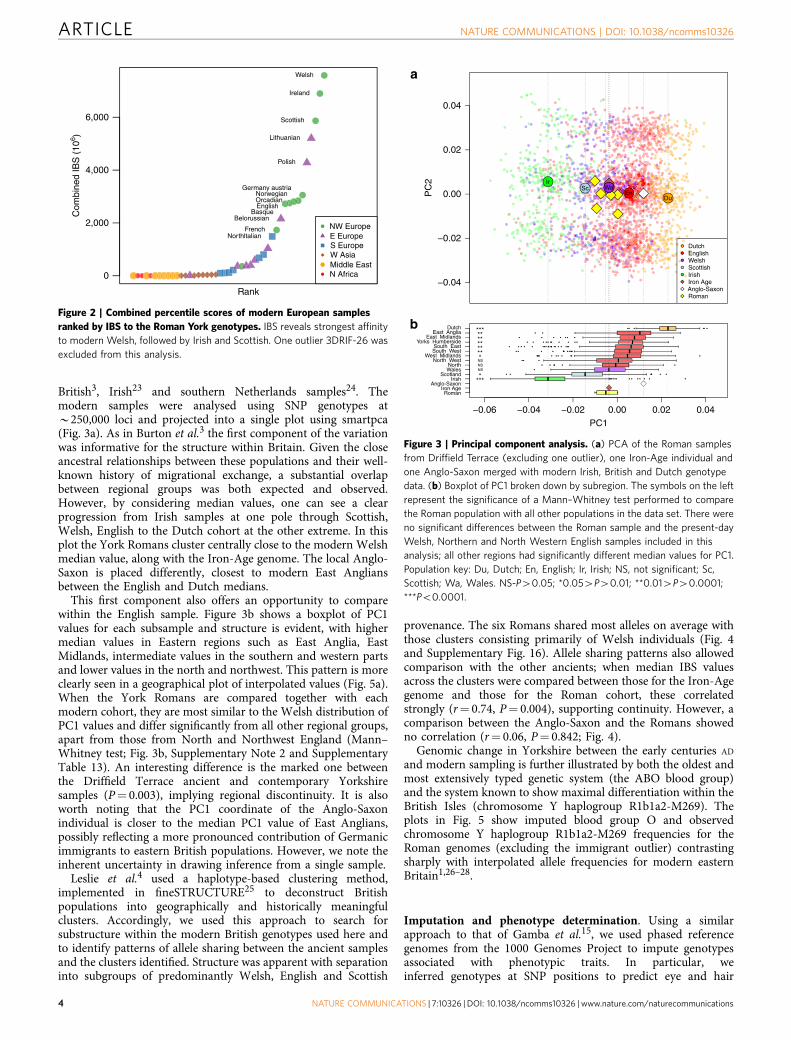
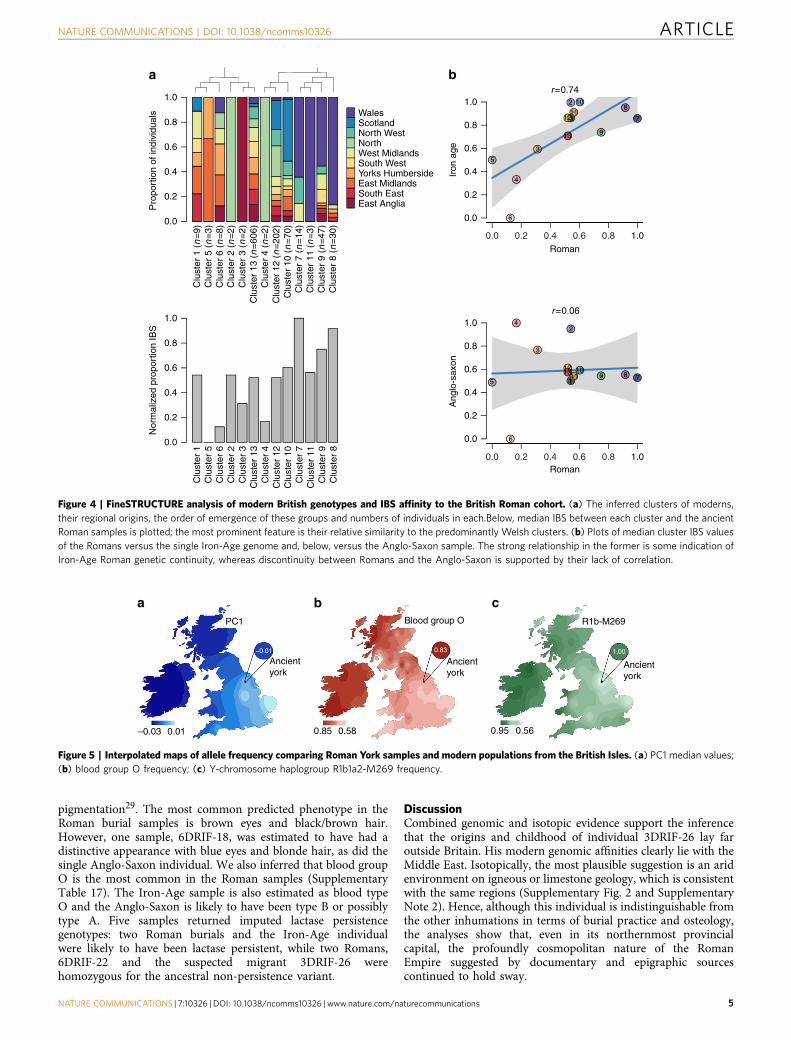
British3, Irish23 and southern Netherlands samples24. Themodern samples were analysed using SNP genotypes atB250,000 loci and projected into a single plot using smartpca(Fig. 3a). As in Burton et al.3 the first component of the variationwas informative for the structure within Britain. Given the closeancestral relationships between these populations and their well-known history of migrational exchange, a substantial overlapbetween regional groups was both expected and observed.However, by considering median values, one can see a clearprogression from Irish samples at one pole through Scottish,Welsh, English to the Dutch cohort at the other extreme. In thisplot the York Romans cluster centrally close to the modern Welshmedian value, along with the Iron-Age genome. The local Anglo-Saxon is placed differently, closest to modern East Angliansbetween the English and Dutch medians.
This first component also offers an opportunity to comparewithin the English sample. Figure 3b shows a boxplot of PC1values for each subsample and structure is evident, with highermedian values in Eastern regions such as East Anglia, EastMidlands, intermediate values in the southern and western partsand lower values in the north and northwest. This pattern is moreclearly seen in a geographical plot of interpolated values (Fig. 5a).When the York Romans are compared together with eachmodern cohort, they are most similar to the Welsh distribution ofPC1 values and differ significantly from all other regional groups,apart from those from North and Northwest England (Mann–Whitney test; Fig. 3b, Supplementary Note 2 and SupplementaryTable 13). An interesting difference is the marked one betweenthe Driffield Terrace ancient and contemporary Yorkshiresamples (P¼ 0.003), implying regional discontinuity. It is alsoworth noting that the PC1 coordinate of the Anglo-Saxonindividual is closer to the median PC1 value of East Anglians,possibly reflecting a more pronounced contribution of Germanicimmigrants to eastern British populations. However, we note theinherent uncertainty in drawing inference from a single sample.
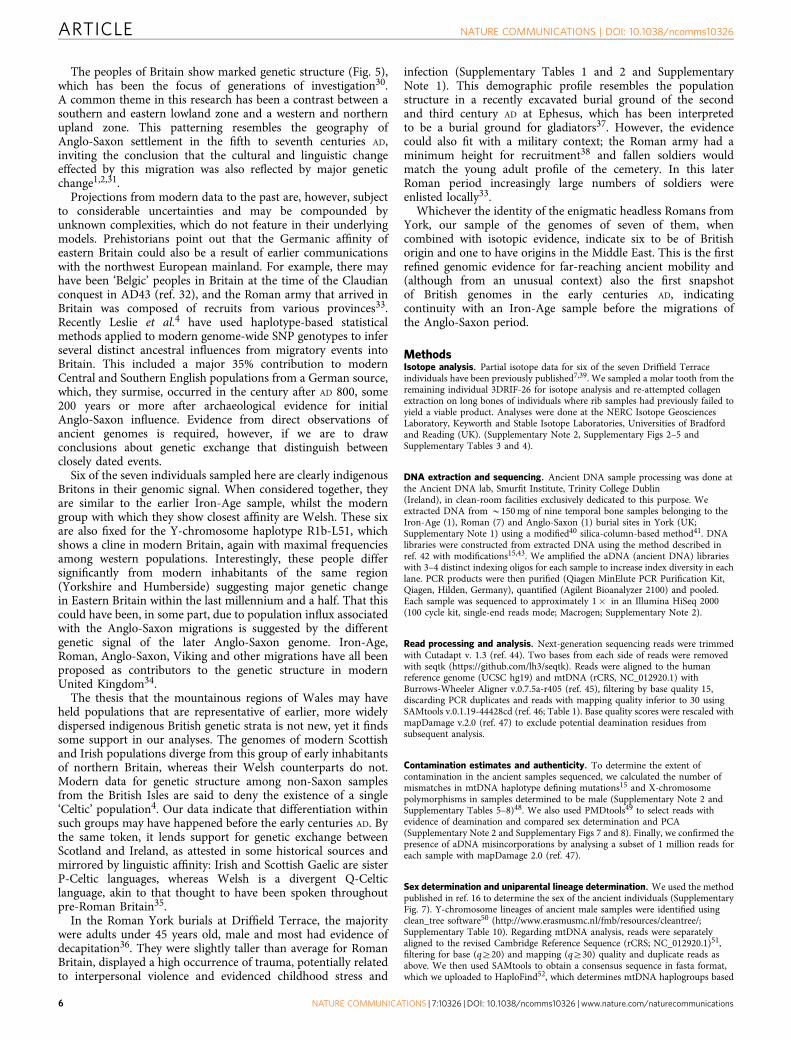
Leslie et al.4 used a haplotype-based clustering method,implemented in fineSTRUCTURE25 to deconstruct Britishpopulations into geographically and historically meaningfulclusters. Accordingly, we used this approach to search forsubstructure within the modern British genotypes used here andto identify patterns of allele sharing between the ancient samplesand the clusters identified. Structure was apparent with separationinto subgroups of predominantly Welsh, English and Scottish
provenance. The six Romans shared most alleles on average withthose clusters consisting primarily of Welsh individuals (Fig. 4and Supplementary Fig. 16). Allele sharing patterns also allowedcomparison with the other ancients; when median IBS valuesacross the clusters were compared between those for the Iron-Agegenome and those for the Roman cohort, these correlatedstrongly (r¼ 0.74, P¼ 0.004), supporting continuity. However, acomparison between the Anglo-Saxon and the Romans showedno correlation (r¼ 0.06, P¼ 0.842; Fig. 4).
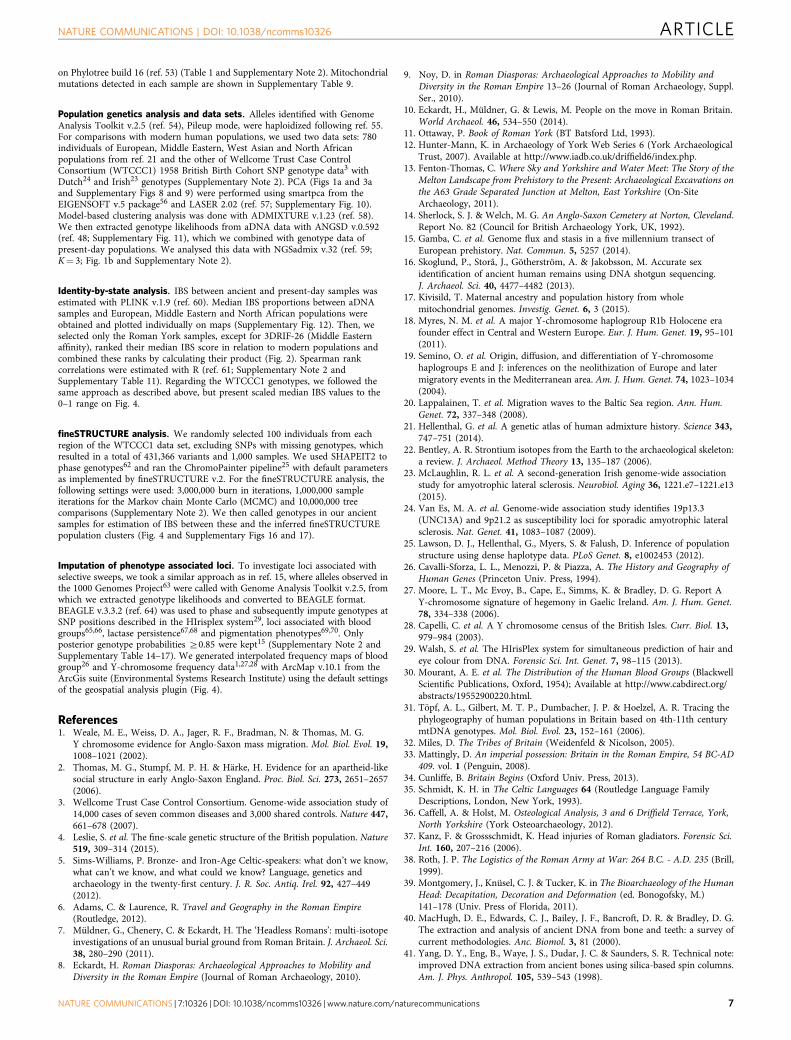
Genomic change in Yorkshire between the early centuries AD
and modern sampling is further illustrated by both the oldest andmost extensively typed genetic system (the ABO blood group)and the system known to show maximal differentiation within theBritish Isles (chromosome Y haplogroup R1b1a2-M269). Theplots in Fig. 5 show imputed blood group O and observedchromosome Y haplogroup R1b1a2-M269 frequencies for theRoman genomes (excluding the immigrant outlier) contrastingsharply with interpolated allele frequencies for modern easternBritain1,26–28.
Imputation and phenotype determination. Using a similarapproach to that of Gamba et al.15, we used phased referencegenomes from the 1000 Genomes Project to impute genotypesassociated with phenotypic traits. In particular, weinferred genotypes at SNP positions to predict eye and hair
RomanIron Age
Anglo-SaxonIrish
ScotlandWalesNorth
North WestWest Midlands
South WestSouth East
Yorks HumbersideEast Midlands
East AngliaDutch
−0.06 −0.04 −0.02 0.00 0.02 0.04PC1
***
***
**********
*
*
NSNSNS
−0.04
−0.02
0.00
0.02
0.04
DutchEnglishWelshScottishIrishIron AgeAnglo-SaxonRoman
DuEn
IrSc Wa
a
b
PC
2
Figure 3 | Principal component analysis. (a) PCA of the Roman samples
from Driffield Terrace (excluding one outlier), one Iron-Age individual and
one Anglo-Saxon merged with modern Irish, British and Dutch genotype
data. (b) Boxplot of PC1 broken down by subregion. The symbols on the left
represent the significance of a Mann–Whitney test performed to compare
the Roman population with all other populations in the data set. There were
no significant differences between the Roman sample and the present-day
Welsh, Northern and North Western English samples included in this
analysis; all other regions had significantly different median values for PC1.
Population key: Du, Dutch; En, English; Ir, Irish; NS, not significant; Sc,
Scottish; Wa, Wales. NS-P40.05; *0.054P40.01; **0.014P40.0001;
***Po0.0001.
Rank
6,000
4,000
2,000
0
Com
bine
d IB
S (
106 )
Welsh
Ireland
Scottish
Lithuanian
Polish
Germany austriaNorwegianOrcadianEnglish
BasqueBelorussian
FrenchNorthltalian
NW EuropeE EuropeS EuropeW AsiaMiddle EastN Africa
Figure 2 | Combined percentile scores of modern European samples
ranked by IBS to the Roman York genotypes. IBS reveals strongest affinity
to modern Welsh, followed by Irish and Scottish. One outlier 3DRIF-26 was
excluded from this analysis.
ARTICLE NATURE COMMUNICATIONS | DOI: 10.1038/ncomms10326
4 NATURE COMMUNICATIONS | 7:10326 | DOI: 10.1038/ncomms10326 | www.nature.com/naturecommunications
pigmentation29. The most common predicted phenotype in theRoman burial samples is brown eyes and black/brown hair.However, one sample, 6DRIF-18, was estimated to have had adistinctive appearance with blue eyes and blonde hair, as did thesingle Anglo-Saxon individual. We also inferred that blood groupO is the most common in the Roman samples (SupplementaryTable 17). The Iron-Age sample is also estimated as blood typeO and the Anglo-Saxon is likely to have been type B or possiblytype A. Five samples returned imputed lactase persistencegenotypes: two Roman burials and the Iron-Age individualwere likely to have been lactase persistent, while two Romans,6DRIF-22 and the suspected migrant 3DRIF-26 werehomozygous for the ancestral non-persistence variant.
DiscussionCombined genomic and isotopic evidence support the inferencethat the origins and childhood of individual 3DRIF-26 lay faroutside Britain. His modern genomic affinities clearly lie with theMiddle East. Isotopically, the most plausible suggestion is an aridenvironment on igneous or limestone geology, which is consistentwith the same regions (Supplementary Fig. 2 and SupplementaryNote 2). Hence, although this individual is indistinguishable fromthe other inhumations in terms of burial practice and osteology,the analyses show that, even in its northernmost provincialcapital, the profoundly cosmopolitan nature of the RomanEmpire suggested by documentary and epigraphic sourcescontinued to hold sway.
Nor
mal
ized
pro
port
ion
IBS
a
East AngliaSouth EastEast MidlandsYorks HumbersideSouth WestWest MidlandsNorthNorth WestScotlandWales
Pro
port
ion
of in
divi
dual
s
Clu
ster
1 (n
=9)
Clu
ster
5 (n
=3)
Clu
ster
6 (n
=8)
Clu
ster
2 (n
=2)
Clu
ster
3 (n
=2)
Clu
ster
13
(n=
606)
Clu
ster
4 (n
=2)
Clu
ster
12
(n=
202)
Clu
ster
10
(n=
70)
Clu
ster
7 (n
=14
)C
lust
er 1
1 (n
=3)
Clu
ster
9 (n
=47
)C
lust
er 8
(n
=30
)0.0
0.2
0.4
0.6
0.8
1.0
Clu
ster
1C
lust
er 5
Clu
ster
6C
lust
er 2
Clu
ster
3C
lust
er 1
3C
lust
er 4
Clu
ster
12
Clu
ster
10
Clu
ster
7C
lust
er 1
1C
lust
er 9
Clu
ster
8
0.0
0.2
0.4
0.6
0.8
1.0
b
0.0 0.2 0.4 0.6 0.8 1.0
0.0
0.2
0.4
0.6
0.8
1.0
Roman
Iron
age
2
3
4
5
6
7
8
9
10
1112
13
r=0.74
0.0 0.2 0.4 0.6 0.8 1.0
0.0
0.2
0.4
0.6
0.8
1.0
Roman
Ang
lo-s
axon
1
1
2
3
4
5
6
78910
111213
r=0.06
Figure 4 | FineSTRUCTURE analysis of modern British genotypes and IBS affinity to the British Roman cohort. (a) The inferred clusters of moderns,
their regional origins, the order of emergence of these groups and numbers of individuals in each.Below, median IBS between each cluster and the ancient
Roman samples is plotted; the most prominent feature is their relative similarity to the predominantly Welsh clusters. (b) Plots of median cluster IBS values
of the Romans versus the single Iron-Age genome and, below, versus the Anglo-Saxon sample. The strong relationship in the former is some indication of
Iron-Age Roman genetic continuity, whereas discontinuity between Romans and the Anglo-Saxon is supported by their lack of correlation.
PC1
Ancientyork
Ancientyork
Ancientyork
–0.01 0.83 1.00
–0.03 0.01 0.85 0.58 0.95 0.56
Blood group O R1b-M269
a b c
Figure 5 | Interpolated maps of allele frequency comparing Roman York samples and modern populations from the British Isles. (a) PC1 median values;
(b) blood group O frequency; (c) Y-chromosome haplogroup R1b1a2-M269 frequency.
NATURE COMMUNICATIONS | DOI: 10.1038/ncomms10326 ARTICLE
NATURE COMMUNICATIONS | 7:10326 | DOI: 10.1038/ncomms10326 | www.nature.com/naturecommunications 5
The peoples of Britain show marked genetic structure (Fig. 5),which has been the focus of generations of investigation30.A common theme in this research has been a contrast between asouthern and eastern lowland zone and a western and northernupland zone. This patterning resembles the geography ofAnglo-Saxon settlement in the fifth to seventh centuries AD,inviting the conclusion that the cultural and linguistic changeeffected by this migration was also reflected by major geneticchange1,2,31.
Projections from modern data to the past are, however, subjectto considerable uncertainties and may be compounded byunknown complexities, which do not feature in their underlyingmodels. Prehistorians point out that the Germanic affinity ofeastern Britain could also be a result of earlier communicationswith the northwest European mainland. For example, there mayhave been ‘Belgic’ peoples in Britain at the time of the Claudianconquest in AD43 (ref. 32), and the Roman army that arrived inBritain was composed of recruits from various provinces33.Recently Leslie et al.4 have used haplotype-based statisticalmethods applied to modern genome-wide SNP genotypes to inferseveral distinct ancestral influences from migratory events intoBritain. This included a major 35% contribution to modernCentral and Southern English populations from a German source,which, they surmise, occurred in the century after AD 800, some200 years or more after archaeological evidence for initialAnglo-Saxon influence. Evidence from direct observations ofancient genomes is required, however, if we are to drawconclusions about genetic exchange that distinguish betweenclosely dated events.
Six of the seven individuals sampled here are clearly indigenousBritons in their genomic signal. When considered together, theyare similar to the earlier Iron-Age sample, whilst the moderngroup with which they show closest affinity are Welsh. These sixare also fixed for the Y-chromosome haplotype R1b-L51, whichshows a cline in modern Britain, again with maximal frequenciesamong western populations. Interestingly, these people differsignificantly from modern inhabitants of the same region(Yorkshire and Humberside) suggesting major genetic changein Eastern Britain within the last millennium and a half. That thiscould have been, in some part, due to population influx associatedwith the Anglo-Saxon migrations is suggested by the differentgenetic signal of the later Anglo-Saxon genome. Iron-Age,Roman, Anglo-Saxon, Viking and other migrations have all beenproposed as contributors to the genetic structure in modernUnited Kingdom34.
The thesis that the mountainous regions of Wales may haveheld populations that are representative of earlier, more widelydispersed indigenous British genetic strata is not new, yet it findssome support in our analyses. The genomes of modern Scottishand Irish populations diverge from this group of early inhabitantsof northern Britain, whereas their Welsh counterparts do not.Modern data for genetic structure among non-Saxon samplesfrom the British Isles are said to deny the existence of a single‘Celtic’ population4. Our data indicate that differentiation withinsuch groups may have happened before the early centuries AD. Bythe same token, it lends support for genetic exchange betweenScotland and Ireland, as attested in some historical sources andmirrored by linguistic affinity: Irish and Scottish Gaelic are sisterP-Celtic languages, whereas Welsh is a divergent Q-Celticlanguage, akin to that thought to have been spoken throughoutpre-Roman Britain35.
In the Roman York burials at Driffield Terrace, the majoritywere adults under 45 years old, male and most had evidence ofdecapitation36. They were slightly taller than average for RomanBritain, displayed a high occurrence of trauma, potentially relatedto interpersonal violence and evidenced childhood stress and
infection (Supplementary Tables 1 and 2 and SupplementaryNote 1). This demographic profile resembles the populationstructure in a recently excavated burial ground of the secondand third century AD at Ephesus, which has been interpretedto be a burial ground for gladiators37. However, the evidencecould also fit with a military context; the Roman army had aminimum height for recruitment38 and fallen soldiers wouldmatch the young adult profile of the cemetery. In this laterRoman period increasingly large numbers of soldiers wereenlisted locally33.
Whichever the identity of the enigmatic headless Romans fromYork, our sample of the genomes of seven of them, whencombined with isotopic evidence, indicate six to be of Britishorigin and one to have origins in the Middle East. This is the firstrefined genomic evidence for far-reaching ancient mobility and(although from an unusual context) also the first snapshotof British genomes in the early centuries AD, indicatingcontinuity with an Iron-Age sample before the migrations ofthe Anglo-Saxon period.
MethodsIsotope analysis. Partial isotope data for six of the seven Driffield Terraceindividuals have been previously published7,39. We sampled a molar tooth from theremaining individual 3DRIF-26 for isotope analysis and re-attempted collagenextraction on long bones of individuals where rib samples had previously failed toyield a viable product. Analyses were done at the NERC Isotope GeosciencesLaboratory, Keyworth and Stable Isotope Laboratories, Universities of Bradfordand Reading (UK). (Supplementary Note 2, Supplementary Figs 2–5 andSupplementary Tables 3 and 4).
DNA extraction and sequencing. Ancient DNA sample processing was done atthe Ancient DNA lab, Smurfit Institute, Trinity College Dublin(Ireland), in clean-room facilities exclusively dedicated to this purpose. Weextracted DNA from B150 mg of nine temporal bone samples belonging to theIron-Age (1), Roman (7) and Anglo-Saxon (1) burial sites in York (UK;Supplementary Note 1) using a modified40 silica-column-based method41. DNAlibraries were constructed from extracted DNA using the method described inref. 42 with modifications15,43. We amplified the aDNA (ancient DNA) librarieswith 3–4 distinct indexing oligos for each sample to increase index diversity in eachlane. PCR products were then purified (Qiagen MinElute PCR Purification Kit,Qiagen, Hilden, Germany), quantified (Agilent Bioanalyzer 2100) and pooled.Each sample was sequenced to approximately 1� in an Illumina HiSeq 2000(100 cycle kit, single-end reads mode; Macrogen; Supplementary Note 2).
Read processing and analysis. Next-generation sequencing reads were trimmedwith Cutadapt v. 1.3 (ref. 44). Two bases from each side of reads were removedwith seqtk (https://github.com/lh3/seqtk). Reads were aligned to the humanreference genome (UCSC hg19) and mtDNA (rCRS, NC_012920.1) withBurrows-Wheeler Aligner v.0.7.5a-r405 (ref. 45), filtering by base quality 15,discarding PCR duplicates and reads with mapping quality inferior to 30 usingSAMtools v.0.1.19-44428cd (ref. 46; Table 1). Base quality scores were rescaled withmapDamage v.2.0 (ref. 47) to exclude potential deamination residues fromsubsequent analysis.
Contamination estimates and authenticity. To determine the extent ofcontamination in the ancient samples sequenced, we calculated the number ofmismatches in mtDNA haplotype defining mutations15 and X-chromosomepolymorphisms in samples determined to be male (Supplementary Note 2 andSupplementary Tables 5–8)48. We also used PMDtools49 to select reads withevidence of deamination and compared sex determination and PCA(Supplementary Note 2 and Supplementary Figs 7 and 8). Finally, we confirmed thepresence of aDNA misincorporations by analysing a subset of 1 million reads foreach sample with mapDamage 2.0 (ref. 47).
Sex determination and uniparental lineage determination. We used the methodpublished in ref. 16 to determine the sex of the ancient individuals (SupplementaryFig. 7). Y-chromosome lineages of ancient male samples were identified usingclean_tree software50 (http://www.erasmusmc.nl/fmb/resources/cleantree/;Supplementary Table 10). Regarding mtDNA analysis, reads were separatelyaligned to the revised Cambridge Reference Sequence (rCRS; NC_012920.1)51,filtering for base (qZ20) and mapping (qZ30) quality and duplicate reads asabove. We then used SAMtools to obtain a consensus sequence in fasta format,which we uploaded to HaploFind52, which determines mtDNA haplogroups based
ARTICLE NATURE COMMUNICATIONS | DOI: 10.1038/ncomms10326
6 NATURE COMMUNICATIONS | 7:10326 | DOI: 10.1038/ncomms10326 | www.nature.com/naturecommunications
on Phylotree build 16 (ref. 53) (Table 1 and Supplementary Note 2). Mitochondrialmutations detected in each sample are shown in Supplementary Table 9.
Population genetics analysis and data sets. Alleles identified with GenomeAnalysis Toolkit v.2.5 (ref. 54), Pileup mode, were haploidized following ref. 55.For comparisons with modern human populations, we used two data sets: 780individuals of European, Middle Eastern, West Asian and North Africanpopulations from ref. 21 and the other of Wellcome Trust Case ControlConsortium (WTCCC1) 1958 British Birth Cohort SNP genotype data3 withDutch24 and Irish23 genotypes (Supplementary Note 2). PCA (Figs 1a and 3aand Supplementary Figs 8 and 9) were performed using smartpca from theEIGENSOFT v.5 package56 and LASER 2.02 (ref. 57; Supplementary Fig. 10).Model-based clustering analysis was done with ADMIXTURE v.1.23 (ref. 58).We then extracted genotype likelihoods from aDNA data with ANGSD v.0.592(ref. 48; Supplementary Fig. 11), which we combined with genotype data ofpresent-day populations. We analysed this data with NGSadmix v.32 (ref. 59;K¼ 3; Fig. 1b and Supplementary Note 2).
Identity-by-state analysis. IBS between ancient and present-day samples wasestimated with PLINK v.1.9 (ref. 60). Median IBS proportions between aDNAsamples and European, Middle Eastern and North African populations wereobtained and plotted individually on maps (Supplementary Fig. 12). Then, weselected only the Roman York samples, except for 3DRIF-26 (Middle Easternaffinity), ranked their median IBS score in relation to modern populations andcombined these ranks by calculating their product (Fig. 2). Spearman rankcorrelations were estimated with R (ref. 61; Supplementary Note 2 andSupplementary Table 11). Regarding the WTCCC1 genotypes, we followed thesame approach as described above, but present scaled median IBS values to the0–1 range on Fig. 4.
fineSTRUCTURE analysis. We randomly selected 100 individuals from eachregion of the WTCCC1 data set, excluding SNPs with missing genotypes, whichresulted in a total of 431,366 variants and 1,000 samples. We used SHAPEIT2 tophase genotypes62 and ran the ChromoPainter pipeline25 with default parametersas implemented by fineSTRUCTURE v.2. For the fineSTRUCTURE analysis, thefollowing settings were used: 3,000,000 burn in iterations, 1,000,000 sampleiterations for the Markov chain Monte Carlo (MCMC) and 10,000,000 treecomparisons (Supplementary Note 2). We then called genotypes in our ancientsamples for estimation of IBS between these and the inferred fineSTRUCTUREpopulation clusters (Fig. 4 and Supplementary Figs 16 and 17).
Imputation of phenotype associated loci. To investigate loci associated withselective sweeps, we took a similar approach as in ref. 15, where alleles observed inthe 1000 Genomes Project63 were called with Genome Analysis Toolkit v.2.5, fromwhich we extracted genotype likelihoods and converted to BEAGLE format.BEAGLE v.3.3.2 (ref. 64) was used to phase and subsequently impute genotypes atSNP positions described in the HIrisplex system29, loci associated with bloodgroups65,66, lactase persistence67,68 and pigmentation phenotypes69,70. Onlyposterior genotype probabilities Z0.85 were kept15 (Supplementary Note 2 andSupplementary Table 14–17). We generated interpolated frequency maps of bloodgroup26 and Y-chromosome frequency data1,27,28 with ArcMap v.10.1 from theArcGis suite (Environmental Systems Research Institute) using the default settingsof the geospatial analysis plugin (Fig. 4).
References1. Weale, M. E., Weiss, D. A., Jager, R. F., Bradman, N. & Thomas, M. G.
Y chromosome evidence for Anglo-Saxon mass migration. Mol. Biol. Evol. 19,1008–1021 (2002).
2. Thomas, M. G., Stumpf, M. P. H. & Harke, H. Evidence for an apartheid-likesocial structure in early Anglo-Saxon England. Proc. Biol. Sci. 273, 2651–2657(2006).
3. Wellcome Trust Case Control Consortium. Genome-wide association study of14,000 cases of seven common diseases and 3,000 shared controls. Nature 447,661–678 (2007).
4. Leslie, S. et al. The fine-scale genetic structure of the British population. Nature519, 309–314 (2015).
5. Sims-Williams, P. Bronze- and Iron-Age Celtic-speakers: what don’t we know,what can’t we know, and what could we know? Language, genetics andarchaeology in the twenty-first century. J. R. Soc. Antiq. Irel. 92, 427–449(2012).
6. Adams, C. & Laurence, R. Travel and Geography in the Roman Empire(Routledge, 2012).
7. Muldner, G., Chenery, C. & Eckardt, H. The ‘Headless Romans’: multi-isotopeinvestigations of an unusual burial ground from Roman Britain. J. Archaeol. Sci.38, 280–290 (2011).
8. Eckardt, H. Roman Diasporas: Archaeological Approaches to Mobility andDiversity in the Roman Empire (Journal of Roman Archaeology, 2010).
9. Noy, D. in Roman Diasporas: Archaeological Approaches to Mobility andDiversity in the Roman Empire 13–26 (Journal of Roman Archaeology, Suppl.Ser., 2010).
10. Eckardt, H., Muldner, G. & Lewis, M. People on the move in Roman Britain.World Archaeol. 46, 534–550 (2014).
11. Ottaway, P. Book of Roman York (BT Batsford Ltd, 1993).12. Hunter-Mann, K. in Archaeology of York Web Series 6 (York Archaeological
Trust, 2007). Available at http://www.iadb.co.uk/driffield6/index.php.13. Fenton-Thomas, C. Where Sky and Yorkshire and Water Meet: The Story of the
Melton Landscape from Prehistory to the Present: Archaeological Excavations onthe A63 Grade Separated Junction at Melton, East Yorkshire (On-SiteArchaeology, 2011).
14. Sherlock, S. J. & Welch, M. G. An Anglo-Saxon Cemetery at Norton, Cleveland.Report No. 82 (Council for British Archaeology York, UK, 1992).
15. Gamba, C. et al. Genome flux and stasis in a five millennium transect ofEuropean prehistory. Nat. Commun. 5, 5257 (2014).
16. Skoglund, P., Storå, J., Gotherstrom, A. & Jakobsson, M. Accurate sexidentification of ancient human remains using DNA shotgun sequencing.J. Archaeol. Sci. 40, 4477–4482 (2013).
17. Kivisild, T. Maternal ancestry and population history from wholemitochondrial genomes. Investig. Genet. 6, 3 (2015).
18. Myres, N. M. et al. A major Y-chromosome haplogroup R1b Holocene erafounder effect in Central and Western Europe. Eur. J. Hum. Genet. 19, 95–101(2011).
19. Semino, O. et al. Origin, diffusion, and differentiation of Y-chromosomehaplogroups E and J: inferences on the neolithization of Europe and latermigratory events in the Mediterranean area. Am. J. Hum. Genet. 74, 1023–1034(2004).
20. Lappalainen, T. et al. Migration waves to the Baltic Sea region. Ann. Hum.Genet. 72, 337–348 (2008).
21. Hellenthal, G. et al. A genetic atlas of human admixture history. Science 343,747–751 (2014).
22. Bentley, A. R. Strontium isotopes from the Earth to the archaeological skeleton:a review. J. Archaeol. Method Theory 13, 135–187 (2006).
23. McLaughlin, R. L. et al. A second-generation Irish genome-wide associationstudy for amyotrophic lateral sclerosis. Neurobiol. Aging 36, 1221.e7–1221.e13(2015).
24. Van Es, M. A. et al. Genome-wide association study identifies 19p13.3(UNC13A) and 9p21.2 as susceptibility loci for sporadic amyotrophic lateralsclerosis. Nat. Genet. 41, 1083–1087 (2009).
25. Lawson, D. J., Hellenthal, G., Myers, S. & Falush, D. Inference of populationstructure using dense haplotype data. PLoS Genet. 8, e1002453 (2012).
26. Cavalli-Sforza, L. L., Menozzi, P. & Piazza, A. The History and Geography ofHuman Genes (Princeton Univ. Press, 1994).
27. Moore, L. T., Mc Evoy, B., Cape, E., Simms, K. & Bradley, D. G. Report AY-chromosome signature of hegemony in Gaelic Ireland. Am. J. Hum. Genet.78, 334–338 (2006).
28. Capelli, C. et al. A Y chromosome census of the British Isles. Curr. Biol. 13,979–984 (2003).
29. Walsh, S. et al. The HIrisPlex system for simultaneous prediction of hair andeye colour from DNA. Forensic Sci. Int. Genet. 7, 98–115 (2013).
30. Mourant, A. E. et al. The Distribution of the Human Blood Groups (BlackwellScientific Publications, Oxford, 1954); Available at http://www.cabdirect.org/abstracts/19552900220.html.
31. Topf, A. L., Gilbert, M. T. P., Dumbacher, J. P. & Hoelzel, A. R. Tracing thephylogeography of human populations in Britain based on 4th-11th centurymtDNA genotypes. Mol. Biol. Evol. 23, 152–161 (2006).
32. Miles, D. The Tribes of Britain (Weidenfeld & Nicolson, 2005).33. Mattingly, D. An imperial possession: Britain in the Roman Empire, 54 BC-AD
409. vol. 1 (Penguin, 2008).34. Cunliffe, B. Britain Begins (Oxford Univ. Press, 2013).35. Schmidt, K. H. in The Celtic Languages 64 (Routledge Language Family
Descriptions, London, New York, 1993).36. Caffell, A. & Holst, M. Osteological Analysis, 3 and 6 Driffield Terrace, York,
North Yorkshire (York Osteoarchaeology, 2012).37. Kanz, F. & Grossschmidt, K. Head injuries of Roman gladiators. Forensic Sci.
Int. 160, 207–216 (2006).38. Roth, J. P. The Logistics of the Roman Army at War: 264 B.C. - A.D. 235 (Brill,
1999).39. Montgomery, J., Knusel, C. J. & Tucker, K. in The Bioarchaeology of the Human
Head: Decapitation, Decoration and Deformation (ed. Bonogofsky, M.)141–178 (Univ. Press of Florida, 2011).
40. MacHugh, D. E., Edwards, C. J., Bailey, J. F., Bancroft, D. R. & Bradley, D. G.The extraction and analysis of ancient DNA from bone and teeth: a survey ofcurrent methodologies. Anc. Biomol. 3, 81 (2000).
41. Yang, D. Y., Eng, B., Waye, J. S., Dudar, J. C. & Saunders, S. R. Technical note:improved DNA extraction from ancient bones using silica-based spin columns.Am. J. Phys. Anthropol. 105, 539–543 (1998).
NATURE COMMUNICATIONS | DOI: 10.1038/ncomms10326 ARTICLE
NATURE COMMUNICATIONS | 7:10326 | DOI: 10.1038/ncomms10326 | www.nature.com/naturecommunications 7
42. Meyer, M. & Kircher, M. Illumina sequencing library preparation for highlymultiplexed target capture and sequencing. Cold Spring Harb. Protoc. 2010,db.prot5448 (2010).
43. Martiniano, R. et al. Genetic evidence of African slavery at the beginning of thetrans-Atlantic slave trade. Sci. Rep. 4, 5994 (2014).
44. Martin, M. Cutadapt removes adapter sequences from high-throughputsequencing reads. EMBnet.journal 17, 10–12 (2011).
45. Li, H. & Durbin, R. Fast and accurate short read alignment with Burrows–Wheeler transform. Bioinformatics 25, 1754–1760 (2009).
46. Li, H. et al. The sequence alignment/map format and SAMtools. Bioinformatics25, 2078–2079 (2009).
47. Jonsson, H., Ginolhac, A., Schubert, M., Johnson, P. L. F. & Orlando, L.mapDamage2.0: fast approximate Bayesian estimates of ancient DNA damageparameters. Bioinformatics 29, 1682–1684 (2013).
48. Korneliussen, T., Albrechtsen, A. & Nielsen, R. ANGSD: analysis of nextgeneration sequencing data. BMC Bioinformatics 15, 356 (2014).
49. Skoglund, P. et al. Separating endogenous ancient DNA from modern daycontamination in a Siberian Neandertal. Proc. Natl Acad. Sci. USA 111,2229–2234 (2014).
50. Ralf, A., van Oven, M., Zhong, K. & Kayser, M. Simultaneous analysis ofhundreds of Y-chromosomal SNPs for high-resolution paternal lineageclassification using targeted semiconductor sequencing. Hum. Mutat. 36,151–159 (2015).
51. Andrews, R. M. et al. Reanalysis and revision of the Cambridge referencesequence for human mitochondrial DNA. Nat. Genet. 23, 147 (1999).
52. Vianello, D. et al. HAPLOFIND: a new method for high-throughput mtDNAhaplogroup assignment. Hum. Mutat. 34, 1189–1194 (2013).
53. Van Oven, M. & Kayser, M. Updated comprehensive phylogenetic treeof global human mitochondrial DNA variation. Hum. Mutat. 30, E386–E394(2009).
54. McKenna, A. et al. The Genome Analysis Toolkit: a MapReduce framework foranalyzing next-generation DNA sequencing data. Genome Res. 20, 1297–1303(2010).
55. Skoglund, P. et al. Origins and genetic legacy of neolithic farmers and hunter-gatherers in Europe. Science 336, 466–469 (2012).
56. Patterson, N., Price, A. L. & Reich, D. Population structure and eigenanalysis.PLoS Genet. 2, 2074–2093 (2006).
57. Wang, C. et al. Ancestry estimation and control of population stratification forsequence-based association studies. Nat. Genet. 46, 409–415 (2014).
58. Alexander, D. H., Novembre, J. & Lange, K. Fast model-based estimation ofancestry in unrelated individuals. Genome Res. 19, 1655–1664 (2009).
59. Skotte, L., Korneliussen, T. S. & Albrechtsen, A. Estimating individualadmixture proportions from next generation sequencing data. Genetics 195,693–702 (2013).
60. Chang, C. C. et al. Second-generation PLINK: rising to the challenge of largerand richer datasets. arXiv [q-bio.GN] (2014).
61. R Development Core Team. R: A Language and Environment for StatisticalComputing (2011).
62. Delaneau, O., Marchini, J. & Zagury, J.-F. A linear complexity phasing methodfor thousands of genomes. Nat. Methods 9, 179–181 (2012).
63. 1000 Genomes Project Consortium et al. An integrated map of geneticvariation from 1,092 human genomes. Nature 135, 0–9 (2012).
64. Browning, S. R. & Browning, B. L. Rapid and accurate haplotype phasingand missing-data inference for whole-genome association studies byuse of localized haplotype clustering. Am. J. Hum. Genet. 81, 1084–1097(2007).
65. Heit, J. A. et al. A genome-wide association study of venous thromboembolismidentifies risk variants in chromosomes 1q24.2 and 9q. J. Thromb. Haemost. 10,1521–1531 (2012).
66. Nakao, M. et al. ABO blood group alleles and the risk of pancreatic cancer in aJapanese population. Cancer Sci. 102, 1076–1080 (2011).
67. Bersaglieri, T. et al. Genetic signatures of strong recent positive selection at thelactase gene. Am. J. Hum. Genet. 74, 1111–1120 (2004).
68. Enattah, N. S. et al. Identification of a variant associated with adult-typehypolactasia. Nat. Genet. 30, 233–237 (2002).
69. Beleza, S. et al. Genetic architecture of skin and eye color in an African-European admixed population. PLoS Genet. 9, e1003372 (2013).
70. Canfield, V. A. et al. Molecular phylogeography of a human autosomal skincolor locus under natural selection. G3 (Bethesda) 3, 2059–2067 (2013).
AcknowledgementsThis study makes use of data generated by the Wellcome Trust Case Control Con-sortium. A full list of the investigators who contributed to the generation of the data isavailable from www.wtccc.org.uk. Funding for the project was provided by the WellcomeTrust under award 076113. We wish to acknowledge the DJEI/DES/SFI/HEA IrishCentre for High-End Computing (ICHEC) for the provision of computational facilitiesand support. This study has been financed by the BEAN project of the Marie Curie ITN(grant number 289966). M.D.T. was funded by ERC Investigator grant 295729-CodeX.We thank the authors of Hellenthal et al.21 for providing their genotype data set,V. Mattiangeli for assistance with sequencing, as well as E. Jones and L. Cassidy foradvice and help provided regarding data processing.
Author contributionsD.G.B. and M.J.C. supervised the study; R.M., K.H.-M., C.M.D., M.J.C. and D.G.B.designed the research; R.M. processed aDNA samples and prepared NGS libraries; R.M.,R.L.M., M.D.T. and D.G.B. analysed genetic data; A.C., M.H., K.H.-M., C.M.D. andM.J.C. provided samples and interpretation of the archaeological context; J.M. and G.M.produced and analysed isotopic data; R.M., A.C., G.M., J.M., M.C., S.R., M.J.C. andD.G.B. wrote the paper with help from all authors.
Additional informationAccession codes: Raw Illumina sequencing reads can be downloaded at http://www.ebi.ac.uk/ena/data/view/PRJEB11004.
Supplementary Information accompanies this paper at http://www.nature.com/naturecommunications
Competing financial interests: The authors declare no competing financial interests.
Reprints and permission information is available online at http://npg.nature.com/reprintsandpermissions/
How to cite this article: Martiniano, R. et al. Genomic signals of migration andcontinuity in Britain before the Anglo-Saxons. Nat. Commun. 7:10326doi: 10.1038/ncomms10326 (2016).
This work is licensed under a Creative Commons Attribution 4.0International License. The images or other third party material in this
article are included in the article’s Creative Commons license, unless indicated otherwisein the credit line; if the material is not included under the Creative Commons license,users will need to obtain permission from the license holder to reproduce the material.To view a copy of this license, visit http://creativecommons.org/licenses/by/4.0/
ARTICLE NATURE COMMUNICATIONS | DOI: 10.1038/ncomms10326
8 NATURE COMMUNICATIONS | 7:10326 | DOI: 10.1038/ncomms10326 | www.nature.com/naturecommunications