Embed Size (px)
Citation preview
Dual Energy CT Image Reconstruction Algorithms and Performance
Joseph A. O’SullivanSamuel C. Sachs Professor
/ d dDean, UMSL/WU Joint Undergraduate Engineering Program Professor of Electrical and Systems Engineering,
Biomedical Engineering and RadiologyBiomedical Engineering, and [email protected]
J. A. O’Sullivan, AAPM 07/28/09P-20 Seminar, 3/12/05 R. M. Arthur
Supported by Washington University and NIH-NCI grantR01CA75371 (J. F. Williamson, VCU, PI).
CollaboratorsFaculty Students
Norbert AgbekoLiangjun Xie
Bruce R. WhitingDavid G. Politte gj
Daniel KeesingJosh Evans, VCU
David G. PolitteJeffrey F. Williamson, VCUDonald L. Snyder
Debashish PalJasenka BenacGiovanni Lasio VCUChemical Engineers Giovanni Lasio, VCUChemical Engineers
M. DudukovicM. Al-Dahhan Special thanks to Bruce R Whiting
J. A. O’Sullivan, AAPM 07/28/09P-20 Seminar, 3/12/05 R. M. Arthur
M. Al DahhanR. Varma
Special thanks to Bruce R. Whitingand N. Agbeko

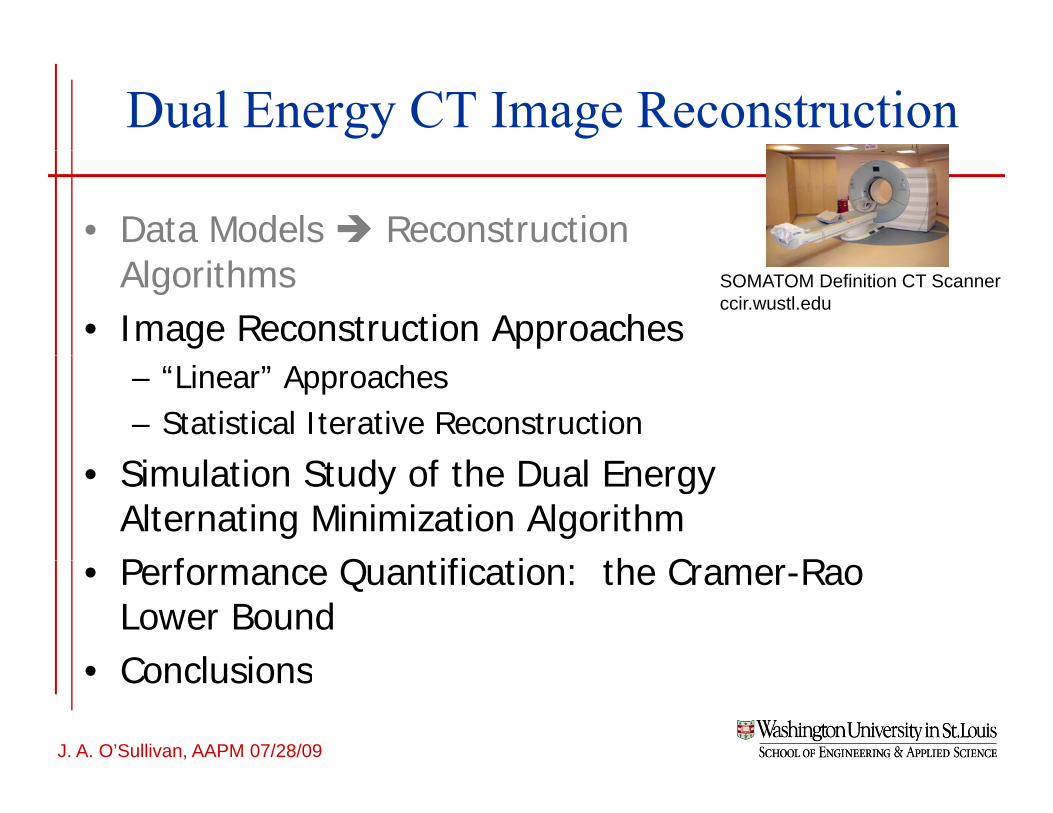
Dual Energy CT Image Reconstruction
• Data Models Reconstruction Algorithms
• Image Reconstruction ApproachesSOMATOM Definition CT Scannerccir.wustl.edu
– “Linear” Approaches– Statistical Iterative Reconstruction
f• Simulation Study of the Dual Energy Alternating Minimization AlgorithmP f Q tifi ti th C R• Performance Quantification: the Cramer-Rao Lower BoundConclusions
J. A. O’Sullivan, AAPM 07/28/09P-20 Seminar, 3/12/05 R. M. Arthur
• Conclusions
Motivation
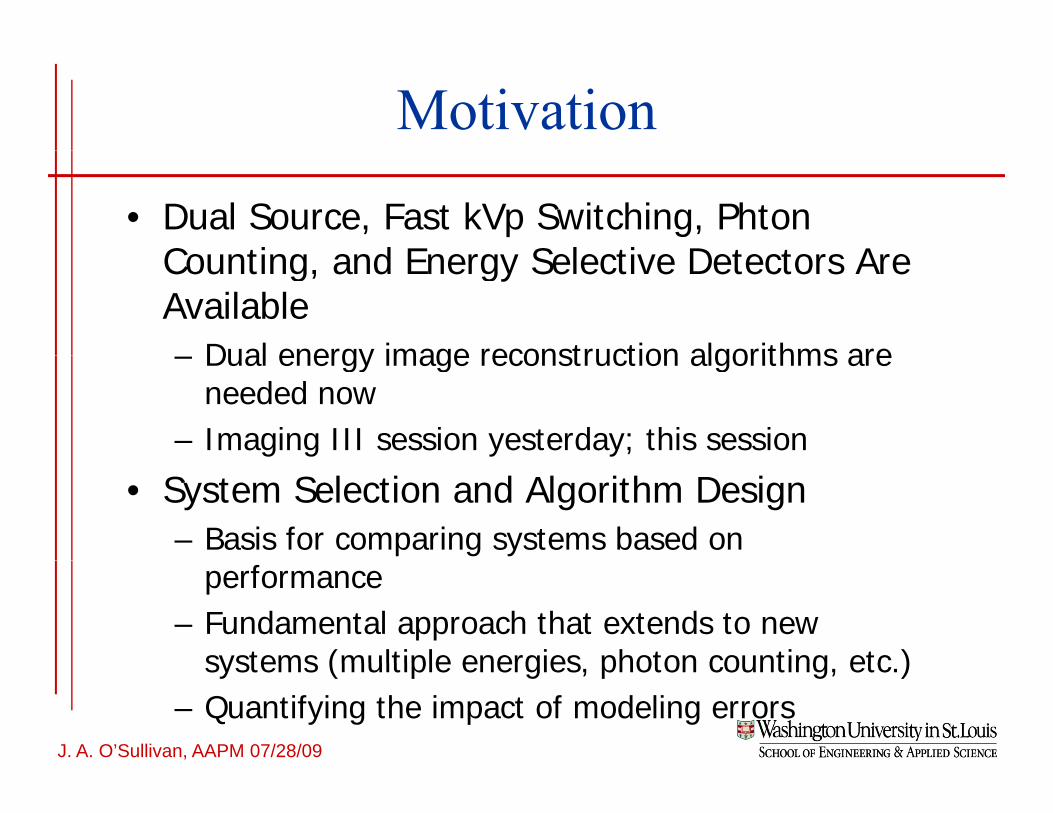
• Dual Source, Fast kVp Switching, Phton C ti d E S l ti D t t ACounting, and Energy Selective Detectors Are Available – Dual energy image reconstruction algorithms are– Dual energy image reconstruction algorithms are
needed now– Imaging III session yesterday; this session
• System Selection and Algorithm Design– Basis for comparing systems based on
performance– Fundamental approach that extends to new
systems (multiple energies photon counting etc )
J. A. O’Sullivan, AAPM 07/28/09P-20 Seminar, 3/12/05 R. M. Arthur
systems (multiple energies, photon counting, etc.)– Quantifying the impact of modeling errors

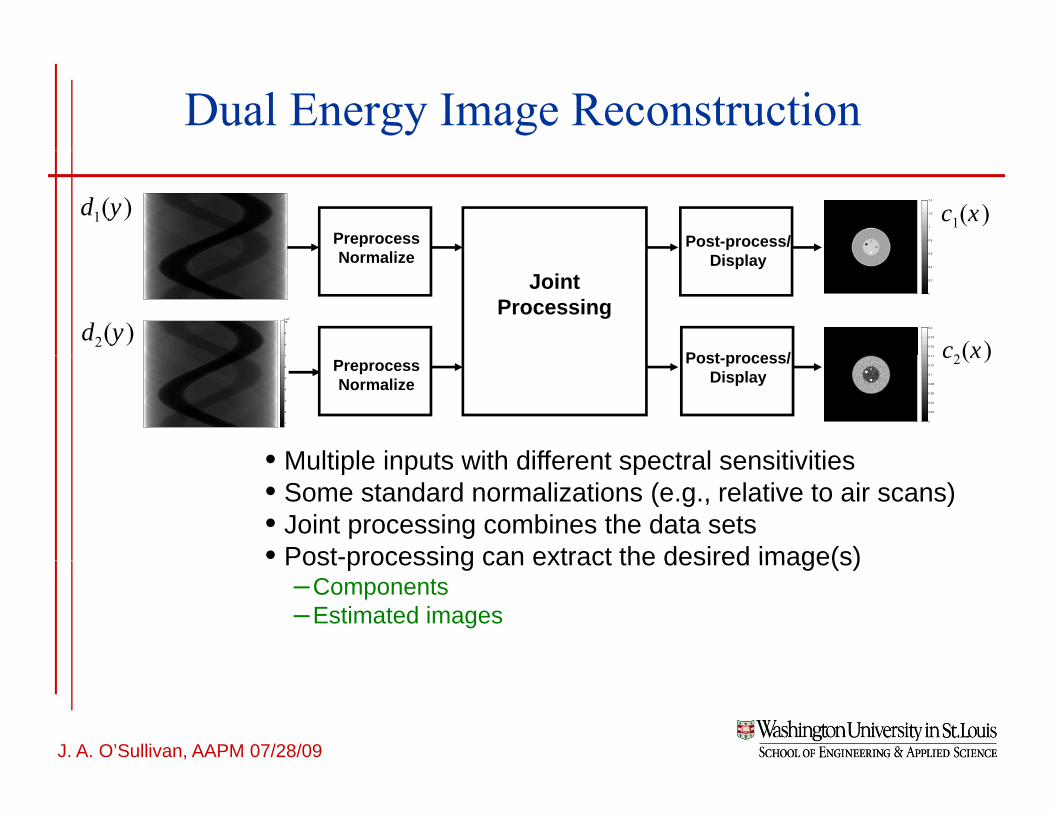
Dual Energy Image Reconstruction
0 6
0.8
1
1.2
1.4
1( )d y1( )c x
Preprocess N li
Post-process/
0
0.2
0.4
0.6
0 14
0.16
0.18
0.2
7
8
9
10x 10
4
NormalizeJoint
Processing2( )d y
Display
Post process/ 2( )c x
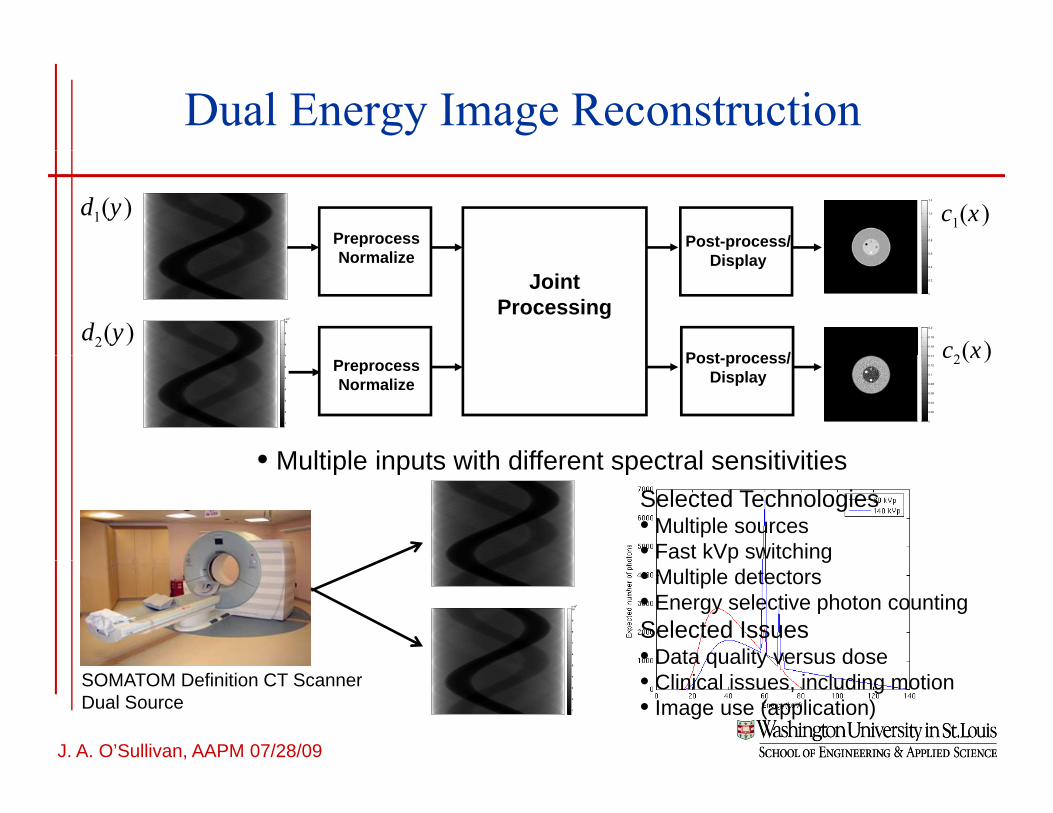
• Multiple inputs with different spectral sensitivities
0
0.02
0.04
0.06
0.08
0.1
0.12
0.14
1
2
3
4
5
6
7
Preprocess Normalize
Post-process/ Display
2( )c x
• Multiple inputs with different spectral sensitivities• Some standard normalizations (e.g., relative to air scans)• Joint processing combines the data sets• Post-processing can extract the desired image(s)Post processing can extract the desired image(s)
–Components–Estimated images
J. A. O’Sullivan, AAPM 07/28/09P-20 Seminar, 3/12/05 R. M. Arthur
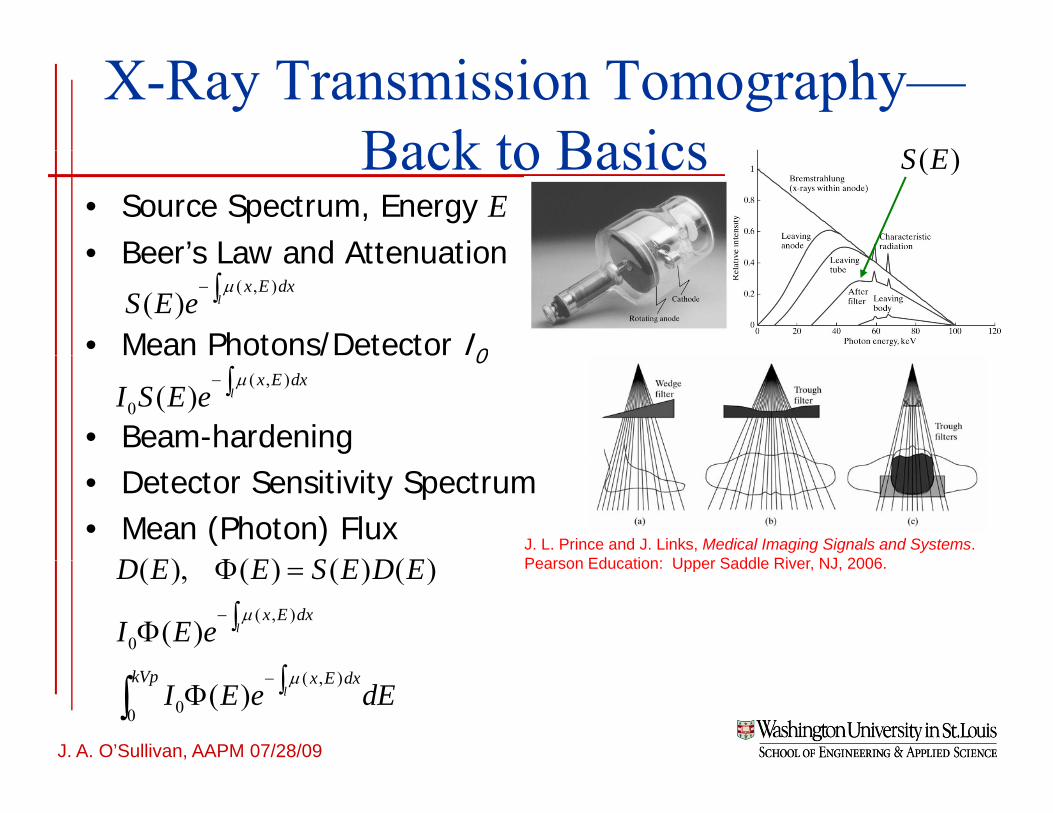
X-Ray Transmission Tomography—Back to Basics ( )S EBack to Basics
• Source Spectrum, Energy E• Beer’s Law and Attenuation
( )S E
• Beer s Law and Attenuation
• Mean Photons/Detector I0
( , )( ) l
x E dxS E e
μ−∫
ea oto s/ etecto 0
• Beam-hardening
( , )
0 ( ) lx E dx
I S E eμ−∫
• Detector Sensitivity Spectrum• Mean (Photon) Flux J. L. Prince and J. Links, Medical Imaging Signals and Systems.
Pearson Education: Upper Saddle River NJ 2006( ) ( ) ( ) ( )D E E S E D EΦ Pearson Education: Upper Saddle River, NJ, 2006.
( , )
0
( ), ( ) ( ) ( )
( ) lx E dx
D E E S E D E
I E eμ−
Φ =
∫Φ
J. A. O’Sullivan, AAPM 07/28/09P-20 Seminar, 3/12/05 R. M. Arthur
( , )
00( ) l
kVp x E dxI E e dE
μ−∫Φ∫
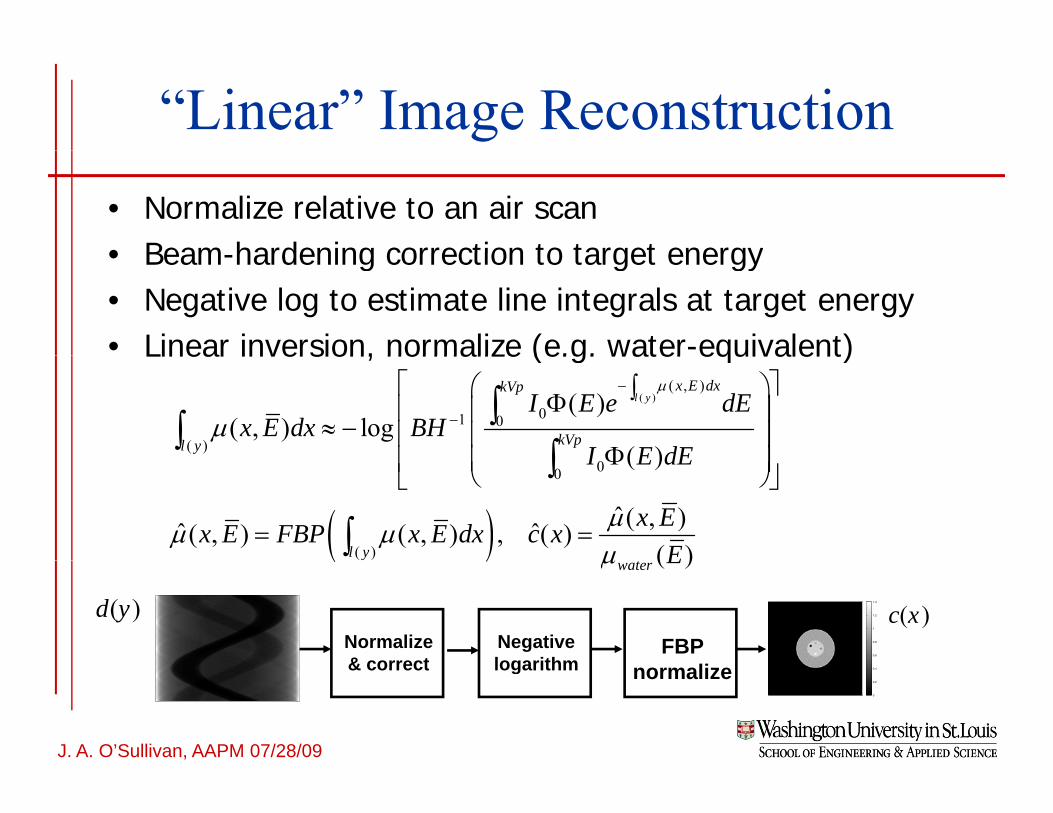
“Linear” Image Reconstruction• Normalize relative to an air scan• Beam hardening correction to target energy• Beam-hardening correction to target energy• Negative log to estimate line integrals at target energy• Linear inversion, normalize (e.g. water-equivalent)Linear inversion, normalize (e.g. water equivalent)
( )( , )
01 0( )
( )( , ) log
( )
l yx E dxkVp
kVpl y
I E e dEx E dx BH
I E dE
μ
μ
−
−
⎡ ⎤⎛ ⎞∫Φ⎢ ⎥⎜ ⎟≈ − ⎢ ⎥⎜ ⎟Φ⎜ ⎟⎢ ⎥
∫∫
∫
( )00
( )
( )
ˆ ( , )ˆ ˆ( , ) ( , ) , ( )( )l y
I E dE
x Ex E FBP x E dx c xE
μμ μμ
Φ⎜ ⎟⎢ ⎥⎝ ⎠⎣ ⎦
= =
∫
∫( ) ( )water Eμ
0.6
0.8
1
1.2
1.4( )d y ( )c xNormalize& correct
FBP Negative logarithm
J. A. O’Sullivan, AAPM 07/28/09P-20 Seminar, 3/12/05 R. M. Arthur
0
0.2
0.4& correct normalizelogarithm
X-Ray Transmission Tomography—Back to BasicsBack to Basics
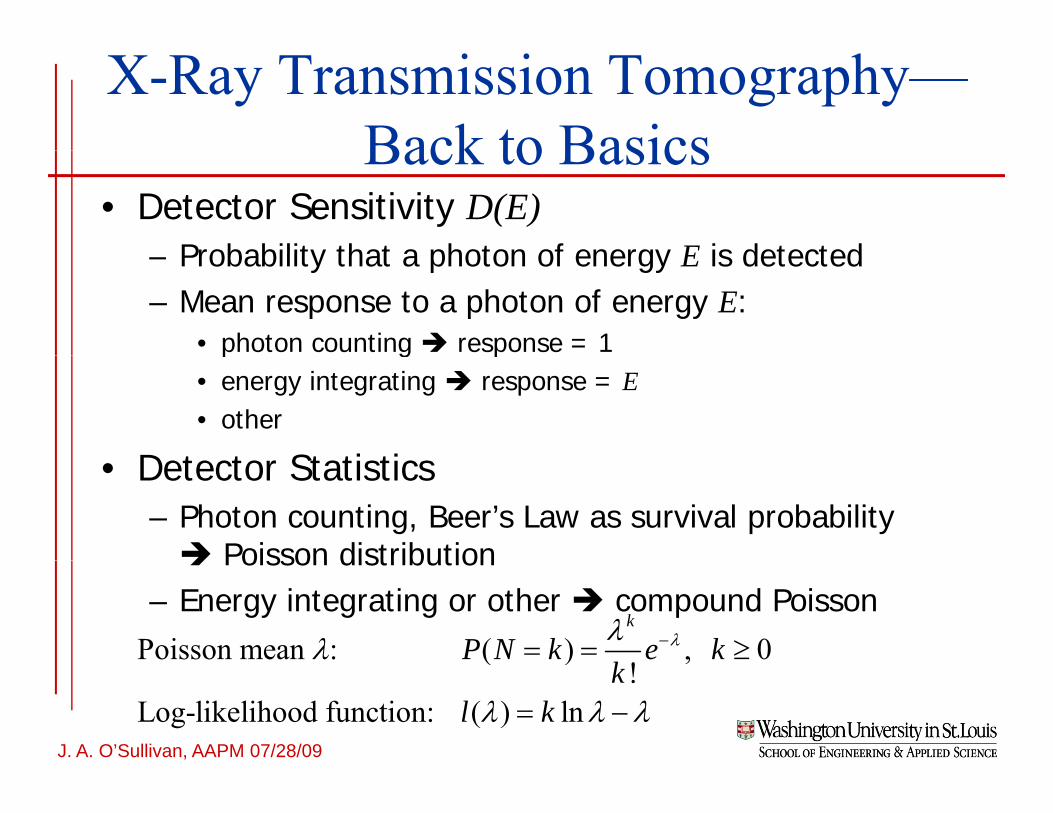
• Detector Sensitivity D(E)Probability that a photon of energy E is detected– Probability that a photon of energy E is detected
– Mean response to a photon of energy E:• photon counting response = 1p g p• energy integrating response = E• other
D t t St ti ti• Detector Statistics– Photon counting, Beer’s Law as survival probability
Poisson distributionPoisson distribution– Energy integrating or other compound Poisson
Poisson mean : ( ) , 0!
k
P N k e kk
λλλ −= = ≥
J. A. O’Sullivan, AAPM 07/28/09P-20 Seminar, 3/12/05 R. M. Arthur
( ) ,!
Log-likelihood function: ( ) lnk
l kλ λ λ= −

X-Ray Transmission Tomography—Reconstruction PrinciplesReconstruction Principles
• Deterministic Model– Data equal a function of the desired image– Approximately invert that function to reconstruct
image (minimize a measure of error between theimage (minimize a measure of error between the data and the model)
2min ( : )d gμ
μ− ⋅
• Random Model– Find the log-likelihood function for the data
μ
g– Maximize the (possibly penalized) log-likelihood
function over possible images
J. A. O’Sullivan, AAPM 07/28/09P-20 Seminar, 3/12/05 R. M. Arthur
max ( | ( : ))l d gμ
μ⋅

Statistical Image Reconstruction• Source-detector pairs indexed by y; voxels indexed by x• Data d (y) Poisson means g (y:μ) log-likelihood function
g
• Data dj(y) Poisson, means gj(y:μ), log likelihood function
( | ( : )) ( ) ln ( : ) ( : )j j j j jy
l d g d y g y g yμ μ μ∈
⋅ = −∑Y
( : ) ( , ) exp ( , ) ( , ) ( )
y
j j j jE x
g y I y E h y x x E yμ μ β∈
⎛ ⎞= Φ − +⎜ ⎟
⎝ ⎠∑ ∑
Y
X
• Mean unattenuated counts Ij, mean background βj
• Attenuation function μ(x,E), E energiesμ( , ), g
∑=I
iii ExcEx
1)()(),( μμ
J. A. O’Sullivan, AAPM 07/28/09P-20 Seminar, 3/12/05 R. M. Arthur
• Maximize over μ or ci
=i 1

Attenuation Function Approximation• Voxels as function approximation
– Constant attenuation over a small volume, orCo sta t atte uat o o e a s a o u e, o– Linear combination of basis functions
• Energy dependencel
∑=I
iii ExcEx
1)()(),( μμ
– Water equivalent– Linear combination of basis functions
• Basis functions
=i 1
Basis functions– Physics (photoelectric and Compton scatter) – Physiological (e.g., fat and bone)
Signal processing (e g SVD)– Signal processing (e.g., SVD)– Hand selected (e.g., CaCl and styrene)
• Constrained system 1 2 3( ) 0, ( ) ( ) ( ) 1ic x c x c x c x≥ + + =
J. A. O’Sullivan, AAPM 07/28/09P-20 Seminar, 3/12/05 R. M. Arthur
y– Dual Energy, 3 images 3
1
( , ) ( ) ( )i ii
x E c x Eμ μ=
=∑
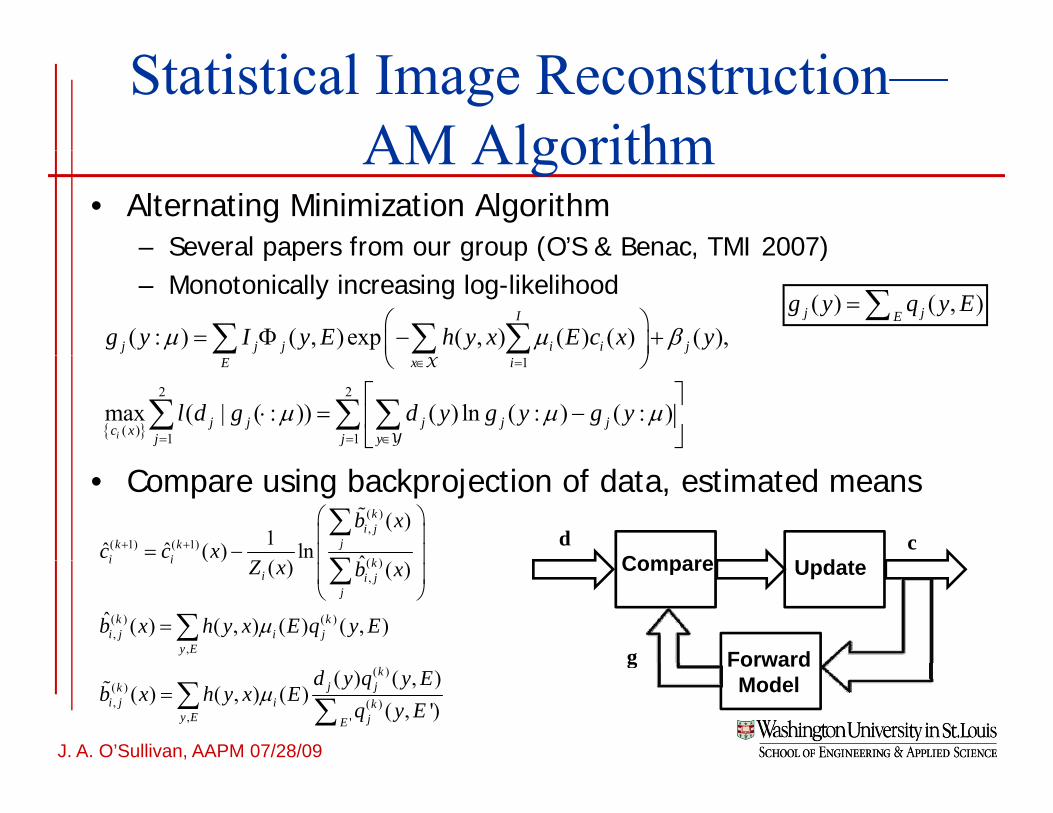
Statistical Image Reconstruction—AM AlgorithmAM Algorithm
• Alternating Minimization Algorithm– Several papers from our group (O’S & Benac, TMI 2007)Several papers from our group (O S & Benac, TMI 2007)– Monotonically increasing log-likelihood
( : ) ( , ) exp ( , ) ( ) ( ) ( ),I
j j j i i jg y I y E h y x E c x yμ μ β⎛ ⎞= Φ − +⎜ ⎟
⎝ ⎠∑ ∑ ∑
( ) ( , )j jEg y q y E=∑
{ }
1
2 2
( ) 1 1
max ( | ( : )) ( ) ln ( : ) ( : )i
E x i
j j j j jc x j j yl d g d y g y g yμ μ μ
∈ =
= = ∈
⎝ ⎠⎡ ⎤
⋅ = −⎢ ⎥⎣ ⎦
∑ ∑ ∑
X
Y
• Compare using backprojection of data, estimated means
dCompare U d t
c( ),
( 1) ( 1)( )
( )1ˆ ˆ ( ) ln ˆ( )
ki j
jk ki i k
b xc c x
Z+ +
⎛ ⎞⎜ ⎟
= − ⎜ ⎟∑
∑
%
Compare
g
Update
Forward
( ),
( ) ( ),
,
( )( ) ( )
ˆ ( ) ( , ) ( ) ( , )
i i ki i j
j
k ki j i j
y E
Z x b x
b x h y x E q y Eμ
⎜ ⎟⎜ ⎟⎝ ⎠
=
∑
∑
J. A. O’Sullivan, AAPM 07/28/09P-20 Seminar, 3/12/05 R. M. Arthur
g ForwardModel
( )( ), ( )
, '
( ) ( , )( ) ( , ) ( )
( , ')
kj jk
i j i ky E jE
d y q y Eb x h y x E
q y Eμ=∑ ∑
%
Dual Energy CT Image Reconstruction
• Data Models Reconstruction Algorithms
• Image Reconstruction ApproachesSOMATOM Definition CT Scannerccir.wustl.edu
– “Linear” Approaches– Statistical Iterative Reconstruction
f• Simulation Study of the Dual Energy Alternating Minimization AlgorithmP f Q tifi ti th C R• Performance Quantification: the Cramer-Rao Lower BoundConclusions
J. A. O’Sullivan, AAPM 07/28/09P-20 Seminar, 3/12/05 R. M. Arthur
• Conclusions
Dual Energy Image Reconstruction
0 6
0.8
1
1.2
1.4
1( )d y1( )c x
Preprocess N li
Post-process/
0
0.2
0.4
0.6
0 14
0.16
0.18
0.2
7
8
9
10x 10
4
NormalizeJoint
Processing2( )d y
Display
Post process/ 2( )c x
• Multiple inputs with different spectral sensitivities
0
0.02
0.04
0.06
0.08
0.1
0.12
0.14
1
2
3
4
5
6
7
Preprocess Normalize
Post-process/ Display
2( )c x
• Multiple inputs with different spectral sensitivities• Some standard normalizations (e.g., relative to air scans)• Joint processing combines the data sets• Post-processing can extract the desired image(s)Post processing can extract the desired image(s)
–Components–Estimated images
J. A. O’Sullivan, AAPM 07/28/09P-20 Seminar, 3/12/05 R. M. Arthur
Dual Energy Image Reconstruction
0 6
0.8
1
1.2
1.4
1( )d y1( )c x
Preprocess N li
Post-process/
0
0.2
0.4
0.6
0 14
0.16
0.18
0.2
7
8
9
10x 10
4
NormalizeJoint
Processing2( )d y
Display
Post process/ 2( )c x
0
0.02
0.04
0.06
0.08
0.1
0.12
0.14
1
2
3
4
5
6
7
Preprocess Normalize
Post-process/ Display
2( )c x
• Multiple inputs with different spectral sensitivitiesSelected Technologies• Multiple sources• Fast kVp switching
• Multiple inputs with different spectral sensitivities
6
7
8
9
10x 10
4
p g• Multiple detectors• Energy selective photon countingSelected Issues• Data quality versus dose
J. A. O’Sullivan, AAPM 07/28/09P-20 Seminar, 3/12/05 R. M. Arthur
SOMATOM Definition CT ScannerDual Source
1
2
3
4
5Data quality versus dose
• Clinical issues, including motion• Image use (application)

Dual Energy Image Reconstruction
0 6
0.8
1
1.2
1.4
1( )d y1( )c x
Preprocess N li
Reconstruct
0
0.2
0.4
0.6
0 14
0.16
0.18
0.2
7
8
9
10x 10
4
Normalize - Logarithm
2( )d y
Image
Reconstruct 2( )c x
11 12
21 22
a aa aé ùê úë û
• Joint processing combines the data sets
0
0.02
0.04
0.06
0.08
0.1
0.12
0.14
1
2
3
4
5
6
7
Preprocess Normalize
- Logarithm
ReconstructImage
2( )c x
• Joint processing combines the data sets–Linear combination of attenuations, then
reconstruct individual images independently
J. A. O’Sullivan, AAPM 07/28/09P-20 Seminar, 3/12/05 R. M. Arthur
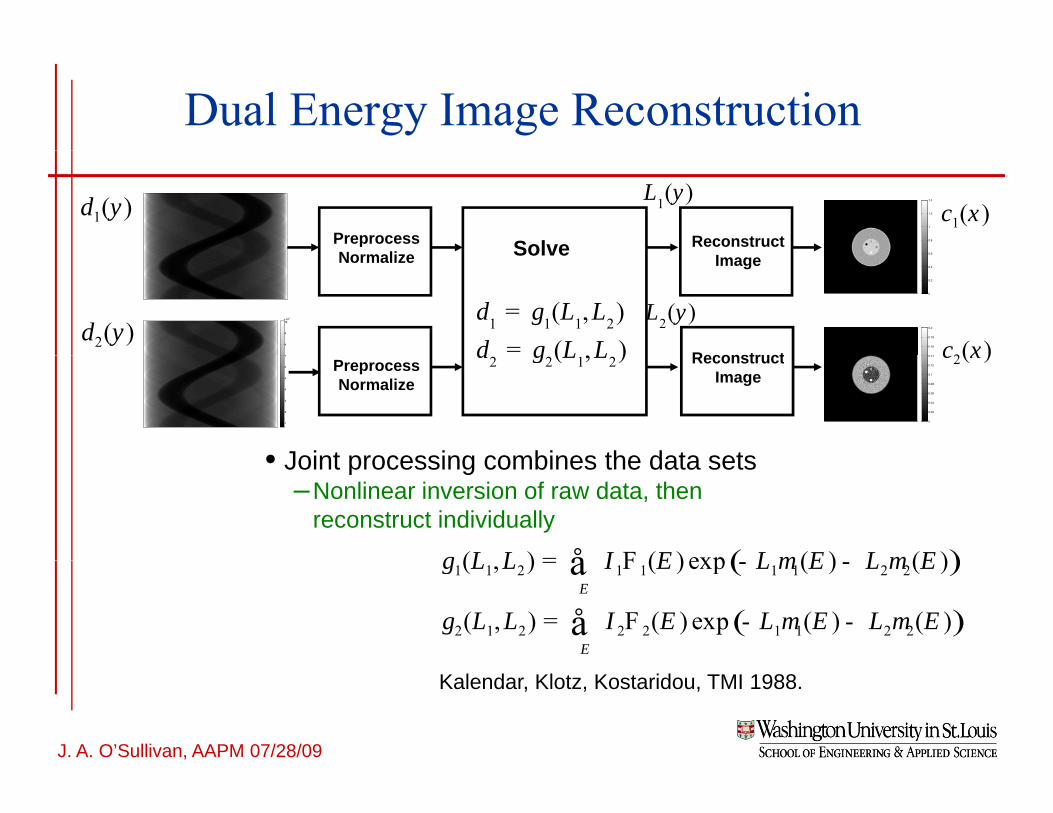
Dual Energy Image Reconstruction
0 6
0.8
1
1.2
1.4
1( )d y1( )c x
Preprocess N li
ReconstructSolve
1( )L y
0
0.2
0.4
0.6
0 14
0.16
0.18
0.2
7
8
9
10x 10
4
Normalize
2( )d y
Image
Reconstruct 2( )c x1 1 1 2( , )
( , )d g L Ld g L L
==
Solve
2( )L y
• Joint processing combines the data sets
0
0.02
0.04
0.06
0.08
0.1
0.12
0.14
1
2
3
4
5
6
7
Preprocess Normalize
ReconstructImage
2( )c x2 2 1 2( , )d g L L
• Joint processing combines the data sets–Nonlinear inversion of raw data, then
reconstruct individually
( )( ) ( ) exp ( ) ( )g L L I E L E L Em m= Få ( )
( )
1 1 2 1 1 1 1 2 2
2 1 2 2 2 1 1 2 2
( , ) ( ) exp ( ) ( )
( , ) ( ) exp ( ) ( )E
E
g L L I E L E L E
g L L I E L E L E
m m
m m
= F - -
= F - -
åå
J. A. O’Sullivan, AAPM 07/28/09P-20 Seminar, 3/12/05 R. M. Arthur
Kalendar, Klotz, Kostaridou, TMI 1988.

Dual Energy Image Reconstruction
0 6
0.8
1
1.2
1.4
1( )d y1( )c x
Preprocess Reconstruct
0
0.2
0.4
0.6
0 14
0.16
0.18
0.2
7
8
9
10x 10
4
ReconstructImage
Preprocess2( )d y
2( )c x
11 12
21 22
a aa aé ùê úë û
• Joint processing combines the data sets
0
0.02
0.04
0.06
0.08
0.1
0.12
0.14
1
2
3
4
5
6
7 Preprocess Reconstruct
Image
2( )c x
• Joint processing combines the data sets–Reconstruct individual images from each data
set, then (linearly) combine the resulting attenuation images to estimate desired goutputs
Williamson Li Whiting Lerma Med Phys 2006
J. A. O’Sullivan, AAPM 07/28/09P-20 Seminar, 3/12/05 R. M. Arthur
Williamson, Li, Whiting, Lerma, Med. Phys. 2006.
Dual Energy Image Reconstruction
0 6
0.8
1
1.2
1.4
1( )d y1( )c x
Preprocess N li
Post-process/
0
0.2
0.4
0.6
0 14
0.16
0.18
0.2
7
8
9
10x 10
4
Normalize
2( )d y
Display
Post process/ 2( )c x
dCompare
g
Update
ForwardModel
c
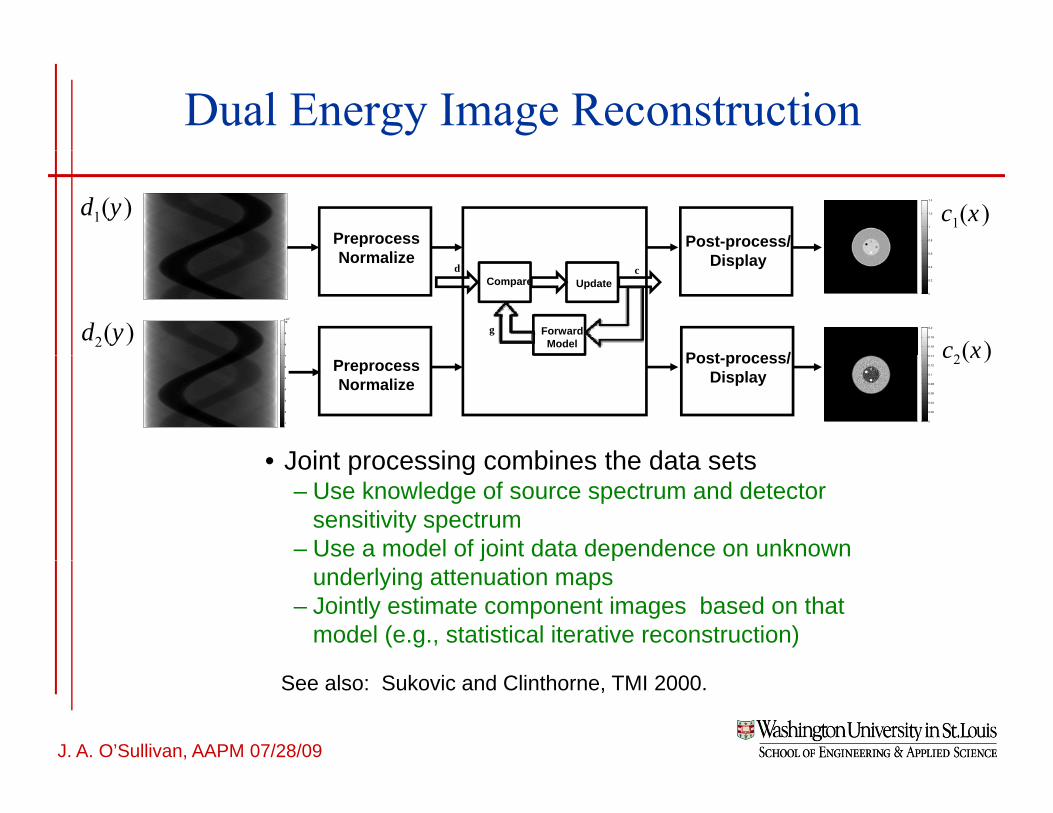
• Joint processing combines the data sets
0
0.02
0.04
0.06
0.08
0.1
0.12
0.14
1
2
3
4
5
6
7
Preprocess Normalize
Post-process/ Display
2( )c x
• Joint processing combines the data sets– Use knowledge of source spectrum and detector
sensitivity spectrum – Use a model of joint data dependence on unknown j p
underlying attenuation maps– Jointly estimate component images based on that
model (e.g., statistical iterative reconstruction)
J. A. O’Sullivan, AAPM 07/28/09P-20 Seminar, 3/12/05 R. M. Arthur
See also: Sukovic and Clinthorne, TMI 2000.
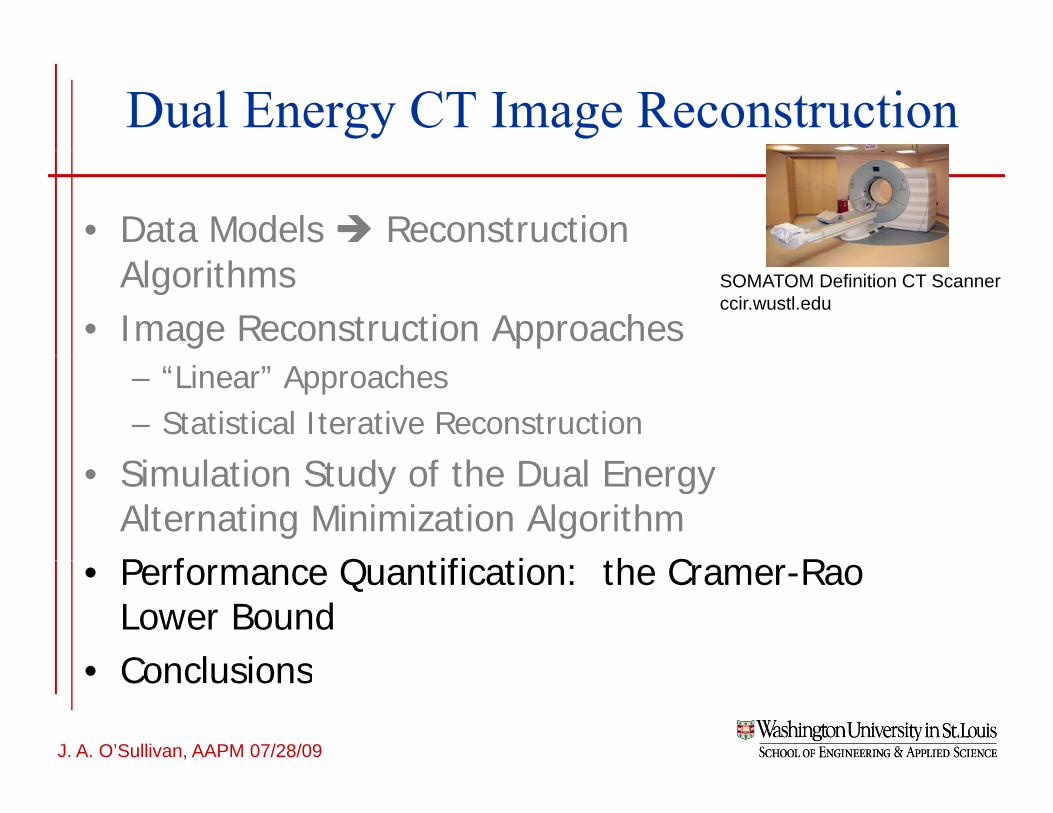
Dual Energy CT Image Reconstruction
• Data Models Reconstruction Algorithms
• Image Reconstruction ApproachesSOMATOM Definition CT Scannerccir.wustl.edu
– “Linear” Approaches– Statistical Iterative Reconstruction
f• Simulation Study of the Dual Energy Alternating Minimization AlgorithmP f Q tifi ti th C R• Performance Quantification: the Cramer-Rao Lower BoundConclusions
J. A. O’Sullivan, AAPM 07/28/09P-20 Seminar, 3/12/05 R. M. Arthur
• Conclusions

Simulations: Post-reconstruction vs. Joint Statistical Image Reconstruction
• Large Phantom: 20cm in diameter; thin outer lucite shell; water; four rods in inner 60mm lucite cylinder.
C lib ti d l i hl id th l t fl d l t i
Joint Statistical Image Reconstruction
– Calibration rods: calcium chloride, ethanol, teflon and polystyrene in the 12, 3, 6, and 10 o’clock positions, resp.
– Test phantom rods: muscle, ethanol, teflon and substance X (a bonelike material) in the 12, 3, 6, and 10 o’clock positions, resp.) , , , p , p
• Small Phantom: 60mm diameter lucite cylinder with rods• FBP-BVM (Basis Vector Method; JF Williamson, et al. 2006)
– Water-equivalent beam hardening correctionWater equivalent beam hardening correction– Requires calibration data to estimate linear transformation that
generates the component images– FBP uses a ramp filter
AM DE (AM D l E Al ith )• AM-DE (AM Dual Energy Algorithm)– NO pre-correction of data– NO calibration data– NO regularization
J. A. O’Sullivan, AAPM 07/28/09P-20 Seminar, 3/12/05 R. M. Arthur
NO regularization

Materials Used - Fractions
Substance Styrene F ti
Ca. Chloride F tiSubstance Fraction Fraction
Styrene 1 0Ca. Chloride 0 1
Ethanol 0.79904 0.03369Lucite 1.14 0.05834Teflon 1.4194 0.48799Water 0.90357 0.1357Muscle 0.93995 0.13904
J. A. O’Sullivan, AAPM 07/28/09P-20 Seminar, 3/12/05 R. M. Arthur
Substance X 0.03 2.8613
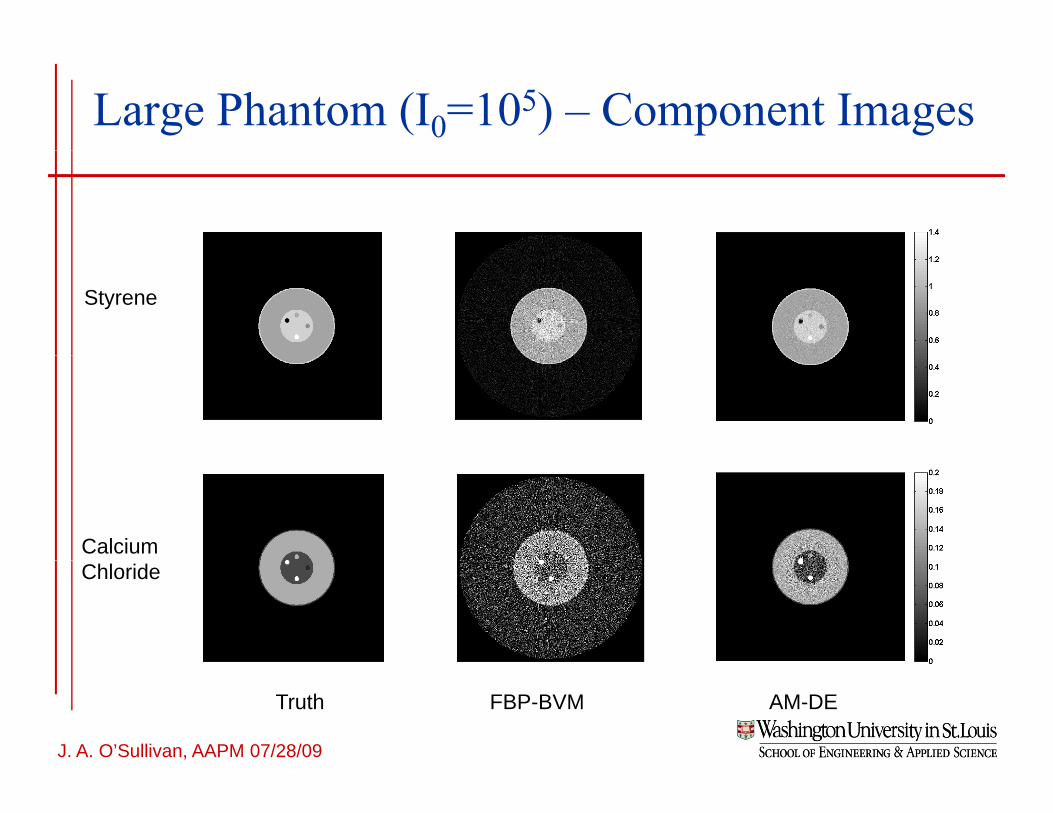
Large Phantom (I0=105) – Component Images
Styrene
CalciumChloride
J. A. O’Sullivan, AAPM 07/28/09P-20 Seminar, 3/12/05 R. M. Arthur
Truth FBP-BVM AM-DE

Large Phantom – Synthesized Images
20 keV
65 keV
J. A. O’Sullivan, AAPM 07/28/09P-20 Seminar, 3/12/05 R. M. Arthur
Truth FBP-BVM AM-DE
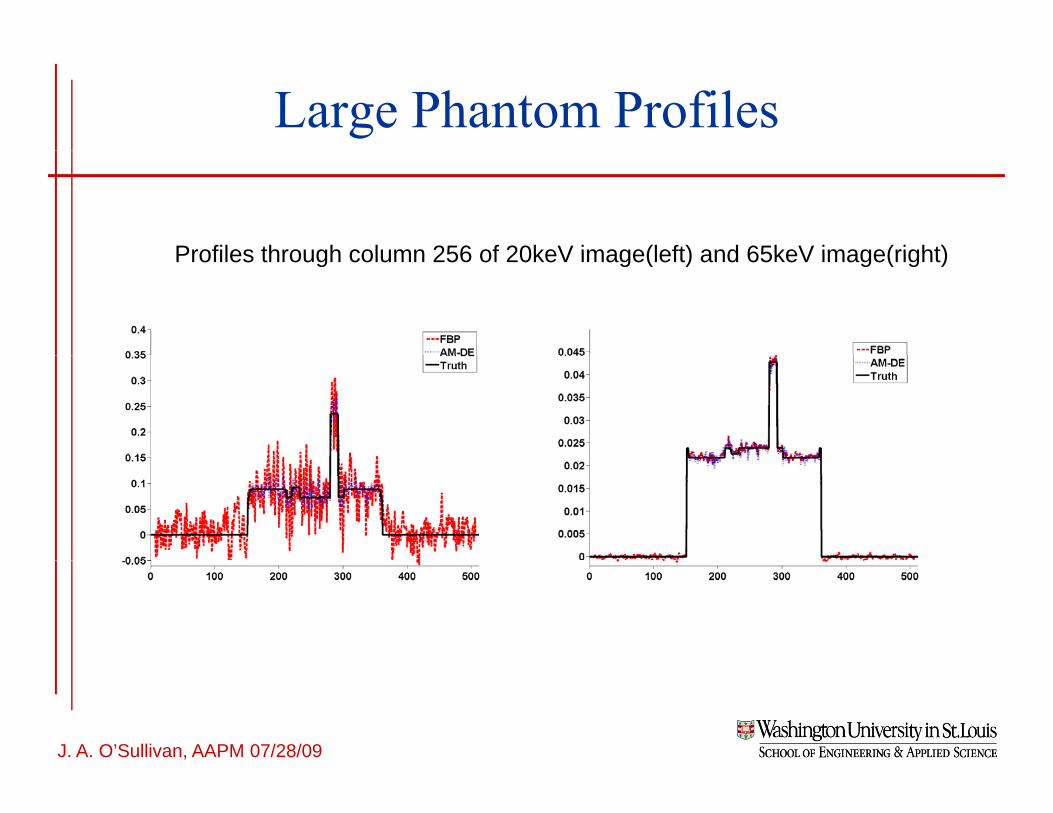
Large Phantom Profiles
Profiles through column 256 of 20keV image(left) and 65keV image(right)Profiles through column 256 of 20keV image(left) and 65keV image(right)
J. A. O’Sullivan, AAPM 07/28/09P-20 Seminar, 3/12/05 R. M. Arthur
Mini CT – Small Phantom
• 360 Source positions• 92 detectors• 92 detectors• Based on Siemens Somatom Plus 4
scannerscanner• 64 by 64 image
J. A. O’Sullivan, AAPM 07/28/09P-20 Seminar, 3/12/05 R. M. Arthur
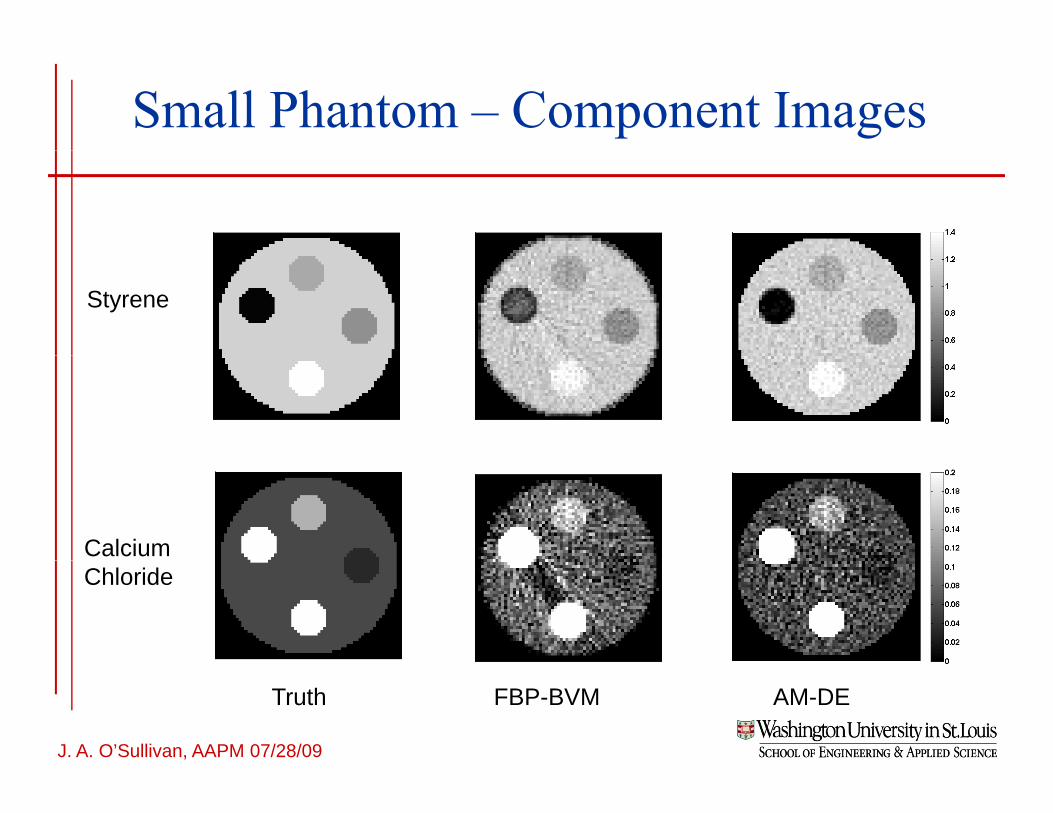
Small Phantom – Component Images
Styrene
CalciumChloride
J. A. O’Sullivan, AAPM 07/28/09P-20 Seminar, 3/12/05 R. M. Arthur
Truth FBP-BVM AM-DE
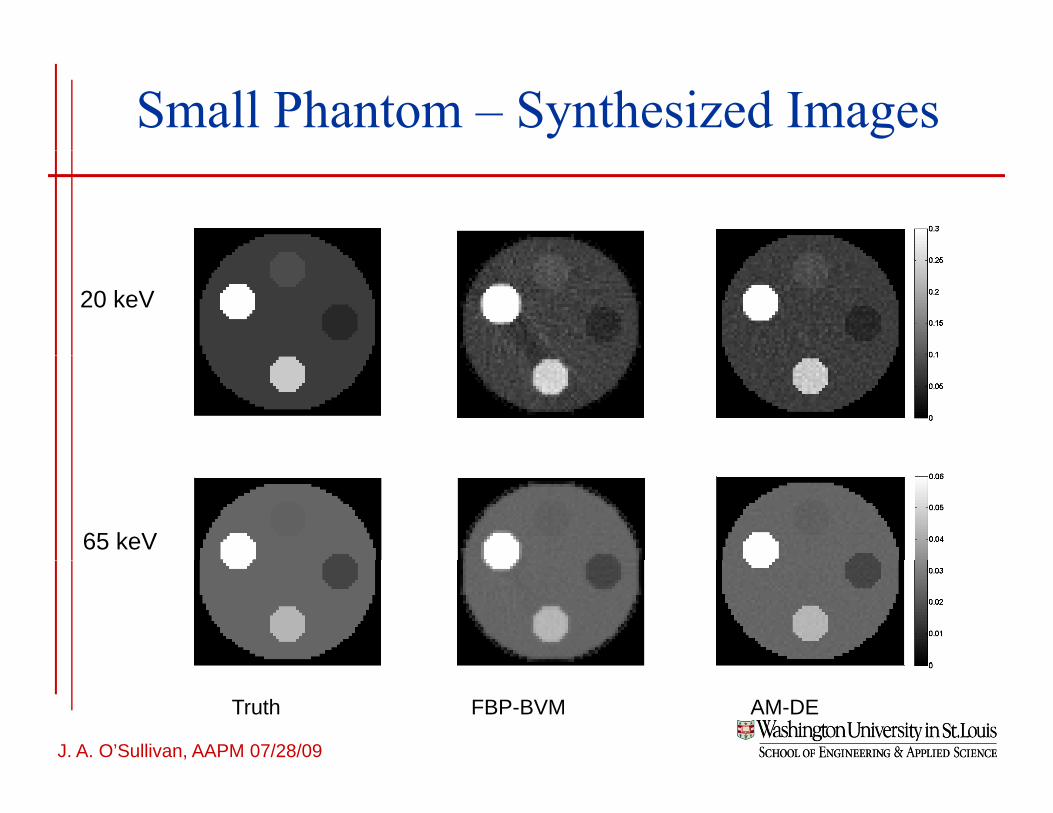
Small Phantom – Synthesized Images
20 keV
65 keV
J. A. O’Sullivan, AAPM 07/28/09P-20 Seminar, 3/12/05 R. M. Arthur
Truth FBP-BVM AM-DE

Small Phantom – 20keV profiles
J. A. O’Sullivan, AAPM 07/28/09P-20 Seminar, 3/12/05 R. M. Arthur

Small Phantom – 20keV ratio images and profilesimages and profiles
FBP-BVM AM-DE
J. A. O’Sullivan, AAPM 07/28/09P-20 Seminar, 3/12/05 R. M. Arthur

Small Phantom: Relative Errors I0 = 10 000I0 10,000
FBP-BVM AM-DE• Lucite – Center: A region of interest in the center of the phantom. • Lucite – Edge: A region of interest near the edge of the phantom, between Substance X and Teflon
J. A. O’Sullivan, AAPM 07/28/09P-20 Seminar, 3/12/05 R. M. Arthur
between Substance X and Teflon.• Relative error equals absolute difference divided by truth
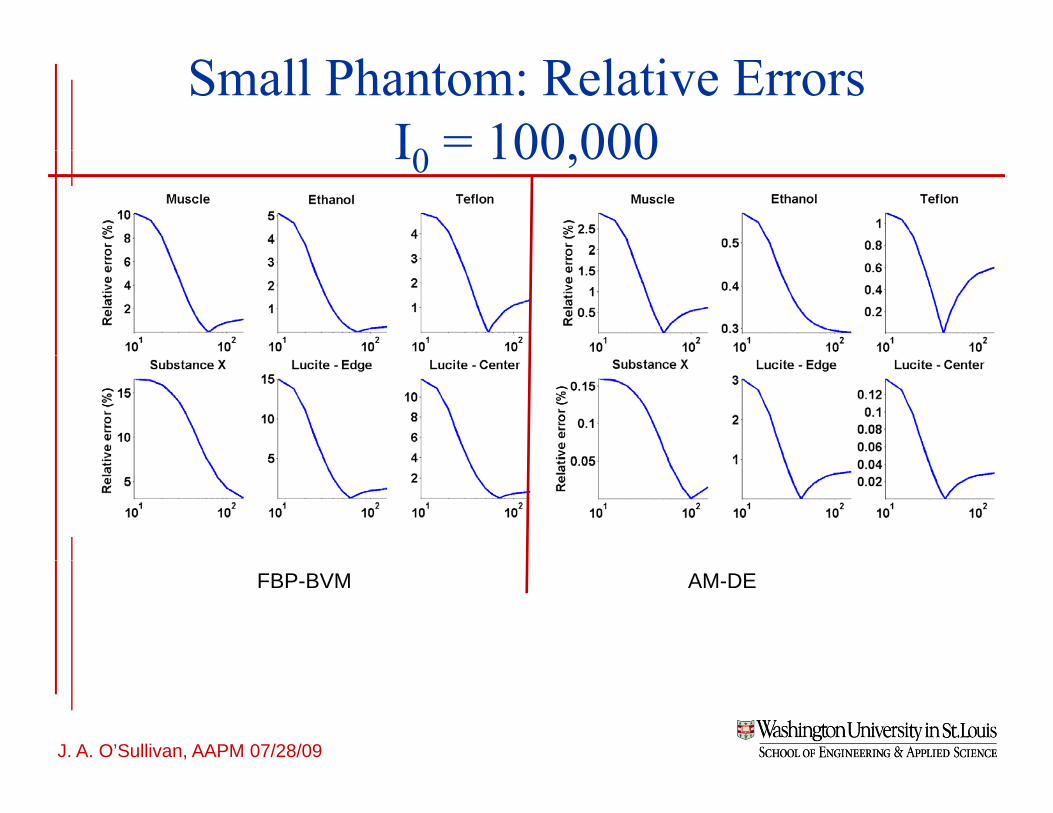
Small Phantom: Relative Errors I0 = 100 000I0 100,000
FBP-BVM AM-DE
J. A. O’Sullivan, AAPM 07/28/09P-20 Seminar, 3/12/05 R. M. Arthur
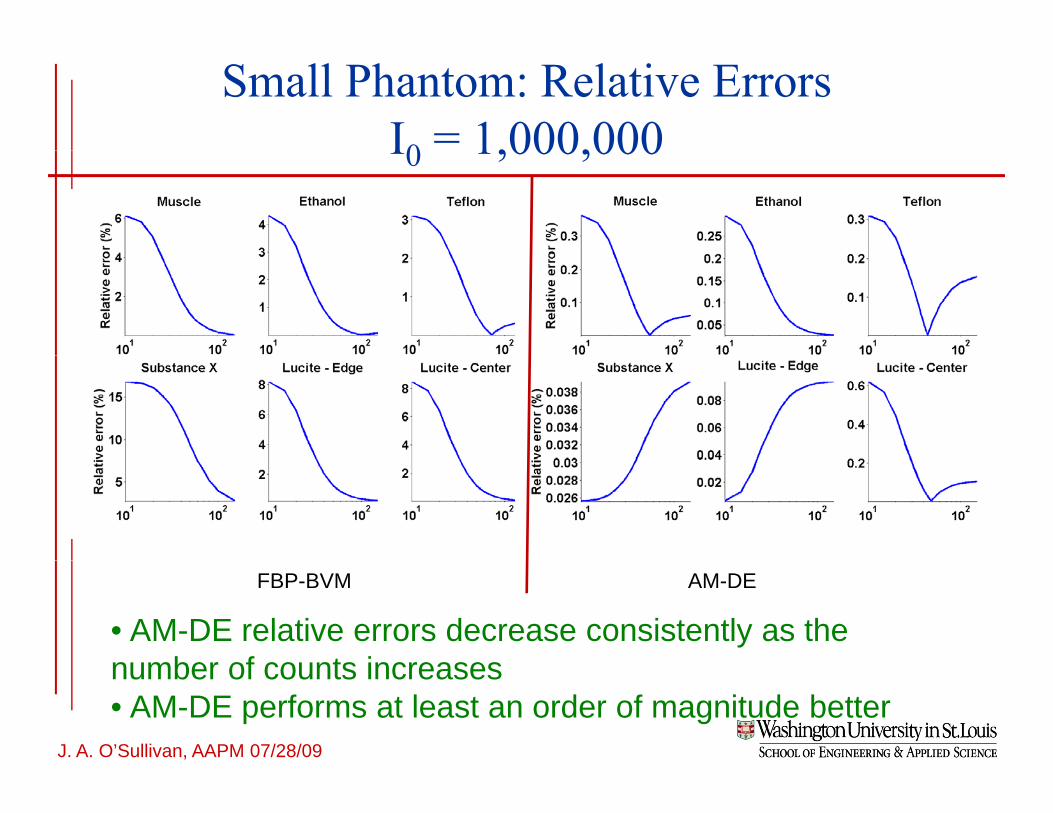
Small Phantom: Relative Errors I0 = 1,000,000I0 1,000,000
FBP-BVM AM-DE
• AM-DE relative errors decrease consistently as the number of counts increases
J. A. O’Sullivan, AAPM 07/28/09P-20 Seminar, 3/12/05 R. M. Arthur
number of counts increases • AM-DE performs at least an order of magnitude better
Dual Energy CT Image Reconstruction
• Data Models Reconstruction Algorithms
• Image Reconstruction ApproachesSOMATOM Definition CT Scannerccir.wustl.edu
– “Linear” Approaches– Statistical Iterative Reconstruction
f• Simulation Study of the Dual Energy Alternating Minimization AlgorithmP f Q tifi ti th C R• Performance Quantification: the Cramer-Rao Lower BoundConclusions
J. A. O’Sullivan, AAPM 07/28/09P-20 Seminar, 3/12/05 R. M. Arthur
• Conclusions

Small Phantom – Ensemble mean and variance (from 15 samples) I0 = 100,000 Styrene Componentp ) 0 y p
AM-DE
FBP-BVM
J. A. O’Sullivan, AAPM 07/28/09P-20 Seminar, 3/12/05 R. M. Arthur
Truth Mean Variance

Small Phantom – Ensemble mean and variance (from 15 samples) I0 = 100,000 Ca. Chloride Componentp ) 0 p
Variance is inversely proportional to I0
AM-DE
FBP-BVM
J. A. O’Sullivan, AAPM 07/28/09P-20 Seminar, 3/12/05 R. M. Arthur
Truth Mean Variance
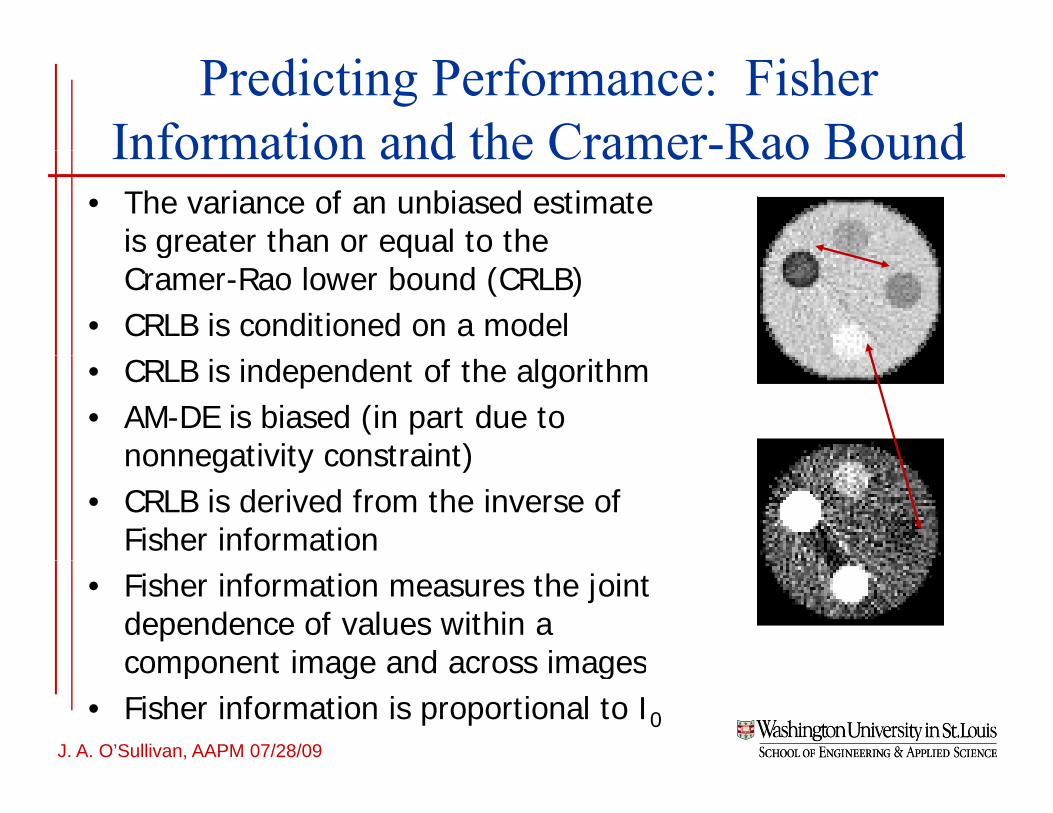
Predicting Performance: Fisher Information and the Cramer-Rao BoundInformation and the Cramer Rao Bound
• The variance of an unbiased estimate is greater than or equal to the g qCramer-Rao lower bound (CRLB)
• CRLB is conditioned on a model• CRLB is independent of the algorithm• AM-DE is biased (in part due to
nonnegativity constraint)nonnegativity constraint)• CRLB is derived from the inverse of
Fisher information• Fisher information measures the joint
dependence of values within a component image and across images
J. A. O’Sullivan, AAPM 07/28/09P-20 Seminar, 3/12/05 R. M. Arthur
component image and across images• Fisher information is proportional to I0

Fisher Information: Within a Component ImageComponent Image
Calcium chlorideMaximum 1.2E5
StyreneMaximum 1.6E4
J. A. O’Sullivan, AAPM 07/28/09P-20 Seminar, 3/12/05 R. M. Arthur

Fisher Information: Across ImagesAcross Images
Maximum 4.2E4
J. A. O’Sullivan, AAPM 07/28/09P-20 Seminar, 3/12/05 R. M. Arthur

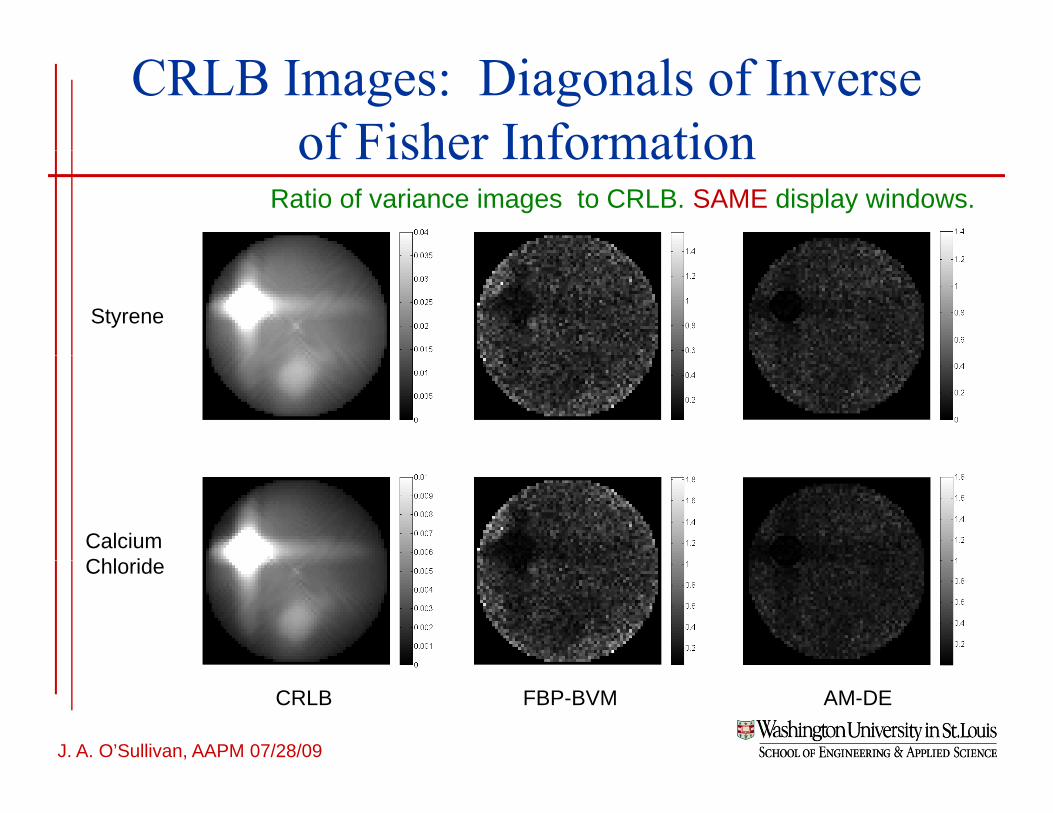
CRLB Images: Diagonals of Inverse of Fisher Informationof Fisher Information
Ratio of variance images to CRLB. Different display windows.
Styrene
CalciumChl idChloride
J. A. O’Sullivan, AAPM 07/28/09P-20 Seminar, 3/12/05 R. M. Arthur
CRLB FBP-BVM AM-DE
CRLB Images: Diagonals of Inverse of Fisher Informationof Fisher Information
Ratio of variance images to CRLB. SAME display windows.
Styrene
CalciumChl idChloride
J. A. O’Sullivan, AAPM 07/28/09P-20 Seminar, 3/12/05 R. M. Arthur
CRLB FBP-BVM AM-DE
Conclusions
• Reviewed Models for CT Image ReconstructionO tli d V i A h f D l E CT• Outlined Various Approaches for Dual Energy CT Image Reconstruction
• Summarized a Simulation Study ShowingSummarized a Simulation Study Showing Performance of a Dual Energy Alternating Minimization Algorithm O tli d d A li d M th d f Q tif i• Outlined and Applied a Method for Quantifying Achievable Performance Based on Fisher Information
• Quantitative Analysis Shows Benefit of AM-DEQuantitative Analysis Shows Benefit of AM DE algorithm
• AM-DE Algorithm is Computationally Demanding
J. A. O’Sullivan, AAPM 07/28/09P-20 Seminar, 3/12/05 R. M. Arthur
• Other Work: Quantify Impact of Modeling Errors

J. A. O’Sullivan, AAPM 07/28/09P-20 Seminar, 3/12/05 R. M. Arthur
References• J. F. Williamson et al., “Prospects for quantitative computed
tomography imaging in the presence of foreign metal bodies using statistical image reconstruction ” Med Phys 2910 2404using statistical image reconstruction, Med. Phys. 2910, 2404-2418 2002
• J. F. Williamson, S. Li, B. R. Whiting, and F. A. Lerma, “On two-parameter representations of photon cross section: Application t d l CT i i ” M di l Ph i l 33 4115to dual energy CT imaging,” Medical Physics, vol. 33, pp. 4115-4129, November 2006
• J. A. O’Sullivan and J. Benac, “Alternating minimization algorithms for transmission tomography,” IEEE Transactions on g g p y,Medical Imaging, vol. 26, pp. 283-297, March 2007
• J. Benac, “Alternating minimization algorithms for x-ray computed tomography: multigrid acceleration and dual energy.” PhD thesis Washington University in St Louis St Louis 2005PhD thesis, Washington University in St. Louis, St. Louis, 2005
• J. Benac, J. A. O’Sullivan, and J. F. Williamson, “Alternating minimization algorithm for dual energy X-ray CT,” in Proc. IEEE Int. Symp. Biomedical Imag., Arlington, VA, Apr. 2004, pp. 579582
J. A. O’Sullivan, AAPM 07/28/09P-20 Seminar, 3/12/05 R. M. Arthur
579582
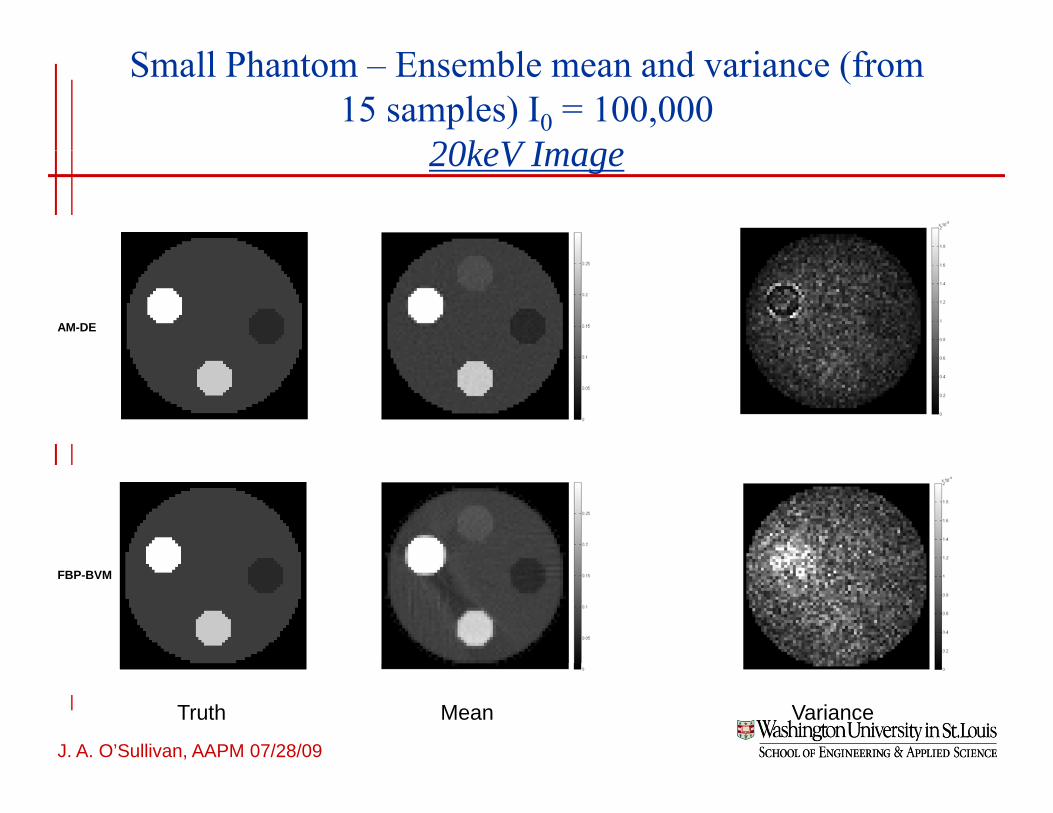
Small Phantom – Ensemble mean and variance (from 15 samples) I0 = 100,000
20keV Image20keV Image
AM-DE
FBP-BVM
J. A. O’Sullivan, AAPM 07/28/09P-20 Seminar, 3/12/05 R. M. Arthur
Truth Mean Variance
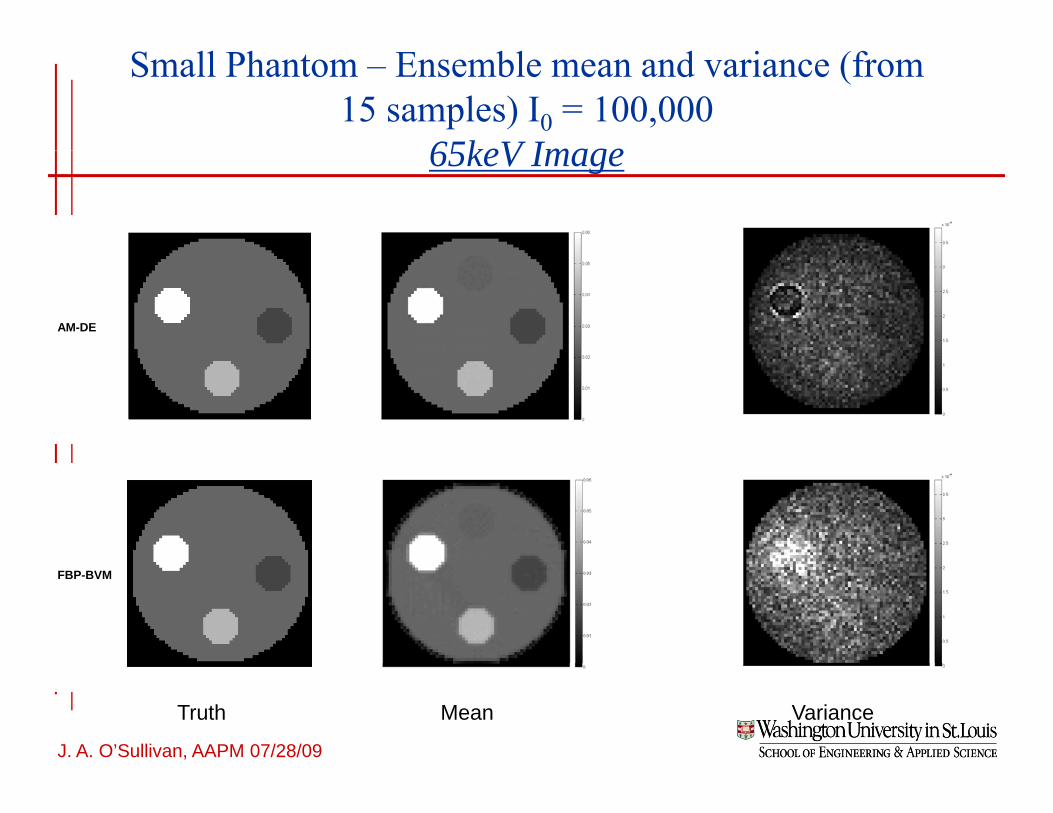
Small Phantom – Ensemble mean and variance (from 15 samples) I0 = 100,000
65keV Image65keV Image
AM-DE
FBP-BVM
J. A. O’Sullivan, AAPM 07/28/09P-20 Seminar, 3/12/05 R. M. Arthur
Truth Mean Variance

CRLB images for 20keV (above) and 65keV (below) imagesand 65keV (below) images
0.016
1.6
0.55
0.006
0.008
0.01
0.012
0.014
0 6
0.8
1
1.2
1.4
0 2
0.25
0.3
0.35
0.4
0.45
0.5
0
0.002
0.004
0.2
0.4
0.6
0.05
0.1
0.15
0.2
2
2.5
3
x 10−3
1
1.2
1.4
1.6
0.35
0.4
0.45
0.5
0.55
0.5
1
1.5
0.2
0.4
0.6
0.8
0.05
0.1
0.15
0.2
0.25
0.3
J. A. O’Sullivan, AAPM 07/28/09P-20 Seminar, 3/12/05 R. M. Arthur
CRLB
Var / CRLB
FBP-BVM AM-DE
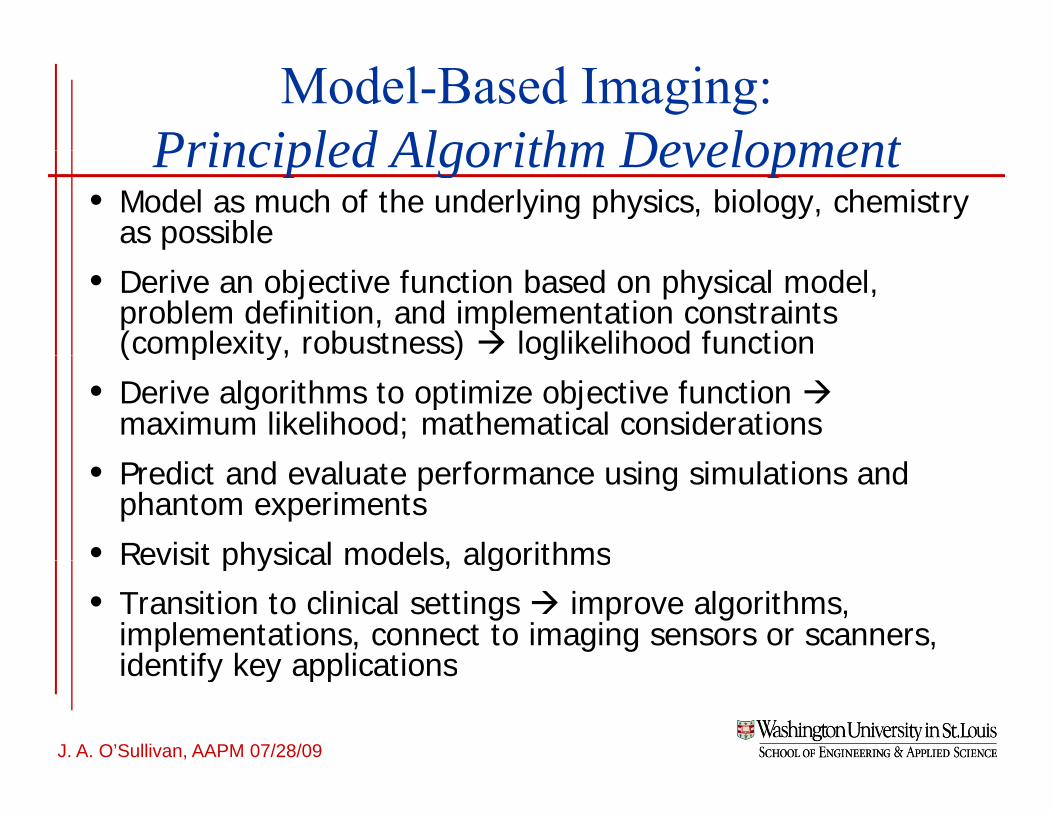
Model-Based Imaging:Principled Algorithm DevelopmentPrincipled Algorithm Development
• Model as much of the underlying physics, biology, chemistry as possible
• Derive an objective function based on physical model, problem definition, and implementation constraints (complexity, robustness) loglikelihood function( p y, ) g
• Derive algorithms to optimize objective function maximum likelihood; mathematical considerations
• Predict and evaluate performance using simulations and phantom experiments
• Revisit physical models, algorithmsRevisit physical models, algorithms• Transition to clinical settings improve algorithms,
implementations, connect to imaging sensors or scanners, identify key applications
J. A. O’Sullivan, AAPM 07/28/09P-20 Seminar, 3/12/05 R. M. Arthur
identify key applications