Embed Size (px)
Citation preview

P O S I V A O Y
FI -27160 OLKILUOTO, F INLAND
Tel +358-2-8372 31
Fax +358-2-8372 3709
Antt i Öhberg
Eero He ikk inen
Hanne le H i rvonen
K immo Kemppa inen
Johan Ma japuro
Juha N iemonen
Jar i Pö l l änen
Pekka Rouh ia i nen
March 2006
Work ing Repor t 2006 -20
Drilling and the AssociatedBorehole Measurementsof the Pilot Hole ONK-PH3

March 2006
Working Reports contain information on work in progress
or pending completion.
Ed i to r : Antt i Öhberg
Saan io & R i ekko l a Oy
Eero He ikk inen
JP-F in t ac t Oy
Hanne le H i rvonen
Teo l l i suuden Vo ima Oy
K immo Kemppa inen
Pos i va Oy
Johan Ma japuro
Suomen Ma lm i Oy
Juha N iemonen
Oy Ka l a j oen T iman t t i ka i r aus Ab
Jar i Pö l l änen , Pekka Rouh ia inen
PRG-Tec Oy
Work ing Repor t 2006 -20
Drilling and the AssociatedBorehole Measurementsof the Pilot Hole ONK-PH3


DRILLING AND THE ASSOCIATED BOREHOLE MEASUREMENTS OF THE PILOT HOLE ONK-PH3
ABSTRACT
The construction of the ONKALO access tunnel started in September 2004 at Olkiluoto. Most of the investigations related to the construction of the access tunnel aim to ensure successful excavations, reinforcement and sealing. Pilot holes are boreholes, which are core drilled along the tunnel profile. The length of the pilot holes typically varies from several tens of metres to a couple of hundred metres. The pilot holes will mostly aim to confirm the quality of the rock mass for tunnel construction, and in particular at identifying water conductive fractured zones and at providing information that could result in modifications of the existing construction plans.
The pilot hole ONK-PH3 was drilled in September 2005. The length of the borehole is 145.04 metres. The aim during the drilling work was to orientate core samples as much as possible. The deviation of the borehole was measured during and after the drilling phase. Electric conductivity was measured from the collected returning water samples.
Logging of the core samples included the following parameters: lithology, foliation, fracturing, fracture frequency, RQD, fractured zones, core loss and weathering. The rock mechanical logging was based on Q-classification. The tests to determine rock strength and deformation properties were made with a Rock Tester-equipment.
Difference Flow method was used for the determination of hydraulic conductivity in fractures and fractured zones in the borehole. The overlapping i.e. the detailed flow logging mode was used. The flow logging was performed with 0.5 m section length and with 0.1 m depth increments. Water loss tests (Lugeon tests) and a pressure build-up test were used to give background information for the grouting design.
Geophysical borehole logging and optical imaging surveys of the pilot hole PH3 included the field work of all the surveys, the integration of the data as well as interpretation of the acoustic and borehole radar data.
One of the objectives of the geochemical study was to get information of composition of ONKALO's groundwater before the construction will disturb the chemical condition. The groundwater samples were collected from the sampling section 102.09 - 144.91 m. The collected groundwater samples were analysed in different laboratories.
Keywords: pilot hole, core drilling, borehole measurements, geophysical borehole logging, geochemical sampling, flow logging


PILOTTIREIÄN ONK-PH3 KAIRAUS JA REIKÄTUTKIMUKSET
TIIVISTELMÄ
ONKALOn ajotunnelin rakentaminen aloitettiin Olkiluodossa syyskuussa 2004. Useimmat ajotunnelin rakentamisen aikaiset tutkimukset liittyvät louhinnan, lujituksen ja injektoinnin suunnitteluun. Pilottireikien, jotka kairataan tunnelin profiiliin, pituus vaihtelee tyypillisesti muutamien kymmenien metrien ja muutaman sadan metrin välillä. Pilottireikien avulla varmistutaan kalliomassan laadusta ennen sen louhimista. Pilotti-reikien avulla tunnistetaan vettäjohtavat rakenteet ja niistä saatavalla tiedolla voidaan modifioida olemassa olevia louhintasuunnitelmia.
Pilottireikä ONK-PH3 kairattiin syyskuussa 2005. Reiän pituus on noin 145,04 m. Kairauksen tavoitteena oli saada mahdollisimman paljon näytteestä suunnattuna. Si-vusuunta ja taipuma mitattiin kairauksen aikana ja sen jälkeen. Sähkönjohtavuus mitat-tiin reiästä palautuvasta reikävedestä otetuista vesinäytteistä.
Kallionäytteen kartoitus käsitti seuraavat parametrit: litologia, liuskeisuus, rakoilu, ra-koluku, RQD, rikkonaisuusvyöhykkeet, näytehukka ja rapautuneisuus. Kalliomekaani-nen raportointi perustui Q-luokitukseen. Kiven lujuus- ja muodonmuutosparametrit määritettiin Rock Tester -laitteistolla.
Rakojen sekä rakovyöhykkeiden vedenjohtavuus mitattiin virtausmittarilla eromittaus-menetelmällä käyttäen rakohakumoodia. Mittausvälin pituus oli 0,5 m ja pisteväli 0,1 m. Vesimenekkitestejä (Lugeon-testi) ja painekoetta (“pressure build-up test”) käy-tettiin kallion injektoinnin suunnitteluun.
Reikägeofysiikan mittausten ja reiän optisen kuvantamisen lisäksi saatuja tuloksia on integroitu ja akustisen menetelmän ja reikätutkan data on tulkittu.
Geokemian näytteenoton tavoitteena oli saada lisätietoa ONKALOn pohjaveden koos-tumuksesta ennen pohjaveden tilaa häiritsevää louhintaa. Näytteet otettiin reikäväliltä 102,09 - 144,91 m. Kerätyt vesinäytteet analysoitiin eri laboratorioissa.
Avainsanat: pilottireikä, kallionäytekairaus, reikämittaukset, geofysikaaliset reikämit-taukset, geokemian näytteenotto, virtausmittaus


FOREWORD
In this report the results of drilling pilot hole ONK-PH3 and the associated borehole investigations are presented. Oy Kalajoen Timanttikairaus Ab (Oy Kati Ab) as the subcontractor of Kalliorakennus Oy drilled the pilot hole and answered for water loss tests. Posiva carried out the geological logging of the drill core as well as water samplings and pressure build-up test.
Hydraulic flow measurements were assigned to PRG-Tec Oy. Suomen Malmi Oy was assigned the geophysical borehole surveys and the rock mechanical tests on drill core samples.
The following persons have contributed to the compilation of this report: section 1 Antti Öhberg/Saanio & Riekkola Oy, section 2 Juha Niemonen/Oy Kati Ab, section 3 Kimmo Kemppainen/Posiva Oy, section 4; (4.1) Antti Öhberg/Saanio & Riekkola Oy; (4.2) Kimmo Kemppainen/Posiva Oy; (4.3) Tauno Rautio/Suomen Malmi Oy), section 5 (5.1) Antti Öhberg/Saanio & Riekkola Oy; (5.2) Jari Pöllänen and Pekka Rouhiai-nen/PRG-Tec Oy; (5.3) Juha Niemonen/Oy Kati Ab; (5.4) Johanna Hansen/Posiva Oy, section 6 Johan Majapuro/Suomen Malmi Oy and Eero Heikkinen/JP-Fintact Oy, section 7 Hannele Hirvonen/TVO Oy and section 8 Antti Öhberg/Saanio & Riekkola Oy.
This report was prepared for publication by Helka Suomi from Posiva Oy.


1
TABLE OF CONTENTS
ABSTRACT TIIVISTELMÄFOREWORD
1 INTRODUCTION................................................................................................... 32.1 General ........................................................................................................ 52.2 Equipment .................................................................................................... 52.3 Mobilization and preparing to work .............................................................. 62.4 Drilling work.................................................................................................. 62.5 Deviation surveys......................................................................................... 82.6 Electric Conductivity surveys ....................................................................... 82.7 Demobilization.............................................................................................. 8
3 GEOLOGICAL LOGGING ..................................................................................... 93.1 General ........................................................................................................ 93.2 Lithology....................................................................................................... 93.3 Foliation........................................................................................................ 93.4 Fracturing ................................................................................................... 113.5 Fracture frequency and RQD ..................................................................... 173.6 Fractured zones and core loss................................................................... 183.7 Weathering................................................................................................. 18
4 ROCK MECHANICS ........................................................................................... 214.1 General ...................................................................................................... 214.2 Q-classification........................................................................................... 214.3 Rock mechanical field tests on core samples ............................................ 24
4.3.1 Description of tests ......................................................................... 244.3.2 Strength and elastic properties....................................................... 26
5 HYDRAULIC MEASUREMENTS ........................................................................ 295.1 General ...................................................................................................... 295.2 Flow logging ............................................................................................... 29
5.2.1 Principles of measurement and interpretation ................................ 295.2.2 Equipment specifications................................................................ 375.2.3 Description of the data set.............................................................. 38
5.3 Water loss tests (Lugeon tests).................................................................. 395.4 Pressure build-up test ................................................................................ 39
6 GEOPHYSICAL LOGGINGS .............................................................................. 416.1 General ...................................................................................................... 416.2 Equipment and methods ............................................................................ 41
6.2.1 WellMac equipment ........................................................................ 416.2.2 Rautaruukki equipment................................................................... 426.2.3 Geovista Normal resistivity sonde .................................................. 426.2.4 RAMAC equipment......................................................................... 426.2.5 Sonic equipment............................................................................. 436.2.6 Optical televiewer ........................................................................... 43

2
6.3 Fieldwork.................................................................................................... 456.4 Processing and results............................................................................... 46
6.4.1 Natural gamma radiation ................................................................ 466.4.2 Gamma-gamma density ................................................................. 476.4.3 Magnetic susceptibility.................................................................... 476.4.4 Single point resistance ................................................................... 476.4.5 Wenner resistivity ........................................................................... 476.4.6 Borehole radar................................................................................ 476.4.7 Full Waveform Sonic ...................................................................... 486.4.8 Borehole image .............................................................................. 49
6.5 Conclusions................................................................................................ 49
7 GROUNDWATER SAMPLING AND ANALYSES ............................................... 517.1 General ...................................................................................................... 517.2 Equipment and method .............................................................................. 517.3 Groundwater sampling ............................................................................... 517.4 Laboratory analysis .................................................................................... 537.5 Analysis results .......................................................................................... 53
7.5.1 Physico-chemical properties........................................................... 537.5.2 Results............................................................................................ 53
7.6 Representativeness of the samples ........................................................... 557.6.1 Charge balance .............................................................................. 557.6.2 Uncertainties of the laboratory analyses ........................................ 55
8 SUMMARY .......................................................................................................... 57
REFERENCES ............................................................................................................. 59
APPENDICES............................................................................................................... 63

3
1 INTRODUCTION
The construction of the ONKALO access tunnel started in September 2004. The investigations during the construction of the access tunnel will provide complementary and detailed information about the host rock and will also include monitoring of disturbances caused by the construction activities. Most of these investigations related to construction aim to ensure successful excavations, reinforcement and sealing and are also used in ordinary tunnelling projects. Some of the investigations are specific for this project, such as the pilot core holes along the tunnel profile. The location of ONKALO is presented in Figure 1-1.
When the access tunnel progresses deeper, specific attention will be paid to the impact of high groundwater pressure on the construction and investigations activities. Investigations essential for the construction activities can be divided into probing, mapping and drilling of pilot core holes. Again, most information acquired for construction purposes will be essential also for the site characterisation. Additional investigations for pure characterisation purposes will also be carried out.
Pilot holes are cored boreholes to be drilled along the tunnel profile. The length of the pilot core holes typically varies from several tens of metres to a couple of hundred metres. The pilot holes will mostly aim to confirm the quality of the rock mass for tunnel construction, and in particular at identifying water conductive fractured zones and at providing information that could result in modifications of the existing construction plans (i.e. they are an integral part of coordinated investigation, design and construction activities). The pilot holes will also be used for the comparison of the drill core and the tunnel sidewall mapping, particularly on the characterisation levels.
The first pilot hole PH1 was core drilled from the surface prior to the excavation work of the ONKALO access tunnel. The pilot hole PH1 reached its final depth, 160.08 m, in January 2004 (Niinimäki 2004). The second pilot hole PH2 reached its final depth, 122.31 m, in December 2004 (Öhberg at al. 2005). The third pilot hole PH3, which is described in this report, was core drilled in September 2005, Table 1-1.
Furthermore, at the repository construction phase, long pilot holes (200 - 250 m) will likely play an important role in the assessment of rock mass conditions before the disposal tunnels are excavated. For this reason, it is important to gain as much experience as possible of their use at a stage as early as possible. A number of pilot holes will thus be drilled already in parts of the access tunnel. Decisions on the location of these pilot holes will be based on the bedrock model and other relevant data, possibly assisted by statistical analyses. Such boreholes may, for example, be drilled into major fractured zones or other structures of interest.
Pilot holes are planned to cover only those sections of the access tunnel, where it will intersect significant structures based on the bedrock model. According to the current bedrock model (Vaittinen et al. 2003) and the latest layout about 1200 m of pilot holes are needed above the main characterisation level. The pilot holes in ONKALO will be drilled inside the tunnel profile to avoid disturbances in the surrounding rock mass (Posiva Oy 2003).

4
Pilot holes will play an important role on the main characterisation level to prevent the tunnels from unexpectedly intersecting fractured zones, which would result in large groundwater inflows, and to make it possible to consider such intersections in advance and carry out appropriate pre-grouting. According to the current plans all the research tunnels need to be explored by means of pilot holes before construction. Pilot holes are also fundamental for acquiring reliable in-situ data on the host rock. The boreholes must be designed, assessed and constructed so that disturbances to the host rock (e.g. undesirable hydraulic connections, uncontrolled leakages, etc.) are minimised and the natural integrity of the host rock is not jeopardised.
In this report the term “borehole depth” is defined as borehole length from the tunnel face.
Figure 1-1. The location of ONKALO at Olkiluoto.
Table 1-1. Timetable of drilling PH3 and the associated measurements.
Activity Duration Start End September 2005(h) (ddmmyy) (ddmmyy) 6 7 8 9 1 0 1 1 1 2 1 3 1 4 1 5 1 6
* Drilling 98 60905 100905* Flow logging 12 100905 110905* Water sampling 30 110905 120905* Press. build-up 1 120905 120905* Boreh. imaging 15 120905 130905* Geophysics 20 130905 130905* Water loss 45 130905 160905

5
2 CORE DRILLING
2.1 General
The aim of the drilling work was to drill a 140 m long core drilled borehole ONK-PH3 (later PH3) inside the ONKALO access tunnel profile. The tunnel profile at the starting point of the pilot hole was 10 m wide and 7 m high and after chainage 700, the tunnel profile was changed to a 5.6 m wide and 5 m high. The gradient of the tunnel was 1: -10 (-5.7 degrees). The planned starting point for the pilot hole was at the chainage 700 and the target point at the chainage 840, Figure 2-1. The actual starting point was at the chainage 696.87 and the actual ending point about 145 m ahead at the chainage 841.78. The main purpose of the drilling was to acquire and adjust the geological, geophysical and rock mechanical knowledge prior to the excavation of the tunnel into the area.
Figure 2-1. The planned position of borehole PH3 in chainage interval from 700 to
840.
2.2 Equipment
The pilot hole PH3 was drilled with a fully hydraulic ONRAM-1000/4 rig powered by electric motor. The drill rig and working base was installed on Mercedes Benz truck, Figure 2-2. The list of equipment at the site is presented in Appendix 2.1.
Hagby-Asahi’s wireline drill rods (wl-76) and a 3-metre triple tube core barrel were used in this work. The diameter of the hole is 76.3 mm and diameter of core sample is 51.0 mm. Triple tube coring enables undisturbed core sampling from broken rock and fracture fillings. The inner tube can be opened and the undisturbed sample can be taken out from the inner tube.

6
Figure 2-2. The drill rig and working base are installed on a truck.
2.3 Mobilization and preparing to work
The rig was mobilized to Olkiluoto on the 5th of September in 2005. After unloading the rig was moved into the access tunnel of ONKALO and installed to the site. A surveying contractor (Prismarit Oy) checked the orientation of the rig and collaring the hole was started on the 6th of September by casing drilling.
2.4 Drilling work
Core drilling started on the 6th of September after preliminary preparations. Initial azimuth of the borehole was 225 degrees and initial dip –5.8 degrees, Table 2-1. The drilling contractor, Oy Kati Ab, was prepared to orientate the borehole according to the demands (the pilot hole must stay inside the tunnel profile) appointed by Posiva Oy. The orientation was planned to be done by using a wedge. One wedge would have bended the hole approximately 1.0-1.5 degrees. The drilling contractor was also

7
prepared to use directional drilling equipment, owned by Liwingstone AB. The deviation of the borehole was measured with two different devices. After drilling of every run, the dip of the borehole was measured, and additionally, after every 25 metres the azimuth and the dip were measured with Flexit smart tool. Flexit is an electronic multi-shot and single-shot system that uses the same methodology as the EMS system.
Table 2-1. The starting point coordinates and orientation of PH3.
PH3 Northing Easting Elevation Direction (o) Dip (o) Chainage
Planned 6792048.274 1526128.026 -59.775 225 -5,71 695
Measured 6792046.873 1526126.618 -59.976 225.1355 -5.843 696.87
The pilot hole was planned to be drilled to the chainage 840 (the final borehole depth was 145.04 m). The pilot hole reached the chainage 841.78 in the end of the hole. The drilling work was completed normally as anticipated. The path of the hole was inside the tolerances and no orientation work was needed.
Drilling work was carried out as 2 shift work (á 12 h). The crew in a shift consisted of a driller and an assistant driller. Surveyor completed deviation surveys and drilling manager superintended the work.
Drill core samples were wrapped into aluminium foil and placed in wooden core boxes. Before closing the aluminium wrap the boxes were photographed with a digital camera. After each run the hole depth was marked on a wooden block wrapped into aluminium foil as well.
The hole was completed in 56 runs, Appendix 2.2. Average length of a run was 2.59 metres. The drilling report sheet is presented in Appendix 2.3.
The flushing water was labelled. The label substance uranine (sodium fluorescein) was readily mixed by Posiva Oy into the water taken from the tunnel waterline. The sample from the water returning from the hole was taken during every drill run. Altogether 53 water samples were collected for electric conductivity measurements. Once a day one sample of labelled water was collected from the waterline for analysis in TVO´s laboratory. That water sample was collected into a brown glass bottle wrapped into aluminium foil to prevent degradation of label substance. During the drilling operation 100.01 m3 of water was used and 83.87 m3 of water returned from the hole.
The casing was drilled to the depth of 0.50 m. The casing was cemented into place with aluminate cement. The casing was cemented into the tunnel face with aluminate cement (Ciment Fondu La Farge) the volume of which was about 6 litres. The volume of 0.5 dl of Accelerating agent (Ciment Fondu) was added to the mixture. Down to the final borehole depth of 145.04 metres the rock was normal and drilling progressed normally.
The hole was washed and cleaned with a steel brush and water jet directed to the borehole walls through the holes drilled in the brush frame made of stainless steel. The used water pressure was 40 bars. The rods were lowered slowly downwards and the

8
rods were rotated simultaneously. During the cleaning and washing operation 7.01 m3
of labelled water was used.
2.5 Deviation surveys
The deviation survey was completed by about 25 metres intervals with Flexit tool in order to monitor the straightness of the hole and to ensure that the hole was inside the planned tunnel profile. The hole went straight and wedging or steering was not needed.
The survey tools were pumped to the bottom with wire-line water pump and the survey was completed by pulling the tool upwards in three metres intervals with wire-line winch. Inclination measurement with a dip tool was done after every run.
The deviation survey was carried out with Maxibor device in borehole depths 79.89 metres and 145.04 metres.
The results of the final survey with Flexit tool indicate that the hole was deviated 3.31 metres right and 0.98 metres down at the borehole depth of 144.00 metres. Deviation survey with Maxibor tool showed deviation of 0.90 m right and 0.98 metres down at the same borehole depth. The big difference in the horizontal component of deviation is caused by magnetic anomalies in the rock. Flexit is based on the earth´s magnetic field and magnetic anomalies will cause errors in results. The results of deviation survey by Flexit tool is given in Appendix 2.4. The deviation survey by Maxibor tool is presented in Appendix 2.5 and the inclination surveys with EZ-DIP tool in Appendix 2.6.
2.6 Electric Conductivity surveys
The collected 53 water samples from returning water were measured with a Pioneer Ion Check 65 conductivity meter. The meter was calibrated according to the conductivity standard (Unidose Radiometer analytical 1000 µS/cm) and the conductivity values are temperature corrected to 20°C. The conductivity readings are presented in Appendix 2.7.
2.7 Demobilization
Demobilization of the rig took place after water loss tests, the last field activity in PH3, on Sept. 16, 2005.

9
3 GEOLOGICAL LOGGING
3.1 General
The core logging follows essentially normal Posiva logging procedure, which was used in previous core drilling programme at Olkiluoto. The logging consists among other things tables of lithology, foliation, fracturing, and fractured zones, weathering, rock quality and kinematical intersections. The wooden core boxes were transported to Posiva’s core archive, where geologists, from Posiva and Geological Survey of Finland, carried out geological core logging as on-line mapping during drilling. After logging digital photos were taken and core samples were selected for rock mechanical field- testing. The core box numbers and the photographs of rock samples in the core boxes are provided in Appendices 3.10 and 3.11, respectively.
3.2 Lithology
The lithological classification used in the mapping follows the classification developed by Kärki & Paulamäki (2005). In this classification, metamorphic gneisses are separated into veined- (VGN), stromatic- (SGN), diatexitic- (DGN), mica- (MGN), mafic- (MFGN), quartz- (QGN) and tonalitic-granodioritic-granitic (TGG) gneisses). The metamorphic rocks form a compositional series that can be separated by rock texture and the proportion of neosome. Igneous rock names used in the classification are coarse-grained pegmatitic granite and diabase.
The core-drilled sample mainly consists of diatexitic gneiss (62.7 %) but also pegmatitic granite (25.5 %), veined gneiss (7.8 %) and mafic-, mica- and quartz gneiss (1-2 %) sections occur (Appendix 3.1). In diatexitic gneiss neosome content varies between 50-80 %. The neosome is irregular or gneiss-like. Diatexitic gneisses are medium grained - the grain size varies between 1 and 5 mm. Kaolinite and pinite are common alteration products in the major rock types. Pegmatitic granite sections occur in diatexitic gneisses. The length varies from 0.5 to 7.5 m. Pegmatitic granites are normally coarse-grained and weathering degree is low. Pinite and kaolinite spots are common.
Mica-, mafic- or quartz gneisses occur as inclusions and intersections vary from 0.5 to 2.5 m. The inclusions are normally fine grained and massive, some leucosome bands are also present.
3.3 Foliation
Foliation measurements were carried out systematically in one metre intervals. A total of 145 foliation observations were performed and 83 of these were orientated using borehole image. The reason for lacking orientation data was the irregular foliation (diatexitic gneiss) or massive (pegmatitic granite) sections of the core. The measured foliation orientations are shown as a stereogram in Figure 3-1 and presented in Appendix 3.2. From Figure 3-1 it is obvious that the dominant orientation of foliation is dipping moderately to east.

10
Figure 3-1. Measured foliation orientations of PH3 on a lower hemisphere projection.
The trend of the pilot hole is shown as a black line.
Foliation type was estimated visually in one metre intervals and classified into five categories:
MAS = massive GNE = gneissic BAN = banded SCH = schistose IRR = irregular
The gneissic type (GNE) corresponds to a rock dominated by quartz and feldspars, micas and amphiboles occur only as minor constituents. Banded foliation type (BAN) consists of intercalated gneissic and schistose layers, which are either separated or discontinuous layers of micas or amphiboles. Schistose type (SCH) is dominated by micas or amphiboles, which have a strong preferred orientation. Massive (MAS) corresponds to massive rock with no visible orientations and irregular (IRR) to folded or chaotic rock.
Typically foliation is gneissic (71 % of orientated core) in PH3 samples, but also irregular (18 %), banded (10 %) and schistose (1 %) types are recorded.
The intensity of the foliation is also based on visual estimation and classified into three categories:
0 = Massive or irregular 1 = Weakly foliated 2 = Moderately foliated 3 = Strongly foliated

11
The intensity in PH3 is mainly weak (71 % of orientated core) in every rock types. Often diatexitic gneiss and pegmatitic granites are massive or the foliation is irregular (18 %). The moderately foliated (11 %) sections occur in veined and mica gneisses.
3.4 Fracturing
Each fracture is described individually and attributes include among other things orientation, type, colour, fracture filling, surface shape and roughness. Also information for Q-classification is collected from each fracture, which means ratings for roughness and alteration.
The abbreviations used to describe the type of fracture are in accordance with the classification used by Suomen Malmi Oy (Niinimäki 2004) and are as follows:
op = open ti = tight, no filling material fi = filled fisl = filled slickensided grfi = grain filled clfi = clay filled
Filled fractures with intact surfaces were also described as closed or partly closed in the remarks column, corresponding to healed and partly healed fractures, respectively. The thickness of the filling was measured with an accuracy of 0.1 mm, where the value 0.1 mm typically corresponds to an opened foliation plane with a biotite surface. The recognition of fracture fillings is qualitative and is based on visual estimation. Where the recognition of the specified mineral facies was not possible, the mineral was described with a common mineral group name, such as clay and sulphide, in the fracture filling column. When it was possible to identify the sulphide, the name of the mineral was added to the remarks column. The list of the mineral abbreviations is based on fracture mineral database, which Kivitieto Oy has developed, Table 3-1.

12
Table 3-1. The mineral abbreviations.
Abbreviation Mineral Abbreviation Mineral
AN = analcime NA = nakrite KS = kaolinite + other
clay minerals HB = hydrobiotite
BT = biotite PA = palygorsgite LM = laumontite HE = hematite CC = calcite PB = galena MH = molybdenite IL = illite CU = chalcopyrite SK = pyrite MK = pyrrhotite IS = illite + other clay
minerals DO = dolomite SM = smectite MO = montmorillonite KA = kaolinite EP = epidote SR = sericite MP = black pigment KI = kaolinite + illlite FG = phlogopite SV = clay mineral MS = feldspar KL = chlorite GR = graphite VM = vermikulite MU = muscovite KM = K-feldspar GS = gismondite ZN = zinc blende
The fracture surface shape:
- Planar - Stepped - Undulated
The roughness of fracture surface:
- Rough - Smooth - Slickensided
In addition to this, the fracture morphology and fracture alteration were also classified according to the Q-system (Grimstad & Barton 1993). Fracture roughness was described with the joint roughness number, Jr (Table 3-2) and the fracture alteration with the joint alteration number Ja (Table 3-3), Appendix 3.3.

13
Table 3-2. The concise description of joint roughness number Jr (Grimstad & Barton
1993).
Jr Profile i) Rock wall contact or ii) Rock wall contact before 10 cm shear
4 SRO Discontinuous joint or rough and stepped 3 SSM Stepped smooth 2 SSL Stepped slickensided 3 URO Rough and undulating 2 USM Smooth and undulating 1,5 USL Slickensided and undulating 1,5 PRO Rough or irregular, planar 1 PSM Smooth, planar 0,5 PSL Slickensided, planar
Table 3-3. The concise description of joint alteration number Ja (Grimstad & Barton 1993).
Ja Rock wall contact 0,75 Tightly healed, hard, non-softening impermeable filling, i.e. quartz, or
epidote1 Unaltered joint walls, surface staining only. 2 Slightly altered joint walls. Non-softening mineral coatings, sandy
particles, clay-free disintegrated rock, etc. 3 Silty or sandy clay coatings, small clay fraction (non-softening) 4 Softening or low-friction clay mineral coatings, i.e. kaolinite, mica,
chlorite, talc, gypsum, and graphite, etc., and small quantities of swelling clays (discontinuous coatings, 1-2 mm or less in thickness.
Rock wall contact before 10 cm shear 4 Sandy particles, clay-free disintegrated rock, etc. 6 Strongly over-consolidated, non-softening clay mineral fillings
(continuous, <5 mm in thickness) 8 Medium or low over-consolidation, softening, claymineral filling
(continuous <5 mm in thickness) 8-12 Swelling clay filling, i.e. montmorillonite (continuous, <5 mm in
thickness). Value of Ja depends on percentage of swelling clay-sized particles, and access to water, etc.
Fracture surface colour was logged using the colour of the dominating fracture mineral or minerals (e.g. green, white). Existence of minor filling minerals usually causes some variation in the colour of the fracture surface. These shades were described as reddish or greenish, for example.

14
During the fracture mapping a total of 182 fractures were mapped, Appendix 3.4. Of these fractures, 167 fractures i.e. 91.8 % are filled. Six fractures have a slickensided surface (approximately 3.3 %), five fractures are tight with no filling material (2.7 %) and five fractures are grain-filled (2.7 %). The frequencies of fracture surface qualities and morphologies and both joint roughness and joint alteration numbers are shown as histograms in Figures 3.2-3.6.
The fracture fillings are most commonly kaolinite, carbonate, sulphides or chlorite. Minor occurrences of sericite and variable clay minerals (e.g. illite) were also recorded. Fracture surfaces filled with kaolinite and carbonate, are usually white or grey. Chlorite fillings usually have a black and greenish colour.
Fracture shape
1
149
32
0
20
40
60
80
100
120
140
160
stepped undulated planar
Figure 3-2. Histograms of fracture surface qualities.
Fracture roughness
152
24
6
0
20
40
60
80
100
120
140
160
rough smoot h slickensided
Figure 3-3. Histogram of fracture morphologies.

15
Joint roughness number
08
30
17
124
0
0
20
40
60
80
100
120
140
0.5 1 1.5 2 3 4
Figure 3-4. Histogram of joint roughness numbers.
Joint alteration number
0
46
29
42
61
2 1
0
10
20
30
40
50
60
70
0.75 1 2 3 4 5 6
Figure 3-5. Histogram of joint alteration numbers.
Fracture filling minerals in ONK-PH3
0 %
20 %
40 %
60 %
80 %
100 %
0-20 m 20-40 m 40-60 m 60-80 m 80-100 m 100-120 m 120-145 m
SV
SR
SK
MU
MS
MK
KV
KM
KL
KA
IL
IM
HE
GR
EP
CC
BT
Figure 3-6. Diagram of fracture filling minerals. Fracture logging data has been
divided to 20 m sections.

16
The fractures were orientated during mapping using oriented core and in-hole digital borehole images, Appendix 3.4 and 3.5. The aim during the drilling work was to orientate core samples as much as possible. During drilling 35 orientation marks were done, seven of those were rejected due to bad quality, Appendix 3.6. The total length of the oriented core is 99.70 m (69 %). From the oriented sections the fractures were orientated by measuring the core alpha and beta angles, Figure 3-7.
Figure 3-7. The fracture orientation measurements from orientated core. The core
alpha (α) angle measured relatively to core axis. The core beta (β) angle measured
clockwise relatively to reference line looking downward core axis in direction of
drilling. Figure modified from Rocscience Inc. Borehole orientation data pairs, Dips (v.
5.102) Help.
From not orientated borehole sections only the alpha angle could be determined. Accordingly, borehole image was used to orientate the fractures where possible. The method used to orientate is mentioned in the method column of the fracture table, Appendix 3.5.
The most common fracture direction is north-south trending and dipping moderately to east. Fracture orientations are partly coincident with the most common foliation directions. The directions are declination corrected and weighted based on the drill hole direction by Terzaghi correction method. Fracture orientations are shown on a lower hemisphere projection in Figure 3-8.

17
Figure 3-8. Fracture orientation data of all the orientated fractures on a lower
hemisphere projection. A is measurements from sample and B is from OBI-40 image.
The trend of the pilot hole is shown as a black line.
The fractures were classified by aperture, hydraulic condition, borehole image and flow logging, Appendix 3.5.
Accurate apertures are measured if possible, Appendix 3.5. The aperture is classified in five classes: 1. under determination limit 2. under 1 mm 3. 1-5 mm 4. 5-10 mm 5. > 10 mm
Hydraulic conditions of fractures are classified into two classes: leaking or not leaking. The first class is marked with “1” and the other class is marked with empty space. Hydraulic conditions are estimated from flow logging. This means visual comparison with cores and diagrams, Appendix 3.5.
3.5 Fracture frequency and RQD
Average fracture frequency along the borehole is 1.28 fractures/metre and the average RQD value is 97.89 %. Fracture frequency and RQD are shown graphically in Figure 3-9 and also presented in Appendix 3.7.

18
Fracture frequency and RQD
0
20
40
60
80
100
1 8
15
22
29
36
43
50
57
64
71
78
85
92
99
10
6
11
3
12
0
12
7
13
4
14
1
0
5
10
15
RQD % NAT_FRACTURES pieces/ m
Figure 3.9. Frequency of natural fractures and RQD along the pilot hole PH3.
3.6 Fractured zones and core loss
The fractured zones are classified as in RG-classification. Fractured or broken core are divided into four classes RiII, RiIII, RiIV and RiV and described in the Table 3-3.
Table 3-3. Fractured zone classification (Gardemeister et al. 1976, Saanio (ed.) 1987).
RiII Fractured section, where fracture frequency is 10 to 30 centimetres. RiIII Densely fractured section, where fracture frequency is less than 10
centimetres. RiIV Densely fractured section, where fracture frequency is less than 10
centimetres. Crust-structure with clay filled fractures. RiV Weak clay structure
Four fractured zones were intersected by the pilot hole, Appendix 3.8. The first fractured section (RiIII) was met at the borehole depth interval 19.30…20.35 metres, the second zone at the borehole depth interval 20.35…21.80 metres, which is classified as RiIV-Rk4 clay filled crust structure. These two are considered as one zone intersection, the dip direction of which is 80 degrees and the dip 80 degrees. The last two zones were intersected in depth sections 117.91…118.84 metres and 119.96…120.26 metres, both of them are classified as RiII fractured zones.
Core loss is indication of drilling problems or weak or fractured rock. In this pilot hole one core loss section was observed, in depth section 46.01…46.31 metres. The section is caused by a technical problem during drilling.
3.7 Weathering
The weathering degree of the drill core was classified according to the method developed by Korhonen et al. (1974) and Gardemeister et al. (1976) and the following abbreviations were used:

19
Rp0 = unweathered Rp1 = slightly weathered Rp2 = strongly weathered Rp3 = completely weathered
Most of the drill core can be described as slightly weathered (84 %). An unweathered (15 %) and slightly weathered section alternates and contacts are fuzzy. In the depth section 21.20…21.75 m and 30.00…31.10 m the weathering degree is strong, caused by feldspar alteration. These sections do not represent normal “strong weathered” but weathering degree is rather between Rp1-2. The weathering degree along the tunnel is illustrated in Figure 3-10 and also presented in Appendix 3.9.
Figure 3-10. The weathering along the tunnel profile.

20

21
4 ROCK MECHANICS
4.1 General
Rock strength and deformation property tests were made with a Rock Tester-equipment. The device is meant for field-testing of rock cores to evaluate rock strength and deformation parameters. The samples for testing the strength and deformation properties of the rock were chosen and taken by Posiva. The tests were done by Suomen Malmi Oy.
Also dynamic rock mechanical parameters, Young’s modulus Edyn, Shear modulus µdyn,Poisson’s ratio dyn and apparent Q’ value (Barton 2002) were computed from the acoustic and density data, see chapter 6.4.7.
4.2 Q-classification
The rock mechanical logging basis is Q-classification. The core is visually divided into sections, the lengths of which can vary from less than a metre to several metres. In each section the rock quality is as homogenous as possible. Q-parameters are estimated visually for each section. The RQD is defined as the cumulative length of core pieces longer than 10 cm in a run divided by the total length of the core run. The total length of core must include all lost core sections. Any mechanical breaks caused by the drilling process or extracting the core from the core barrel should be ignored. The joint set, roughness and alteration numbers are classified for each section. The roughness and alteration numbers are estimated and the most descriptive number is given to the section. The roughness and alteration are described in more details in the fracture table, Appendix 3.3. Parameters are illustrated in Figures 4-1, 4-2 and 4-3.
Q-value is calculated by equation 4-1 (Barton 1974 and Grimstad & Barton 1993)
SRF
J
J
J
J
RQDQ w
a
r
n
**= (4-1)
In calculations Jw and SRF are 1. Consequently the calculated value is actually Q´-value. Results are presented in Figure 4-4 and Appendix 3.3. Briefly, the rock quality in PH3 is good or better. In the depth interval 19.20…21.35 m the rock quality is poor. The fracture surfaces are mainly undulated and rough.

22
Figure 4-1. Description of RQD and joint set number Jn (Grimstad & Barton 1993).
Figure 4-2. Description of joint roughness number Jr (Grimstad & Barton 1993).

23
Figure 4-3. Description of joint alteration number Ja (Grimstad & Barton 1993).
Figure 4-4. The rock quality along the tunnel profile. Joint water and stress reduction
factors are assumed as 1.

24
4.3 Rock mechanical field tests on core samples
4.3.1 Description of tests
Rock strength and deformation property tests were made with Rock Tester-equipment. The device is meant for field-testing of cores to evaluate rock strength and deformation parameters. The cores tested can be unprepared and the test itself is easy to perform and hence is a lucrative testing method.
Young’s Modulus E, Poisson’s ratio ν and Modulus of Rupture Smax were measured with a Bend test in which the outer supports (L) were placed 190 mm apart and the inner supports (U) 58 mm apart. The diameter of the core (D) is about 51 mm. The test arrangement is shown in Figure 4-5.
Young’s modulus describes the stiffness of rock in the condition of isotropic elasticity. This can be calculated based on Hooke’s reduced law, Equation 4-2.
Ea
= σε
[Pa] (4-2)
σ = stress [Pa] εa = axial strain
Poisson’s ratio is defined as the ratio of radial strain and axial strain, Equation 4-3.
aεεν r= (4-3)
εr = radial strain εa = axial strain
Values of the Modulus of Rupture are read directly from the Bend test measurement.
The uniaxial compressive strength, σc, of the rock was determined indirectly from the point load test results. The point load tests were made according the ISRM suggestions (ISRM 1981 and ISRM 1985). The point load index IS50, which is determined in the test, is multiplied by 20 and the resulting value corresponds to the uniaxial compressive strength (Pohjanperä et al. 2005).

25
Figure 4-5. Bend test with radial and axial strain gauges glued on the core sample.
In the point load test, the load is increased until the core sample breaks, Figure 4-6. The point load index is calculated from the load required to break the sample. The test result is valid only if the broken surface goes through the load points. The point load index IS
is calculated from Equation 4-4.
IP
DS
=2
[Pa] (4-4)
P = point load [N] D = diameter of the core sample [mm]
The point load index is dependent on the diameter of the core sample and it is therefore corrected to the point load index Is50 (i.e. a 50 mm diameter core) using Equations 4-5 and 4-6. The index IS50 is then correlated with the uniaxial compressive strength of the rock by multiplying the index by a coefficient of 20. The result is not then dependent on the sample size.
I F IS S50
= × (4-5)
FD=50
0 45,
(4-6)
D
L
L > 0,5D
Figure 4-6. Point load test.
U
L
D
L > 3,5D
D ≤ U ≤ L/3

26
4.3.2 Strength and elastic properties
Samples for testing the strength and elastic properties of the rock were chosen and taken by Posiva. In total, six samples were tested. One Bend test and two Point load tests were made on each sample.
The mean uniaxial compressive strength of the rock in borehole PH3 is 129 MPa. The mean elastic modulus (Young’s Modulus) is 38 GPa and the mean Poisson’s ratio 0.20. Differences in results are probably caused by the variability in the foliation intensity and the grain size. Before these measurements, a geologist marked test direction on the point load samples and logged the following parameters: foliation angles in the Point load tests, rock type, foliation intensity and description of foliation. The description of foliation in the point-loaded samples is presented in Table 4-1.
The rock mechanics test results and foliation information for the point test samples are presented in Table 4-1. The uniaxial compressive strength, Young’s Modulus and Modulus of Rupture versus depth are shown in Figure 4-7.
0.00
25.00
50.00
75.00
100.00
125.00
150.00
175.00
200.00
0.0 50.0 100.0 150.0
Borehole depth [m]
Un
iax
ial
co
mp
ress
ive s
tren
gth
[M
Pa
] a
n
Yo
un
g's
Mo
du
lus
[GP
a]
0.00
5.00
10.00
15.00
20.00
25.00
30.00
35.00
40.00
Mo
du
lus
of
Ru
ptu
re [
MP
a
Young's Modulus [GPa]
Uniaxial compressive strength[MPa]Modulus of Rupture [MPa]
Figure 4-7. Uniaxial compressive strength, elastic modulus, and Modulus of Rupture
versus depth in borehole PH3.

27
Table 4-1. Summary of rock mechanics field test results in borehole PH3.
Start End Foliation Foliation Description Ε ν σC1
4 Smax
depth depth angle (°) angle (°)
of foliation 3
m m
Testpoint, m
Degreeof foliation intensity1 α 2 β 2 GPa MPa MPa
2.38 3.06 44.3 0.18 15.6 2.56 1 30 0 weak 146.7 2.84 2 35 20 irregular 119.5
24.59 25.10 36.5 0.32 14.8 24.68 0 102.5 24.93 0 148.1
57.24 57.59 32.2 0.22 9.7 57.33 0 117.0 57.48 0 134.8
88.45 88.86 35.4 0.18 16.4 88.59 2 15 0 137.4
88.73 1 15 30 irregular, twisting 135.6
114.26 114.86 43.9 0.16 14.5 114.46 1 10 80 129.4 114.65 1 20 90 116.6
131.05 131.67 37.2 0.15 15.0 131.20 2 35 0 twisting 149.3 131.39 2 25 10 116.0
Means 38.3 0.20 129.4 14.3
Notes for Table 4-1.
1 Foliation intensity in the tested, point-loaded sample. 0=no foliation, 1=weak, 2=medium, 3=strong (based on the Finnish engineering geological rock classification)
2 Definition of α and β angles and measured in the tested, point-loaded sample
3 Additional description of foliation in the tested, point-loaded sample such as regular through the sample, irregular, two different foliations, etc.
4 Calculated from the point load index using the coefficient factor of 20

28

29
5 HYDRAULIC MEASUREMENTS
5.1 General
Borehole PH3 was measured with Posiva Flow Log/Difference Flow method in September 2005. The fieldwork as well as the subsequent interpretation were conducted by PRG-Tec Oy. Borehole PH3 is entirely below the groundwater level and water was flowing out from the open borehole during the flow measurements. Borehole PH3 was measured with 0.5 m section length.
Water loss tests (Lugeon tests) and a pressure build-up test were used to give background information for the grouting design. In the water loss tests pressurized water is pumped into a borehole section, and the loss of water is measured. The results are used for evaluation of grouting needs.
A pressure build-up test is a transient test, where pressure and flow are studied as a function of time. This gives a possibility to investigate the hydraulic properties further away from a borehole and e.g. see if the borehole is connected to larger, more conductive fractures, which are not necessarily identified with flow logging.
5.2 Flow logging
5.2.1 Principles of measurement and interpretation
5.2.1.1 Measurements
Unlike traditional types of borehole flowmeters, the Difference flowmeter method measures the flow rate into or out of limited sections of the borehole instead of measuring the total cumulative flow rate along the borehole. The advantage of measuring the flow rate in isolated sections is a better detection of the incremental changes of flow along the borehole, which are generally very small and can easily be missed using traditional types of flowmeters.
Rubber disks at both ends of the downhole tool are used to isolate the flow in the test section from that in the rest of the borehole, see Figure 5-1. The flow along the borehole outside the isolated test section passes through the test section by means of a bypass pipe and is discharged at the upper end of the downhole tool.
The Difference flowmeter can be used in two modes, a sequential mode and an overlapping mode. In the sequential mode, the measurement increment is as long as the section length. It is used for determining the transmissivity and the hydraulic head (Öhberg & Rouhiainen 2000). In the overlapping mode, the measurement increment is shorter than the section length. It is mostly used to determine the location of hydraulically conductive fractures with their transmissivities and to classify them with regard to their flow rates.
The Difference flowmeter measures the flow rate into or out of the test section by means of thermistors, which track both the dilution (cooling) of a thermal pulse and

30
transfer of thermal pulse with moving water. In the sequential mode, both methods are used, whereas in the overlapping mode, only the thermal dilution method is used because it is faster than the thermal pulse method.
Besides incremental changes of flow, the downhole tool of the Difference flowmeter can be used to measure:
- The electric conductivity (EC) of the borehole water and fracture-specific water. The electrode for the EC measurements is placed on the top of the flow sensor, Figure 5-1.
- The single point resistance (SPR) of the borehole wall (grounding resistance). The electrode of the Single point resistance tool is located in between the uppermost rubber disks, see Figure 5-1. This method is used for high resolution depth/length determination of fractures and geological structures.
- The prevailing water pressure profile in the borehole. The pressure sensor is located inside the electronics tube and connected via another tube to the borehole water, Figure 5-2.
- Temperature of the borehole water. The temperature sensor is placed in the flow sensor, Figure 5-1.
WinchPumpComputer
Flow along the borehole
Rubberdisks
Flow sensor-Temperature sensor is located in the flow sensor
Single point resistance electrode
EC electrode
Measured flow
Figure 5-1. Schematic of the downhole equipment used in the Difference flowmeter.

31
FLOW TO BE MEASURED
FLOW ALONG THE BOREHOLE
RUBBERDISKS
FLOW SENSOR
PRESSURE SENSOR (INSIDE THE ELECTRONICSTUBE)
CABLE
Figure 5-2. The absolute pressure sensor is located inside the electronics tube and
connected via another tube to the borehole water.
The principles of difference flow measurements are described in Figures 5-3 and 5-4. The flow sensor consists of three thermistors, see Figure 5-3 a. The central thermistor, A, is used both as a heating element for the thermal pulse method and for registration of temperature changes in the thermal dilution method, Figures 5-3 b and c. The side thermistors, B1 and B2, serve to detect the moving thermal pulse, Figure 5-3 d, caused by the constant power heating in A, Figure 5-3 b.
Flow rate is measured during the constant power heating, Figure 5-3 b. If the flow rate exceeds 600 mL/h, the constant power heating is increased (Figure 5-4 b) and the thermal dilution method is applied.
If the flow rate during the constant power heating (Figure 5-3 b) falls below 600 mL/h, the measurement continues with monitoring of transient thermal dilution (Figure 5-3 c) and thermal pulse response (Figure 5-3 d). When applying the thermal pulse method, also thermal dilution is always measured. The same heat pulse is used for both methods.
Flow is measured when the tool is at rest. After transfer to a new position, there is a waiting time (the duration can be adjusted according to the prevailing circumstances) before the heat pulse (Figure 5-3 b) is launched. The waiting time after the constant power thermal pulse can also be adjusted, but is normally 10 s long for thermal dilution and 300 s long for thermal pulse. The measuring range of each method is given in Table 5-1.

32
The lower end limits of the thermal dilution and the thermal pulse methods in Table 5-1 correspond to the theoretical lowest measurable values. Depending on the borehole conditions, these limits may not always prevail. Examples of disturbing conditions are floating drill cuttings in the borehole water, gas bubbles in the water and high flow rates (above about 30 L/min) along the borehole. If disturbing conditions are significant, a practical measurement limit is calculated for each set of data.
Table 5-1. Ranges of flow measurements.
Method Range of measurement (mL/h)
Thermal dilution P1 30 - 6 000 Thermal dilution P2 600 - 300 000
Thermal pulse 6 – 600

33
Figure 5-3. Flow measurement, flow rate <600 mL/h.
0 10 20 30 40 50 60 70 80Time (s)
0
50
100
Te
mp
era
ture
diff
ere
nce
(m
C)
0 10 20 30 40 50
0
5
10
15
dT
(C
)
Flow rate (mL/h)594
248
125
71.4
28.4
12.3
5.40
3.00
0 10 20 30 40 50
0
10
20
30
40
50
Po
we
r (m
W)
Flow sensor
Constant power in A
Thermal dilution methodTemperature change in A
Thermal pulse methodTemparature difference between B1 and B2
P1
AB1 B2
a)
b)
c)
d)

34
Figure 5-4. Flow measurement, flow rate > 600 mL/h.
-5 0 5 10 15
0
50
100
150
200
Po
we
r (m
W)
AB1 B2
Flow sensor
Constant power in A
-5 0 5 10 15Time (s)
0
10
20
30
40
50
60
dT
(C)
Flow rate (mL/h)321 000
132 000
54 900
24 800
13 100
6 120
3 070
1 110
Thermal dilution methodTemperature change in A
P1
P2
a)
b)
c)

35
5.2.1.2 Interpretation
The interpretation is based on Thiems or Dupuits formula (Equation 5-1) that describes a steady state and two dimensional radial flow into the borehole (Marsily 1986):
hf – h = Q/(T·a) (5-1)
where
- h is hydraulic head in the vicinity of the borehole and h = hf at the radius of influence (R),
- Q is the flow rate into the borehole,
- T is the transmissivity of fracture,
- a is a constant depending on the assumed flow geometry, Equation 5-2. For cylindrical flow, the constant a is:
a = 2·π/ln(R/r0) (5-2)
where
- r0 is the radius of the well and
- R is the radius of influence, i.e. the zone inside which the effect of the pumping is detected.
If flow rate measurements are carried out using two levels of hydraulic heads in the borehole, i.e. natural or pump-induced hydraulic heads, then the undisturbed (natural) hydraulic head and transmissivity of fractures can be calculated. Two equations (5-3 and 5-4) can be written directly from Equation 5-1:
Qf1 = Tf·a·(hf- h1) (5-3)
Qf2 = Tf·a·(hf- h2) (5-4)
where
- h1 and h2 are the hydraulic heads in the borehole at the test level,
- Qf1 and Qf2 are the flow rates at a fracture and
- hf and Tf are the hydraulic head (far away from borehole) and the transmissivity of a fracture, respectively.
Since, in general, very little is known of the flow geometry, cylindrical flow without skin zones is assumed. Cylindrical flow geometry is also justified because the borehole

36
is at a constant head and there are no strong pressure gradients along the borehole, except at its ends.
The radial distance R to the undisturbed hydraulic head hf is not known and must be assumed. Here a value of 500 is selected for the quotient R/r0.
The hydraulic head and the transmissivity of fracture can be deduced from the two measurements (Equations 5-5 and 5-6):
hf = (h1- (Qf1/Qf2)·h2)/(1- Qf1/Qf2) (5-5)
Tf = (1/a) (Qf1-Qf2)/(h2-h1) (5-6)
Since the actual flow geometry and the skin effects are unknown, transmissivity values should be taken as indicating orders of magnitude. As the calculated hydraulic heads do not depend on geometrical properties but only on the ratio of the flows measured at different heads in the borehole, they should be less sensitive to unknown fracture geometry. A discussion of potential uncertainties in the calculation of transmissivity and hydraulic head is provided in (Ludvigson et al. 2002).
Hydraulic aperture of fractures can be calculated with Equations 5-7 and 5-8 (Marsily 1986):
T = e3·g· /(12·µ·C) (5-7)
e = (12·T·µ·C/(g· ))1/3 (5-8)
where
- T = transmissivity of fracture (m2/s)- e = hydraulic aperture (m) - µ = viscosity of water, 0.00139 (kg/(ms)) - g = acceleration for gravity, 9.81 (m/s2)- = density of water, 999 (kg/m3)- C = experimental constant for roughness of fracture, here chosen to be 1.
37
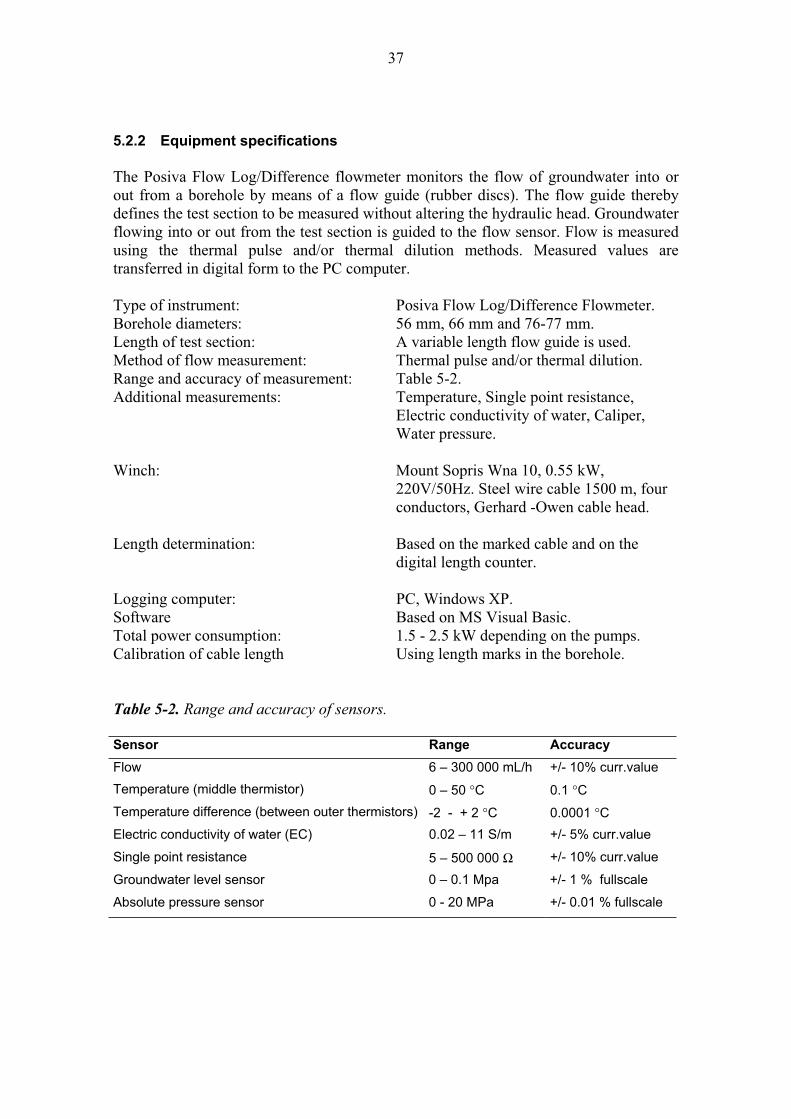
5.2.2 Equipment specifications
The Posiva Flow Log/Difference flowmeter monitors the flow of groundwater into or out from a borehole by means of a flow guide (rubber discs). The flow guide thereby defines the test section to be measured without altering the hydraulic head. Groundwater flowing into or out from the test section is guided to the flow sensor. Flow is measured using the thermal pulse and/or thermal dilution methods. Measured values are transferred in digital form to the PC computer.
Type of instrument: Posiva Flow Log/Difference Flowmeter. Borehole diameters: 56 mm, 66 mm and 76-77 mm. Length of test section: A variable length flow guide is used. Method of flow measurement: Thermal pulse and/or thermal dilution. Range and accuracy of measurement: Table 5-2. Additional measurements: Temperature, Single point resistance,
Electric conductivity of water, Caliper, Water pressure.
Winch: Mount Sopris Wna 10, 0.55 kW, 220V/50Hz. Steel wire cable 1500 m, fourconductors, Gerhard -Owen cable head.
Length determination: Based on the marked cable and on the digital length counter.
Logging computer: PC, Windows XP. Software Based on MS Visual Basic. Total power consumption: 1.5 - 2.5 kW depending on the pumps. Calibration of cable length Using length marks in the borehole.
Table 5-2. Range and accuracy of sensors.
Sensor Range Accuracy
Flow 6 – 300 000 mL/h +/- 10% curr.value
Temperature (middle thermistor) 0 – 50 °C 0.1 °CTemperature difference (between outer thermistors) -2 - + 2 °C 0.0001 °CElectric conductivity of water (EC) 0.02 – 11 S/m +/- 5% curr.value
Single point resistance 5 – 500 000 Ω +/- 10% curr.value
Groundwater level sensor 0 – 0.1 Mpa +/- 1 % fullscale
Absolute pressure sensor 0 - 20 MPa +/- 0.01 % fullscale

38
5.2.3 Description of the data set
5.2.3.1 Field work
The activity schedule is presented in Table 5-3.
Table 5-3. Activity schedule.
Started Finished Activity
10.9.2005 16:36 11.9.2005 4:46 Borehole PH3. Flow logging without pumping (during natural outflow from the open borehole) (L = 0.5 m, dL = 0.1 m)
5.2.3.2 Results of borehole PH3
Due to the time constraints, a short but effective program was carried out in PH3. The detailed flow logging was performed with 0.5 m section length and with 0.1 m depth increments, see Appendices 5.1 – 5.8. The method gives the borehole depth of fractures with a depth resolution of 0.1 m. The test section length determines the width of a flow anomaly of a single fracture. If the distance between flowing fractures is less than the section length, the anomalies will be overlapped resulting in a stepwise flow anomaly.
Transmissivity was calculated using Equation 5-6 assuming that h1 = 6 m (masl, elevation of groundwater level), h2 = -59.976 m (masl, elevation of the top of the borehole), see Appendices 5.9 and 5.10. Drawdown in the borehole is then h1 - h2 = 65.976 m and the corresponding flow is Qf2. Qf1 (assumed flow when head in the borehole is 6 m) is assumed to be much smaller than Qf2 and therefore Qf1 is neglected (Qf1= 0).
Detected fractures are shown on the depth scale with their positions, Appendices 5.1 – 5.8. They are interpreted on the basis of the flow curves and therefore represent flowing fractures. A long line represents the location of a leaky fracture; a short line denotes that the existence of a leaky fracture is uncertain. A short line is used if the flow rate is less than 30 ml/h or if the flow anomalies are overlapping or they are unclear because of noise.
Hydraulic aperture is calculated assuming C = 1, i.e. fracture surface is assumed to be smooth. This results small hydraulic apertures.
Electric conductivity and temperature of borehole water were measured during flow logging, see Appendices 5.11 and 5.12. Temperature was measured during the flow measurement. These results represent borehole water at each depth only approximately because the flow guide carries water with it. The EC-values are temperature corrected to 25 °C to make them more comparable with other EC measurements (Heikkonen et al. 2002).

39
Flow out from the open borehole was measured few times during flow logging. This flow was about 6.2 l/min, see Appendix 5.13.
5.3 Water loss tests (Lugeon tests)
Water loss tests were performed by the drilling crew, which returned to PH3 on Sept. 13 to complete the tests. The upper and the lower packers blocked 6.46 metres long interval by three 7 cm wide swelling rubber seals. The total length of both upper and lower seal element was 0.24 metres before pressing. By pressing the rods against the bottom of the hole the rubber seals swell and isolate the test interval from the rest of the borehole and fixed water pressure for measuring interval can be introduced with the water pump of the drill rig. Between the packers two 3 metres long perforated drill rods were used to convey water into pressurized area. Tests were completed with 9, 13, 17, 13 and 9 bar water pressure levels for each measuring interval. The pressurization time was 10 minutes per each pressure level and per each interval. For each pressure level the amount of water released into bedrock was measured with water flow gauge. The measured interval was moved upwards by adding two 3 metres long drill rods below the closed lower packer after every measuring session per depth interval. In the first interval only the upper packer and two 3 metres long perforated drill rods with 13,5 cm thread protection bushing was used. The bottom of the borehole acted as lower packer in the first interval 138.77 – 145.04 metres. The first interval was 6.27 metres long.
The hole was measured by 24 intervals from 2.88 metres to the bottom (145.04 metres) of the hole. The hydrostatic pressure used in interpretation calculations was 6.2 bars for the entire borehole. Between the depths 54.00 and 72.46 m a noticeable amount of water leaked out from the hole during the pressurizing and the survey for intervals 54.00 – 60.46 m; 60.00 –66.46 m and 66.00 – 72.46 m was renewed.
The interpretation of Packer test results was completed by Gridpoint Oy. The interpreted results are in Appendixes 5.14-5.19.
5.4 Pressure build-up test
A new test was introduced in PH3 to get data about the development of pressure along the borehole. So-called pressure build-up test is a hydraulic test, which describes the behaviour of fractured rock mass. A pressure build-up test is a transient test where pressure and flow are studied as a function of time. This gives a possibility to investigate the hydraulic properties of bedrock further away from a borehole and see if the borehole is connected to larger, more conductive fractures, which are not necessarily, identified using another hydraulic test. The pressure build-up test starts with a flow period and ends by a recovery period (Emmelin et al. 2004). The measuring time is short with larger inflows and if the inflows are very small the measuring time is longer. In PH3 the measurement were performed by Posiva field personnel. The development of pressure in the pilot hole was registered and the result is presented in Appendix 5.20. The measurement took one hour and pressure registration device is presented in Appendix 5.21. The recovery period and release of pressure was not measured and it may cause inadequate interpretation. After pressure build-up test the inflow from pilot hole was decreased by app. 10 litres.

40
Description of method is written by Åsa Fransson, Chalmers University of Technology. The transmissivity, T, is estimated from the recovery phase of the pressure build-up test using Jacob’s method (Cooper and Jacob 1946). The recovery, s”, is expressed as given below:
+=+⋅
⋅+=Sr
Tt
T
Q
tt
tt
Sr
T
T
Qs e
PPB
PPB
22ln8091.0
4ln8091.0
2
1
2"
ππ
where r=radial distance, S=storage coefficient and Q=flow (e.g. Gustafson 1986). The adjusted time, te, is estimated from the time of injection or flow time, tP, and the time since recovery started or the Pressure build-up time, tPB. Initially, log-log plots of the recovery, s”, and the adjusted time, te, are used to evaluate the flow dimension of tests. A slope of 1:1 indicates an effect of wellbore storage. The shape of curves also indicates if there is one-dimensional (1D) flow, radial or two-dimensional (2D) flow, or three-dimensional (3D) flow, (e.g., Carlsson and Gustafson 1991). Doe and Geier (1990) further describe the spatial dimension for flow in hydraulic tests. Jacob’s method consists of plotting the recovery, s”, and the adjusted time, te, on a semi-logarithmic plot. The transmissivity is evaluated using the following equation:
"
183.0
s
QT
∆=
where, ∆s” is the slope of the recovery line on the plot of s” against te (change in s” during a decade, t1 to 10t1).
A pressure build-up test was used in the grouting project in APSE tunnel ÄSPÖ HRL (Emmelin et al. 2004) and it gave background information for the grouting design. Results from PH3 are used for LPHTEK field test and the pressure build-up test gives valuable information for planning of the grouting design. The interpretation of the results will be presented in the Posiva working report from the LPHTEK field test during 2006.

41
6 GEOPHYSICAL LOGGINGS
6.1 General
Suomen Malmi Oy (Smoy) carried out geophysical borehole surveys of the borehole PH3 for Posiva Oy in September 2005. The assignment included imaging and geophysical surveys and interpretation according to the purchase order 9828/05/TUAH. The borehole geophysics contributes to fracture detection and orientation as well as further description of the crystalline bedrock at the Olkiluoto Site.
This Chapter describes the field operation of the borehole surveys and the data processing and interpretation. The quality of the results is shortly analysed and the data presented in the Appendices.
6.2 Equipment and methods
The geophysical survey carried out in PH3 included optical imaging, Wenner resistivity, natural gamma radiation, gamma-gamma –density, magnetic susceptibility, acoustic and borehole radar measurements. The borehole surveys were carried out using Advanced Logic Technology’s (ALT) OBI-40 optical televiewer and FWS40 Full Waveform Sonic Tool, Malå Geoscience’s WellMac probes and RAMAC GPR borehole antenna as well as Rautaruukki’s RROM-2 probe. Applied control units were ALT Abox, Malå Geoscience Ramac CU II and WellMac, and RROY KTP-84. All the equipment is property of Smoy.
Cable was operated by a motorised winch. The depth measurement is triggered by pulses of sensitive depth encoder, installed on a pulley wheel. Optical imaging and full wave sonic applied a Mount Sopris manufactured 1000 m long, 3/16” steel reinforced 4-conductor cable, WellMac and RROY measurements a 1000 m long 3/16” polyurethane covered 5-conductor cable, and radar measurement a 150 m long optical cable. The cables were marked with 10 m intervals for controlling the depth measurement to adjust any cable slip and stretch.
6.2.1 WellMac equipment
The WellMac system consists of a surface unit and a laptop interface as well as a cable winch, a depth measuring wheel and the borehole probes. The probes applied in this survey were the natural gamma probe, the gamma-gamma density probe and the susceptibility probe. All these probes have a diameter of 42 mm. The field assembly and tool configurations of the WellMac system as well as technical information of the probes are presented in Appendix 6.1.

42
6.2.2 Rautaruukki equipment
The Wenner-resistivity was measured using Rautaruukki Oy manufactured RROM-2 probe and recorded with KTP-84 data logging unit. The galvanic resistivity is measured from the borehole wall using four electrode Wenner –configuration (a=31.8 cm). The probe diameter is 42 mm. The configuration of the probe is presented in Figure 6-1 and the technical information of the tool in Appendix 6.2.
Figure 6-1. The configuration of the Rautaruukki RROM-2 Wenner-probe.
6.2.3 Geovista Normal resistivity sonde
The Geovista Normal resistivity sonde (ELOG) is compatible with ALT acquisition system. The sonde carries out simultaneously four different measurements. The measurements available are 16” normal resistivity, 64” normal resistivity, single point resistance (SPR) and spontaneous potential (SP). The measuring range of the system is modified from 0-10 000 Ohm-m to 0-40 0000 Ohm-m. Probe diameter is 42 mm. Probe does not contain electrically conductive parts, except the voltage return in the middle of 10 m insulator bridle, and the current return grounded on steel armored cable and the cable connector. Some of the technical information of the ELOG sonde is presented in Appendix 6.3.
6.2.4 RAMAC equipment
The borehole radar survey was carried out using RAMAC GPR 250 MHz dipole antenna with 150 m optical cable. The system consists of computer, control unit CU II, depth encoder, optical cable and borehole radar probe. Measurement was controlled with Malå Groundvision software. Tool zero time was calibrated before the

43
measurement. The downhole probe diameter is 50 mm. Transmitter and receiver were separated by a 0.5 m tube (Tx – Rx dipole center point distance is 1.71 m). The tool technical information is presented in Appendix 6.4.
6.2.5 Sonic equipment
The full waveform sonic was recorded with Advanced Logic Technology’s (ALT) FWS40 probe that is compatible with Smoy’s ALT acquisition system. The Full Waveform Sonic Tool has one piezoceramic transmitter (Tx) of 15 kHz nominal frequency, and two receivers (Rx), with Tx-Rx spacing of 0.6 m (Rx1) and 1.0 m (Rx2). Tool diameter is 42 mm. Some technical details of the system are presented in Appendix 6.5.
6.2.6 Optical televiewer
The borehole imaging was carried out using OBI40 optical televiewer manufactured by Advanced Logic Technology (ALT). Tool diameter is 42 mm. Tool maximum azimuthal resolution is 720 pixels and vertical resolution 0.5 mm. Smoy has prepared special centralisers for 76 mm boreholes. The tool configuration is shown in Figure 6-2 and optical assembly in Figure 6-3. The probe and logging control unit are also presented in Appendix 6.6.

44
Figure 6-2. The configuration of the OBI40-mk3, length 1.7 m (ALT, Optical Borehole
Televiewer Operator Manual).
Figure 6-3. Optical assembly of the OBI40. The high sensitivity CCD digital camera
with Pentax optics is located above a conical mirror. The light source is a ring of light
bulbs located in the optical head (ALT, Optical Borehole Televiewer Operator Manual).

45
6.3 Fieldwork
The fieldwork was carried out within 35 working hours 12.9.2005-13.9.2005. The assignment consisted of borehole surveys of PH3 with estimated total survey amount of 140 m. Only Elog’s single point resistance could not be performed due to tool wreck. The borehole specifications are listed in Table 6-1 and the duration of the field work in Table 6-2. Table 6-3 shows the survey parameters of each method.
Table 6-1. Specifications of the boreholes surveyed.
Diameter Azimuth Dip Length (m)
PH3 76 mm 225,15 -5,84 144,91
Table 6-2. Timing of the field work.
Date Actions Surveyors
12.9.05 12:00 -
13.9.05 03:00
Borehole digital imaging AS, JM, LJ
13.9.05 03:00-
13.9.05 06:00
Full wave sonic survey JM, LJ
13.9.05 06:00-
13.9.05 08:30
Natural gamma survey AS, AK
13.9.05 08:30-
13.9.05 11:00
Density survey AS, AK
13.9.05 11:00-
13.9.05 13:30
Susceptibility survey AS, AK
13.9.05 13:30-
13.9.05 16:00
Wenner survey AS, AK
13.9.05 16:00-
13.9.05 20:00
Single point resistance survey
Could not be performed because of tool wreck
AS, AK, JM
13.9.05 20:00-
13.9.05 23:00
Borehole radar survey AS, JM
Table 6-3. Survey parameters of the applied methods.
Method Depth sampling Settings Survey speed
Borehole imaging 0.0005m 720 pixels / turn 0.18 m/min
Full wave sonic 0.02 m Time sampling 2 µs, time Interval 2048 µs R1 gain 1, R2 gain 1
1.0 m/min
Wenner resistivity 0.02 m Calibrated with control box 2.0 m/min
Natural gamma 0.02 m Calibrated for rapakivi granite in 1999 2.0 m/min
Density 0.02 m Calibrated for KR19-KR22 in 2001 2.0 m/min
Susceptibility 0.02 m Calibration with brick 2.0 m/min

46
Single point resistance,
normal resistivities
0.02 m Calibration tested with resistors and earlier results
3.0 m/min
Borehole radar 0.02 m Zero time calibrated. Depth sampling 0.02 m, time sampling 0.18 ns, sampling frequency 5418 MHz
1.0 m/min
6.4 Processing and results
The processing of the conventional geophysical results includes basic corrections and calibrations presented in Posiva’s Working report 2001-30 (Lahti et al. 2001). The sonic interpretations and depth adjustments as well as data integration were carried out by JP-Fintact Ltd.
The results of the natural gamma radiation, gamma-gamma density, magnetic susceptibility and Wenner resistivity are presented in Appendix 6.7. The borehole radar results and interpretation are presented in Appendices 6.8 - 6.11. The full waveform sonic results are shown in Appendices 6.12 and 6.13. The optical televiewer example of the image log is shown in Appendix 6.14.
The results, presented in the Appendices, were joined with available geological data received from Posiva. These include lithology and fracture frequency, and location of fractures.
Initial depth match is based on cable mark control. Locations of rock type contacts and fractures in core were used in final depth matching. The image was first adjusted to core data, then the gamma-gamma density was set to image depth using the mafic gneiss variants. Susceptibility, natural gamma and sonic data were adjusted according to density. Electrical measurements were adjusted according to sonic and density minima, and high resistivity mafic units. Finally the radar results were adjusted to depth of electrical results, using direct radar wave velocity and amplitude profile. Depth accuracy to core depth of all methods is better than 5 cm.
6.4.1 Natural gamma radiation
The measured values are converted into µR/h values using coefficient determined at Hästholmen boreholes HH-KR5 and HH-KR8 in Loviisa. The conversion is carried out so that 1 µR/h equals 3.267 p/s. The determination of the coefficient is presented in Posiva’s Working report 99-22 (Laurila et al. 1999).
Table 6-4. Results of processed parameters of natural gamma data.
File name Depth interval (m) Range µR/h
ONKPH3_Geoph_Data.xls 0.30 - 144.70 5.20 – 83.87
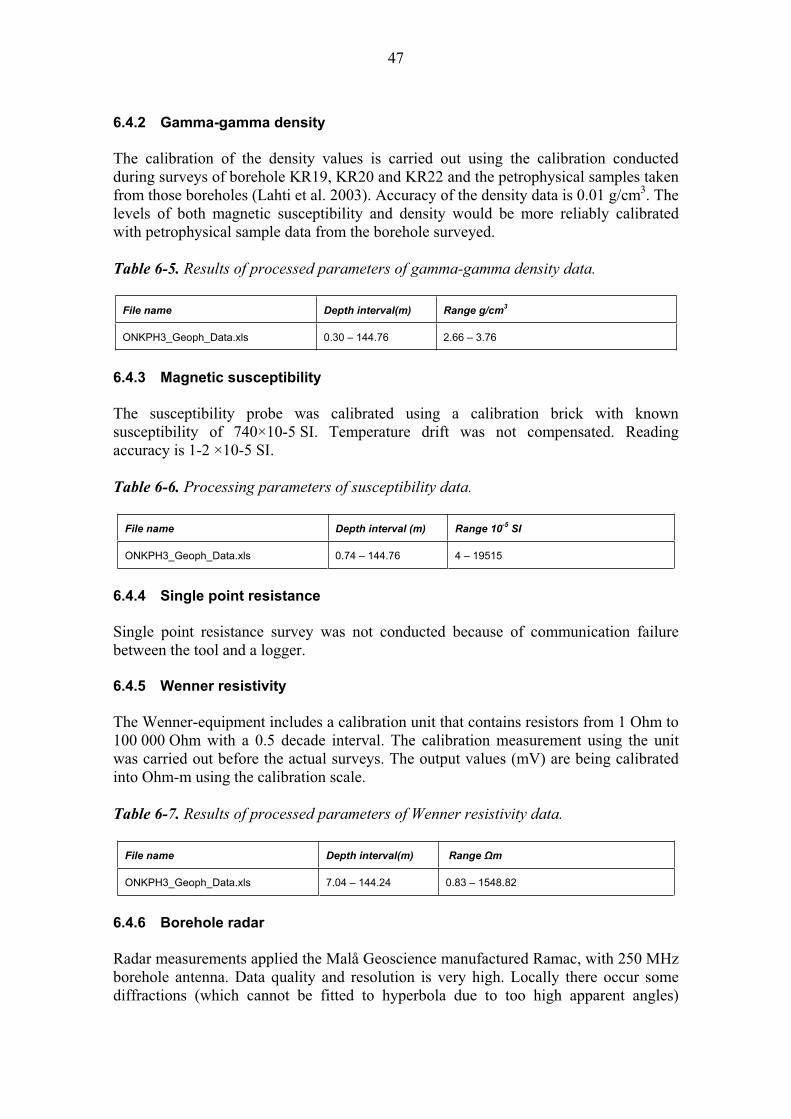
47
6.4.2 Gamma-gamma density
The calibration of the density values is carried out using the calibration conducted during surveys of borehole KR19, KR20 and KR22 and the petrophysical samples taken from those boreholes (Lahti et al. 2003). Accuracy of the density data is 0.01 g/cm3. The levels of both magnetic susceptibility and density would be more reliably calibrated with petrophysical sample data from the borehole surveyed.
Table 6-5. Results of processed parameters of gamma-gamma density data.
File name Depth interval(m) Range g/cm3
ONKPH3_Geoph_Data.xls 0.30 – 144.76 2.66 – 3.76
6.4.3 Magnetic susceptibility
The susceptibility probe was calibrated using a calibration brick with known susceptibility of 740×10-5 SI. Temperature drift was not compensated. Reading accuracy is 1-2 ×10⁻⁵ SI.
Table 6-6. Processing parameters of susceptibility data.
File name Depth interval (m) Range 10-5
SI
ONKPH3_Geoph_Data.xls 0.74 – 144.76 4 – 19515
6.4.4 Single point resistance
Single point resistance survey was not conducted because of communication failure between the tool and a logger.
6.4.5 Wenner resistivity
The Wenner-equipment includes a calibration unit that contains resistors from 1 Ohm to 100 000 Ohm with a 0.5 decade interval. The calibration measurement using the unit was carried out before the actual surveys. The output values (mV) are being calibrated into Ohm-m using the calibration scale.
Table 6-7. Results of processed parameters of Wenner resistivity data.
File name Depth interval(m) Range m
ONKPH3_Geoph_Data.xls 7.04 – 144.24 0.83 – 1548.82
6.4.6 Borehole radar
Radar measurements applied the Malå Geoscience manufactured Ramac, with 250 MHz borehole antenna. Data quality and resolution is very high. Locally there occur some diffractions (which cannot be fitted to hyperbola due to too high apparent angles)
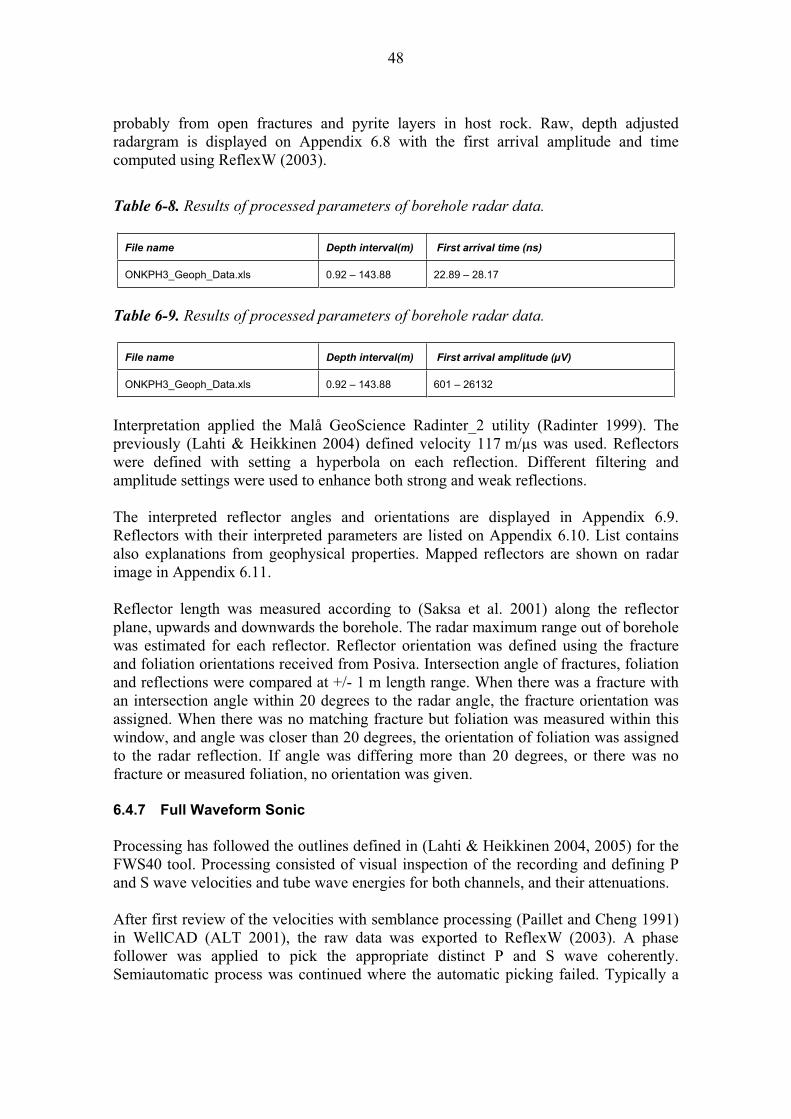
48
probably from open fractures and pyrite layers in host rock. Raw, depth adjusted radargram is displayed on Appendix 6.8 with the first arrival amplitude and time computed using ReflexW (2003).
Table 6-8. Results of processed parameters of borehole radar data.
File name Depth interval(m) First arrival time (ns)
ONKPH3_Geoph_Data.xls 0.92 – 143.88 22.89 – 28.17
Table 6-9. Results of processed parameters of borehole radar data.
File name Depth interval(m) First arrival amplitude (µV)
ONKPH3_Geoph_Data.xls 0.92 – 143.88 601 – 26132
Interpretation applied the Malå GeoScience Radinter_2 utility (Radinter 1999). The previously (Lahti & Heikkinen 2004) defined velocity 117 m/µs was used. Reflectors were defined with setting a hyperbola on each reflection. Different filtering and amplitude settings were used to enhance both strong and weak reflections.
The interpreted reflector angles and orientations are displayed in Appendix 6.9. Reflectors with their interpreted parameters are listed on Appendix 6.10. List contains also explanations from geophysical properties. Mapped reflectors are shown on radar image in Appendix 6.11.
Reflector length was measured according to (Saksa et al. 2001) along the reflector plane, upwards and downwards the borehole. The radar maximum range out of borehole was estimated for each reflector. Reflector orientation was defined using the fracture and foliation orientations received from Posiva. Intersection angle of fractures, foliation and reflections were compared at +/- 1 m length range. When there was a fracture with an intersection angle within 20 degrees to the radar angle, the fracture orientation was assigned. When there was no matching fracture but foliation was measured within this window, and angle was closer than 20 degrees, the orientation of foliation was assigned to the radar reflection. If angle was differing more than 20 degrees, or there was no fracture or measured foliation, no orientation was given.
6.4.7 Full Waveform Sonic
Processing has followed the outlines defined in (Lahti & Heikkinen 2004, 2005) for the FWS40 tool. Processing consisted of visual inspection of the recording and defining P and S wave velocities and tube wave energies for both channels, and their attenuations.
After first review of the velocities with semblance processing (Paillet and Cheng 1991) in WellCAD (ALT 2001), the raw data was exported to ReflexW (2003). A phase follower was applied to pick the appropriate distinct P and S wave coherently. Semiautomatic process was continued where the automatic picking failed. Typically a

49
half cycle (wave length time, 21-22 µs for this dataset) was subtracted from the most distinct cycle time (first maximum and minimum for S and P, respectively).
Following processing sequence included a stand-off correction (Lahti & Heikkinen 2005), computation of P and S wave attenuations, computing reflected tubewave energies, and finally the attenuation of tubewaves.
Also dynamic rock mechanical parameters, Young’s modulus Edyn, Shear modulus µdyn, Poisson’s ratio dyn and apparent Q’ value (Barton 2002) were computed from the acoustic and density data. All the acoustic data and derived parameters are displayed in Appendices 6.12 and 6.13.
Table 6-10. Results of processed parameters of FWS data.
File
name
Processed data Depth interval (m) Range
ON
KP
H3
_G
eo
ph
_D
ata
.xls
P1 velocity
P2 velocity
S1 velocity
S2 velocity
P attenuation
S attenuation
R1 tubewave energy
R2 tubewave energy
Tubewave attenuation
Poisson’s Ratio
Shear Modulus
Young’s Modulus
Apparent Q
0.30 – 144.68
0.30 – 144.68
0.30 – 144.68
0.30 – 144.68
0.30 – 144.68
0.30 – 144.68
0.30 – 144.68
0.30 – 144.68
0.30 – 144.68
0.32 – 144.68
0.32 – 144.68
0.32 – 144.68
0.32 – 144.68
4348.81 – 7028.60 m/s
3597.18 – 6690.84 m/s
2474.05 – 4256.87 m/s
2650.14 – 3978.96 m/s
-144.72 – 82.39 dB/m
-279.93 – 137.29 dB/m
190.82 – 46483.30
99.90 – 122807
-28.12 – 31.34 dB/m
-0.38 – 0.37 GPa
17.20 – 56.72 GPa
43.74 – 136.42 GPa
1.25 –1551.80
6.4.8 Borehole image
The applied survey parameters of the borehole imaging were determined according to earlier optical televiewer works in the Olkiluoto Site (Lahti 2004a, Lahti 2004b). The quality of the image was controlled during survey by taking samples of the image and applying histogram analysis. Also the vertical resolution was checked using captured images. The data processing carried out after the fieldwork consists of depth adjustment and image orientation of the raw image. The depth adjustment and image orientation methods are presented in the report Lahti 2004a. The images were produced to depth matched and oriented to high side presentations including a 3-D image. Images can be reviewed with WellCAD Reader and WellCAD software.
6.5 Conclusions
The task of surveying the boreholes PH3, was concluded within 35 hours in 12.9.2005-13.9.2005. The work was conducted continuously but due to technical problems of Elog-tool single point resistance was not surveyed. The processed and interpreted data was delivered to the Client in digital format. The draft report was compiled in October 2005. The quality of the data widely achieves the required level. The quality was observed and validated by the Client’s representative JP-Fintact Ltd.

50

51
7 GROUNDWATER SAMPLING AND ANALYSES
7.1 General
The aim of the groundwater samplings at pilot holes is to get information of groundwater that will flow to ONKALO during construction (Posiva Oy 2003). The main challenge of the sampling is to get representative groundwater samples after drilling and all other investigations in a limited time. Usually the time needed for the groundwater sampling is several weeks but in the case of pilot holes the time available is only hours or at maximum days.
7.2 Equipment and method
Sampling section was selected based on flow measurements and on EC results from the borehole water of the pilot hole PH3. The groundwater samples were collected from the sampling section 102.09…144.91 m. The vertical depth of the sampling section from the surface is about 75…85 m.
Pilot hole was equipped with one packer for the groundwater sampling. The depth location of the packer was decided so that the sampling section would include the flow point of the most saline groundwater. The packer was installed to the depth of 102.09 m (borehole length) and the samples were taken between this packer and the bottom of the borehole. The installation of the equipment was taken care by Posiva. The water flow from the sampling section was 1.23 L/min. The scavenging period of the groundwater sample lasted 25.5 h and 1882 L water was removed from the sampling section. The sampling section was flushed 2.4 times with groundwater before sampling. The concentration of the sodium fluorescein (label agent used in drilling water) was checked before sampling and it was <10 µg/L, which means that groundwater samples contained maximum 4 % flushing water left from the drilling.
7.3 Groundwater sampling
Posiva Oy collected the groundwater samples into 5 L plastic canisters and 2 L Duran-bottles. Duran-bottles were pre-washed with nitric acid. In addition, groundwater samples for sulphide analysis were collected into three Winkler-bottles (100 mL), which contained preserving chemicals. Details of sample vessels are given in Table 7-1.
The water samples were transported from the ONKALO to the TVO's laboratory as soon as possible. Water samples were filtered with a membrane filter (0.45 µm) and bottled in the laboratory. Some of the water samples for metal analyses needed preserving chemicals after filtration. The exact sample preparation is shown in the Posiva water sampling guide (Paaso et al. 2003). Analysis parameters, sample filtration, bottling and preserving chemicals used are shown in Table 7-1.

52
Table 7-1. Information of the pretreatment of the groundwater samples.
Parameters Container (L) Filtering Preserving chemicals Comments Laboratory
Conductivity, density pH, ammonium
1 x 0.5 PE
- - TVO
Alkalinity,Acidity
1 x 0.5 Duran bottle x -
Sample is taken to Duran-bottle in field and filtered in laboratory
TVO
Ferrous iron, Fe2+,Total iron, Fetot
6 x 0.05 glassy measuring bottle x
Addition of Ferrozine reagent
Samples are transferred to measuring bottles and ferrozine is added as soon as possible
TVO
Sulphide, S2- 4 x 0.1 measuring bottle
-0.5 mL ZnAc2+
0.5 mL 0.1 M NaOH 1 sample for water color analysis
TVO
Cl, Br, SO4, Stot 1 x 0.5 PE x - TVO
F 1 x 0.25 PE x -
DIC / DOC 1 x 0.25 brown glass bottle
x - TVO
Na, K, Mg, Ca, Fe, Mn
1x 0.25 PE, acid washed
x1.25 mL suprapur HNO3
/ 250 ml TVO
Phosphate, PO4 1x 0.25 PE x
2.5 mL 4 M H2SO4
/ 250 ml TVO
Sodium fluorescein 0.25 PE in aluminum foil
x - TVO
Sr 1 x 0.1 PE, acid washed
- 1 mL conc. HNO3
/ 100 mL VTT
Btot 1 x 0.25 PE, acid washed
- - VTT
SiO2 1 x 0.1 PE - - TVO
Nitrate, NO3
Nitrite, NO2
Total nitrogen, Ntot
1 x 0.25 PE x -
Rauman ymp.lab.
Carbon, C-13/C-14 1 x brown glass bottle x -
Sample volume is 1 L if alkalinity is < 0.8 mmol/L
Uppsala
Deuterium H-2, Oxygen O-18
1 x 0.125 Nalgene bottle
- - Sample bottle is filled to the brim.
GTK
Tritium H-3 1 x 0.25 glass bottle - - The Netherlands
Strontium, Sr-87/Sr-86
1 x 0.125 Nalgene bottle,acid washed
- - GTK
Radon, Rn-222 1 x 0.01 Ultimagold solution bottle
- - Precise sampling time is recorded.
STUK
Sulphur, S-34 (SO4)Oxygen, O-18 (SO4)
1 x HDPE bottle, acid washed with 10% HCl -
10 mg of Zn Ac2 is added if sulphide concentration
is < 1.5 mg/L Waterloo
Uranium, Utot 1 x 1 PE x
50 ml conc. HCl / 1 L
Filtration membranes are saved for analysis.
HYRL
Uranium, U-234/U-238
1 x 1 PE x
50 ml conc. HCl / 1 L
Filtration membranes are saved for analysis.
HYRL
PE = Polyethylene; HDPE = high density polyethylene
Laboratories: TVO Teollisuuden Voima Oy VTT VTT Technical Research Centre of Finland Rauman ymp.lab. Rauman ympäristölaboratorio Uppsala University of Uppsala GTK The Geological Survey of Finland The Netherlands University of Groningen, Centre for Isotope Research STUK Radiation and Nuclear Safety Authority in Finland Waterloo University of Waterloo HYRL University of Helsinki, Laboratory of Radiochemistry

53
7.4 Laboratory analysis
Most of the water analyses were made at the TVO's laboratory at Olkiluoto. Some of the analyses were made according to the Posiva water sampling guide (Paaso et al. 2003). These analyses were alkalinity, acidity, bicarbonate, chloride, fluoride, ferrous iron and total iron. Other laboratory analyses were made according to TVO's or TVONS's instructions. All laboratory analyses were made by standard methods or by other generally acceptable methods (Appendix 7.1).
Rauman ympäristölaboratorio (Environmental laboratory in Rauma) analysed nitrate, nitrite and total nitrogen. VTT analysed strontium and total boron. All analysis methods, detection limits and accuracies are shown in Appendix 7.1.
7.5 Analysis results
7.5.1 Physico-chemical properties
The pH value of the groundwater sample was slightly alkaline (8.0). The electric conductivity of the groundwater sample was 4.1 mS/cm. Both of these parameters are in accordance with pH and conductivity measured manually during the scavenging period (pH 8.1…8.2, EC 4.4 mS/cm).
Davis and De Wiest (1967) have made a classification system for the water types. The water type of the sample from borehole PH3 was Na-Ca-Cl, when the dominating water type in these depths (0…150 m) is usually Na-Cl-HCO3 (Pitkänen et al. 2003). In earlier study (Pitkänen et al. 2003) it was also showed that when chloride concentration is 1000…1500 mg/L, calcium concentration is usually less than 250 mg/L. In this case the calcium concentration is a bit high (330 mg/L) compared to the chloride concentration (1140 mg/L).
The salinity of the groundwater sample (Total Dissolved Solids, TDS) is 2730 mg/L. According to the TDS-classification (Davis 1964) the sample is brackish (1000 < TDS < 10000 mg/L).
7.5.2 Results
The analysis results of water sample are shown in Table 7-2. Isotope analyses results are not available yet and they will be reported separately in further pilot hole reports. The analysis methods and accuracies are shown in Appendix 7.1 and analysis report is presented in Appendix 7.2.

54
Table 7-2. Analytical results of groundwater sample from PH3.
Parameter Units PH3
pH 8.0
Electric Conductivity mS/cm 4.1
Density g/ml 0.9998 Carbonate alkalinity, HCl uptake
mmol/L <0.05
Total alkalinity, HCl uptake mmol/L 2.72
Bicarbonate, HCO3- mg/L 170
Total acidity, NaOH uptake mmol/L 0.07
Ferrous iron, Fe2+ mg/L <0.01
Total iron, Fetot mg/L 0.01
Total iron, Fetot, GFAAS mg/L <0.017
Potassium, K mg/L 5.9
Calcium, Ca mg/L 330
Manganese, Mn µg/L 280
Magnesium, Mg mg/L 46
Sodium, Na mg/L 590
Silicate, SiO2 mg/L 11
Fluoride, F mg/L 0.5
Chloride, Cl mg/L 1140
Bromide, Br mg/L 3.8
Sulphate, SO42- mg/L 150
Sulphur, Stot mg/L 49
Sulphide, S2- mg/L <0.01
Nitrite, NO2 mg/L <0.01
Nitrate, NO3 mg/L -
Nitrogen, Ntotal mg/L <0.2
DIC mg/L 35
DOC mg/L <1.8
Strontium, Sr mg/L 1.6 Boron, Btotal mg/L 0.58
Ammonium, NH4+ mg/L 0.068
Phosphate, PO4 mg/L <0.03
Sodium fluorescein
µg/L <10
GFAAS= graphite atom adsorption technique - = could not be analysed due to the high chloride concentration

55
7.6 Representativeness of the samples
7.6.1 Charge balance
Representativity of the groundwater sample can be estimated by charge balance (CB) analysis, which is calculated as a percentage, using the following equation:
CB(%) = (Cations - Anions)/ (Cations + Anions) x 100 (7-1)
For this, the concentration mg/L, have to be converted into mEq/L, with the following equation:
mEq/L = c × charge × (1/M) (7-2)
Where c = concentration of the ion, mg/L, charge = mEq/mmol and M = molecular weight of the ion, mg/mmol.
The total concentrations (mEq/L) of the anions and cations are summarized and calculated using Equations 7-1 and 7-2. The charge balance can be evaluated using Hounslow's (1995) criteria (results must be within ± 5 %). The charge balance of groundwater sample is as high as 9.6 % probably due to the high calcium concentration (see section 7.5.1).
7.6.2 Uncertainties of the laboratory analyses
The quality of analyses is checked with the laboratory quality control (QC) samples and with saline reference water samples (OLSO). Results from the OLSO reference water analyses are given in Appendix 7.3.
The relative standard deviation (RSD) values for the analysed chemical parameters were calculated from at least three parallel samples. Analyses succeeded excellently with RSD values under 6 %. All RSD values are presented in Appendix 7.2.

56

57
8 SUMMARY
The pilot hole ONK-PH3 was drilled in September 2005. The final borehole depth was 145.04 metres between chainage interval 696.87…841.78. The requirement for the hole was so stay inside the planned access tunnel profile of ONKALO. The deviation of the borehole was measured frequently during the drilling phase to control the need for steering the hole. No steering by wedging or directional drilling was needed. Triple tube wireline (NW/L) core barrel was used to get almost undisturbed core samples and to maximise core and fracture filling recovery. The aim during the drilling work was to orientate core samples as much as possible. 99,7 metres (69 %) of the total length of the borehole were orientated. Electric conductivity was measured from the collected returning water samples.
Logging of the core samples was carried out immediately after core barrel was emptied. The core-drilled sample mainly consists of diatexitic gneiss (62.7 %) but also pegmatitic granite (25.5 %), veined gneiss (7.8 %) and mafic-, mica- and quartz gneiss (1-2 %) sections occur.
The rock mechanical logging was based on Q-classification. Rock strength and deformation properties were tested with a Rock Tester-equipment. According to test results the mean uniaxial compressive strength is 129 MPa, the average Young’s modulus 38 GPa and the average Poisson’s ratio 0.20.
Difference Flow method/Overlapping i.e. the detailed flow logging mode was used to determine the location of hydraulically conductive fractures in the borehole with their transmissivities. The flow logging was performed with 0.5 m section length and with 0.1 m depth increments. Water loss tests (Lugeon tests) were used to give background information for the grouting design.
Geophysical borehole logging and optical imaging surveys of the pilot hole included the field work of all the surveys, the integration of the data as well as interpretation of the acoustic and borehole radar data. The data from borehole imaging and geophysics contributed to fracture detection and orientation as well as further description of the crystalline bedrock at the Olkiluoto site. The obtained data was immediately applied to rock engineering design (grouting).
One of the objectives of the geochemical study was to get information about the composition of ONKALO's groundwater. The groundwater samples from PH3 were collected from the sampling section 102.09…144.91 m. The water type of the sample from borehole PH3 was Na-Ca-Cl, when the dominating water type in these depths (0…150 m) is usually Na-Cl-HCO3. The calcium concentration is a bit high (330 mg/L) compared to the chloride concentration (1140 mg/L). The salinity of the groundwater sample (Total Dissolved Solids, TDS) is 2730 mg/L.

58

59
REFERENCES
ALT 2001. WellCAD user’s guide for version 3.0. Advanced Logic Technologies, Luxembourg. 831 p.
Barton, N. 2002. Some new Q-value correlations to assist in site characterization and tunnel design. International Journal of Rock Mechanics & Mining Sciences 39 (2002), 185-216.
Barton, N., Lien, R. & Lunde, J. 1974. Engineering classification of rock masses for the desingn of tunnel supportu. Rock Mechanics. December 1974. Vol. 6 No. 4. Springger Verlag. Wien, New York. 189-236 pp.
Carlsson, L. and Gustafson, G. 1991. Provpumpning som geohydrologisk undersökningsmetodik (In Swedish). Application of pumping test analysis for geohydrological investigations. Byggforskningsrådet, Rapport R66:1991, Stockholm.
Cooper, H, H, & Jacob, C, E, 1946. A generalized graphical method for evaluating formation constants and summarizing well-field history. American geophysical union transactions 27: 256-534.
Davis, S.N. 1964. The Chemistry of saline waters. IN: Krieger, R.A. – Discussion Groundwater, vol 2 (1), 51.
Davis, S.N. & De Wiest, R.J.M. 1967. Hydrogeology, 2. ed., Wiley, New York.
Doe, T. W. and Geier, J. E. 1990. Interpretation of Fracture System Geometry Using Well Test Data. SKB, Stripa project Technical Report 91-03, Stockholm.
Drimmie, R.J., Heemskerk, A.R. and Johnson, J.C., Tritium analysis. Technical Procedure 1.0, Rev 03. Environmental Isotope Laboratory, 28 p. Depatment of Earth Sciences, university of Waterloo, Canada
Emmelin, A., Eriksson, M., Fransson, Å. 2004. Characterisation, design and execution of two grouting fans at 450 m level, ÄSPÖ HRL. SKB R-04-58, Stockholm
Gardemeister, R., Johansson, S., Korhonen, P., Patrikainen, P. & Vähäsarja, P. 1976. Rakennusgeologisen kalliotutkimuksne soveltaminen. (The application of Finnish engineering geological bedrock classification, in Finnish). Espoo: Technical Research Centre of Finland, Geotechnical laboratory. 38 p. Research note 25.
Grimstad, E. & Barton, N. 1993. Updating of the Q-system for NMT. Proceedings of Sprayed Concrete, 18-21 December 1993. Fagernäs. Norway
Gustafson, G. 1986. Geohydrologiska förundersökningar i berg. Stiftelsen Bergteknisk Forskning, BeFo 84:1/86. Stockholm.

60
Heikkonen, J., Heikkinen, E. & Mäntynen, M. 2001. Mathematical modelling of temperature adjustment algorithm for groundwater electrical conductivity on basis of synthetic water sample analysis. Helsinki, Posiva Oy. Working report 2002-10 (in Finnish).
Hounslow, A.W. 1995. Water quality data: analysis and interpretation, CRC Lewis Pub-lishers.
ISRM. 1981. Suggested Methods for Determining the Uniaxial Compressive Strength and Deformability of Rock Materials. In Rock Characterization Testing & Monitoring. Oxford, Pergamon Press. s. 113-116.
ISRM. 1985. Suggested Method for Determining Point Load Strength. International Journal Rock Mech. Min. Sci. & Geomech. Vol. 22, no 2. S. 51-60.
Korhonen, K-H., Gardemeister, R., Jääskeläinen, H., Niini, H. & Vähäsarja, P. 1974. Rakennusalan kallioluokitus (Engineering geological bedrock classification, in Finnish). Espoo: Technical Research Centre of Finland, Geotechnical laboratory. 78 p. Research note 12.
Kärki, A. & Paulamäki, S. 2006. Petrology of Olkiluoto. Eurajoki, Finland:Posiva Oy. Posiva Working report 2006-07.
Lahti, M., Tammenmaa J. ja Hassinen P. 2001. Kairanreikien OL-KR13 ja OL-KR14 geofysikaaliset reikämittaukset Eurajoen Olkiluodossa vuonna 2001 (Geophysical borehole logging of the boreholes OL-KR13 and OL-KR14 in Olkiluoto, Eurajoki, 2001). Työraportti 2001-30. Posiva Oy, 136 p.
Lahti, M., Tammenmaa, J. & Hassinen, P. 2003. Geophysical logging of boreholes OL-KR19, OL-KR19b, OL-K20, OL-KR20b, OL-KR22, OL-KR22b and OL-KR8 continuation at Olkiluoto, Eurajoki 2002. Posiva Oy. 176 p. Working report 2003-05.
Lahti, M. 2004a. Digital borehole imaging of the boreholes KR6, KR8 continuation, KR19, KR19b, KR20, KR20b, KR21, KR22, KR22b, KR23, KR23b and KR24 at Olkiluoto during autumn 2003. Posiva Oy. Working report 2004-27. 39 p.
Lahti, M 2004b. Digital borehole imaging of the boreholes KR24 upper part and PH1 at Olkiluoto, March 2004. Posiva Oy. Working report 2004-28. 21 p.
Lahti, M & Heikkinen, E. 2004. Geophysical borehole logging of the borehole PH1 in Olkiluoto, Eurajoki 2004. Posiva Oy. Working report 2004-43. 30 p.
Lahti, M & Heikkinen, E. 2005. Geophysical borehole logging and optical imaging of the pilot hole ONK-PH2. Posiva Oy. Working report 2005-04. 72 p

61
Laurila, T. Tammenmaa J. ja Hassinen P. 1999. Kairareikien HH-KR7 ja HH-KR8 geofysikaaliset reikämittaukset Loviisan Hästholmenilla vuonna 1999 (Geophysical borehole logging of the boreholes HH_KR7 and HH-KR8 at Hästholmen, Loviisa, 1999). Posiva Oy, Työraportti 99-22.
Ludvigson, J-E., Hansson, K. & Rouhiainen, P. 2002. Methodology study of Posiva difference flow meter in borehole KLX02 at Laxemar. Stockholm, Sweden: SKB AB. R-01-52.
Marsily, G. 1986. Quantitative Hydrogeology, Groundwater Hydrology for Engineers. Academic Press, Inc. ISBN 0-12-208915-4.
Niinimäki, R. 2004. Core drilling of Pilot Hole OL-PH1 at Olkiluoto in Eurajoki 2003-2004. Eurajoki, Finland: Posiva Oy. Posiva Working report 2004-05, 95 p.
Paaso, N. (toim.), Mäntynen, M., Vepsäläinen, A. ja Laakso, T. 2003. Posivan vesinäytteenoton kenttätyöohje, rev.3 (Field manual for the water sampling of Posiva - Updated version 2003, rev.3.). Työraportti 2003-02. (Abstract in English)
Paillet, F. L., and Cheng, C. H., 1991, Acoustic Waves in Boreholes, C. H., CRC Press, Boca Raton, FL, 264 p.
Pitkänen, P., Partamies, S. & Luukkonen, A. 2004. Hydrogeochemical interpretation of baseline groundwater conditions at the Olkiluoto site. Posiva Oy. 136 s. POSIVA 2003-07.
Pohjanperä, P., Wanne, T. & Johansson, E. 2005. Point load test results from Olkiluoto area – Determination of strength of intact rock from boreholes KR1-KR28 and PH1. Working Report 2005 -. Posiva Oy. Posiva Working report 2005-59, 49 p.
Posiva Oy, 2003. ONKALO underground characterization and research programme (UCRP). Työraportti 2003-03.
RadInter. 1999. Software Manual. Version 1.2. Malå, Sweden. Malå Geoscience, 13 p.
Rautio, T. 2005 A. Core Drilling of Deep Borehole OL-KR34 at Olkiluoto in Eurajoki 2004. Posiva Oy, Working Report 2005-36, 80 p.
Rautio, T. 2005 B. Core Drilling of Deep Borehole OL-KR35 at Olkiluoto in Eurajoki 2004. Posiva Oy, Working Report 2005-37, 78 p. Rautio, T. 2005 C. Core Drilling of Deep Borehole OL-KR36 at Olkiluoto in Eurajoki 2004. Posiva Oy, Working Report 2005-38, 88 p.
ReflexW. 2003. Version 3.0. Karlsruhe, Germany. K-J. Sandmeier. 341 p
Saanio, V. (resp.ed.). 1987. Tunneli- ja kalliorakennus. (Tunnelling and construction in rock, in Finnish). Helsinki. RIL 154-1. Association of Finnish Civil Engineers RIL. 363 p. ISBN 951-758-116-5.

62
Saksa, P., Hellä, P., Lehtimäki, T., Heikkinen, E. & Karanko, A. 2001. Reikätutkan toimivuusselvitys (On the performance of borehole radar method). Posiva, Working Report 2001-35, 134 p.
Salonen L. and Hukkanen H., Advantaged of low-background liquid scintillation alpha-spectrometry and pulse shape analysis in measuring 222Rn, uranium and 226Ra in groundwater samples, Journal of Radioanalytical and Nuclear Chemistry, Vol 226, Nos 1-2, 1997.
Vaittinen, T., Ahokas, H., Heikkinen, E., Hellä, P., Nummela, J., Saksa, P., Tammisto, E., Paulamäki, S., Paananen, M., Front, K. & Kärki, A. 2003. Bedrock model of the Olkiluoto site, version 2003/1. Posiva, Working Report 2003-43, 266 p.
Öhberg, A. & Rouhiainen, P. 2000. Posiva groundwater flow measuring techniques. Helsinki, Posiva Oy. Report POSIVA 2001-12.
Öhberg, A. (ed.), Aaltonen, I., Heikkinen, E., Kemppainen, K., Lahti, M., Mattila, J., Niemonen, J., Paaso, N., Pussinen, V & Rouhiainen, P. 2005. Drilling and the associated borehole measurements of the pilot hole ONK-PH2. Eurajoki, Finland: Posiva Oy. Posiva, Working report 2005-63, 86 p.
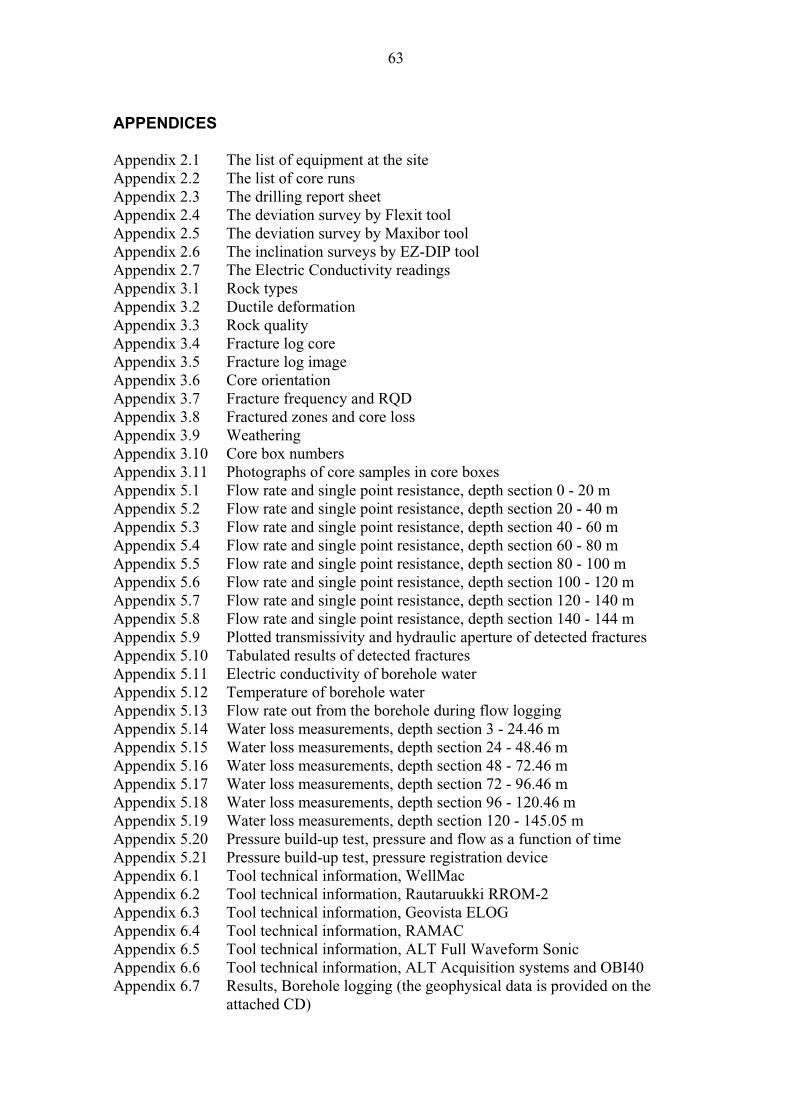
63
APPENDICES
Appendix 2.1 The list of equipment at the site Appendix 2.2 The list of core runs Appendix 2.3 The drilling report sheet Appendix 2.4 The deviation survey by Flexit toolAppendix 2.5 The deviation survey by Maxibor tool Appendix 2.6 The inclination surveys by EZ-DIP tool Appendix 2.7 The Electric Conductivity readings Appendix 3.1 Rock types Appendix 3.2 Ductile deformation Appendix 3.3 Rock quality Appendix 3.4 Fracture log core Appendix 3.5 Fracture log image Appendix 3.6 Core orientation Appendix 3.7 Fracture frequency and RQD Appendix 3.8 Fractured zones and core loss Appendix 3.9 Weathering Appendix 3.10 Core box numbers Appendix 3.11 Photographs of core samples in core boxes Appendix 5.1 Flow rate and single point resistance, depth section 0 - 20 m Appendix 5.2 Flow rate and single point resistance, depth section 20 - 40 m Appendix 5.3 Flow rate and single point resistance, depth section 40 - 60 m Appendix 5.4 Flow rate and single point resistance, depth section 60 - 80 m Appendix 5.5 Flow rate and single point resistance, depth section 80 - 100 m Appendix 5.6 Flow rate and single point resistance, depth section 100 - 120 m Appendix 5.7 Flow rate and single point resistance, depth section 120 - 140 m Appendix 5.8 Flow rate and single point resistance, depth section 140 - 144 m Appendix 5.9 Plotted transmissivity and hydraulic aperture of detected fractures Appendix 5.10 Tabulated results of detected fractures Appendix 5.11 Electric conductivity of borehole water Appendix 5.12 Temperature of borehole water Appendix 5.13 Flow rate out from the borehole during flow logging Appendix 5.14 Water loss measurements, depth section 3 - 24.46 m Appendix 5.15 Water loss measurements, depth section 24 - 48.46 m Appendix 5.16 Water loss measurements, depth section 48 - 72.46 m Appendix 5.17 Water loss measurements, depth section 72 - 96.46 m Appendix 5.18 Water loss measurements, depth section 96 - 120.46 m Appendix 5.19 Water loss measurements, depth section 120 - 145.05 m Appendix 5.20 Pressure build-up test, pressure and flow as a function of time Appendix 5.21 Pressure build-up test, pressure registration device Appendix 6.1 Tool technical information, WellMac Appendix 6.2 Tool technical information, Rautaruukki RROM-2 Appendix 6.3 Tool technical information, Geovista ELOG Appendix 6.4 Tool technical information, RAMAC Appendix 6.5 Tool technical information, ALT Full Waveform Sonic Appendix 6.6 Tool technical information, ALT Acquisition systems and OBI40 Appendix 6.7 Results, Borehole logging (the geophysical data is provided on the attached CD)

64
Appendix 6.8 Results, Radargram Appendix 6.9 Results, Radar orientations Appendix 6.10 Results, Interpreted reflectors, table Appendix 6.11 Results, Interpreted reflectors on radargram Appendix 6.12 Results, Acoustic logging Appendix 6.13 Results, Acoustic image Appendix 6.14 Results, Example of Borehole image (the rest of the images on CD) Appendix 7.1 Parameters, analysis methods, laboratories and accuracies Appendix 7.2 Analysis results Appendix 7.3 OLSO reference water results

65 Appendix 2.1
LIST OF DRILLING EQUIPMENT
Drill Rig year
Mercedes Bentz truck diesel 1988
Onram-1000/4 drill rig electric 2004
Electric transformer Trafotek type KTK-620 400/690V 100 KVA
Electric switching exchange Un 690/400V, In 250 A
Front device for electric cable Un 690/400V, In 250 A, fuse 200 A
Electric cable Buflex TP-C 1000 V 130 meters
In electric system internal pilot connector (=safety system) when 400 V voltage is used
Other equipment
Toyota Hilux van diesel 1999
Peugeot boxer van diesel 2002
Valtra traktor 8650 diesel 2003
Traktor trailer Tuhti
Flexit deviation survey tool
Maxibor deviation survey tool
Inclinometer EZ-DIP
Fiber class rods 20 pc for inclinometer
Water gauge 2 pc
Casing rods 84/77 mm
WL-76 drill rods
WL-76 triple core tube
Drill bits
Reamers
Core orientation marking tool
Core boxes
Aluminium paper
Tools etc.
Wedging equipment for directional wedging
Water containers plastic 1000 liters 2 pc
Water precipitation pool plastic 500 liters2 pc
Water pipeline plastic
Water electric conductivity meter package Pioneer Ion Check 65
Personal mine lamps 6 pc
personal mine rescue package 4 pc
digital camera
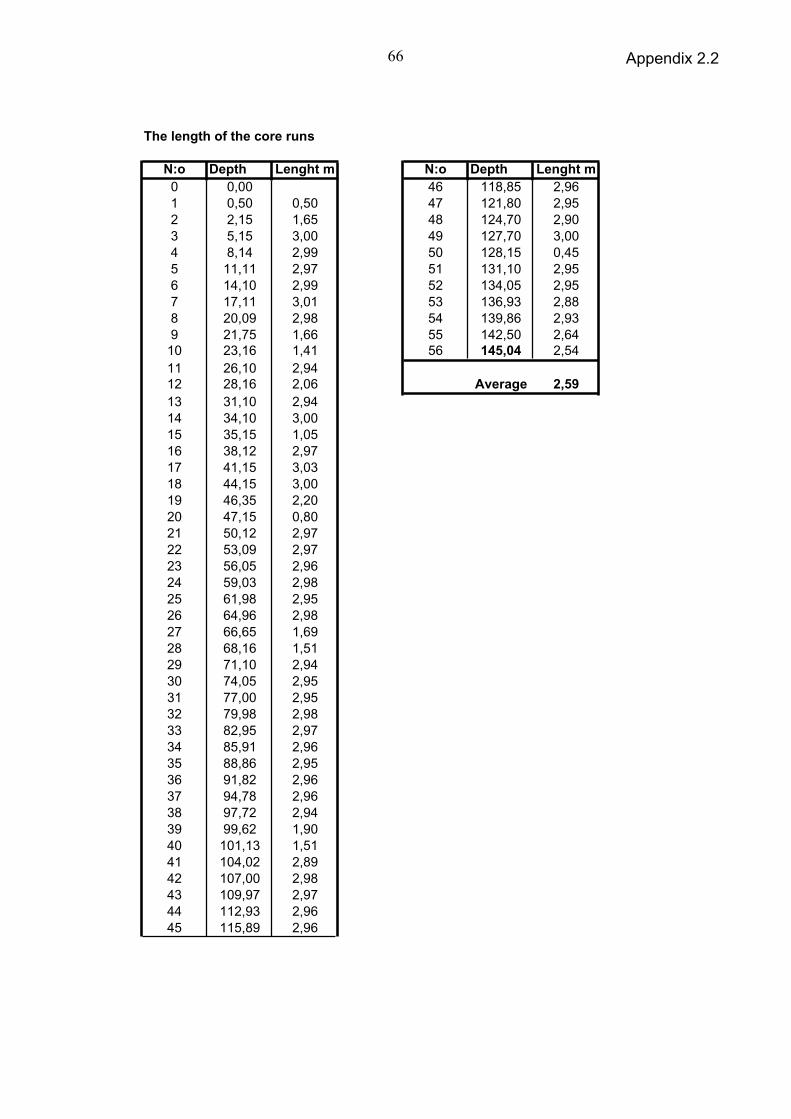
66 Appendix 2.2
The length of the core runs
N:o Depth Lenght m N:o Depth Lenght m0 0,00 46 118,85 2,961 0,50 0,50 47 121,80 2,952 2,15 1,65 48 124,70 2,903 5,15 3,00 49 127,70 3,004 8,14 2,99 50 128,15 0,455 11,11 2,97 51 131,10 2,956 14,10 2,99 52 134,05 2,957 17,11 3,01 53 136,93 2,888 20,09 2,98 54 139,86 2,939 21,75 1,66 55 142,50 2,6410 23,16 1,41 56 145,04 2,5411 26,10 2,9412 28,16 2,06 Average 2,5913 31,10 2,9414 34,10 3,0015 35,15 1,0516 38,12 2,9717 41,15 3,0318 44,15 3,0019 46,35 2,2020 47,15 0,8021 50,12 2,9722 53,09 2,9723 56,05 2,9624 59,03 2,9825 61,98 2,9526 64,96 2,9827 66,65 1,6928 68,16 1,5129 71,10 2,9430 74,05 2,9531 77,00 2,9532 79,98 2,9833 82,95 2,9734 85,91 2,9635 88,86 2,9536 91,82 2,9637 94,78 2,9638 97,72 2,9439 99,62 1,9040 101,13 1,5141 104,02 2,8942 107,00 2,9843 109,97 2,9744 112,93 2,9645 115,89 2,96

67 Appendix 2.3
Drilling report sheet ONK-PH3
Day Time Depth Remarks Shift Start Pulling Returningof change of the waterthe the run press. gauge gaugehole run (bar) reading reading
5.9. 4:00 Mobilization 5.9. 13:00 Arrival to Olkiluoto 5.9. 14:00 Unloading completed 5.9. 14:00 Meeting with Posiva5.9. 17:00 Waiting for start 5.9. 18:00 Waiting for start x6.9. 2:30 Waiting for start 6.9. 6:00 Moving the rig to Onkalo x6.9. 13:00 Luchbreak 6.9. 13:30 Casing drilling x x6.9. 14:45 0,50 Cementing the casing 6.9. 15:15 0,50 Waiting for cement hardening 6.9. 18:00 0,50 Waiting for cement harde x6.9. 18:40 0,50 Drilling starts x 5 89673 476.9. 19:04 2,15 x x 90189 1296.9. 20:00 2,15 x 10 90247 1606.9. 20:25 5,15 x x 90802 6926.9. 21:46 5,15 x x 12 90892 7916.9. 22:07 8,14 x 91395 12896.9. 22:57 8,14 x x 15 91580 14466.9. 23:18 11,11 x 92152 20076.9. 23:58 11,11 x x 13 92355 21877.9. 0:21 14,10 x 92877 26967.9. 1:09 14,10 Break 7.9. 1:41 14,10 x x 16 93074 28687.9. 2:06 17,11 x 93621 34137.9. 2:48 17,11 x x 11 93909 36547.9. 3:09 20,09 x 94406 41417.9. 3:45 20,09 x 17 94689 44047.9. 3:58 21,75 x 95015 47337.9. 4:28 21,75 x x 17 95238 49687.9. 4:40 23,16 x 95524 52507.9. 5:28 23,16 x x 18 95804 55347.9. 5:48 26,10 x 96325 60387.9. 6:03 26,10 x7.9. 7:36 26,10 Waiting for surveyor 7.9. 8:19 26,10 Deviation survey by flexit7.9. 8:50 26,10 x 20 96692 64657.9. 9:06 28,16 x x 96962 66457.9. 9:50 28,16 x 20 97927 77237.9. 10:07 31,10 x x 98420 81767.9. 10:54 31,10 x 15 98929 82457.9. 11:07 34,10 x 99211 87437.9. 11:40 34,10 Break 7.9. 12:25 34,10 x x 407.9. 12:45 35,15 Some core left in hole, ne x 99608 91797.9. 13:41 35,15 x x 70 100369 98627.9. 13:59 38,12 x 100995 103297.9. 15:08 38,12 x x 40 101763 109877.9. 15:29 41,15 x 102447 11260
waterFlushing

68 Appendix 2.3
7.9. 16:04 41,15 Fixing the core tube 7.9. 16:12 41,15 Lowering core tube into th7.9. 16:15 41,15 x x 15 102913 119967.9. 16:41 44,15 x x7.9. 17:17 44,15 Core tube not locking in p7.9. 17:27 44,15 Lifting and lowering drill r7.9. 17:43 44,15 Lowering core tube into th7.9. 18:00 44,15 x7.9. 18:34 44,15 x x 105515 145757.9. 19:02 46,35 core blocking in tube, cor x 105959 150137.9. 20:13 46,35 x x 18 106415 154807.9. 20:27 47,15 x 106630 157297.9. 21:19 47,15 x x 18 107222 163407.9. 21:40 50,12 x 107729 167437.9. 22:04 50,12 Deviation survey by flexit7.9. 23:12 50,12 Deviation survey complet8.9. 0:11 50,12 Break 8.9. 0:53 50,12 x x 21 108765 174798.9. 1:14 53,09 x 109308 180158.9. 1:49 53,09 x x 18 109940 186478.9. 2:08 56,05 x 110437 191288.9. 2:49 56,05 x x 19 111171 197338.9. 3:15 59,03 x 111735 202908.9. 3:51 59,03 x x 20 112485 209608.9. 4:13 61,98 x 112878 213418.9. 4:50 61,98 x x 12 113702 220698.9. 5:16 64,96 x 114165 225038.9. 5:51 64,96 x 8.9. 6:00 64,96 Measuring the volume of 8.9. 6:30 64,96 x x 20 114938 232928.9. 7:17 66,65 x 115925 233758.9. 7:37 66,65 x x 15 116494 239808.9. 7:52 68,16 x 116776 243918.9. 8:53 68,16 x x 118793 259068.9. 9:23 71,10 x 119349 266848.9. 10:27 71,10 x x 40 120188 273738.9. 11:06 74,05 x 120781 280568.9. 12:36 74,05 x x 121708 287858.9. 13:14 77,00 x 40 122254 293408.9. 13:30 77,00 Deviation survey by flexit8.9. 14:34 77,00 Bit change 8.9. 15:18 77,00 x x 33 123752 307448.9. 15:44 79,98 x 124473 315578.9. 16:31 79,98 Deviation survey by maxi8.9. 17:31 79,98 x x 30 125732 326538.9. 17:51 79,98 x 8.9. 18:14 82,95 x 126538 334688.9. 19:13 82,95 x x 40 127499 342628.9. 19:37 85,91 x 128445 351628.9. 20:25 85,91 x x 40 129452 360658.9. 20:51 88,86 x 130418 370308.9. 21:32 88,86 x x 40 131433 379488.9. 22:04 91,82 x 132519 390298.9. 22:51 91,82 x x 42 133561 400418.9. 23:19 94,78 x 134635 410688.9. 23:57 94,78 Break
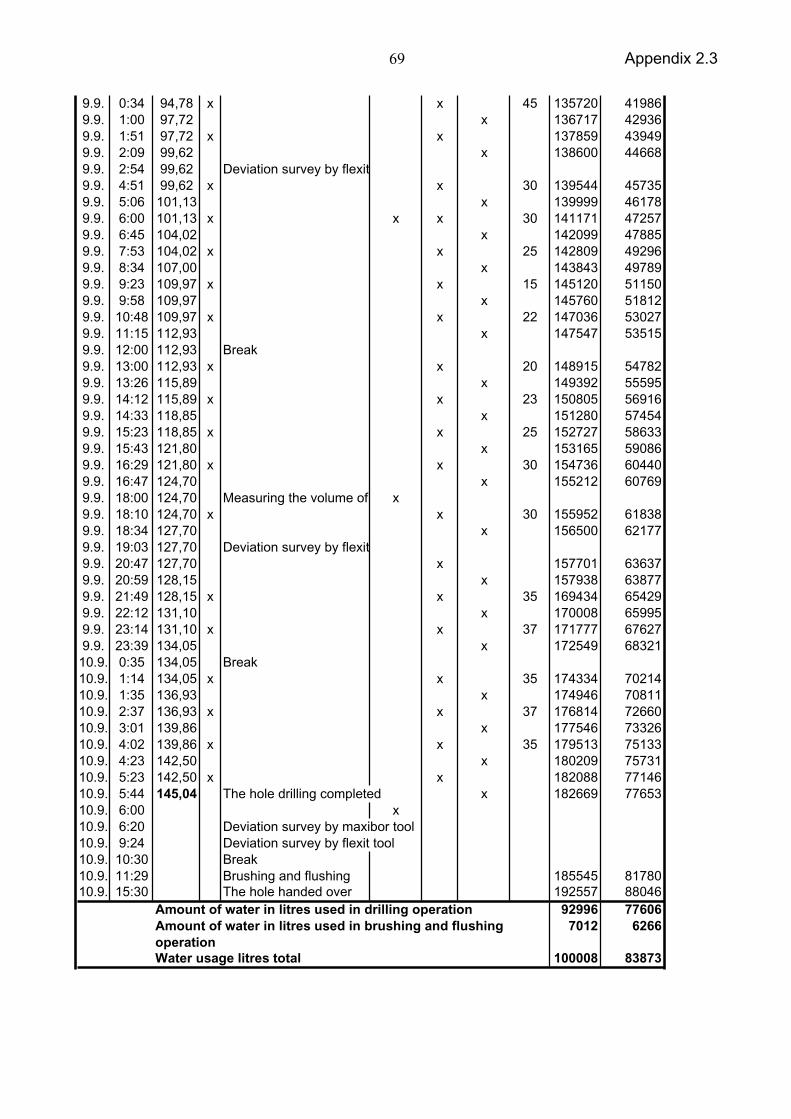
69 Appendix 2.3
9.9. 0:34 94,78 x x 45 135720 419869.9. 1:00 97,72 x 136717 429369.9. 1:51 97,72 x x 137859 439499.9. 2:09 99,62 x 138600 446689.9. 2:54 99,62 Deviation survey by flexit9.9. 4:51 99,62 x x 30 139544 457359.9. 5:06 101,13 x 139999 461789.9. 6:00 101,13 x x x 30 141171 472579.9. 6:45 104,02 x 142099 478859.9. 7:53 104,02 x x 25 142809 492969.9. 8:34 107,00 x 143843 497899.9. 9:23 109,97 x x 15 145120 511509.9. 9:58 109,97 x 145760 518129.9. 10:48 109,97 x x 22 147036 530279.9. 11:15 112,93 x 147547 535159.9. 12:00 112,93 Break 9.9. 13:00 112,93 x x 20 148915 547829.9. 13:26 115,89 x 149392 555959.9. 14:12 115,89 x x 23 150805 569169.9. 14:33 118,85 x 151280 574549.9. 15:23 118,85 x x 25 152727 586339.9. 15:43 121,80 x 153165 590869.9. 16:29 121,80 x x 30 154736 604409.9. 16:47 124,70 x 155212 607699.9. 18:00 124,70 Measuring the volume of x9.9. 18:10 124,70 x x 30 155952 618389.9. 18:34 127,70 x 156500 621779.9. 19:03 127,70 Deviation survey by flexit9.9. 20:47 127,70 x 157701 636379.9. 20:59 128,15 x 157938 638779.9. 21:49 128,15 x x 35 169434 654299.9. 22:12 131,10 x 170008 659959.9. 23:14 131,10 x x 37 171777 676279.9. 23:39 134,05 x 172549 6832110.9. 0:35 134,05 Break10.9. 1:14 134,05 x x 35 174334 7021410.9. 1:35 136,93 x 174946 7081110.9. 2:37 136,93 x x 37 176814 7266010.9. 3:01 139,86 x 177546 7332610.9. 4:02 139,86 x x 35 179513 7513310.9. 4:23 142,50 x 180209 7573110.9. 5:23 142,50 x x 182088 7714610.9. 5:44 145,04 The hole drilling completed x 182669 7765310.9. 6:00 x10.9. 6:20 Deviation survey by maxibor tool10.9. 9:24 Deviation survey by flexit tool10.9. 10:30 Break10.9. 11:29 Brushing and flushing 185545 8178010.9. 15:30 The hole handed over 192557 88046
Amount of water in litres used in drilling operation 92996 77606Amount of water in litres used in brushing and flushing 7012 6266operationWater usage litres total 100008 83873

70 Appendix 2.4
Deviation survey by Flexit tool
Hole ID Station Dip Azimuth Easting Northing Elevation UpDown LeftRight Shortfall
Metres Degrees Degrees Metres Metres Metres Metres Metres Metres
ONK-PH3(0-144M) 0 -5,72 225,00 1526126,62 6792046,87 -59,98 0,00 0,00 0,00
ONK-PH3(0-144M) 3 -5,74 225,50 1526124,50 6792044,77 -60,28 0,00 0,01 0,00
ONK-PH3(0-144M) 6 -5,72 226,00 1526122,36 6792042,69 -60,58 0,00 0,05 0,00
ONK-PH3(0-144M) 9 -5,76 226,49 1526120,20 6792040,62 -60,88 0,00 0,12 0,00
ONK-PH3(0-144M) 12 -5,77 225,09 1526118,06 6792038,54 -61,18 0,00 0,16 0,00
ONK-PH3(0-144M) 15 -5,80 224,70 1526115,96 6792036,43 -61,48 -0,01 0,15 0,00
ONK-PH3(0-144M) 18 -5,83 223,75 1526113,88 6792034,29 -61,78 -0,01 0,11 0,00
ONK-PH3(0-144M) 21 -5,81 224,69 1526111,80 6792032,15 -62,09 -0,02 0,07 0,00
ONK-PH3(0-144M) 24 -5,87 223,52 1526109,72 6792030,01 -62,39 -0,02 0,03 0,00
ONK-PH3(0-144M) 27 -5,90 225,48 1526107,63 6792027,88 -62,70 -0,03 0,00 0,00
ONK-PH3(0-144M) 30 -5,93 224,79 1526105,51 6792025,78 -63,01 -0,04 0,01 0,00
ONK-PH3(0-144M) 33 -5,93 225,38 1526103,40 6792023,67 -63,32 -0,05 0,01 0,00
ONK-PH3(0-144M) 36 -5,92 227,74 1526101,23 6792021,62 -63,63 -0,06 0,09 0,00
ONK-PH3(0-144M) 39 -5,98 225,06 1526099,07 6792019,56 -63,94 -0,08 0,17 -0,01
ONK-PH3(0-144M) 42 -6,00 225,33 1526096,95 6792017,46 -64,25 -0,09 0,18 -0,01
ONK-PH3(0-144M) 45 -6,07 223,37 1526094,87 6792015,32 -64,57 -0,11 0,14 -0,01
ONK-PH3(0-144M) 48 -6,12 225,88 1526092,77 6792013,20 -64,89 -0,13 0,12 -0,01
ONK-PH3(0-144M) 51 -6,16 229,70 1526090,56 6792011,20 -65,21 -0,15 0,27 -0,01
ONK-PH3(0-144M) 54 -6,17 226,17 1526088,35 6792009,20 -65,53 -0,17 0,42 -0,02
ONK-PH3(0-144M) 57 -6,13 226,47 1526086,19 6792007,14 -65,85 -0,20 0,49 -0,02
ONK-PH3(0-144M) 60 -6,16 226,28 1526084,03 6792005,08 -66,17 -0,22 0,56 -0,02
ONK-PH3(0-144M) 63 -6,14 226,64 1526081,87 6792003,03 -66,49 -0,24 0,64 -0,02
ONK-PH3(0-144M) 66 -6,21 226,64 1526079,70 6792000,98 -66,82 -0,26 0,72 -0,02
ONK-PH3(0-144M) 69 -6,20 226,00 1526077,55 6791998,92 -67,14 -0,29 0,79 -0,02
ONK-PH3(0-144M) 72 -6,20 225,60 1526075,41 6791996,84 -67,46 -0,32 0,83 -0,02
ONK-PH3(0-144M) 75 -6,17 225,17 1526073,29 6791994,74 -67,79 -0,34 0,85 -0,02
ONK-PH3(0-144M) 78 -6,18 226,00 1526071,16 6791992,66 -68,11 -0,36 0,88 -0,02
ONK-PH3(0-144M) 81 -6,19 227,00 1526068,99 6791990,60 -68,43 -0,39 0,96 -0,02
ONK-PH3(0-144M) 84 -6,18 228,00 1526066,79 6791988,59 -68,76 -0,41 1,09 -0,03
ONK-PH3(0-144M) 87 -6,18 229,34 1526064,55 6791986,62 -69,08 -0,44 1,28 -0,03
ONK-PH3(0-144M) 90 -6,20 229,60 1526062,29 6791984,68 -69,40 -0,46 1,51 -0,04
ONK-PH3(0-144M) 93 -6,23 227,70 1526060,05 6791982,71 -69,73 -0,49 1,70 -0,05
ONK-PH3(0-144M) 96 -6,28 226,77 1526057,86 6791980,69 -70,06 -0,52 1,82 -0,05
ONK-PH3(0-144M) 99 -6,32 225,64 1526055,71 6791978,62 -70,38 -0,55 1,88 -0,05
ONK-PH3(0-144M) 102 -6,24 225,86 1526053,57 6791976,54 -70,71 -0,58 1,92 -0,05
ONK-PH3(0-144M) 105 -6,25 226,00 1526051,43 6791974,47 -71,04 -0,60 1,97 -0,05
ONK-PH3(0-144M) 108 -6,24 226,25 1526049,28 6791972,40 -71,36 -0,63 2,03 -0,05
ONK-PH3(0-144M) 111 -6,24 226,50 1526047,12 6791970,34 -71,69 -0,66 2,10 -0,05
ONK-PH3(0-144M) 114 -6,21 226,50 1526044,96 6791968,29 -72,02 -0,68 2,18 -0,05
ONK-PH3(0-144M) 117 -6,21 226,80 1526042,79 6791966,24 -72,34 -0,71 2,26 -0,06
ONK-PH3(0-144M) 120 -6,24 227,00 1526040,61 6791964,21 -72,67 -0,74 2,36 -0,06
ONK-PH3(0-144M) 123 -6,25 227,30 1526038,42 6791962,18 -72,99 -0,76 2,47 -0,06
ONK-PH3(0-144M) 126 -6,24 227,66 1526036,23 6791960,16 -73,32 -0,79 2,60 -0,06
ONK-PH3(0-144M) 129 -6,28 227,10 1526034,03 6791958,14 -73,65 -0,82 2,73 -0,06
ONK-PH3(0-144M) 132 -6,28 226,85 1526031,85 6791956,11 -73,97 -0,85 2,83 -0,07
ONK-PH3(0-144M) 135 -6,32 227,15 1526029,67 6791954,07 -74,30 -0,88 2,93 -0,07
ONK-PH3(0-144M) 138 -6,34 227,45 1526027,48 6791952,05 -74,63 -0,91 3,05 -0,07
ONK-PH3(0-144M) 141 -6,36 227,45 1526025,28 6791950,04 -74,97 -0,95 3,18 -0,07
ONK-PH3(0-144M) 144 -6,32 227,45 1526023,09 6791948,02 -75,30 -0,98 3,31 -0,08
down right

71 Appendix 2.5
Deviation survey by Maxibor tool
Hole ID Station Easting Northing Elevation Dip Azimuth
ONKPH3 6 1526127 6792047 -59,98 -5,84 225,14
ONKPH3 9 1526125 6792045 -60,29 -5,87 225,16
ONKPH3 12 1526122 6792043 -60,59 -5,87 225,19
ONKPH3 15 1526120 6792041 -60,90 -5,84 225,18
ONKPH3 18 1526118 6792038 -61,20 -5,80 225,17
ONKPH3 21 1526116 6792036 -61,51 -5,79 225,17
ONKPH3 24 1526114 6792034 -61,81 -5,76 225,20
ONKPH3 27 1526112 6792032 -62,11 -5,72 225,21
ONKPH3 30 1526110 6792030 -62,41 -5,68 225,23
ONKPH3 33 1526108 6792028 -62,71 -5,65 225,25
ONKPH3 36 1526105 6792026 -63,00 -5,63 225,27
ONKPH3 39 1526103 6792024 -63,30 -5,66 225,27
ONKPH3 42 1526101 6792022 -63,59 -5,61 225,28
ONKPH3 45 1526099 6792020 -63,89 -5,55 225,30
ONKPH3 48 1526097 6792017 -64,18 -5,51 225,33
ONKPH3 51 1526095 6792015 -64,46 -5,43 225,37
ONKPH3 54 1526093 6792013 -64,75 -5,38 225,39
ONKPH3 57 1526091 6792011 -65,03 -5,38 225,39
ONKPH3 60 1526088 6792009 -65,31 -5,40 225,39
ONKPH3 63 1526086 6792007 -65,59 -5,40 225,40
ONKPH3 66 1526084 6792005 -65,88 -5,39 225,41
ONKPH3 69 1526082 6792003 -66,16 -5,36 225,41
ONKPH3 72 1526080 6792001 -66,44 -5,33 225,40
ONKPH3 75 1526078 6791999 -66,72 -5,34 225,42
ONKPH3 78 1526076 6791996 -66,99 -5,34 225,46
ONKPH3 81 1526074 6791994 -67,27 -5,35 225,50
ONKPH3 84 1526071 6791992 -67,55 -5,35 225,53
ONKPH3 87 1526069 6791990 -67,83 -5,34 225,56
ONKPH3 90 1526067 6791988 -68,11 -5,34 225,59
ONKPH3 93 1526065 6791986 -68,39 -5,32 225,60
ONKPH3 96 1526063 6791984 -68,67 -5,29 225,63
ONKPH3 99 1526061 6791982 -68,95 -5,27 225,68
ONKPH3 102 1526059 6791980 -69,22 -5,26 225,71
ONKPH3 105 1526056 6791978 -69,50 -5,26 225,71
ONKPH3 108 1526054 6791976 -69,77 -5,27 225,70
ONKPH3 111 1526052 6791973 -70,05 -5,28 225,71
ONKPH3 114 1526050 6791971 -70,32 -5,30 225,73
ONKPH3 117 1526048 6791969 -70,60 -5,31 225,74
ONKPH3 120 1526046 6791967 -70,88 -5,32 225,76
ONKPH3 123 1526044 6791965 -71,16 -5,31 225,77
ONKPH3 126 1526042 6791963 -71,43 -5,27 225,79
ONKPH3 129 1526039 6791961 -71,71 -5,27 225,80
ONKPH3 132 1526037 6791959 -71,99 -5,27 225,80
ONKPH3 135 1526035 6791957 -72,26 -5,25 225,81
ONKPH3 138 1526033 6791955 -72,54 -5,23 225,84
ONKPH3 141 1526031 6791953 -72,81 -5,21 225,85
ONKPH3 144 1526029 6791951 -73,08 -5,17 225,86
Deviation 1,02 metres down and 0,90 metres right

72 Appendix 2.6
Inclination surveys by EZ-DIP tool.
Borehole Readingdepth (m) (degrees)
2,15 -5,75,15 -5,78,14 -5,611,11 -5,514,10 -5,617,11 -5,721,75 -5,628,16 -5,831,10 -5,834,10 -5,935,15 -5,838,12 -5,941,15 -5,944,15 -5,946,35 -5,947,15 -6,150,12 -6,153,09 -6,156,05 -6,159,03 -6,261,98 -6,368,16 -6,271,10 -6,374,05 -6,377,00 -6,079,98 -6,182,95 -6,185,91 -5,988,86 -6,191,82 -6,194,78 -6,199,62 -6,0104,02 -6,2107,00 -6,1109,97 -5,9112,93 -6,3115,89 -6,1118,85 -6,2121,80 -6,2124,70 -6,2127,70 -6,1128,15 -6,1131,10 -6,3134,05 -6,0136,93 -6,2139,86 -6,2

73 Appendix 2.7
Conductivity readings from returned water PH3
Borehole Sample Electric Date Date
depth temperature conductivity measured sample
(metres) (degrees C) (µS/cm) was taken
2,15 25,6 321 9.9.2005 6.9.2005
5,15 26,9 229 9.9.2005 6.9.2005
8,14 25,6 259 9.9.2005 6.9.2005
11,11 24,8 225 9.9.2005 6.9.2005
14,10 26,9 254 9.9.2005 6.9.2005
17,11 26,0 252 9.9.2005 7.9.2005
18,50 24,7 246 9.9.2005 7.9.2005
22,30 24,7 259 9.9.2005 7.9.2005
23,50 24,9 256 9.9.2005 7.9.2005
27,10 24,9 414 9.9.2005 7.9.2005
29,10 24,5 254 9.9.2005 7.9.2005
32,00 24,8 362 9.9.2005 7.9.2005
34,90 24,5 270 9.9.2005 7.9.2005
36,00 24,9 282 9.9.2005 7.9.2005
38,70 24,7 248 9.9.2005 7.9.2005
41,90 24,3 263 9.9.2005 7.9.2005
45,25 24,7 249 9.9.2005 7.9.2005
46,80 25,1 247 9.9.2005 7.9.2005
48,25 24,5 266 9.9.2005 7.9.2005
50,45 23,8 258 9.9.2005 8.9.2005
53,95 21,2 257 10.9.2005 8.9.2005
56,90 21,0 258 10.9.2005 8.9.2005
59,25 21,2 271 10.9.2005 8.9.2005
62,50 21,1 373 10.9.2005 8.9.2005
65,20 21,4 256 10.9.2005 8.9.2005
66,95 21,5 320 10.9.2005 8.9.2005
68,70 21,6 294 10.9.2005 8.9.2005
71,80 21,6 293 10.9.2005 8.9.2005
74,60 21,3 399 10.9.2005 8.9.2005
77,90 21,6 251 10.9.2005 8.9.2005
80,30 21,3 243 10.9.2005 8.9.2005
83,40 20,8 204 10.9.2005 8.9.2005
86,67 20,7 225 10.9.2005 8.9.2005
89,25 20,8 214 10.9.2005 8.9.2005
92,35 20,7 213 10.9.2005 8.9.2005
96,10 20,7 219 10.9.2005 9.9.2005
98,10 20,8 217 10.9.2005 9.9.2005
99,90 20,8 1590 10.9.2005 9.9.2005
102,00 20,8 270 10.9.2005 9.9.2005
104,50 20,7 1611 10.9.2005 9.9.2005
107,60 20,9 284 10.9.2005 9.9.2005
110,60 21,4 328 11.9.2005 9.9.2005
112,90 21,3 725 11.9.2005 9.9.2005
116,30 21,2 289 11.9.2005 9.9.2005
119,50 20,9 293 11.9.2005 9.9.2005
122,90 20,9 312 11.9.2005 9.9.2005
125,10 21,0 1999 11.9.2005 9.9.2005
128,35 20,8 255 11.9.2005 9.9.2005
132,00 20,8 238 11.9.2005 9.9.2005
134,45 21,2 749 11.9.2005 10.9.2005
137,85 20,7 267 11.9.2005 10.9.2005
140,20 20,6 283 11.9.2005 10.9.2005
143,25 20,6 272 11.9.2005 10.9.2005
25,0 1000 9.9.2005 calibration
Readings corrected to temperature 20 degrees C

APPENDIX 3.1
ROCK TYPES
Hole ID: ONK-PH3 Contractor: KATI
Northing: 6792046.873 Drilling started: 6.9.2005
Easting: 1526126.618 Drilling ended: 10.9.2005
Elevation: -59.976 Machine/fixture: ONRAM 1000/4
Direction: 225.1355 Target: Verifing geological properties in the ONKALO profile (current layout).
Dip: -5.843 Purpose: Verification of geology
Core diameter: 50.2 Extension:
Casing: 0.9/1.0 Logging date: 7.-20.9.2005
Remarks: PL 696.87 Geologist: KJOK, HLAM, TJUU, NJK, TJUR, JENG
Max depth: 144.91
HOLE_ID M_FROM M_TO ROCK_TYPE
ONK-PH3 0 0.5 PGR
ONK-PH3 0.5 3.09 VGN
ONK-PH3 3.09 7.02 PGR
ONK-PH3 7.02 15.69 DGN
ONK-PH3 15.69 17.62 PGR
ONK-PH3 17.62 19.4 QGN
ONK-PH3 19.4 23.13 DGN
ONK-PH3 23.13 27.84 DGN
ONK-PH3 27.84 30.15 PGR
ONK-PH3 30.15 31.2 DGN
ONK-PH3 31.2 35.56 DGN
ONK-PH3 35.56 38.5 VGN
ONK-PH3 38.5 43.25 PGR
ONK-PH3 43.25 46.5 DGN
ONK-PH3 46.5 48.75 PGR
ONK-PH3 48.75 51.32 DGN
ONK-PH3 51.32 56.4 PGR
ONK-PH3 56.4 59.36 DGN
ONK-PH3 59.36 61 PGR
ONK-PH3 61 69.5 DGN
ONK-PH3 69.5 77 PGR
ONK-PH3 77 83.7 DGN
ONK-PH3 83.7 85.91 PGR
ONK-PH3 85.91 90.55 DGN
ONK-PH3 90.55 92.02 MFGN
ONK-PH3 92.02 95.8 DGN
ONK-PH3 95.8 97.72 PGR
ONK-PH3 97.72 108 DGN
ONK-PH3 108 109.17 DGN
ONK-PH3 109.17 122.6 DGN
ONK-PH3 122.6 126.75 DGN
ONK-PH3 126.75 128.78 DGN
ONK-PH3 128.78 134.58 VGN
ONK-PH3 134.58 138.4 DGN
ONK-PH3 138.4 140.9 MGN
ONK-PH3 140.9 142 DGN
ONK-PH3 142 144.25 PGR
ONK-PH3 144.25 144.91 MGN
DESCRIPTION
Casing. Mainly pegmatitic granite with mica bands. Some pinite spots.
Mixture of pegmatitic veins (2-10 cm)/spots and mica bands -> DGN. Leucosome 50-80 %. Alteration pinite and kaolinite.
Veined gneiss, where mica bands and leucosome appr. 30 %. Alteration pinite and kaolinite. Few fractures. Foliation intensity medium.
Light red coarse grained pegmatitic granite. Alteration pinite, kaolinite and sericite. Some mica band and spot. Unfoliated.
Mixture of pegmatitic veins (10-15 cm)/spots and mica bands. Leucosome 50-80 %. Can be described as pegmatitic granite with plenty
of micas. End of section tecxture is pit like sheared. Alteration pinite and kaolinite.
Coarse grained red pegmatite. Some biotite/chlorite blasts occurs. Weak alteration. 17.28-17.33 chloritizated fracture intersection.
Fine grained quartz gneiss. 18.18-18.50 pegmatitic vein with mica bands. Mica amounth degreases to borders.
Strongly altered (chloritization, pinite) and fractured diatexitic gneiss. Leucosome >50 %. Some slickensided and grain filled fractures.
Leucosome 50-70 %. Alteration pinite and kaolinite. Very few fracture.
Mainly coarse grained pegmatite, where some mica bands and pinite spots.
Strongly weathered diatexitic gneiss. Surface of drill core is "rugged"
Leucosome 50-70 %. Alteration pinite and kaolinite. Very few fracture. 32.81-35.15 drilled twice.
Veined texture, with 50 % of leucosome. Alteration pinite.
Mainly coarse to medium grained pegmatite, where mica bands (5-15 cm) and pinite spots. After 41.10 m like DGN
Coarse grained grey pegmatite. Plenty of pinite spots. Some healed fractures and one low (alpha) angle CC, KA bearing fractures.
Slightly weathered diatexite gneiss. Pinite and kaolinite alteration. One welded kaolinite bearing fracture. Leucosome 60-70%.
Grey pegmatite with pinite alteration. Some mica rich bands. A few healed fractures with kaolinite fillings.
Slightly weathered diatexite gneiss. Pinite and kaolinite alteration. At 57.00-57.20 fine grained, dark grey mica gneiss inclusion.
Leucosome content about 60 %. A few healed kaolinite bearing fracture.
Grey pegmatite with pinite and kaolinite alteration. Some mica rich bands. Several healed fractures with kaolinite fillings.
Diatexite gneiss with pinite and kaolinite alteration. Leucosome 50-70 %. At 64.10-64.30 fine grained, dark grey mica gneiss inclusion.
Some short sections of granitepegmatite (about 10-30 cm wide).
Coarse grained reddish grey pegmatite. Pinite alteration. Some mica rich bands. Only three fractures in the whole intersection.
Diatexite gneiss with pinite alteration. Leucosome about 70 %. Only one fracture (with pyrite dissemination) in the whole intersection.
Coarse grained pegmatite with pinite alteration. Only one fracture with kaolinite filling.
Mica rich diatexite gneiss without any fractures. Leucosome content 50-60 %. Pinite alteration.
Fine grained, greenish brown mafic gneiss with some KV +/- MS veins. One 0.5 cm wide biotite/pyrite vein.
Mica rich diatexite gneiss. Leucosome content 50-60 %. Pinite alteration.
Coarse grained pegmatite. Pinite alteration. Only one fracture (with kaolinite filling).
Mica rich diatexite gneiss with leucosome content of 50-60 %. Some short parts of more leucosome rich diatexite gneiss (>70 %). Pinite
alteration.
Dark grey, more fine grained than the previous DGN-section at 97.72-108. Clear gneissic appearance. A few healed fracture with white
filling (kaolinite/calcite). Here and there pinite alteration.
Mica rich diatexite gneiss. Leucosome content 50-70 %. Some pinite alteration.
Diatexite gneiss with clear gneissic appearance. Leucosome content about 60 %. Pinite and kaolinite alteration.
Diatexite gneiss with some short sections of QGN (5-15 cm wide). Pinite alteration. Old welded kaolinite bearing fractures.
Veined texture, with about 50 % of leucosome. Old welded fractures with white filling.
Diatexite gneiss with leucosome content of about 80 %. Pinite alteration. Some old healed, kaolinite bearing fractures.
Dark, fine grained, brownish grey mica gneiss with some leucosome veins. Clear gneissic appearance. Planar smooth (PSM) fractures.
Diatexite gneiss with leucosome content of about 60 %. Weak gneissic appearance.
Coarse grained pegmatite. Some biotite bands.
Dark, fine grained, brownish grey mica gneiss with some biotite veins. Clear gneissic appearance. DGN begins ( from 144.81).
74

DU
CT
ILE
DE
FO
RM
AT
ION
Ho
le I
D:
ON
K-P
H3
KA
TI
No
rth
ing
:6
79
20
46
.87
36
.9.2
00
5
Ea
stin
g:
15
26
12
6.6
18
10
.9.2
00
5
Ele
va
tio
n:
-59
.97
6O
NR
AM
10
00
/4
Dire
ctio
n:
22
5.1
35
5V
erifin
g g
eo
log
ica
l p
rop
ert
ies in
th
e O
NK
AL
O p
rofile
(cu
rre
nt
layo
ut)
.
Dip
:-5
.84
3V
erifica
tio
n o
f g
eo
log
y
Co
re d
iam
ete
r:5
0.2
Ca
sin
g:
0.9
/1.0
7.-
20
.9.2
00
5
Re
ma
rks:
PL
69
6.8
7K
JO
K,
HL
AM
, T
JU
U,
NJK
, T
JU
R,
JE
NG
14
4.9
1
HO
LE
_ID
M_
FR
OM
M_
TO
RE
FE
RE
NC
E_
LIN
EE
LE
ME
NT
AZ
IMD
IPA
LP
HA
BE
TA
TR
EN
DP
LU
NG
EF
OL
IAT
ION
FO
LIA
TIO
NM
ET
HO
DR
OC
K_
TY
PE
RE
MA
RK
S
(°)
(°)
(°)
(°)
(°)
TY
PE
INT
EN
SIT
Y
ON
K-P
H3
01
FO
LB
AN
1W
ellC
ad
VG
N
ON
K-P
H3
12
FO
L1
00
64
34
11
7B
AN
1W
ellC
ad
VG
N
ON
K-P
H3
23
FO
L1
10
64
25
11
5B
AN
1W
ellC
ad
VG
N
ON
K-P
H3
34
FO
LM
AS
0W
ellC
ad
PG
R
ON
K-P
H3
45
FO
LM
AS
0W
ellC
ad
PG
R
ON
K-P
H3
56
FO
LM
AS
0W
ellC
ad
PG
R
ON
K-P
H3
67
FO
LM
AS
0W
ellC
ad
PG
R
ON
K-P
H3
78
FO
LIR
R0
We
llCa
dD
GN
ON
K-P
H3
89
FO
LIR
R0
We
llCa
dD
GN
ON
K-P
H3
91
0F
OL
IRR
0W
ellC
ad
DG
N
ON
K-P
H3
10
11
FO
LIR
R0
We
llCa
dD
GN
ON
K-P
H3
11
12
FO
LIR
R0
We
llCa
dD
GN
ON
K-P
H3
12
13
FO
L1
12
40
19
14
1G
NE
1W
ellC
ad
DG
N
ON
K-P
H3
13
14
FO
LIR
R0
We
llCa
dD
GN
ON
K-P
H3
14
15
FO
L8
15
14
31
41
GN
E1
We
llCa
dD
GN
ON
K-P
H3
15
16
FO
L9
84
93
11
35
IRR
0W
ellC
ad
DG
N
ON
K-P
H3
16
17
FO
LM
AS
0W
ellC
ad
PG
R
ON
K-P
H3
17
18
FO
LM
AS
0W
ellC
ad
PG
R
ON
K-P
H3
18
19
FO
L1
87
65
42
31
1G
NE
1W
ellC
ad
QG
N
ON
K-P
H3
19
20
FO
L1
97
73
54
30
9G
NE
1W
ellC
ad
DG
N
ON
K-P
H3
20
21
FO
LIR
R0
We
llCa
dD
GN
ON
K-P
H3
21
22
FO
LIR
R0
We
llCa
dD
GN
ON
K-P
H3
22
23
FO
LIR
R0
We
llCa
dD
GN
ON
K-P
H3
23
24
FO
L2
83
87
31
83
GN
E1
We
llCa
dD
GN
ON
K-P
H3
24
25
FO
L1
81
40
22
33
1G
NE
1W
ellC
ad
DG
N
ON
K-P
H3
25
26
FO
LIR
R0
We
llCa
dD
GN
ON
K-P
H3
26
27
FO
L2
04
39
30
34
5G
NE
1W
ellC
ad
DG
N
ON
K-P
H3
27
28
FO
L7
23
03
21
65
GN
E1
We
llCa
dD
GN
ON
K-P
H3
28
29
FO
LM
AS
0W
ellC
ad
PG
R
ON
K-P
H3
29
30
FO
LM
AS
0W
ellC
ad
PG
R
ON
K-P
H3
30
31
FO
LIR
R0
We
llCa
dD
GN
ON
K-P
H3
31
32
FO
L7
23
33
51
63
GN
E1
We
llCa
dD
GN
ON
K-P
H3
32
33
FO
LIR
R0
We
llCa
dD
GN
ON
K-P
H3
33
34
FO
LIR
R0
We
llCa
dD
GN
ON
K-P
H3
34
35
FO
LIR
R0
We
llCa
dD
GN
ON
K-P
H3
35
36
FO
LIR
R0
We
llCa
dD
GN
ON
K-P
H3
36
37
FO
LIR
R0
We
llCa
dV
GN
ON
K-P
H3
37
38
FO
L3
54
14
61
89
GN
E1
We
llCa
dV
GN
ON
K-P
H3
38
39
FO
LIR
R0
We
llCa
dV
GN
ON
K-P
H3
39
40
FO
LM
AS
0W
ellC
ad
PG
R
ON
K-P
H3
40
41
FO
LM
AS
0W
ellC
ad
PG
R
ON
K-P
H3
41
42
FO
LM
AS
0W
ellC
ad
PG
R
ON
K-P
H3
42
43
FO
L1
20
46
15
13
4G
NE
1W
ellC
ad
PG
R
ON
K-P
H3
43
44
FO
L1
04
50
28
13
2G
NE
1W
ellC
ad
DG
N
ON
K-P
H3
44
45
FO
LIR
R0
We
llCa
dD
GN
ON
K-P
H3
45
46
FO
LIR
R0
We
llCa
dD
GN
ON
K-P
H3
46
47
FO
L7
73
63
61
58
GN
E1
We
llCa
dD
GN
ON
K-P
H3
47
48
FO
LIR
R0
We
llCa
dP
GR
ON
K-P
H3
48
49
FO
L1
18
43
17
13
7IR
R0
We
llCa
dP
GR
ON
K-P
H3
49
50
FO
L9
94
12
81
43
GN
E1
We
llCa
dD
GN
ON
K-P
H3
50
51
FO
L6
05
05
31
61
IRR
0W
ellC
ad
DG
N
75 APPENDIX 3.2

HO
LE
_ID
M_
FR
OM
M_
TO
RE
FE
RE
NC
E_
LIN
EE
LE
ME
NT
AZ
IMD
IPA
LP
HA
BE
TA
TR
EN
DP
LU
NG
EF
OL
IAT
ION
FO
LIA
TIO
NM
ET
HO
DR
OC
K_
TY
PE
RE
MA
RK
S
(°)
(°)
(°)
(°)
(°)
TY
PE
INT
EN
SIT
Y
ON
K-P
H3
51
52
FO
L1
75
95
42
24
IRR
0W
ellC
ad
PG
R
ON
K-P
H3
52
53
FO
L7
54
84
51
48
GN
E1
We
llCa
dP
GR
ON
K-P
H3
53
54
FO
L8
73
02
81
58
GN
E1
We
llCa
dP
GR
ON
K-P
H3
54
55
FO
L1
74
52
25
31
8G
NE
1W
ellC
ad
PG
R
ON
K-P
H3
55
56
FO
L8
07
05
41
15
GN
E1
We
llCa
dP
GR
ON
K-P
H3
56
57
FO
L1
07
49
25
13
3IR
R0
We
llCa
dD
GN
ON
K-P
H3
57
58
FO
LIR
R0
We
llCa
dD
GN
ON
K-P
H3
58
59
FO
L7
76
65
51
24
GN
E1
We
llCa
dD
GN
ON
K-P
H3
59
60
FO
L1
05
79
31
99
GN
E1
We
llCa
dP
GR
ON
K-P
H3
60
61
FO
LIR
R0
We
llCa
dP
GR
ON
K-P
H3
61
62
FO
L2
38
06
72
60
IRR
0W
ellC
ad
DG
N
ON
K-P
H3
62
63
FO
L7
43
83
91
58
GN
E1
We
llCa
dD
GN
ON
K-P
H3
63
64
FO
LIR
R0
We
llCa
dD
GN
ON
K-P
H3
64
65
FO
L8
65
94
51
29
IRR
0W
ellC
ad
DG
N
ON
K-P
H3
65
66
FO
L8
55
14
21
39
IRR
0W
ellC
ad
DG
N
ON
K-P
H3
66
67
FO
L8
94
23
41
46
GN
E1
We
llCa
dD
GN
ON
K-P
H3
67
68
FO
L1
06
29
19
15
3G
NE
1W
ellC
ad
DG
N
ON
K-P
H3
68
69
FO
L1
10
50
24
13
1G
NE
1W
ellC
ad
DG
N
ON
K-P
H3
69
70
FO
L1
06
54
27
12
8G
NE
1W
ellC
ad
DG
N
ON
K-P
H3
70
71
FO
LM
AS
0W
ellC
ad
PG
R
ON
K-P
H3
71
72
FO
LM
AS
0W
ellC
ad
PG
R
ON
K-P
H3
72
73
FO
LM
AS
0W
ellC
ad
PG
R
ON
K-P
H3
73
74
FO
LM
AS
0W
ellC
ad
PG
R
ON
K-P
H3
74
75
FO
LM
AS
0W
ellC
ad
PG
R
ON
K-P
H3
75
76
FO
LM
AS
0W
ellC
ad
PG
R
ON
K-P
H3
76
77
FO
LM
AS
0W
ellC
ad
PG
R
ON
K-P
H3
77
78
FO
LIR
R0
We
llCa
dD
GN
ON
K-P
H3
78
79
FO
LIR
R0
We
llCa
dD
GN
ON
K-P
H3
79
80
FO
LIR
R0
We
llCa
dD
GN
ON
K-P
H3
80
81
FO
LIR
R0
We
llCa
dD
GN
ON
K-P
H3
81
82
FO
L1
48
46
43
15
GN
E1
We
llCa
dD
GN
ON
K-P
H3
82
83
FO
LIR
R0
We
llCa
dD
GN
ON
K-P
H3
83
84
FO
L1
62
45
13
31
9G
NE
1W
ellC
ad
DG
N
ON
K-P
H3
84
85
FO
LIR
R0
We
llCa
dP
GR
ON
K-P
H3
85
86
FO
L1
03
25
19
15
8IR
R0
We
llCa
dP
GR
ON
K-P
H3
86
87
FO
L9
52
52
21
60
GN
E1
We
llCa
dD
GN
ON
K-P
H3
87
88
FO
L3
04
04
41
94
GN
E1
We
llCa
dD
GN
ON
K-P
H3
88
89
FO
LG
NE
1W
ellC
ad
DG
N
ON
K-P
H3
89
90
FO
LIR
R0
We
llCa
dD
GN
ON
K-P
H3
90
91
FO
L8
12
52
71
64
GN
E1
We
llCa
dD
GN
ON
K-P
H3
91
92
FO
L8
92
02
01
66
GN
E2
We
llCa
dM
FG
N
ON
K-P
H3
92
93
FO
L5
25
35
91
71
GN
E1
We
llCa
dD
GN
ON
K-P
H3
93
94
FO
L2
73
94
31
95
GN
E1
We
llCa
dD
GN
ON
K-P
H3
94
95
FO
L6
43
74
11
66
GN
E1
We
llCa
dD
GN
ON
K-P
H3
95
96
FO
L7
64
44
21
52
GN
E1
We
llCa
dD
GN
ON
K-P
H3
96
97
FO
LIR
R0
We
llCa
dP
GR
ON
K-P
H3
97
98
FO
LIR
R0
We
llCa
dP
GR
ON
K-P
H3
98
99
FO
L1
15
43
19
13
7G
NE
1W
ellC
ad
DG
N
ON
K-P
H3
99
10
0F
OL
19
57
54
21
9G
NE
1W
ellC
ad
DG
N
ON
K-P
H3
10
01
01
FO
L9
15
64
01
30
GN
E1
We
llCa
dD
GN
ON
K-P
H3
10
11
02
FO
L9
01
81
91
66
IRR
0W
ellC
ad
DG
N
ON
K-P
H3
10
21
03
FO
L1
11
45
22
13
6G
NE
1W
ellC
ad
DG
N
ON
K-P
H3
10
31
04
FO
L1
44
13
92
06
GN
E1
We
llCa
dD
GN
ON
K-P
H3
10
41
05
FO
L3
52
02
61
84
GN
E1
We
llCa
dD
GN
ON
K-P
H3
10
51
06
FO
L8
15
54
71
36
GN
E1
We
llCa
dD
GN
ON
K-P
H3
10
61
07
FO
L1
15
43
19
13
8G
NE
1W
ellC
ad
DG
N
ON
K-P
H3
10
71
08
FO
LIR
R0
We
llCa
dD
GN
ON
K-P
H3
10
81
09
FO
LG
NE
2W
ellC
ad
DG
NU
nd
ula
tin
g D
GN
wh
ich
cro
ss s
am
ple
in
lo
w a
ng
le.
ON
K-P
H3
10
91
10
FO
LIR
R0
We
llCa
dD
GN
ON
K-P
H3
11
01
11
FO
L2
03
30
21
34
8G
NE
1W
ellC
ad
DG
N
ON
K-P
H3
11
11
12
FO
L1
66
55
20
31
1G
NE
1W
ellC
ad
DG
N
ON
K-P
H3
11
21
13
FO
L1
64
46
15
31
9G
NE
2W
ellC
ad
DG
NU
nd
ula
tin
g D
GN
wh
ich
cro
ss s
am
ple
in
lo
w a
ng
le.
ON
K-P
H3
11
31
14
FO
L1
26
45
11
13
5G
NE
1W
ellC
ad
DG
NU
nd
ula
tin
g D
GN
wh
ich
cro
ss s
am
ple
in
lo
w a
ng
le.
ON
K-P
H3
11
41
15
FO
L1
21
40
14
14
0G
NE
1W
ellC
ad
DG
N
ON
K-P
H3
11
51
16
FO
L1
62
31
73
32
IRR
0W
ellC
ad
DG
N
ON
K-P
H3
11
61
17
FO
LG
NE
1W
ellC
ad
DG
N
ON
K-P
H3
11
71
18
FO
L7
94
84
41
45
IRR
0W
ellC
ad
DG
N
76

HO
LE
_ID
M_
FR
OM
M_
TO
RE
FE
RE
NC
E_
LIN
EE
LE
ME
NT
AZ
IMD
IPA
LP
HA
BE
TA
TR
EN
DP
LU
NG
EF
OL
IAT
ION
FO
LIA
TIO
NM
ET
HO
DR
OC
K_
TY
PE
RE
MA
RK
S
(°)
(°)
(°)
(°)
(°)
TY
PE
INT
EN
SIT
Y
ON
K-P
H3
11
81
19
FO
L7
25
04
91
49
GN
E1
We
llCa
dD
GN
ON
K-P
H3
11
91
20
FO
L5
14
14
81
74
GN
E1
We
llCa
dD
GN
ON
K-P
H3
12
01
21
FO
LIR
R0
We
llCa
dD
GN
ON
K-P
H3
12
11
22
FO
L2
32
61
54
10
IRR
0W
ellC
ad
DG
N
ON
K-P
H3
12
21
23
FO
L2
73
77
40
67
GN
E1
We
llCa
dD
GN
ON
K-P
H3
12
31
24
FO
L1
02
43
27
14
0G
NE
1W
ellC
ad
DG
N
ON
K-P
H3
12
41
25
FO
LG
NE
1W
ellC
ad
DG
N
ON
K-P
H3
12
51
26
FO
LIR
R0
We
llCa
dD
GN
ON
K-P
H3
12
61
27
FO
L3
63
03
61
86
GN
E1
We
llCa
dD
GN
ON
K-P
H3
12
71
28
FO
L7
94
24
01
52
GN
E1
We
llCa
dD
GN
ON
K-P
H3
12
81
29
FO
L5
84
65
11
66
GN
E1
We
llCa
dD
GN
ON
K-P
H3
12
91
30
FO
L8
53
83
41
52
BA
N1
We
llCa
dV
GN
ON
K-P
H3
13
01
31
FO
L9
55
53
71
30
BA
N1
We
llCa
dV
GN
ON
K-P
H3
13
11
32
FO
L9
13
32
81
54
BA
N2
We
llCa
dV
GN
ON
K-P
H3
13
21
33
FO
L7
74
64
41
50
BA
N2
We
llCa
dV
GN
ON
K-P
H3
13
31
34
FO
L8
44
53
91
45
BA
N2
We
llCa
dV
GN
ON
K-P
H3
13
41
35
FO
L3
64
65
11
92
BA
N1
We
llCa
dV
GN
ON
K-P
H3
13
51
36
FO
LIR
R0
We
llCa
dD
GN
ON
K-P
H3
13
61
37
FO
L4
01
11
81
81
GN
E1
We
llCa
dD
GN
ON
K-P
H3
13
71
38
FO
L9
93
12
41
53
IRR
0W
ellC
ad
DG
N
ON
K-P
H3
13
81
39
FO
L1
17
19
12
16
1G
NE
2W
ellC
ad
MG
NU
nd
ula
tin
g D
GN
wh
ich
cro
ss s
am
ple
in
lo
w a
ng
le.
ON
K-P
H3
13
91
40
FO
L1
13
33
18
14
9G
NE
2W
ellC
ad
MG
N
ON
K-P
H3
14
01
41
FO
L9
32
62
41
59
SC
H2
We
llCa
dM
GN
ON
K-P
H3
14
11
42
FO
L6
63
13
51
68
GN
E2
We
llCa
dD
GN
ON
K-P
H3
14
21
43
FO
L6
44
24
51
63
IRR
0W
ellC
ad
PG
R
ON
K-P
H3
14
31
44
FO
LIR
R0
We
llCa
dP
GR
ON
K-P
H3
14
41
44
.91
FO
LG
NE
2W
ellC
ad
MG
N
77
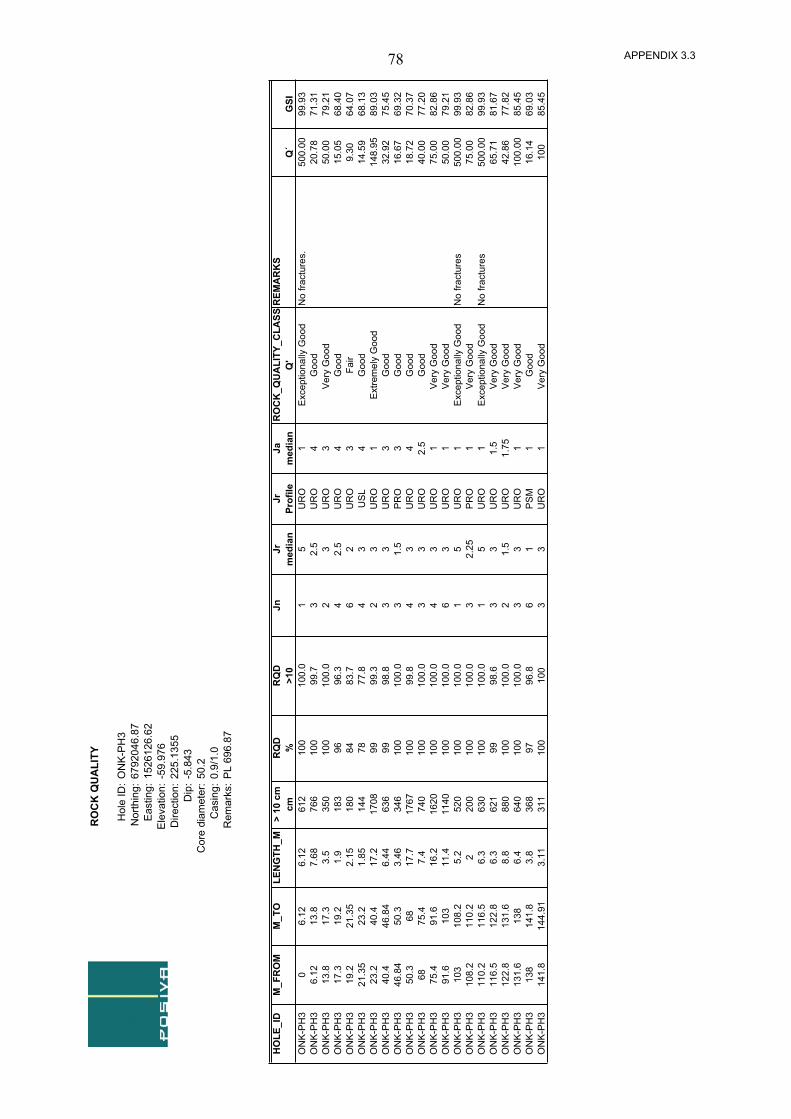
RO
CK
QU
AL
ITY
Hole
ID
:O
NK
-PH
3C
ontr
acto
r:K
AT
I
Nort
hin
g:
6792046.8
7D
rilli
ng s
tart
ed:
6.9
.2005
Easting:
1526126.6
2D
rilli
ng e
nded:
10.9
.2005
Ele
vation:
-59.9
76
Machin
e/fix
ture
:O
NR
AM
1000/4
Direction:
225.1
355
Targ
et:
Verifing g
eolo
gic
al pro
pert
ies in the O
NK
ALO
pro
file
(curr
ent la
yout)
.
Dip
:-5
.843
Purp
ose:
Verification o
f geolo
gy
Core
dia
mete
r:50.2
Exte
nsio
n:
Casin
g:
0.9
/1.0
Loggin
g d
ate
:7.-
20.9
.2005
Rem
ark
s:
PL 6
96.8
7G
eolo
gis
t:K
JO
K, H
LA
M, T
JU
U, N
JK
, T
JU
R, JE
NG
Max d
epth
:144.9
1
HO
LE
_ID
M_
FR
OM
M_
TO
LE
NG
TH
_M
> 1
0 c
mR
QD
RQ
DJ
nJ
rJ
rJ
aR
OC
K_
QU
AL
ITY
_C
LA
SS
RE
MA
RK
S
cm
%>
10
me
dia
nP
rofi
lem
ed
ian
Q'
Q´
GS
I
ON
K-P
H3
06
.12
6.1
26
12
10
01
00
.01
5U
RO
1E
xce
ptio
na
lly G
oo
dN
o f
ractu
res.
50
0.0
09
9.9
3
ON
K-P
H3
6.1
21
3.8
7.6
87
66
10
09
9.7
32
.5U
RO
4G
oo
d2
0.7
87
1.3
1
ON
K-P
H3
13
.81
7.3
3.5
35
01
00
10
0.0
23
UR
O3
Ve
ry G
oo
d
50
.00
79
.21
ON
K-P
H3
17
.31
9.2
1.9
18
39
69
6.3
42
.5U
RO
4G
oo
d1
5.0
56
8.4
0
ON
K-P
H3
19
.22
1.3
52
.15
18
08
48
3.7
62
UR
O3
Fa
ir9
.30
64
.07
ON
K-P
H3
21
.35
23
.21
.85
14
47
87
7.8
43
US
L4
Go
od
14
.59
68
.13
ON
K-P
H3
23
.24
0.4
17
.21
70
89
99
9.3
23
UR
O1
Extr
em
ely
Go
od
14
8.9
58
9.0
3
ON
K-P
H3
40
.44
6.8
46
.44
63
69
99
8.8
33
UR
O3
Go
od
32
.92
75
.45
ON
K-P
H3
46
.84
50
.33
.46
34
61
00
10
0.0
31
.5P
RO
3G
oo
d1
6.6
76
9.3
2
ON
K-P
H3
50
.36
81
7.7
17
67
10
09
9.8
43
UR
O4
Go
od
18
.72
70
.37
ON
K-P
H3
68
75
.47
.47
40
10
01
00
.03
3U
RO
2.5
Go
od
40
.00
77
.20
ON
K-P
H3
75
.49
1.6
16
.21
62
01
00
10
0.0
43
UR
O1
Ve
ry G
oo
d
75
.00
82
.86
ON
K-P
H3
91
.61
03
11
.41
14
01
00
10
0.0
63
UR
O1
Ve
ry G
oo
d
50
.00
79
.21
ON
K-P
H3
10
31
08
.25
.25
20
10
01
00
.01
5U
RO
1E
xce
ptio
na
lly G
oo
dN
o f
ractu
res
50
0.0
09
9.9
3
ON
K-P
H3
10
8.2
11
0.2
22
00
10
01
00
.03
2.2
5P
RO
1V
ery
Go
od
7
5.0
08
2.8
6
ON
K-P
H3
11
0.2
11
6.5
6.3
63
01
00
10
0.0
15
UR
O1
Exce
ptio
na
lly G
oo
dN
o f
ractu
res
50
0.0
09
9.9
3
ON
K-P
H3
11
6.5
12
2.8
6.3
62
19
99
8.6
33
UR
O1
.5V
ery
Go
od
6
5.7
18
1.6
7
ON
K-P
H3
12
2.8
13
1.6
8.8
88
01
00
10
0.0
21
.5U
RO
1.7
5V
ery
Go
od
4
2.8
67
7.8
2
ON
K-P
H3
13
1.6
13
86
.46
40
10
01
00
.03
3U
RO
1V
ery
Go
od
1
00
.00
85
.45
ON
K-P
H3
13
81
41
.83
.83
68
97
96
.86
1P
SM
1G
oo
d1
6.1
46
9.0
3
ON
K-P
H3
14
1.8
14
4.9
13
.11
31
11
00
10
03
3U
RO
1V
ery
Go
od
1
00
85
.45
78 APPENDIX 3.3

FR
AC
TU
RE
LO
G C
OR
E
Ho
le I
D:O
NK
-PH
3C
on
tra
cto
r:K
AT
I
No
rth
ing
:6
79
20
46
.87
3D
rilli
ng
sta
rte
d:6
.9.2
00
5
Ea
stin
g:1
52
61
26
.61
8D
rilli
ng
en
de
d:
##
##
##
#
Ele
va
tio
n:-
59
.97
6M
ach
ine
/fix
ture
:ON
RA
M 1
00
0/4
Dire
ctio
n:
22
5.1
35
5T
arg
et:
Ve
rifin
g g
eo
log
ica
l p
rop
ert
ies in
th
e O
NK
AL
O p
rofile
(cu
rre
nt
layo
ut)
.
Dip
:-5
.84
3P
urp
ose
:V
erifica
tio
n o
f g
eo
log
y
Co
re d
iam
ete
r:5
0.2
Exte
nsio
n:
Ca
sin
g:
0.9
/1.0
Lo
gg
ing
da
te:7
.-2
0.9
.20
05
Re
ma
rks:P
L 6
96
.87
Ge
olo
gis
t:K
JO
K,
HL
AM
, T
JU
U,
NJK
, T
JU
R,
JE
NG
Ma
x d
ep
th:1
44
.91
HO
LE
_ID
FR
AC
TU
RE
M_
FR
OM
M_
TO
CO
RE
_A
LP
HA
CO
RE
_B
ET
AA
ZIM
DIP
ME
TH
OD
TY
PE
CO
LO
UR
_O
FF
RA
CT
UR
ET
HIC
KN
ES
S_
OF
F
RA
CT
UR
EF
RA
CT
UR
E
Jr
Ja
CL
AS
S_
OF
_T
HE
RE
MA
RK
SS
ou
rce
Re
ma
rks
NU
MB
ER
1.2
8(°
)(°
)(°
)(°
)F
RA
CT
UR
E_
SU
RF
AC
EF
ILL
ING
FIL
LIN
G (
mm
)S
HA
PE
RO
UG
HN
ES
S2
4F
RA
CT
UR
ED
_Z
ON
EF
Dip
Fd
irU
PE
SC
ert
ain
tyD
es
cri
pti
on
ON
K-P
H3
10
.24
5S
am
ple
tig
ray
ste
pp
ed
rou
gh
41
ON
K-P
H3
20
.28
76
Sa
mp
leti
gra
yp
lan
ar
rou
gh
1.5
1
ON
K-P
H3
30
.37
48
Sa
mp
leti
da
rk g
ray
un
du
late
dro
ug
h3
1
ON
K-P
H3
46
.12
66
Sa
mp
lefi
ligh
t g
ray
CC
,SK
,SR
0.4
un
du
late
dsm
oo
th2
3
ON
K-P
H3
56
.14
58
Sa
mp
lefi
ligh
t g
ree
nC
C,S
K,S
R,K
A0
.4p
lan
ar
rou
gh
1.5
4
ON
K-P
H3
66
.31
42
Sa
mp
lefisl
da
rk g
ray
CC
,KL
,SK
0.5
un
du
late
dslic
ke
nsid
ed
1.5
4
ON
K-P
H3
76
.53
12
Sa
mp
lefi
ligh
t g
ray
KA
,SK
,CC
,KL
0.5
un
du
late
dro
ug
h3
4
ON
K-P
H3
88
.81
29
18
0S
am
ple
filig
ht
gra
yK
A,S
K0
.5u
nd
ula
ted
rou
gh
34
ON
K-P
H3
91
1.3
Sa
mp
lefi
SK
,CC
,KA
1u
nd
ula
ted
sm
oo
th2
3h
ea
led
fra
ctu
re
ON
K-P
H3
10
13
.24
16
Sa
mp
lefi
ligh
t g
ray
SK
,KA
,SR
,CC
0.6
un
du
late
dro
ug
h3
4
ON
K-P
H3
11
15
.15
27
Sa
mp
lefi
ligh
t g
ray
KA
,SK
,SR
0.5
pla
na
rro
ug
h1
.54
ON
K-P
H3
12
15
.27
Sa
mp
lefi
ligh
t g
ray
KA
0.4
un
du
late
dro
ug
h3
4h
ea
led
fra
ctu
re
ON
K-P
H3
13
15
.43
60
Sa
mp
lefi
ligh
t g
ray
SK
,KA
0.4
un
du
late
dro
ug
h3
4
ON
K-P
H3
14
16
.44
49
Sa
mp
lefi
ligh
t g
ree
nC
C0
.5p
lan
ar
rou
gh
1.5
1
ON
K-P
H3
15
16
.57
26
Sa
mp
lefi
ligh
t g
ree
nC
C,S
K,S
R0
.5u
nd
ula
ted
rou
gh
32
ON
K-P
H3
16
16
.72
1S
am
ple
filig
ht
red
CC
0.5
un
du
late
dro
ug
h3
1h
ea
led
fra
ctu
re
ON
K-P
H3
17
17
.44
38
90
Sa
mp
lefi
gra
yS
K,C
C0
.5u
nd
ula
ted
rou
gh
31
ON
K-P
H3
18
17
.51
45
84
Sa
mp
lefi
gra
yC
C,S
K,K
L0
.5p
lan
ar
rou
gh
1.5
4
ON
K-P
H3
19
17
.61
44
90
Sa
mp
lefi
gra
yC
C,S
K,K
L0
.5u
nd
ula
ted
sm
oo
th2
4
ON
K-P
H3
20
18
.52
24
24
5S
am
ple
fid
ark
gra
yK
A,S
K,C
C0
.5u
nd
ula
ted
rou
gh
34
ON
K-P
H3
21
19
.31
9.7
6S
am
ple
RiIII
ON
K-P
H3
22
19
.33
2S
am
ple
fid
ark
gra
yS
K,C
C0
.3p
lan
ar
rou
gh
1.5
2
ON
K-P
H3
23
19
.57
35
Sa
mp
lefi
ligh
t g
ray
CC
1p
lan
ar
rou
gh
1.5
2
ON
K-P
H3
24
19
.72
12
Sa
mp
lefi
ligh
t g
ray
CC
,KA
,SK
0.5
pla
na
rro
ug
h1
.54
ON
K-P
H3
25
19
.74
41
Sa
mp
lefi
gra
yK
A,S
K,C
C0
.3u
nd
ula
ted
rou
gh
33
ON
K-P
H3
26
20
.09
34
Sa
mp
lefi
ligh
t g
ray
CC
,SK
0.4
un
du
late
dro
ug
h3
2
ON
K-P
H3
27
20
.35
38
Sa
mp
lefi
ligh
t g
ray
CC
,SK
,KL
0.5
pla
na
rsm
oo
th1
4
ON
K-P
H3
28
20
.43
10
Sa
mp
lefi
ligh
t g
ray
CC
,KA
,SK
0.3
un
du
late
dsm
oo
th2
3
ON
K-P
H3
29
20
.57
55
Sa
mp
lefi
ligh
t g
ray
SK
,CC
,SR
0.4
pla
na
rro
ug
h1
.53
ON
K-P
H3
30
20
.72
28
Sa
mp
lefi
gra
yC
C,S
K,K
L0
.4u
nd
ula
ted
rou
gh
34
ON
K-P
H3
31
20
.79
Sa
mp
lefi
ligh
t g
ree
nS
R,C
C0
.3u
nd
ula
ted
sm
oo
th2
3
ON
K-P
H3
32
20
.83
Sa
mp
lefi
ligh
t g
ray
CC
0.4
un
du
late
dro
ug
h3
2
ON
K-P
H3
33
20
.85
34
Sa
mp
lefi
ligh
t g
ray
CC
,SR
0.4
un
du
late
dro
ug
h3
3
ON
K-P
H3
34
20
.94
21
.23
Sa
mp
leR
iIV
-Rk3
ON
K-P
H3
35
20
.94
Sa
mp
lefi
gra
yK
A,C
C,S
R1
un
du
late
dro
ug
h3
4
ON
K-P
H3
36
21
.04
Sa
mp
leg
rfi
ligh
t g
ray
KA
,CU
,CC
,KL
,SR
1un
du
late
dro
ug
h3
5
ON
K-P
H3
37
21
.14
Sa
mp
lefi
ligh
t g
ray
KA
,CC
,KL
0.5
un
du
late
dsm
oo
th2
4
ON
K-P
H3
38
21
.27
21
.75
Sa
mp
leR
iIII
ON
K-P
H3
39
21
.27
26
Sa
mp
lefisl
gre
eK
L,I
L,K
A,S
R1
un
du
late
dslic
ke
nsid
ed
1.5
5U
ND
Uka
olin
e a
nd
cla
y b
ea
rin
g s
urf
ace
ON
K-P
H3
40
21
.3S
am
ple
fid
ark
gra
yK
L,I
L,K
A,S
R1
un
du
late
dsm
oo
th2
4
ON
K-P
H3
41
21
.45
21
Sa
mp
leg
rfi
dg
reK
L,S
V,S
K,S
R,K
A0
.7u
nd
ula
ted
slic
ke
nsid
ed
1.5
6U
ND
Uka
olin
e a
nd
cla
y b
ea
rin
g s
urf
ace
.
ON
K-P
H3
42
21
.52
4S
am
ple
fisl
da
rk g
ray
KL
,KA
0.6
un
du
late
dslic
ke
nsid
ed
1.5
4P
LA
N,
ST
IAcla
y b
ea
rin
g s
urf
ace
ON
K-P
H3
43
21
.62
6S
am
ple
fisl
ligh
t g
ree
nS
K,K
A,S
R,C
C,K
L0
.5u
nd
ula
ted
slic
ke
nsid
ed
1.5
4IR
RE
Gka
olin
e b
ea
rin
g s
urf
ace
ON
K-P
H3
44
21
.73
Sa
mp
lefi
ligh
t g
ray
KA
,SK
,KL
0.4
un
du
late
dro
ug
h3
4IR
RE
G,
GR
OV
, S
TR
IA
ON
K-P
H3
45
21
.81
86
Sa
mp
lefi
ligh
t g
ray
SK
,CC
0.4
un
du
late
dro
ug
h3
2
ON
K-P
H3
46
22
.28
10
Sa
mp
lefi
da
rk g
ray
KL
,SK
,KA
,CC
0.4
un
du
late
dro
ug
h3
4
ON
K-P
H3
47
22
.33
Sa
mp
lefi
gra
yC
C,S
K0
.4u
nd
ula
ted
rou
gh
32
ON
K-P
H3
48
22
.36
Sa
mp
lefi
gra
yC
C,S
K0
.4u
nd
ula
ted
rou
gh
32
ON
K-P
H3
49
22
.67
28
Sa
mp
lefi
ligh
t g
ray
CC
,KA
0.4
un
du
late
dro
ug
h3
3
ON
K-P
H3
50
22
.84
26
Sa
mp
lefi
ligh
t g
ray
CC
,KA
0.2
un
du
late
dro
ug
h3
3h
ea
led
fra
ctu
re
ON
K-P
H3
51
22
.95
0S
am
ple
fisl
da
rk g
ray
KL
,CC
0.4
un
du
late
dslic
ke
nsid
ed
1.5
4
ON
K-P
H3
52
22
.98
15
Sa
mp
lefi
ligh
t g
ray
SK
,CC
0.8
un
du
late
dro
ug
h3
2h
ea
led
fra
ctu
re
ON
K-P
H3
53
23
.04
20
Sa
mp
lefi
gra
yS
K,C
C,K
L,K
A0
.5u
nd
ula
ted
rou
gh
34
ON
K-P
H3
54
23
.56
39
10
0S
am
ple
filig
ht
gre
en
KL
,SK
,KA
,CC
0.5
un
du
late
dsm
oo
th2
4
ON
K-P
H3
55
28
.48
Sa
mp
lefi
ligh
t g
ree
nK
A0
.2u
nd
ula
ted
rou
gh
32
ON
K-P
H3
56
28
.56
20
Sa
mp
lefi
ligh
t g
ray
CC
0.4
un
du
late
dro
ug
h3
1h
ea
led
fra
ctu
re
ON
K-P
H3
57
28
.61
5S
am
ple
filig
ht
gra
yC
C0
.3u
nd
ula
ted
rou
gh
31
he
ale
d f
ractu
re
ON
K-P
H3
58
29
.1S
am
ple
filig
ht
gra
yC
C,K
L0
.3u
nd
ula
ted
rou
gh
33
he
ale
d f
ractu
re
ON
K-P
H3
59
29
.23
27
Sa
mp
lefi
ligh
t g
ray
KA
,KL
,CC
0.3
un
du
late
dsm
oo
th2
4h
ea
led
fra
ctu
re
ON
K-P
H3
60
38
.59
Sa
mp
lefi
ligh
t g
ray
CC
0.2
un
du
late
dro
ug
h3
1h
ea
led
fra
ctu
re
ON
K-P
H3
61
38
.63
Sa
mp
lefi
ligh
t g
ray
CC
0.2
un
du
late
dro
ug
h3
1h
ea
led
fra
ctu
re
ON
K-P
H3
62
39
.15
28
Sa
mp
lefi
ligh
t g
ree
nK
A,K
L,S
K0
.5u
nd
ula
ted
rou
gh
34
ON
K-P
H3
63
40
.68
40
Sa
mp
lefi
ligh
t g
ray
KA
,CC
0.5
pla
na
rro
ug
h1
.54
ON
K-P
H3
64
40
.99
40
Sa
mp
lefi
ligh
t g
ree
nK
L,K
A,C
C0
.5p
lan
ar
rou
gh
1.5
4
ON
K-P
H3
65
41
.04
19
Sa
mp
lefi
ligh
t g
ray
KA
,CC
0.3
un
du
late
dsm
oo
th2
3h
ea
led
fra
ctu
re
ON
K-P
H3
66
41
.07
45
Sa
mp
lefi
ligh
t g
ray
KA
,CC
0.3
un
du
late
dro
ug
h3
3h
ea
led
fra
ctu
re
ON
K-P
H3
67
41
.17
10
Sa
mp
lefi
ligh
t g
ray
KA
,SK
,CC
0.3
un
du
late
dro
ug
h3
3h
ea
led
fra
ctu
re
ON
K-P
H3
68
43
.61
60
Sa
mp
lefi
ligh
t g
ray
KA
,CC
,KL
0.5
pla
na
rro
ug
h1
.54
ON
K-P
H3
69
43
.95
32
Sa
mp
lefi
gra
yK
A,B
T0
.3u
nd
ula
ted
rou
gh
34
he
ale
d f
ractu
re
ON
K-P
H3
70
44
.19
32
Sa
mp
lefi
ligh
t g
ray
KA
,SK
,CC
0.4
un
du
late
dro
ug
h3
4
ON
K-P
H3
71
44
.41
36
Sa
mp
lefi
ligh
t g
ray
KA
,CC
.KL
0.4
un
du
late
dro
ug
h3
4
ON
K-P
H3
72
45
.12
3S
am
ple
fig
ray
KA
,SK
,CC
0.5
un
du
late
dro
ug
h3
3
ON
K-P
H3
73
45
.99
35
Sa
mp
lefi
ligh
t g
ray
KA
,SK
0.4
un
du
late
dro
ug
h3
4
ON
K-P
H3
74
46
.75
3S
am
ple
tilig
ht
bro
wn
un
du
late
dsm
oo
th2
1
ON
K-P
H3
75
46
.84
38
Sa
mp
lefi
ligh
t g
ray
KA
,CC
0.5
un
du
late
dro
ug
h3
3
ON
K-P
H3
76
47
.34
Sa
mp
lefi
ligh
t g
ray
KA
0.5
pla
na
rro
ug
h1
.53
he
ale
d f
ractu
re
ON
K-P
H3
77
47
.51
3S
am
ple
filig
ht
gra
yK
A,S
K0
.5p
lan
ar
rou
gh
1.5
4h
ea
led
fra
ctu
re
ON
K-P
H3
78
47
.83
30
Sa
mp
lefi
ligh
t g
ray
KA
0.4
pla
na
rro
ug
h1
.54
ON
K-P
H3
79
48
.18
18
75
Sa
mp
lefi
ligh
t g
ray
CC
,KA
,SK
,KL
0.5
pla
na
rro
ug
h1
.54
ON
K-P
H3
80
49
.66
10
Sa
mp
lefi
ligh
t g
ray
KA
0.2
un
du
late
dsm
oo
th2
3h
ea
led
fra
ctu
re
ON
K-P
H3
81
49
.78
Sa
mp
lefi
da
rk g
ray
KA
,BT
0.5
un
du
late
dsm
oo
th2
3
ON
K-P
H3
82
50
.23
Sa
mp
lefi
ligh
t g
ray
CC
0.4
un
du
late
dsm
oo
th2
2h
ea
led
fra
ctu
re
ON
K-P
H3
83
50
.85
30
17
5S
am
ple
fiw
hite
KA
,SK
0.5
un
du
late
dro
ug
h3
4
ON
K-P
H3
84
52
.21
15
22
0S
am
ple
filig
ht
gra
yK
A,C
C0
.2u
nd
ula
ted
rou
gh
34
he
ale
d f
ractu
re
ON
K-P
H3
85
52
.56
50
13
0S
am
ple
filig
ht
gra
yK
A0
.4u
nd
ula
ted
rou
gh
34
ON
K-P
H3
86
52
.59
25
18
0S
am
ple
fiw
hite
KA
0.4
un
du
late
dro
ug
h3
4
F_
ve
cto
rK
ine
ma
tic
s
79 APPENDIX 3.4

HO
LE
_ID
FR
AC
TU
RE
M_
FR
OM
M_
TO
CO
RE
_A
LP
HA
CO
RE
_B
ET
AA
ZIM
DIP
ME
TH
OD
TY
PE
CO
LO
UR
_O
FF
RA
CT
UR
ET
HIC
KN
ES
S_
OF
F
RA
CT
UR
EF
RA
CT
UR
E
Jr
Ja
CL
AS
S_
OF
_T
HE
RE
MA
RK
SS
ou
rce
Re
ma
rks
NU
MB
ER
1.2
8(°
)(°
)(°
)(°
)F
RA
CT
UR
E_
SU
RF
AC
EF
ILL
ING
FIL
LIN
G (
mm
)S
HA
PE
RO
UG
HN
ES
S2
4F
RA
CT
UR
ED
_Z
ON
EF
Dip
Fd
irU
PE
SC
ert
ain
tyD
es
cri
pti
on
F_
ve
cto
rK
ine
ma
tic
s
ON
K-P
H3
87
54
.11
0S
am
ple
fig
ray
KA
,SK
,CC
0.5
un
du
late
dro
ug
h3
4
ON
K-P
H3
88
54
.18
30
Sa
mp
lefi
wh
ite
KA
0.1
un
du
late
dro
ug
h3
4h
ea
led
fra
ctu
re
ON
K-P
H3
89
56
.12
35
33
0S
am
ple
fiw
hite
KA
0.1
un
du
late
dro
ug
h3
4h
ea
led
fra
ctu
re
ON
K-P
H3
90
56
.17
30
31
0S
am
ple
fiw
hite
KA
0.1
un
du
late
dro
ug
h3
4h
ea
led
fra
ctu
re
ON
K-P
H3
91
56
.24
53
30
Sa
mp
lefi
wh
ite
KA
0.1
un
du
late
dro
ug
h3
4
ON
K-P
H3
92
56
.97
45
15
0S
am
ple
fid
ark
gra
yK
A,
BT
0.1
un
du
late
dro
ug
h3
3
ON
K-P
H3
93
57
.24
70
15
0S
am
ple
filig
ht
gra
yK
A,
BT
0.1
un
du
late
dro
ug
h3
3
ON
K-P
H3
94
57
.99
80
14
0S
am
ple
fid
ark
gra
yB
T,
KA
0.1
un
du
late
dro
ug
h3
2
ON
K-P
H3
95
58
.35
40
22
0S
am
ple
filig
ht
gra
yK
A0
.2u
nd
ula
ted
rou
gh
34
ON
K-P
H3
96
59
.99
70
12
0S
am
ple
filig
ht
gra
yK
A0
.2u
nd
ula
ted
rou
gh
34
ON
K-P
H3
97
60
.16
35
11
0S
am
ple
filig
ht
gra
yK
A0
.2u
nd
ula
ted
rou
gh
34
ON
K-P
H3
98
60
.39
15
11
0S
am
ple
fid
ark
gra
yK
A0
.2u
nd
ula
ted
rou
gh
34
he
ale
d f
ractu
re
ON
K-P
H3
99
60
.63
51
30
Sa
mp
lefi
gra
yK
A,S
K,B
T0
.3u
nd
ula
ted
rou
gh
34
ON
K-P
H3
10
06
2.3
47
01
50
Sa
mp
lefi
da
rk g
ray
BT
,KA
0.2
un
du
late
dro
ug
h3
4
ON
K-P
H3
10
16
2.5
22
01
20
Sa
mp
lefi
ligh
t g
ray
KA
,SK
0.2
un
du
late
dro
ug
h3
4
ON
K-P
H3
10
26
4.3
15
03
40
Sa
mp
leg
rfi
gre
en
ish
gra
yK
A,B
T,E
P0
.4u
nd
ula
ted
rou
gh
34
drill
cu
ttin
g
ON
K-P
H3
10
36
4.6
45
5S
am
ple
fiw
hite
KA
0.4
un
du
late
dro
ug
h3
4
ON
K-P
H3
10
46
5.1
42
51
0S
am
ple
fid
ark
gra
yB
T,
SK
, K
A0
.3u
nd
ula
ted
rou
gh
32
he
ale
d f
ractu
re
ON
K-P
H3
10
56
5.4
64
01
70
Sa
mp
lefi
ligh
t g
ray
KA
, S
K0
.2u
nd
ula
ted
rou
gh
33
he
ale
d f
ractu
re
ON
K-P
H3
10
66
5.5
50
19
0S
am
ple
filig
ht
gra
yK
A,
SK
0.4
un
du
late
dro
ug
h3
4
ON
K-P
H3
10
76
7.5
47
01
60
Sa
mp
lefi
da
rk g
ray
KA
, B
T0
.1u
nd
ula
ted
rou
gh
32
ON
K-P
H3
10
86
9.0
86
01
50
Sa
mp
lefi
da
rk g
ray
BT
0.2
un
du
late
dro
ug
h3
3
ON
K-P
H3
10
97
0.2
98
51
90
Sa
mp
lefi
ligh
t g
ray
KA
0.1
un
du
late
dro
ug
h3
3
ON
K-P
H3
11
07
2.5
67
01
00
Sa
mp
lefi
da
rk g
ray
BT
, S
K0
.3u
nd
ula
ted
rou
gh
32
ON
K-P
H3
11
17
5.7
18
51
00
Sa
mp
leg
rfi
ligh
t g
ray
SK
0.2
un
du
late
dro
ug
h3
1d
rill
cu
ttin
g
ON
K-P
H3
11
28
2.1
60
24
0S
am
ple
filig
ht
gra
yB
T,
SK
0.1
un
du
late
dro
ug
h3
1
ON
K-P
H3
11
38
5.5
35
01
70
Sa
mp
lefi
ligh
t g
ray
KA
, S
K0
.3u
nd
ula
ted
rou
gh
34
ON
K-P
H3
11
49
0.7
35
02
70
Sa
mp
lefi
da
rk g
ray
0.1
un
du
late
dro
ug
h1
1d
rill
cu
ttin
g
ON
K-P
H3
11
59
2.6
14
02
40
Sa
mp
lefi
ligh
t g
ray
SK
, K
A0
.1u
nd
ula
ted
rou
gh
32
drill
cu
ttin
g
ON
K-P
H3
11
69
2.9
45
21
0S
am
ple
fid
ark
gra
yS
K,
BT
0.1
un
du
late
dsm
oo
th2
1
ON
K-P
H3
11
79
3.3
45
03
00
Sa
mp
lefi
ligh
t g
ray
SK
, B
T0
.1u
nd
ula
ted
rou
gh
31
he
ale
d f
ractu
re
ON
K-P
H3
11
89
3.3
65
02
80
Sa
mp
lefi
ligh
t g
ray
SK
, B
T0
.1u
nd
ula
ted
rou
gh
31
ON
K-P
H3
11
99
5.4
83
02
15
Sa
mp
leg
rfi
bla
ck
KL
,SK
,SV
,CC
3u
nd
ula
ted
rou
gh
34
ON
K-P
H3
12
09
6.4
46
01
50
Sa
mp
lefi
ligh
t g
ray
KA
0.1
un
du
late
dro
ug
h3
2
ON
K-P
H3
12
19
8.1
95
01
70
Sa
mp
lefi
ligh
t g
ray
KA
, S
K0
.1u
nd
ula
ted
rou
gh
32
ON
K-P
H3
12
29
8.5
26
02
10
Sa
mp
lefi
ligh
t g
ray
KA
0.1
un
du
late
dro
ug
h3
2
ON
K-P
H3
12
39
9.2
57
03
0S
am
ple
filig
ht
gra
yK
A0
.4u
nd
ula
ted
rou
gh
34
ON
K-P
H3
12
41
00
.12
80
21
0S
am
ple
fid
ark
gra
yS
K0
.2p
lan
ar
rou
gh
1.5
1
ON
K-P
H3
12
51
00
.25
70
10
Sa
mp
lefi
ligh
t g
ray
SK
0.1
un
du
late
dro
ug
h3
1
ON
K-P
H3
12
61
00
.49
70
19
0S
am
ple
filig
ht
gra
yS
K0
.1u
nd
ula
ted
rou
gh
31
ON
K-P
H3
12
71
00
.96
60
0S
am
ple
filig
ht
gra
yK
A0
.2u
nd
ula
ted
rou
gh
33
ON
K-P
H3
12
81
02
.76
40
35
0S
am
ple
filig
ht
gra
yS
K0
.1u
nd
ula
ted
rou
gh
31
ON
K-P
H3
12
91
02
.98
70
Sa
mp
lefi
gre
en
ish
gra
yS
K,
KA
, B
T0
.2u
nd
ula
ted
rou
gh
33
ON
K-P
H3
13
01
08
.39
15
15
0S
am
ple
fid
ark
gra
yB
T0
.1u
nd
ula
ted
rou
gh
31
drill
cu
ttin
g
ON
K-P
H3
13
11
09
.17
85
27
0S
am
ple
filig
ht
gra
y0
.1p
lan
ar
rou
gh
1.5
1d
rill
cu
ttin
g
ON
K-P
H3
13
21
09
.88
30
Sa
mp
lefi
wh
ite
KA
0.3
pla
na
rro
ug
h1
.54
ON
K-P
H3
13
31
09
.99
30
35
0S
am
ple
filig
ht
gra
yK
A0
.2u
nd
ula
ted
rou
gh
33
he
ale
d f
ractu
re
ON
K-P
H3
13
41
16
.96
30
Sa
mp
lefi
da
rk g
ray
0.1
un
du
late
dro
ug
h3
1d
rill
cu
ttin
g
ON
K-P
H3
13
51
17
.16
50
Sa
mp
lefi
da
rk g
ray
KA
0.1
un
du
late
dro
ug
h3
1d
rill
cu
ttin
g
ON
K-P
H3
13
61
17
.91
55
Sa
mp
lefi
ligh
t g
ray
KA
0.2
un
du
late
dro
ug
h3
3d
rill
cu
ttin
g
ON
K-P
H3
13
71
17
.92
50
Sa
mp
lefi
ligh
t g
ray
KA
0.2
un
du
late
dro
ug
h3
3d
rill
cu
ttin
g
ON
K-P
H3
13
81
17
.96
30
Sa
mp
lefi
ligh
t g
ray
KA
0.1
un
du
late
dro
ug
h3
3h
ea
led
fra
ctu
re
ON
K-P
H3
13
91
18
.19
60
Sa
mp
lefi
da
rk g
ray
KA
,SV
0.2
un
du
late
dro
ug
h3
3d
rill
cu
ttin
g
ON
K-P
H3
14
01
18
.53
70
Sa
mp
lefi
ligh
t g
ray
KA
,SK
0.2
un
du
late
dro
ug
h3
3
ON
K-P
H3
14
11
18
.61
50
Sa
mp
lefi
ligh
t g
ray
KA
0.2
un
du
late
dro
ug
h3
3h
ea
led
fra
ctu
re
ON
K-P
H3
14
21
18
.82
30
Sa
mp
lefi
ligh
t g
ray
KA
0.1
un
du
late
dro
ug
h3
2d
rill
cu
ttin
g
ON
K-P
H3
14
31
18
.84
35
Sa
mp
lefi
ligh
t g
ray
0.1
un
du
late
dro
ug
h3
1d
rill
cu
ttin
g
ON
K-P
H3
14
41
19
.01
70
Sa
mp
lefi
da
rk g
ray
SK
, B
T0
.2u
nd
ula
ted
rou
gh
31
ON
K-P
H3
14
51
19
.37
70
Sa
mp
lefi
da
rk g
ray
SK
, B
T0
.2u
nd
ula
ted
rou
gh
31
drill
cu
ttin
g
ON
K-P
H3
14
61
19
.96
20
Sa
mp
lefi
ligh
t g
ray
KA
0.2
un
du
late
dro
ug
h3
3d
rill
cu
ttin
g
ON
K-P
H3
14
71
19
.97
50
Sa
mp
lefi
ligh
t g
ray
SK
, K
A0
.2u
nd
ula
ted
rou
gh
33
drill
cu
ttin
g
ON
K-P
H3
14
81
20
.12
60
Sa
mp
lefi
ligh
t g
ray
KA
, S
K0
.2u
nd
ula
ted
rou
gh
33
drill
cu
ttin
g
ON
K-P
H3
14
91
20
.26
40
Sa
mp
lefi
ligh
t g
ray
KA
0.2
un
du
late
dro
ug
h3
3
ON
K-P
H3
15
01
20
.48
70
Sa
mp
lefi
ligh
t g
ray
KA
0.2
un
du
late
dro
ug
h3
3
ON
K-P
H3
15
11
21
.02
30
Sa
mp
lefi
ligh
t g
ray
KA
0.2
un
du
late
dro
ug
h3
3
ON
K-P
H3
15
21
22
.56
45
33
0S
am
ple
filig
ht
gra
yK
A0
.1u
nd
ula
ted
rou
gh
32
ON
K-P
H3
15
31
25
.14
30
35
5S
am
ple
fiw
hite
KA
, S
K0
.3u
nd
ula
ted
rou
gh
34
ON
K-P
H3
15
41
28
.54
03
40
Sa
mp
lefi
da
rk g
ray
KA
0.1
pla
na
rro
ug
h1
.52
ON
K-P
H3
15
51
28
.73
02
80
Sa
mp
lefi
da
rk g
ray
CC
, S
K0
.1p
lan
ar
rou
gh
1.5
1
ON
K-P
H3
15
61
31
.62
50
33
0S
am
ple
fiw
hite
KA
0.4
pla
na
rro
ug
h1
.54
ON
K-P
H3
15
71
31
.91
50
34
0S
am
ple
filig
ht
gra
yK
A,
SK
0.1
un
du
late
dro
ug
h3
2
ON
K-P
H3
15
81
32
.08
50
0S
am
ple
filig
ht
gra
yC
C,
SK
0.3
un
du
late
dro
ug
h3
1
ON
K-P
H3
15
91
32
.18
40
40
Sa
mp
lefi
ligh
t g
ray
CC
, S
K0
.2u
nd
ula
ted
rou
gh
31
ON
K-P
H3
16
01
32
.64
35
32
0S
am
ple
filig
ht
gra
yS
K0
.2u
nd
ula
ted
rou
gh
31
ON
K-P
H3
16
11
33
.64
50
35
0S
am
ple
fig
ray
KA
, S
K0
.2p
lan
ar
rou
gh
1.5
3
ON
K-P
H3
16
21
34
.11
70
18
0S
am
ple
fid
ark
gra
yK
A,
SK
0.1
un
du
late
dro
ug
h3
2
ON
K-P
H3
16
31
34
.55
60
33
0S
am
ple
fid
ark
gra
yK
A,
SK
0.1
un
du
late
dro
ug
h3
2
ON
K-P
H3
16
41
38
.09
65
80
Sa
mp
lefi
da
rk g
ray
CC
, S
K0
.2u
nd
ula
ted
rou
gh
31
ON
K-P
H3
16
51
38
.46
03
10
Sa
mp
lefi
gre
en
ish
bro
wn
KA
, S
K0
.1u
nd
ula
ted
rou
gh
32
ON
K-P
H3
16
61
38
.53
45
31
0S
am
ple
fid
ark
gra
yS
K,
KA
0.2
un
du
late
dro
ug
h3
1
ON
K-P
H3
16
71
38
.74
60
14
0S
am
ple
tilig
ht
gra
yp
lan
ar
sm
oo
th1
1
ON
K-P
H3
16
81
39
.47
50
40
Sa
mp
lefi
da
rk g
ray
SK
0.2
pla
na
rro
ug
h1
.51
ON
K-P
H3
16
91
39
.48
60
27
0S
am
ple
fid
ark
gra
yS
K0
.2p
lan
ar
rou
gh
1.5
1
ON
K-P
H3
17
01
40
.07
20
13
0S
am
ple
fid
ark
gra
yC
C,
SK
0.1
pla
na
rsm
oo
th1
1
ON
K-P
H3
17
11
40
.25
55
60
Sa
mp
lefi
da
rk g
ray
CC
, S
K0
.1p
lan
ar
sm
oo
th1
1
ON
K-P
H3
17
21
40
.68
55
30
0S
am
ple
fid
ark
gra
yC
C,
SK
0.1
pla
na
rsm
oo
th1
1
ON
K-P
H3
17
31
40
.71
50
28
0S
am
ple
fid
ark
gra
yC
C,
SK
0.1
pla
na
rsm
oo
th1
1
ON
K-P
H3
17
41
40
.78
30
14
0S
am
ple
fid
ark
gra
yS
K0
.1p
lan
ar
sm
oo
th1
1
ON
K-P
H3
17
51
41
.95
50
30
Sa
mp
lefi
da
rk g
ray
SK
0.1
un
du
late
dro
ug
h3
1
ON
K-P
H3
17
61
42
.21
80
15
0S
am
ple
filig
ht
gra
yC
C,
SK
0.2
un
du
late
dro
ug
h3
1
ON
K-P
H3
17
71
42
.88
70
23
0S
am
ple
fire
dd
ish
bro
wn
SK
, S
V0
.2u
nd
ula
ted
rou
gh
32
ON
K-P
H3
17
81
43
.18
70
19
0S
am
ple
fire
dd
ish
bro
wn
SK
0.2
un
du
late
dro
ug
h3
1
ON
K-P
H3
17
91
43
.46
55
21
0S
am
ple
fid
ark
gra
yK
A,
EP
0.2
un
du
late
dro
ug
h3
3
ON
K-P
H3
18
01
43
.73
70
27
0S
am
ple
fid
ark
gra
yK
A,
SK
0.2
un
du
late
dro
ug
h3
3
ON
K-P
H3
18
11
43
.86
75
35
0S
am
ple
filig
ht
gra
yS
K0
.2u
nd
ula
ted
rou
gh
31
ON
K-P
H3
18
21
43
.92
45
19
0S
am
ple
filig
ht
gra
yK
A0
.1u
nd
ula
ted
rou
gh
32
he
ale
d f
ractu
re
ON
K-P
H3
18
31
44
.25
80
27
0S
am
ple
filig
ht
gra
yC
C,
SK
0.2
un
du
late
dro
ug
h3
1
ON
K-P
H3
18
41
44
.47
51
80
Sa
mp
lefi
da
rk g
ray
BT
1u
nd
ula
ted
sm
oo
th2
3
ON
K-P
H3
18
51
44
.82
52
10
Sa
mp
lefi
da
rk g
ray
BT
, C
C0
.6u
nd
ula
ted
sm
oo
th2
2h
ea
led
fra
ctu
re
80

APPENDIX 3.5
FRACTURE LOG IMAGE
Hole ID: ONK-PH3 Contractor: KATI
Northing: 6792046.87 Drilling started: 6.9.2005
Easting: 1526126.62 Drilling ended: 10.9.2005
Elevation: -59.976 Machine/fixture: ONRAM 1000/4
Direction: 225.1355 Target: Verifing geological properties in the ONKALO profile (current layout).
Dip: -5.843 Purpose: Verification of geology
Core diameter: 50.2 Extension:
Casing: 0.9/1.0 Logging date: 7.-20.9.2005
Remarks: PL 696.87 Geologist: KJOK, HLAM, TJUU, NJK, TJUR, JENG
Max depth: 144.91
HOLE_ID FRACTURE M_FROM M_TO AZIM DIP ALPHA BETA METHOD APERTURE APERTURE H_COND
NUMBER 1.28 (°) (°) CLASS (mm)
ONK-PH3 1 0.2 1
ONK-PH3 2 0.28 1
ONK-PH3 3 0.37 1
ONK-PH3 4 6.12 245 82 66 55 image 1
ONK-PH3 5 6.14 260 88 54 78 image 1
ONK-PH3 6 6.31 89 87 47 88 image 1
ONK-PH3 7 6.53 1 1
ONK-PH3 8 8.81 80 28 28 163 image 1
ONK-PH3 9 11.3 1
ONK-PH3 10 13.24 128 7 7 173 image 1
ONK-PH3 11 15.15 168 66 27 300 image 1
ONK-PH3 12 15.27 92 45 34 141 image 1
ONK-PH3 13 15.43 92 46 34 140 image 1
ONK-PH3 14 16.44 259 70 48 51 image 1
ONK-PH3 15 16.57 284 74 28 68 image 2 0.3 1
ONK-PH3 16 16.7 4 24 23 197 image 1
ONK-PH3 17 17.44 110 58 24 123 image 1
ONK-PH3 18 17.51 98 85 38 91 image 1 1
ONK-PH3 19 17.61 94 75 41 105 image 2 0.2 1
ONK-PH3 20 18.52 341 82 26 264 image 1
ONK-PH3 21 19.3 19.76 359 49 36 222 image 0
ONK-PH3 22 19.3 341 34 19 212 image 1
ONK-PH3 23 19.57 260 37 24 22 image 1 1
ONK-PH3 24 19.72 333 18 11 197 image 2 0.3 1
ONK-PH3 25 19.74 359 72 43 250 image 1
ONK-PH3 26 20.09 5 47 39 218 image 1
ONK-PH3 27 20.35 256 57 41 34 image 1
ONK-PH3 28 20.43 1 20 20 194 image 1
ONK-PH3 29 20.57 284 88 31 84 image 2 0.2
ONK-PH3 30 20.72 235 75 67 25 image 1
ONK-PH3 31 20.79 24 37 40 196 image 1
ONK-PH3 32 20.83 78 67 54 122 image 1
ONK-PH3 33 20.85 1
ONK-PH3 34 20.94 21.23 1
ONK-PH3 35 20.94 298 87 17 85 image 1
ONK-PH3 36 21.04 130 82 6 97 image 2 0.3
ONK-PH3 37 21.14 119 80 17 99 image 1
ONK-PH3 38 21.27 21.75 1
ONK-PH3 39 21.27 1
ONK-PH3 40 21.3 1 1
ONK-PH3 41 21.45 118 72 18 107 image 3 1 1
ONK-PH3 42 21.5 1
ONK-PH3 43 21.6 113 81 23 97 image 2 0.3 1
ONK-PH3 44 21.73 1
ONK-PH3 45 21.81 38 81 82 248 image 1
ONK-PH3 46 22.28 188 18 8 349 image 2 0.3
ONK-PH3 47 22.33 1
ONK-PH3 48 22.36 1
ONK-PH3 49 22.67 77 26 27 165 image 1
ONK-PH3 50 22.84 88 89 47 85 image 1
ONK-PH3 51 22.9 1
ONK-PH3 52 22.98 342 16 13 195 image 1
ONK-PH3 53 23.04 56 13 19 177 image 2 0.2 1
ONK-PH3 54 23.56 281 87 34 82 image 1 1
ONK-PH3 55 28.48 53 48 54 170 image 1
ONK-PH3 56 28.56 99 35 25 149 image 1
ONK-PH3 57 28.6 45 20 26 180 image 1
ONK-PH3 58 29.1 43 29 35 181 image 1
ONK-PH3 59 29.23 100 21 18 162 image 0
ONK-PH3 60 38.59 108 47 24 134 image 1
ONK-PH3 61 38.63 107 69 28 111 image 1
ONK-PH3 62 39.15 90 43 34 144 image 1 1
ONK-PH3 63 40.68 67 23 27 171 image 0
ONK-PH3 64 40.99 80 48 43 144 image 0
ONK-PH3 65 41.04 90 36 30 151 image 0
ONK-PH3 66 41.07 72 31 33 164 image 0
ONK-PH3 67 41.17 23 24 28 190 image 0
ONK-PH3 68 43.61 70 86 65 86 image 1
ONK-PH3 69 43.95 261 80 51 66 image 1
ONK-PH3 70 44.19 74 57 52 138 image 1
ONK-PH3 71 44.41 105 60 29 121 image 1
ONK-PH3 72 45.1 100 13 14 169 image 0
ONK-PH3 73 45.99 1
ONK-PH3 74 46.7 2 87 46 272 image 1
ONK-PH3 75 46.84 90 68 45 115 image 1
ONK-PH3 76 47.34 1
ONK-PH3 77 47.5 1
ONK-PH3 78 47.83 109 36 20 146 image 1
ONK-PH3 79 48.18 121 66 16 114 image 0
ONK-PH3 80 49.66 69 66 61 130 image 1
ONK-PH3 81 49.78 42 69 75 191 image 1
ONK-PH3 82 50.23 177 73 37 297 image 1
ONK-PH3 83 50.85 47 45 51 178 image 1
ONK-PH3 84 52.21 45 14 20 180 image 1
ONK-PH3 85 52.56 87 71 47 112 image 1
ONK-PH3 86 52.59 62 35 39 168 image 1
ONK-PH3 87 54.1 116 19 12 162 image 0
81

APPENDIX 3.5
HOLE_ID FRACTURE M_FROM M_TO AZIM DIP ALPHA BETA METHOD APERTURE APERTURE H_COND
NUMBER 1.28 (°) (°) CLASS (mm)
ONK-PH3 88 54.18 99 61 34 122 image 0
ONK-PH3 89 56.12 169 75 30 291 image 1
ONK-PH3 90 56.17 174 67 32 302 image 1
ONK-PH3 91 56.2 177 74 37 295 image 1
ONK-PH3 92 56.97 87 9 13 174 image 0
ONK-PH3 93 57.24 88 69 46 115 image 1
ONK-PH3 94 57.99 43 76 82 195 image 1
ONK-PH3 95 58.35 19 23 27 191 image 0
ONK-PH3 96 59.99 78 68 55 119 image 1
ONK-PH3 97 60.16 88 30 27 158 image 1
ONK-PH3 98 60.39 115 45 19 136 image 1
ONK-PH3 99 60.6 94 32 26 154 image 1
ONK-PH3 100 62.34 59 53 57 160 image 1
ONK-PH3 101 62.52 108 50 25 131 image 1
ONK-PH3 102 64.31 75 43 42 153 image 0
ONK-PH3 103 64.64 88 62 44 123 image 1
ONK-PH3 104 65.14 55 17 23 177 image 1
ONK-PH3 105 65.46 64 25 30 171 image 2 0.2 1
ONK-PH3 106 65.5 76 34 35 160 image 1 1
ONK-PH3 107 67.54 50 61 67 170 image 1
ONK-PH3 108 69.08 84 66 49 120 image 1
ONK-PH3 109 70.29 72 70 61 121 image 1
ONK-PH3 110 72.56 93 59 39 125 image 1
ONK-PH3 111 75.71 56 76 78 128 image 1
ONK-PH3 112 82.1 28 51 53 203 image 1
ONK-PH3 113 85.53 98 57 35 126 image 1
ONK-PH3 114 90.73 182 87 46 281 image 0
ONK-PH3 115 92.61 352 50 31 227 image 1 1
ONK-PH3 116 92.9 359 38 31 212 image 0
ONK-PH3 117 93.34 7 76 52 256 image 1
ONK-PH3 118 93.36 8 63 49 235 image 1 1
ONK-PH3 119 95.48 64 9 15 177 image 2 0.3 1
ONK-PH3 120 96.44 87 90 48 83 image 1 1
ONK-PH3 121 98.19 4 41 35 212 image 1 1
ONK-PH3 122 98.52 33 45 50 194 image 1 1
ONK-PH3 123 99.25 229 69 62 7 image 1 1
ONK-PH3 124 100.12 38 72 76 211 image 1 1
ONK-PH3 125 100.25 228 80 73 9 image 0 1
ONK-PH3 126 100.49 47 68 74 175 image 1
ONK-PH3 127 100.96 213 62 54 341 image 0
ONK-PH3 128 102.76 226 37 30 360 image 1 1
ONK-PH3 129 102.98 2 0.3 1
ONK-PH3 130 108.39 128 8 7 172 image 0
ONK-PH3 131 109.17 18 33 34 198 image 1
ONK-PH3 132 109.88 248 29 21 12 image 2 0.4 1
ONK-PH3 133 109.99 235 37 30 7 image 1 1
ONK-PH3 134 116.96 180 73 39 298 image 1
ONK-PH3 135 117.16 173 75 34 292 image 1
ONK-PH3 136 117.91 55 33 39 174 image 0
ONK-PH3 137 117.92 61 28 33 172 image 0
ONK-PH3 138 117.96 72 32 35 163 image 0
ONK-PH3 139 118.19 54 42 48 172 image 1
ONK-PH3 140 118.53 359 70 43 249 image 1 1
ONK-PH3 141 118.61 7 68 50 244 image 0
ONK-PH3 142 118.82 57 68 71 147 image 1 1
ONK-PH3 143 118.84 220 28 22 357 image 2 0.2 1
ONK-PH3 144 119.01 53 62 67 163 image 1 1
ONK-PH3 145 119.37 78 82 58 95 image 1
ONK-PH3 146 119.96 56 25 31 175 image 1
ONK-PH3 147 119.97 235 47 40 9 image 2 0.2 1
ONK-PH3 148 120.12 22 63 60 225 image 0
ONK-PH3 149 120.26 214 44 37 350 image 1 1
ONK-PH3 150 120.48 57 71 74 139 image 1
ONK-PH3 151 121.02 200 41 30 341 image 1
ONK-PH3 152 122.56 203 47 37 339 image 1
ONK-PH3 153 125.14 230 30 23 2 image 2 0.2 1
ONK-PH3 154 128.5 235 50 43 10 image 0
ONK-PH3 155 128.7 181 59 33 314 image 0
ONK-PH3 156 131.62 213 50 42 346 image 2 0.2 1
ONK-PH3 157 131.91 190 79 50 296 image 1 1
ONK-PH3 158 132.08 264 54 34 37 image 0
ONK-PH3 159 132.18 286 68 25 62 image 1
ONK-PH3 160 132.64 355 79 40 261 image 1 1
ONK-PH3 161 133.64 205 47 37 341 image 1
ONK-PH3 162 134.11 65 42 45 162 image 1 1
ONK-PH3 163 134.55 209 56 47 339 image 1
ONK-PH3 164 138.09 106 82 30 95 image 2 0.2 1
ONK-PH3 165 138.4 209 60 50 336 image 2 0.2 1
ONK-PH3 166 138.53 204 55 43 335 image 2 0.2 1
ONK-PH3 167 138.74 66 52 54 153 image 0
ONK-PH3 168 139.47 201 74 57 312 image 1
ONK-PH3 169 139.48 260 65 44 46 image 1
ONK-PH3 170 140.07 119 22 12 159 image 2 0.1 1
ONK-PH3 171 140.25 269 87 46 78 image 1 1
ONK-PH3 172 140.68 189 85 52 287 image 0
ONK-PH3 173 140.71 189 81 50 292 image 0
ONK-PH3 174 140.78 96 24 21 161 image 0
ONK-PH3 175 141.95 251 44 33 21 image 1
ONK-PH3 176 142.21 27 90 70 288 image 1
ONK-PH3 177 142.88 233 55 48 9 image 1
ONK-PH3 178 143.18 7 61 47 234 image 1
ONK-PH3 179 143.46 11 48 43 216 image 1
ONK-PH3 180 143.73 19 59 55 223 image 1
ONK-PH3 181 143.86 26 51 53 205 image 1
ONK-PH3 182 143.92 83 28 28 161 image 1
ONK-PH3 183 144.25 156 49 10 314 image 1
ONK-PH3 184 144.47 159 51 13 312 image 1
ONK-PH3 185 144.8 1
82

APPENDIX 3.6
CORE ORIENTATION
Hole ID: ONK-PH3 Contractor: KATI
Northing: 6792046.873 Drilling started: 6.9.2005
Easting: 1526126.618 Drilling ended: 10.9.2005
Elevation: -59.976 Machine/fixture: ONRAM 1000/4
Direction: 225.1355 Target: Verifing geological properties in the ONKALO profile (current layout).
Dip: -5.843 Purpose: Verification of geology
Core diameter: 50.2 Extension:
Casing: 0.9/1.0 Logging date: 7.-20.9.2005
Remarks: PL 696.87 Geologist: KJOK, HLAM, TJUU, NJK, TJUR, JENG
Max depth: 144.91
HOLE_ID MARK_NR MARK_DEPTH M_FROM M_TO LENGTH REMARKS
99.70 69 %
ONK-PH3 1 2.16 0.5 6.1 5.60 Not so accurate mark.
ONK-PH3 2 11.1 8.14 13.28 5.14
ONK-PH3 3 14.08 14.08 15.2 1.12
ONK-PH3 4 17.05 17.05 19.28 2.23
ONK-PH3 5 23.13 23.13 26.09 2.96
ONK-PH3 6 38.04 Not good.
ONK-PH3 7 47.11 46.3 50.09 3.79 55 degree error berween marks 47.11 and 50.09
ONK-PH3 8 50.09 50.09 53 2.91
ONK-PH3 9 56.02 55.88 58.49 2.61
ONK-PH3 10 58.98 58.98 61.95 2.97
ONK-PH3 11 61.95 61.95 64.64 2.69
ONK-PH3 12 64.91 64.91 68.15 3.24
ONK-PH3 13 68.15 68.15 71.1 2.95
ONK-PH3 14 71.1 71.1 74.05 2.95
ONK-PH3 15 74.05 74.05 79.09 5.04
ONK-PH3 16 76.99 Not good.
ONK-PH3 17 79.97 79.09 82.27 3.18
ONK-PH3 18 82.95 82.95 88.86 5.91
ONK-PH3 19 85.9 Not good.
ONK-PH3 20 88.86 88.86 94.77 5.91
ONK-PH3 21 94.77 94.77 97.69 2.92
ONK-PH3 22 97.72 Not good.
ONK-PH3 23 101.03 97.72 101.8 4.08
ONK-PH3 24 103.97 Not good.
ONK-PH3 25 106.95 106.95 109.53 2.58
ONK-PH3 26 112.88 110 115.75 5.75
ONK-PH3 27 115.79 Not good.
ONK-PH3 28 121.74 121.74 128.09 6.35
ONK-PH3 29 128.09 128.09 131.05 2.96
ONK-PH3 30 131.05 131.05 133.84 2.79
ONK-PH3 31 133.84 133.84 136.8 2.96
ONK-PH3 32 136.8 136.8 139.49 2.69
ONK-PH3 33 139.49 139.49 142.4 2.91
ONK-PH3 34 142.4 142.4 144.91 2.51
83

APPENDIX 3.7
FRACTURE FREQUENCY AND RQD
Hole ID: ONK-PH3 Contractor: KATI
Northing: 6792046.873 Drilling started: 6.9.2005
Easting: 1526126.618 Drilling ended: 10.9.2005
Elevation: -59.976 Machine/fixture: ONRAM 1000/4
Direction: 225.1355 Target: Verifing geological properties in the ONKALO profile (curren
Dip: -5.843 Purpose: Verification of geology
Core diameter: 50.2 Extension:
Casing: 0.9/1.0 Logging date: 7.-20.9.2005
Remarks: PL 696.87 Geologist: KJOK, HLAM, TJUU, NJK, TJUR, JENG
Max depth: 144.91
HOLE_ID M_FROM M_TO ALL_FRACTURES NAT_FRACTURES RQD Remarks
pieces/m pieces/m %
ONK-PH3 0 1 8 3 50 Casing, The first 50 cm is break because of excacation.
ONK-PH3 1 2 2 0 100
ONK-PH3 2 3 1 0 100
ONK-PH3 3 4 1 0 100
ONK-PH3 4 5 3 0 100
ONK-PH3 5 6 3 0 100
ONK-PH3 6 7 7 4 95
ONK-PH3 7 8 6 0 91
ONK-PH3 8 9 3 1 100
ONK-PH3 9 10 5 0 100
ONK-PH3 10 11 2 0 100
ONK-PH3 11 12 6 1 100
ONK-PH3 12 13 3 0 100
ONK-PH3 13 14 5 1 100
ONK-PH3 14 15 5 0 100
ONK-PH3 15 16 5 3 100
ONK-PH3 16 17 7 3 95
ONK-PH3 17 18 5 3 82
ONK-PH3 18 19 4 1 100
ONK-PH3 19 20 6 4 75
ONK-PH3 20 21 12 9 80 Several fractures that cross each other, lose core particles.
ONK-PH3 21 22 13 8 65 Several fractures that cross each other, lose core particles.
ONK-PH3 22 23 11 7 77
ONK-PH3 23 24 4 2 100
ONK-PH3 24 25 2 0 100
ONK-PH3 25 26 2 0 100
ONK-PH3 26 27 3 0 100
ONK-PH3 27 28 5 0 100
ONK-PH3 28 29 7 3 100
ONK-PH3 29 30 7 2 100
ONK-PH3 30 31 6 0 100
ONK-PH3 31 32 3 0 100
ONK-PH3 32 33 7 0 100 Drillcore was stuck in the hole, 32.81-35.15 drilled twice.
ONK-PH3 33 34 5 0 100 Drillcore was stuck in the hole, 32.81-35.15 drilled twice.
ONK-PH3 34 35 8 0 100 Drillcore was stuck in the hole, 32.81-35.15 drilled twice.
ONK-PH3 35 36 4 0 100
ONK-PH3 36 37 1 0 100
ONK-PH3 37 38 3 0 100
ONK-PH3 38 39 6 2 95
ONK-PH3 39 40 6 1 100
ONK-PH3 40 41 6 2 100
ONK-PH3 41 42 6 3 86
ONK-PH3 42 43 5 0 100
ONK-PH3 43 44 11 0 100 Core lifter has slipped during the lift.
ONK-PH3 44 45 7 3 100
ONK-PH3 45 46 7 2 100
ONK-PH3 46 47 4 2 100
ONK-PH3 47 48 6 3 100
ONK-PH3 48 49 4 1 100
ONK-PH3 49 50 4 2 100
ONK-PH3 50 51 4 0 100
ONK-PH3 51 52 3 0 97
ONK-PH3 52 53 4 3 100
ONK-PH3 53 54 2 0 100
ONK-PH3 54 55 5 2 100
ONK-PH3 55 56 4 0 100
ONK-PH3 56 57 7 4 92
ONK-PH3 57 58 3 2 100
ONK-PH3 58 59 4 1 100
ONK-PH3 59 60 2 1 100
ONK-PH3 60 61 6 3 100
ONK-PH3 61 62 3 0 100
ONK-PH3 62 63 3 2 90
ONK-PH3 63 64 3 0 100
ONK-PH3 64 65 3 2 100
ONK-PH3 65 66 5 3 96
ONK-PH3 66 67 5 0 100
ONK-PH3 67 68 3 1 100
ONK-PH3 68 69 2 0 100
ONK-PH3 69 70 4 1 100
ONK-PH3 70 71 2 1 100
ONK-PH3 71 72 6 0 100
ONK-PH3 72 73 3 1 100
ONK-PH3 73 74 3 0 100
84

APPENDIX 3.7
HOLE_ID M_FROM M_TO ALL_FRACTURES NAT_FRACTURES RQD Remarks
pieces/m pieces/m %
ONK-PH3 74 75 4 0 100
ONK-PH3 75 76 3 1 100
ONK-PH3 76 77 5 0 100
ONK-PH3 77 78 2 0 100
ONK-PH3 78 79 3 0 100
ONK-PH3 79 80 2 0 100
ONK-PH3 80 81 1 0 100
ONK-PH3 81 82 1 0 100
ONK-PH3 82 83 4 1 100
ONK-PH3 83 84 1 0 100
ONK-PH3 84 85 1 0 100
ONK-PH3 85 86 2 1 100
ONK-PH3 86 87 2 0 100
ONK-PH3 87 88 2 0 100
ONK-PH3 88 89 2 0 100
ONK-PH3 89 90 2 0 100
ONK-PH3 90 91 4 1 100
ONK-PH3 91 92 2 0 100
ONK-PH3 92 93 3 2 100
ONK-PH3 93 94 4 2 97
ONK-PH3 94 95 3 0 100
ONK-PH3 95 96 2 1 100
ONK-PH3 96 97 3 1 100
ONK-PH3 97 98 3 0 100
ONK-PH3 98 99 2 2 100
ONK-PH3 99 100 3 1 96
ONK-PH3 100 101 4 4 100
ONK-PH3 101 102 3 0 100
ONK-PH3 102 103 5 2 100
ONK-PH3 103 104 4 0 100
ONK-PH3 104 105 1 0 100
ONK-PH3 105 106 2 0 100
ONK-PH3 106 107 4 0 100
ONK-PH3 107 108 3 0 100
ONK-PH3 108 109 4 1 100
ONK-PH3 109 110 4 3 92
ONK-PH3 110 111 2 0 100
ONK-PH3 111 112 3 0 100
ONK-PH3 112 113 3 0 100
ONK-PH3 113 114 4 0 100
ONK-PH3 114 115 2 0 100
ONK-PH3 115 116 1 0 100
ONK-PH3 116 117 2 1 100
ONK-PH3 117 118 7 4 93
ONK-PH3 118 119 6 5 89
ONK-PH3 119 120 6 4 98
ONK-PH3 120 121 6 3 90
ONK-PH3 121 122 6 1 100
ONK-PH3 122 123 3 1 100
ONK-PH3 123 124 2 0 100
ONK-PH3 124 125 2 0 100
ONK-PH3 125 126 3 1 100
ONK-PH3 126 127 1 0 100
ONK-PH3 127 128 3 0 100
ONK-PH3 128 129 3 2 100
ONK-PH3 129 130 3 0 100
ONK-PH3 130 131 2 0 100
ONK-PH3 131 132 3 2 100
ONK-PH3 132 133 6 3 91
ONK-PH3 133 134 5 1 100
ONK-PH3 134 135 3 2 100
ONK-PH3 135 136 1 0 100
ONK-PH3 136 137 2 0 100
ONK-PH3 137 138 3 0 100
ONK-PH3 138 139 5 4 100
ONK-PH3 139 140 3 2 98
ONK-PH3 140 141 6 5 90
ONK-PH3 141 142 5 1 100
ONK-PH3 142 143 5 2 100
ONK-PH3 143 144 5 5 94
ONK-PH3 144 144.91 6 3 100
85

APPENDIX 3.8
FRACTURE ZONES AND CORE LOSS
Hole ID: ONK-PH3 Contractor:
Northing: 6792046.873 Drilling started:
Easting: 1526126.618 Drilling ended:
Elevation: -59.976 Machine/fixture:
Direction: 225.1355 Target:
Dip: -5.843 Purpose:
Core diameter: 50.2 Extension:
Casing: 0.9/1.0 Logging date:
Remarks: PL 696.87 Geologist:
Max depth:
HOLE_ID M_FROM M_TO CLASS_OF_THE CORE LOSS Remarks
FRACTURED_ZONE m
ONK-PH3 19.3 20.35 RiIII Fractures filled with CC, KA, SK, KL,
thickness under 0.5 mm
ONK-PH3 20.35 21.8 RiIV-Rk4 Partly broken by drilling, strong
chloritizaton. Filling KL, CC, SK,
thickness 0.5-1.0 mm. This intersection
contains 5 fractures with slickenside
surface. It was possible to measure the
orientation from only two fractures at
21.45 m and 21.60 m (118/72 and
113/81).
ONK-PH3 46.01 46.31 0.3 Between 44.15-46.35
ONK-PH3 117.91 118.84 RiII 8 fractures, filled by KA, SV and SK.
thickness <0.2 mm.
ONK-PH3 119.96 120.26 RiII 4 fractures, filled with KA and SK.
Thickness <0.2mm.
86

APPENDIX 3.9
WEATHERING
Hole ID: ONK-PH3
Northing: 6792046.873
Easting: 1526126.618
Elevation: -59.976
Direction: 225.1355
Dip: -5.843
Core diameter: 50.2
Casing: 0.9/1.0
Remarks: PL 696.87
HOLE_ID M_FROM M_TO WEATHERING Remarks
DEGREE
ONK-PH3 0.5 1.36 Rp0
ONK-PH3 1.36 16.7 Rp1 Slightly weathered feldspars
ONK-PH3 16.7 20.3 Rp0
ONK-PH3 20.3 21.2 Rp1 Slightly weathered feldspars
ONK-PH3 21.2 21.75 Rp2 Totally altered feldspars
ONK-PH3 21.75 27.8 Rp1 Slightly weathered feldspars
ONK-PH3 27.8 30 Rp0
ONK-PH3 30 31.1 Rp2 Altered feldspars
ONK-PH3 31.1 110 Rp1 Slightly weathered feldspars and pinite
ONK-PH3 110 117.5 Rp0
ONK-PH3 117.5 125.6 Rp1 Slightly weathered feldspars and pinite
ONK-PH3 125.6 128.75 Rp0
ONK-PH3 128.75 131.1 Rp1 Slightly weathered feldspars and pinite
ONK-PH3 131.1 133.25 Rp0
ONK-PH3 133.25 138.4 Rp1 Slightly weathered feldspars and pinite
ONK-PH3 138.4 140.85 Rp0
ONK-PH3 140.85 144.91 Rp1 Slightly weathered feldspars and pinite
87

APPENDIX 3.10
LIST OF CORE BOXES
Hole ID: ONK-PH3
Northing: 6792046.873
Easting: 1526126.618
Elevation: -59.976
Direction: 225.1355
Dip: -5.843
Core diameter: 50.2
Casing: 0.9/1.0
Remarks: PL 696.87
HOLE_ID M_FROM M_TO BOX_NUMBER REMARKS
ONK-PH3 0.5 3.06 1
ONK-PH3 3.06 7.18 2
ONK-PH3 7.18 11.09 3
ONK-PH3 11.09 15 4
ONK-PH3 15 18.91 5
ONK-PH3 18.91 22.67 6
ONK-PH3 22.67 26.89 7
ONK-PH3 26.89 30.98 8
ONK-PH3 30.98 35.19 9
ONK-PH3 35.19 39.67 10
ONK-PH3 39.67 44.07 11
ONK-PH3 44.07 48.38 12
ONK-PH3 48.38 52.18 13
ONK-PH3 52.18 56.62 14
ONK-PH3 56.62 60.62 15
ONK-PH3 60.62 64.64 16
ONK-PH3 64.64 68.75 17
ONK-PH3 68.75 73.22 18
ONK-PH3 73.22 77.47 19
ONK-PH3 77.47 81.63 20
ONK-PH3 81.63 85.53 21
ONK-PH3 85.53 89.28 22
ONK-PH3 89.28 93.51 23
ONK-PH3 93.51 97.72 24
ONK-PH3 97.72 101.80 25
ONK-PH3 101.8 106.37 26
ONK-PH3 106.37 110.60 27
ONK-PH3 110.6 114.86 28
ONK-PH3 114.86 118.74 29
ONK-PH3 118.74 123.39 30
ONK-PH3 123.39 126.65 31
ONK-PH3 126.65 130.93 32
ONK-PH3 130.93 134.88 33
ONK-PH3 134.88 138.74 34
ONK-PH3 138.74 142.40 35
ONK-PH3 142.4 144.91 36
88

89
Appendix 3.11

90

91

92

93

94

95

96

97

Appendix 5.1 98
1 10 1001000
10000100000
1000000
Flow rate (ml/h)
20
19
18
17
16
15
14
13
12
11
10
9
8
7
6
5
4
3
2
1
0
De
pth
(m
)
10 100 1000 10000
Single point resistance (ohm)
Flow from the measured section (L = 0.5 m, dL = 0.1 m), 2005-09-10 - 2005-09-11
16.8
17.7
19.4
19.8
Olkiluoto, ONKALO, Borehole PH3Flow rate and single point resistance
Fracture specific flow (into the hole) Fracture specific flow (into the bedrock)

Appendix 5.2 99
1 10 1001000
10000100000
1000000
Flow rate (ml/h)
40
39
38
37
36
35
34
33
32
31
30
29
28
27
26
25
24
23
22
21
20
De
pth
(m
)
10 100 1000 10000
Single point resistance (ohm)
Flow from the measured section (L = 0.5 m, dL = 0.1 m), 2005-09-10 - 2005-09-11
23.1
Olkiluoto, ONKALO, Borehole PH3Flow rate and single point resistance
Fracture specific flow (into the hole) Fracture specific flow (into the bedrock)

Appendix 5.3 100
1 10 1001000
10000100000
1000000
Flow rate (ml/h)
60
59
58
57
56
55
54
53
52
51
50
49
48
47
46
45
44
43
42
41
40
De
pth
(m
)
10 100 1000 10000
Single point resistance (ohm)
Flow from the measured section (L = 0.5 m, dL = 0.1 m), 2005-09-10 - 2005-09-11
Olkiluoto, ONKALO, Borehole PH3Flow rate and single point resistance
Fracture specific flow (into the hole) Fracture specific flow (into the bedrock)

Appendix 5.4 101
1 10 1001000
10000100000
1000000
Flow rate (ml/h)
80
79
78
77
76
75
74
73
72
71
70
69
68
67
66
65
64
63
62
61
60
De
pth
(m
)
10 100 1000 10000
Single point resistance (ohm)
Flow from the measured section (L = 0.5 m, dL = 0.1 m), 2005-09-10 - 2005-09-11
Olkiluoto, ONKALO, Borehole PH3Flow rate and single point resistance
Fracture specific flow (into the hole) Fracture specific flow (into the bedrock)

Appendix 5.5 102
1 10 1001000
10000100000
1000000
Flow rate (ml/h)
100
99
98
97
96
95
94
93
92
91
90
89
88
87
86
85
84
83
82
81
80
De
pth
(m
)
10 100 1000 10000
Single point resistance (ohm)
Flow from the measured section (L = 0.5 m, dL = 0.1 m), 2005-09-10 - 2005-09-11
91.8
92.6
93.4
95.6
97.4
99.4
96.597.0
Olkiluoto, ONKALO, Borehole PH3Flow rate and single point resistance
Fracture specific flow (into the hole) Fracture specific flow (into the bedrock)
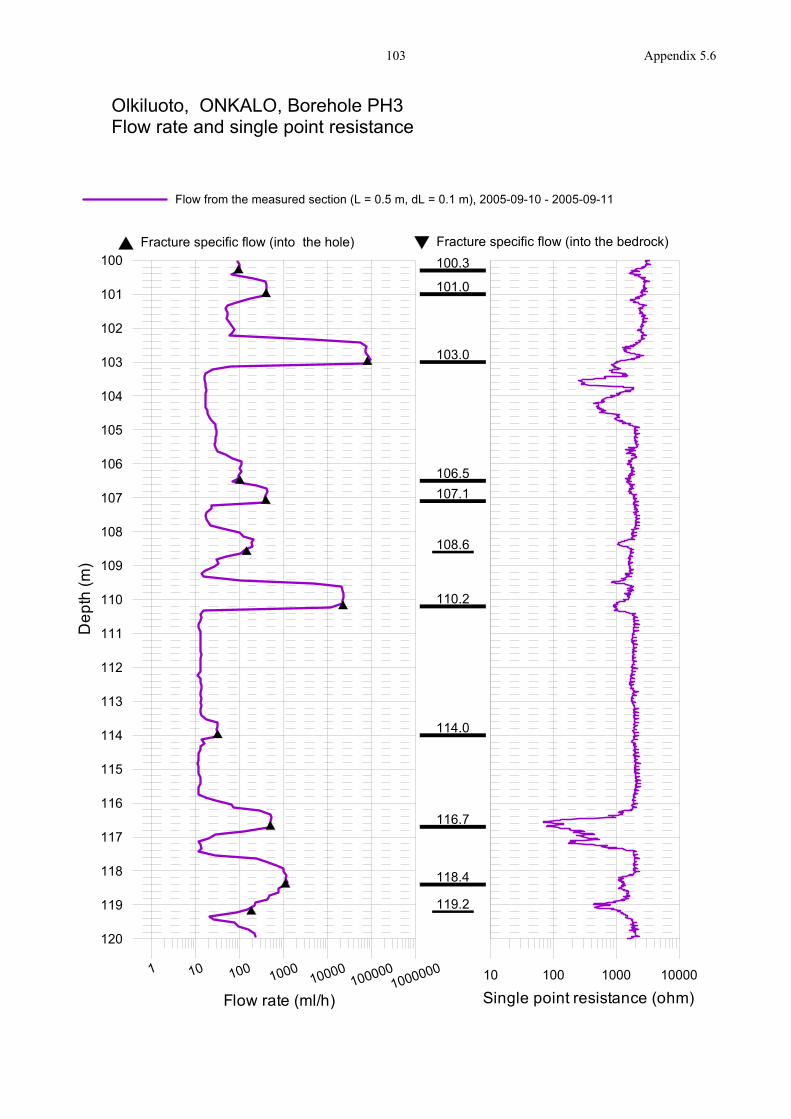
Appendix 5.6 103
1 10 1001000
10000100000
1000000
Flow rate (ml/h)
120
119
118
117
116
115
114
113
112
111
110
109
108
107
106
105
104
103
102
101
100
De
pth
(m
)
10 100 1000 10000
Single point resistance (ohm)
Flow from the measured section (L = 0.5 m, dL = 0.1 m), 2005-09-10 - 2005-09-11
100.3
101.0
103.0
106.5
107.1
110.2
114.0
116.7
118.4
108.6
119.2
Olkiluoto, ONKALO, Borehole PH3Flow rate and single point resistance
Fracture specific flow (into the hole) Fracture specific flow (into the bedrock)

Appendix 5.7 104
1 10 1001000
10000100000
1000000
Flow rate (ml/h)
140
139
138
137
136
135
134
133
132
131
130
129
128
127
126
125
124
123
122
121
120
De
pth
(m
)
10 100 1000 10000
Single point resistance (ohm)
Flow from the measured section (L = 0.5 m, dL = 0.1 m), 2005-09-10 - 2005-09-11
120.2
125.5
131.3
137.4
138.9
131.9
132.7
134.0
137.8
131.7
Olkiluoto, ONKALO, Borehole PH3Flow rate and single point resistance
Fracture specific flow (into the hole) Fracture specific flow (into the bedrock)

Appendix 5.8 105
1 10 1001000
10000100000
1000000
Flow rate (ml/h)
160
159
158
157
156
155
154
153
152
151
150
149
148
147
146
145
144
143
142
141
140
De
pth
(m
)
10 100 1000 10000
Single point resistance (ohm)
Flow from the measured section (L = 0.5 m, dL = 0.1 m), 2005-09-10 - 2005-09-11
141.0
141.3
Olkiluoto, ONKALO, Borehole PH3Flow rate and single point resistance
Fracture specific flow (into the hole) Fracture specific flow (into the bedrock)

Appendix 5.9 106
0 0.02 0.04 0.06 0.08 0.1
Hydraulic aperture of fracture (mm)
150
140
130
120
110
100
90
80
70
60
50
40
30
20
10
0
De
pth
(m
)
1E-0
10
1E-0
09
1E-0
08
1E-0
07
1E-0
06
1E-0
05
1E-0
04
Transmissivity (m2/s)
Hydraulic aperture of fracture (mm)
Olkiluoto, ONKALO, Borehole PH3Plotted transmissivity and hydraulic aperture of detected fractures
Transmissivity of fracture

Appendix 5.10 107
Hole: PH3 Elevation of the top of the
hole (masl): -59.976 Inclination: -5.843
Depth of fracture along the borehole (m)
Flow (ml/h)
Fractureelevation
(masl)
Drawdown (m)
T (m2/s) Hydraulic
aperture of fracture (mm)
Comments
16.8 861 -61.7 65.976 3.59E-09 0.018 17.7 1200 -61.8 65.976 5.00E-09 0.020 19.4 3450 -62.0 65.976 1.44E-08 0.029 19.8 3180 -62.0 65.976 1.32E-08 0.028 23.1 10400 -62.3 65.976 4.33E-08 0.042 91.8 633 -69.3 65.976 2.64E-09 0.016 92.6 2280 -69.4 65.976 9.49E-09 0.025 93.4 725 -69.5 65.976 3.02E-09 0.017 95.6 110000 -69.7 65.976 4.58E-07 0.092 96.5 3690 -69.8 65.976 1.54E-08 0.030 *97.0 9460 -69.9 65.976 3.94E-08 0.041 *97.4 5510 -69.9 65.976 2.29E-08 0.034 99.4 68500 -70.1 65.976 2.85E-07 0.079
100.3 96 -70.2 65.976 4.00E-10 0.009 *101.0 403 -70.3 65.976 1.68E-09 0.014 *103.0 81200 -70.5 65.976 3.38E-07 0.083 *106.5 102 -70.8 65.976 4.25E-10 0.009 *107.1 398 -70.9 65.976 1.66E-09 0.014 108.6 146 -71.0 65.976 6.08E-10 0.010 *110.2 22800 -71.2 65.976 9.49E-08 0.054 *114.0 32 -71.6 65.976 1.33E-10 0.006 *116.7 507 -71.9 65.976 2.11E-09 0.015 *118.4 1110 -72.0 65.976 4.62E-09 0.020 *119.2 186 -72.1 65.976 7.75E-10 0.011 120.2 198 -72.2 65.976 8.25E-10 0.011 *125.5 3100 -72.8 65.976 1.29E-08 0.028 131.3 75 -73.3 65.976 3.12E-10 0.008 *131.7 1590 -73.4 65.976 6.62E-09 0.022 *131.9 24900 -73.4 65.976 1.04E-07 0.056 *132.7 452 -73.5 65.976 1.88E-09 0.015 *134.0 12 -73.6 65.976 5.00E-11 0.004 137.4 1830 -74.0 65.976 7.62E-09 0.023 137.8 830 -74.0 65.976 3.46E-09 0.018 138.9 6870 -74.1 65.976 2.86E-08 0.037 141.0 1640 -74.3 65.976 6.83E-09 0.023 141.3 467 -74.4 65.976 1.94E-09 0.015
* Untertain

Appendix 5.11 108
0.01 0.1 1 10Electric conductivity (S/m, 25 oC)
150
140
130
120
110
100
90
80
70
60
50
40
30
20
10
0
De
pth
(m
)
During flow logging, upwards (L = 0.5 m, dL = 0.1 m), 2005-09-10 - 2005-09-11
Olkiluoto, ONKALO, Borehole PH3Electric conductivity of borehole water

Appendix 5.12 109
6 6.4 6.8 7.2 7.6 8Temperature (oC)
150
140
130
120
110
100
90
80
70
60
50
40
30
20
10
0
De
pth
(m
)
During flow logging, upwards (L = 0.5 m, dL = 0.1 m), 2005-09-10 - 2005-09-11
Olkiluoto, ONKALO, Borehole PH3Temperature of borehole water

110 Appendix 5.13
2005-09-10 / 15:00
2005-09-10 / 18:00
2005-09-10 / 21:00
2005-09-11 / 0:00
2005-09-11 / 3:00
2005-09-11 / 6:00
Year-Month-Day / Hour:Minute
0
1
2
3
4
5
6
7
Flo
w r
ate
ou
t fro
m th
e b
ore
ho
le (
L/m
in)
Olkiluoto, ONKALO, Borehole PH3Flow rate out from the borehole during flow logging

Tun
nust
Esi
-inje
kJäl
ki-in
jeK
ontr
oM
uu p
orau
sD
ryM
inor
Nor
mal
Ple
ntifu
ll
Obj
ect:
Dril
ling
Typ
e:
Cha
inag
e:67
6
Not
es
Mea
surin
g T
ime
10m
in[m
][m
][b
ar]
913
1713
9[b
ar]
24
6,4
3,4
1,3
[l]
0,21
0,17
0,17
0,15
0,14
[Lug
]
1,7
2,2
4,9
11
[l]
0,10
0,05
0,07
0,02
0,06
[Lug
]
0,4
3,9
4,4
1,5
0,3
[l]
0,02
0,09
0,06
0,03
0,02
[Lug
]
20,6
36,3
51,3
34,2
16,9
[l]
1,23
0,85
0,75
0,80
1,01
[Lug
]
[m]
27.9
.200
5
ON
KA
LO A
cces
s T
unne
l
6,46
4,7
Paul
i Syr
jäne
n
Mid
Dep
thM
ea-
surin
gLe
ngth
12,4
6
18,4
6
24,4
6
6,25
6,29
6,35
6,41
9,2
15,2
21,2
Not
es:
Gro
und-
wat
erP
ress
ure
Pilo
t Hol
e P
H3
Hol
e D
epth
Wat
er P
enet
ratio
n
3,46
6,46
3 6 12 186,
46
6,46
[Lug
]
Mea
nV
alue
Sta
n-da
rdde
v.
Inte
rpre
-ta
ted
Val
ue
0,17
0,03
0,15
0,06
0,05
0,05
0,03
0,02
0,03
0,93
0,20
0,80
11A
ppen
dix_
5.14
_wat
erlo
ss_3
-24,
46.x
ls
111 Appendix 5.14 1(2)

Inte
rpre
tatio
n
Ku
via
kä
yte
tää
n v
ed
en
virta
uk
sen
tu
lkin
na
ssa
. Tu
lkitu
t a
rvo
t va
in t
um
ma
nsi
nis
iin s
olu
ihin
.
A. C
. Hou
lsby
: Con
stru
ctio
n an
d D
esig
n of
Cem
ent G
rout
ing.
A19
90. W
iley-
Inte
rsci
ence
pub
licat
ion.
Sim
ilar
Luge
on v
alue
s fo
r ea
ch r
un in
dica
tes
lam
inar
flow
=>
Use
mea
n Lu
geon
val
ueLo
w L
ugeo
n va
lues
at h
ighe
r pr
essu
res
indi
cate
s tu
rbul
ent f
low
=>
Use
low
est L
ugeo
n va
lue
Hig
h Lu
geon
val
ues
at h
ighe
r pr
essu
res
indi
cate
s di
latio
n =>
Use
low
est L
ugeo
n va
lue
or m
ediu
m v
alue
, if l
owes
t val
ues
indi
cate
s tu
rbul
ent f
low
Luge
on v
alue
s in
crea
sing
eve
n w
hen
pres
sure
dro
ps, i
ndic
ates
was
hout
=>
Use
Lug
eon
valu
e of
the
final
run
Dec
reas
ing
Luge
on v
alue
s th
roug
hout
the
test
indi
cate
voi
d fil
ling
=> U
se lo
wes
t Lug
eon
valu
e
Mea
surin
g T
ime
10m
in[b
ar]
Pre
ssu
re9
1317
139
[bar
][L
ug]
Pre
s. D
iff.
2,75
6,75
10,7
56,
752,
75[b
ar]
Flo
w2
46,
43,
41,
3[l
]P
enet
ratio
n0,
210,
170,
170,
150,
14[L
ug]
0,15
Pre
s. D
iff.
2,71
6,71
10,7
16,
712,
71[b
ar]
Flo
w1,
72,
24,
91
1[l
]P
enet
ratio
n0,
100,
050,
070,
020,
06[L
ug]
0,05
Pre
s. D
iff.
2,65
6,65
10,6
56,
652,
65[b
ar]
Flo
w0,
43,
94,
41,
50,
3[l
]P
enet
ratio
n0,
020,
090,
060,
030,
02[L
ug]
0,02
Pre
s. D
iff.
2,59
6,59
10,5
96,
592,
59[b
ar]
Flo
w20
,636
,351
,334
,216
,9[l
]P
enet
ratio
n1,
230,
850,
750,
801,
01[L
ug]
0,8
Gro
undw
ater
Pre
ssur
e
186,
41
12
6,25
6,29
6,35
Inte
r-pr
eta-
tion
Wat
er P
enet
ratio
n T
est
3 6
0,00
0,05
0,10
0,15
0,20
0,25
0,00
0,02
0,04
0,06
0,08
0,10
0,12
0,00
0,02
0,04
0,06
0,08
0,10
0,00
0,50
1,00
1,50
Pag
e 1
112 2(2)

App
endi
x 5.
151
(2)
Tun
nus t
Esi
-inje
kJäl
ki-in
jeK
ontr
oM
uu p
orau
sD
ryM
inor
Nor
mal
Ple
ntifu
ll
Obj
ect:
Dril
ling
Typ
e:
Cha
inag
e:67
6
Not
es
Mea
surin
g T
ime
10m
in[m
][m
][b
ar]
913
1713
9[b
ar]
1,2
0,6
3,7
1,7
1[l
]
0,07
0,01
0,05
0,04
0,06
[Lug
]
0,8
1,7
2,7
1,7
0,7
[l]
0,05
0,04
0,04
0,04
0,04
[Lug
]
0,5
1,5
2,1
1,2
0,9
[l]
0,03
0,04
0,03
0,03
0,06
[Lug
]
0,6
1,4
2,8
1,5
1,1
[l]
0,04
0,03
0,04
0,04
0,07
[Lug
]
0,03
0,00
0,04
0,02
0,04
0,05
0,02
0,04
0,04
0,04
0,04
0,01[Lug
]
Mea
nV
alue
Sta
n-da
rdde
v.
Inte
rpre
-ta
ted
Val
ue
6,46
6,46
24 30 36 426,
46
6,46
Not
es:
Gro
und-
wat
erP
ress
ure
Pilo
t Hol
e P
H3
Hol
e D
epth
Wat
er P
enet
ratio
n
33,2
39,2
45,2
6,47
6,53
6,59
6,65
36,4
6
42,4
6
48,4
6
[m]
27.9
.200
5
ON
KA
LO A
cces
s T
unne
l
30,4
627
,2
Paul
i Syr
jäne
n
Mid
Dep
thM
ea-
surin
gLe
ngth
12A
ppen
dix_
5.15
_wat
erlo
ss_2
4-48
,46.
xls
113 Appendix 5.15 1(2)

Inte
rpre
tatio
n 2
(2)
Ku
via
kä
yte
tää
n v
ed
en
virta
uk
sen
tu
lkin
na
ssa
. Tu
lkitu
t a
rvo
t va
in t
um
ma
nsi
nis
iin s
olu
ihin
.
A. C
. Hou
lsby
: Con
stru
ctio
n an
d D
esig
n of
Cem
ent G
rout
ing.
A19
90. W
iley-
Inte
rsci
ence
pub
licat
ion.
Sim
ilar
Luge
on v
alue
s fo
r ea
ch r
un in
dica
tes
lam
inar
flow
=>
Use
mea
n Lu
geon
val
ueLo
w L
ugeo
n va
lues
at h
ighe
r pr
essu
res
indi
cate
s tu
rbul
ent f
low
=>
Use
low
est L
ugeo
n va
lue
Hig
h Lu
geon
val
ues
at h
ighe
r pr
essu
res
indi
cate
s di
latio
n =>
Use
low
est L
ugeo
n va
lue
or m
ediu
m v
alue
, if l
owes
t val
ues
indi
cate
s tu
rbul
ent f
low
Luge
on v
alue
s in
crea
sing
eve
n w
hen
pres
sure
dro
ps, i
ndic
ates
was
hout
=>
Use
Lug
eon
valu
e of
the
final
run
Dec
reas
ing
Luge
on v
alue
s th
roug
hout
the
test
indi
cate
voi
d fil
ling
=> U
se lo
wes
t Lug
eon
valu
e
Mea
surin
g T
ime
10m
in[b
ar]
Pre
ssu
re9
1317
139
[bar
][L
ug]
Pre
s. D
iff.
2,53
6,53
10,5
36,
532,
53[b
ar]
Flo
w1,
20,
63,
71,
71
[l]
Pen
etra
tion
0,07
0,01
0,05
0,04
0,06
[Lug
]0,
04
Pre
s. D
iff.
2,47
6,47
10,4
76,
472,
47[b
ar]
Flo
w0,
81,
72,
71,
70,
7[l
]P
enet
ratio
n0,
050,
040,
040,
040,
04[L
ug]
0,04
Pre
s. D
iff.
2,41
6,41
10,4
16,
412,
41[b
ar]
Flo
w0,
51,
52,
11,
20,
9[l
]P
enet
ratio
n0,
030,
040,
030,
030,
06[L
ug]
0,03
Pre
s. D
iff.
2,35
6,35
10,3
56,
352,
35[b
ar]
Flo
w0,
61,
42,
81,
51,
1[l
]P
enet
ratio
n0,
040,
030,
040,
040,
07[L
ug]
0,04
Inte
r-pr
eta-
tion
Wat
er P
enet
ratio
n T
est
24 30 36
6,47
6,53
6,59
Gro
undw
ater
Pre
ssur
e
426,
65
0,00
0,02
0,04
0,06
0,08
0,00
0,01
0,02
0,03
0,04
0,05
0,06
0,00
0,02
0,04
0,06
0,08
0,00
0,02
0,04
0,06
0,08
Pag
e 1
114 2(2)

App
endi
x 5.
161
(2)
Tun
nus t
Esi
-inje
kJäl
ki-in
jeK
ontr
oM
uu p
orau
sD
ryM
inor
Nor
mal
Ple
ntifu
ll
Obj
ect:
Dril
ling
Typ
e:
Cha
inag
e:67
6
Not
es
Mea
surin
g T
ime
10m
in[m
][m
][b
ar]
913
1713
9[b
ar]
0,6
3,4
5,4
4,3
2,6
[l]
0,04
0,08
0,08
0,11
0,18
[Lug
]
7311
2,2
133,
281
,554
,4[l
]
5,07
2,79
2,02
2,03
3,78
[Lug
]
5175
,297
,970
33,2
[l]
3,64
1,89
1,49
1,76
2,37
[Lug
]
6,4
2916
5,1
3,6
[l]
0,47
0,74
0,25
0,13
0,26
[Lug
]
[m]
27.9
.200
5
ON
KA
LO A
cces
s T
unne
l
54,4
651
,2
Paul
i Syr
jäne
n
Mid
Dep
thM
ea-
surin
gLe
ngth
60,4
6
66,4
6
72,4
6
6,71
6,77
6,83
6,89
57,2
63,2
69,2
Not
es:
Gro
und-
wat
erP
ress
ure
Pilo
t Hol
e P
H3
Hol
e D
epth
Wat
er P
enet
ratio
n
6,46
6,46
48 54 60 666,
46
6,46
[Lug
]
Mea
nV
alue
Sta
n-da
rdde
v.
Inte
rpre
-ta
ted
Val
ue
0,10
0,05
0,20
3,14
2,00
2,23
0,85
1,50
1,30
0,37
0,24
0,25
13A
ppen
dix_
5.16
_wat
erlo
ss_4
8-72
.46.
xls
115 Appendix 5.16 1(2)

Inte
rpre
tatio
n2
(2)
Ku
via
kä
yte
tää
n v
ed
en
virta
uk
sen
tu
lkin
na
ssa
. Tu
lkitu
t a
rvo
t va
in t
um
ma
nsi
nis
iin s
olu
ihin
.
A. C
. Hou
lsby
: Con
stru
ctio
n an
d D
esig
n of
Cem
ent G
rout
ing.
A19
90. W
iley-
Inte
rsci
ence
pub
licat
ion.
Sim
ilar
Luge
on v
alue
s fo
r ea
ch r
un in
dica
tes
lam
inar
flow
=>
Use
mea
n Lu
geon
val
ueLo
w L
ugeo
n va
lues
at h
ighe
r pr
essu
res
indi
cate
s tu
rbul
ent f
low
=>
Use
low
est L
ugeo
n va
lue
Hig
h Lu
geon
val
ues
at h
ighe
r pr
essu
res
indi
cate
s di
latio
n =>
Use
low
est L
ugeo
n va
lue
or m
ediu
m v
alue
, if l
owes
t val
ues
indi
cate
s tu
rbul
ent f
low
Luge
on v
alue
s in
crea
sing
eve
n w
hen
pres
sure
dro
ps, i
ndic
ates
was
hout
=>
Use
Lug
eon
valu
e of
the
final
run
Dec
reas
ing
Luge
on v
alue
s th
roug
hout
the
test
indi
cate
voi
d fil
ling
=> U
se lo
wes
t Lug
eon
valu
e
Mea
surin
g T
ime
10m
in[b
ar]
Pre
ssu
re9
1317
139
[bar
][L
ug]
Pre
s. D
iff.
2,29
6,29
10,2
96,
292,
29[b
ar]
Flo
w0,
63,
45,
44,
32,
6[l
]P
enet
ratio
n0,
040,
080,
080,
110,
18[L
ug]
0,2
Pre
s. D
iff.
2,23
6,23
10,2
36,
232,
23[b
ar]
Flo
w73
112,
213
3,2
81,5
54,4
[l]
Pen
etra
tion
5,07
2,79
2,02
2,03
3,78
[Lug
]2
Pre
s. D
iff.
2,17
6,17
10,1
76,
172,
17[b
ar]
Flo
w51
75,2
97,9
7033
,2[l
]P
enet
ratio
n3,
641,
891,
491,
762,
37[L
ug]
1,5
Pre
s. D
iff.
2,11
6,11
10,1
16,
112,
11[b
ar]
Flo
w6,
429
165,
13,
6[l
]P
enet
ratio
n0,
470,
740,
250,
130,
26[L
ug]
0,25
Gro
undw
ater
Pre
ssur
e
666,
89
60
6,71
6,77
6,83
Inte
r-pr
eta-
tion
Wat
er P
enet
ratio
n T
est
48 54
0,00
0,05
0,10
0,15
0,20
0,00
1,00
2,00
3,00
4,00
5,00
6,00
0,00
1,00
2,00
3,00
4,00
0,00
0,20
0,40
0,60
0,80
Pag
e 1
116 2(2)

Appendix 5.171 (2)
TunnustEsi-injekJälki-injeKontroMuu poraus Dry Minor NormalPlentifull
Object: Drilling Type:
Chainage: 676
Notes
Measuring Time 10 min[m] [m] [bar] 9 13 17 13 9 [bar]
3,6 3,6 3,5 3 1,8 [l]
0,27 0,09 0,05 0,08 0,14 [Lug]
13,2 4,1 4,7 3,3 1,9 [l]
1,03 0,11 0,07 0,09 0,15 [Lug]
4,3 7,8 7,1 5,9 4,4 [l]
0,35 0,20 0,11 0,15 0,35 [Lug]
51,2 89,3 126,8 53,5 24,4 [l]
4,24 2,36 1,99 1,41 2,02 [Lug]
[m]
27.9.2005
ONKALO Access Tunnel
78,46 75,2
Pauli Syrjänen
Mid DepthMea-suringLength
84,46
90,46
96,46
6,95
7,01
7,07
7,13
81,2
87,2
93,2
Notes:
Ground-water
Pressure
Pilot Hole PH3
Hole Depth Water Penetration
6,46
6,46
72
78
84
90 6,46
6,46
[Lug]
MeanValue
Stan-darddev.
Interpre-tatedValue
0,13 0,09 0,05
0,29 ?
0,23 0,11 0,10
0,41
2,40 1,08 2,00
14Appendix_5.17_waterloss_72-96.46.xls
117

Inte
rpre
tatio
n2
(2)
Ku
via
kä
yte
tää
n v
ed
en
virta
uk
sen
tu
lkin
na
ssa
. Tu
lkitu
t a
rvo
t va
in t
um
ma
nsi
nis
iin s
olu
ihin
.
A. C
. Hou
lsby
: Con
stru
ctio
n an
d D
esig
n of
Cem
ent G
rout
ing.
A19
90. W
iley-
Inte
rsci
ence
pub
licat
ion.
Sim
ilar
Luge
on v
alue
s fo
r ea
ch r
un in
dica
tes
lam
inar
flow
=>
Use
mea
n Lu
geon
val
ueLo
w L
ugeo
n va
lues
at h
ighe
r pr
essu
res
indi
cate
s tu
rbul
ent f
low
=>
Use
low
est L
ugeo
n va
lue
Hig
h Lu
geon
val
ues
at h
ighe
r pr
essu
res
indi
cate
s di
latio
n =>
Use
low
est L
ugeo
n va
lue
or m
ediu
m v
alue
, if l
owes
t val
ues
indi
cate
s tu
rbul
ent f
low
Luge
on v
alue
s in
crea
sing
eve
n w
hen
pres
sure
dro
ps, i
ndic
ates
was
hout
=>
Use
Lug
eon
valu
e of
the
final
run
Dec
reas
ing
Luge
on v
alue
s th
roug
hout
the
test
indi
cate
voi
d fil
ling
=> U
se lo
wes
t Lug
eon
valu
e
Mea
surin
g T
ime
10m
in[b
ar]
Pre
ssu
re9
1317
139
[bar
][L
ug]
Pre
s. D
iff.
2,05
6,05
10,0
56,
052,
05[b
ar]
Flo
w3,
63,
63,
53
1,8
[l]
Pen
etra
tion
0,27
0,09
0,05
0,08
0,14
[Lug
]0,
05
Pre
s. D
iff.
1,99
5,99
9,99
5,99
1,99
[bar
]
Flo
w13
,24,
14,
73,
31,
9[l
]P
enet
ratio
n1,
030,
110,
070,
090,
15[L
ug]
?
Pre
s. D
iff.
1,93
5,93
9,93
5,93
1,93
[bar
]
Flo
w4,
37,
87,
15,
94,
4[l
]P
enet
ratio
n0,
350,
200,
110,
150,
35[L
ug]
0,1
Pre
s. D
iff.
1,87
5,87
9,87
5,87
1,87
[bar
]
Flo
w51
,289
,312
6,8
53,5
24,4
[l]
Pen
etra
tion
4,24
2,36
1,99
1,41
2,02
[Lug
]2
Gro
undw
ater
Pre
ssur
e
907,
13
84
6,95
7,01
7,07
Inte
r-pr
eta-
tion
Wat
er P
enet
ratio
n T
est
72 78
0,00
0,05
0,10
0,15
0,20
0,25
0,30
0,00
0,20
0,40
0,60
0,80
1,00
1,20
0,00
0,10
0,20
0,30
0,40
0,00
1,00
2,00
3,00
4,00
5,00
Pag
e 1
118 2(2)

App
endi
x 5.
181
(2)]
Tun
nus t
Esi
-inje
kJäl
ki-in
jeK
ontr
oM
uu p
orau
sD
ryM
inor
Nor
mal
Ple
ntifu
ll
Obj
ect:
Dril
ling
Typ
e:
Cha
inag
e:67
6
Not
es
Mea
surin
g T
ime
10m
in[m
][m
][b
ar]
913
1713
9[b
ar]
71,5
94,3
116,
465
,437
,3[l
]
6,12
2,51
1,84
1,74
3,19
[Lug
]
4361
,794
,156
,231
,1[l
]
3,81
1,66
1,49
1,51
2,75
[Lug
]
8,2
13,9
22,3
7,6
3,3
[l]
0,75
0,38
0,36
0,21
0,30
[Lug
]
5,1
18,1
28,3
8,6
3,2
[l]
0,49
0,50
0,46
0,24
0,30
[Lug
]
0,30
1,02
0,40
0,12
0,30
3,08
1,80
1,80
2,25
1,50
0,40
0,21[Lug
]
Mea
nV
alue
Sta
n-da
rdde
v.
Inte
rpre
-ta
ted
Val
ue
6,46
6,46
96 102
108
114
6,46
6,46
Not
es:
Gro
und-
wat
erP
ress
ure
Pilo
t Hol
e P
H3
Hol
e D
epth
Wat
er P
enet
ratio
n
105,
2
111,
2
117,
2
7,19
7,25
7,31
7,37
108,
46
114,
46
120,
46
[m]
27.9
.200
5
ON
KA
LO A
cces
s T
unne
l
102,
4699
,2
Paul
i Syr
jäne
n
Mid
Dep
thM
ea-
surin
gLe
ngth
15A
ppen
dix_
5.18
_wat
erlo
ss_9
6-12
0.46
.xls
119 Appendix 5.18 1(2)
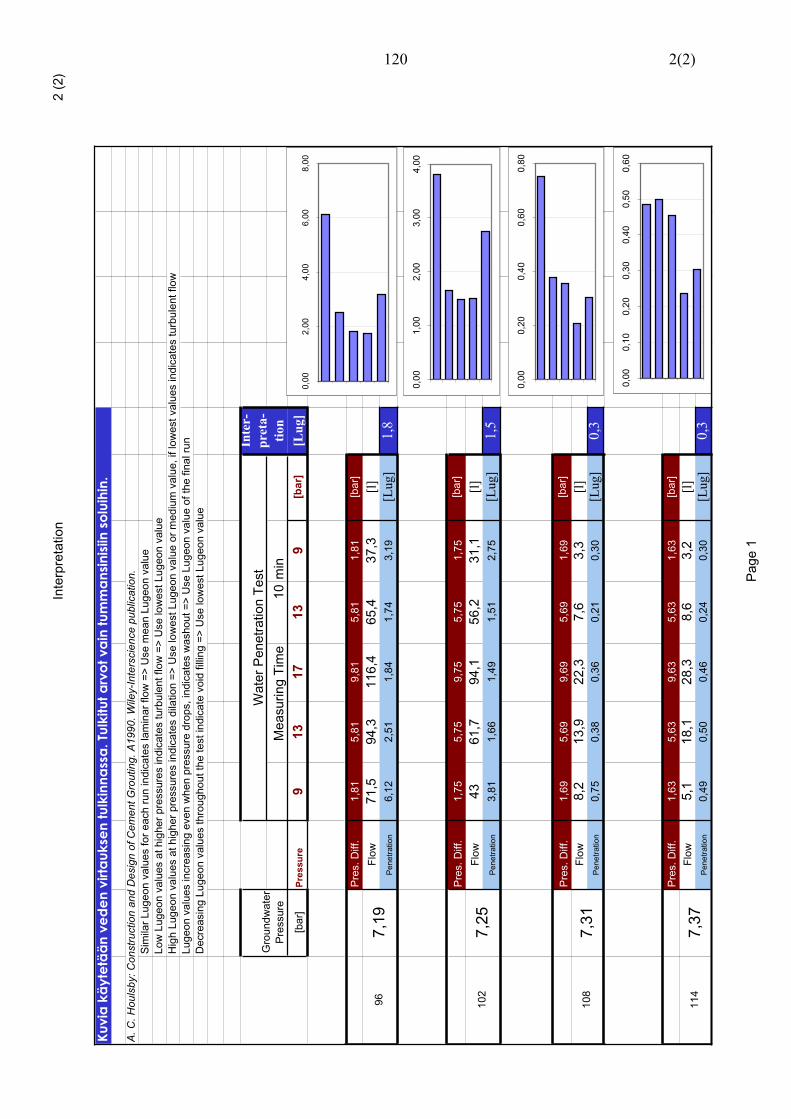
Inte
rpre
tatio
n2
(2)
Ku
via
kä
yte
tää
n v
ed
en
virta
uk
sen
tu
lkin
na
ssa
. Tu
lkitu
t a
rvo
t va
in t
um
ma
nsi
nis
iin s
olu
ihin
.
A. C
. Hou
lsby
: Con
stru
ctio
n an
d D
esig
n of
Cem
ent G
rout
ing.
A19
90. W
iley-
Inte
rsci
ence
pub
licat
ion.
Sim
ilar
Luge
on v
alue
s fo
r ea
ch r
un in
dica
tes
lam
inar
flow
=>
Use
mea
n Lu
geon
val
ueLo
w L
ugeo
n va
lues
at h
ighe
r pr
essu
res
indi
cate
s tu
rbul
ent f
low
=>
Use
low
est L
ugeo
n va
lue
Hig
h Lu
geon
val
ues
at h
ighe
r pr
essu
res
indi
cate
s di
latio
n =>
Use
low
est L
ugeo
n va
lue
or m
ediu
m v
alue
, if l
owes
t val
ues
indi
cate
s tu
rbul
ent f
low
Luge
on v
alue
s in
crea
sing
eve
n w
hen
pres
sure
dro
ps, i
ndic
ates
was
hout
=>
Use
Lug
eon
valu
e of
the
final
run
Dec
reas
ing
Luge
on v
alue
s th
roug
hout
the
test
indi
cate
voi
d fil
ling
=> U
se lo
wes
t Lug
eon
valu
e
Mea
surin
g T
ime
10m
in[b
ar]
Pre
ssu
re9
1317
139
[bar
][L
ug]
Pre
s. D
iff.
1,81
5,81
9,81
5,81
1,81
[bar
]
Flo
w71
,594
,311
6,4
65,4
37,3
[l]
Pen
etra
tion
6,12
2,51
1,84
1,74
3,19
[Lug
]1,
8
Pre
s. D
iff.
1,75
5,75
9,75
5,75
1,75
[bar
]
Flo
w43
61,7
94,1
56,2
31,1
[l]
Pen
etra
tion
3,81
1,66
1,49
1,51
2,75
[Lug
]1,
5
Pre
s. D
iff.
1,69
5,69
9,69
5,69
1,69
[bar
]
Flo
w8,
213
,922
,37,
63,
3[l
]P
enet
ratio
n0,
750,
380,
360,
210,
30[L
ug]
0,3
Pre
s. D
iff.
1,63
5,63
9,63
5,63
1,63
[bar
]
Flo
w5,
118
,128
,38,
63,
2[l
]P
enet
ratio
n0,
490,
500,
460,
240,
30[L
ug]
0,3
Inte
r-pr
eta-
tion
Wat
er P
enet
ratio
n T
est
96 102
108
7,19
7,25
7,31
Gro
undw
ater
Pre
ssur
e
114
7,37
0,00
2,00
4,00
6,00
8,00
0,00
1,00
2,00
3,00
4,00
0,00
0,20
0,40
0,60
0,80
0,00
0,10
0,20
0,30
0,40
0,50
0,60
Pag
e 1
120 2(2)

App
endi
x 5.
191
(2)
Tun
nus t
Esi
-inje
kJäl
ki-in
jeK
ontr
oM
uu p
orau
sD
ryM
inor
Nor
mal
Ple
ntifu
ll
Obj
ect:
Dril
ling
Typ
e:
Cha
inag
e:67
6
Not
es
Mea
surin
g T
ime
10m
in[m
][m
][b
ar]
913
1713
9[b
ar]
6,3
18,2
29,5
12,4
6[l
]
0,62
0,51
0,48
0,34
0,59
[Lug
]
11,3
17,4
22,9
13,8
7[l
]
1,16
0,49
0,37
0,39
0,72
[Lug
]
7,8
8,5
8,9
52,
4[l
]
0,83
0,24
0,15
0,14
0,26
[Lug
]
3,1
4,8
5,3
3,1
2[l
]
0,36
0,14
0,09
0,09
0,23
[Lug
]
0,15
0,33
0,18
0,11
0,10
0,51
0,11
0,50
0,63
0,40
0,32
0,29[Lug
]
Mea
nV
alue
Sta
n-da
rdde
v.
Inte
rpre
-ta
ted
Val
ue
6,46
6,46
120
126
132
138,
776,
28
6,46
Not
es:
Gro
und-
wat
erP
ress
ure
Pilo
t Hol
e P
H3
Hol
e D
epth
Wat
er P
enet
ratio
n
129,
2
135,
2
141,
9
7,43
7,49
7,55
7,62
132,
46
138,
46
145,
05
[m]
27.9
.200
5
ON
KA
LO A
cces
s T
unne
l
126,
4612
3,2
Paul
i Syr
jäne
n
Mid
Dep
thM
ea-
surin
gLe
ngth
16A
ppen
dix_
5.19
_wat
erlo
ss_1
20-1
45.0
4.xl
s
121 Appendix 5.19 1(2)

Inte
rpre
tatio
n2
(2)
Ku
via
kä
yte
tää
n v
ed
en
virta
uk
sen
tu
lkin
na
ssa
. Tu
lkitu
t a
rvo
t va
in t
um
ma
nsi
nis
iin s
olu
ihin
.
A. C
. Hou
lsby
: Con
stru
ctio
n an
d D
esig
n of
Cem
ent G
rout
ing.
A19
90. W
iley-
Inte
rsci
ence
pub
licat
ion.
Sim
ilar
Luge
on v
alue
s fo
r ea
ch r
un in
dica
tes
lam
inar
flow
=>
Use
mea
n Lu
geon
val
ueLo
w L
ugeo
n va
lues
at h
ighe
r pr
essu
res
indi
cate
s tu
rbul
ent f
low
=>
Use
low
est L
ugeo
n va
lue
Hig
h Lu
geon
val
ues
at h
ighe
r pr
essu
res
indi
cate
s di
latio
n =>
Use
low
est L
ugeo
n va
lue
or m
ediu
m v
alue
, if l
owes
t val
ues
indi
cate
s tu
rbul
ent f
low
Luge
on v
alue
s in
crea
sing
eve
n w
hen
pres
sure
dro
ps, i
ndic
ates
was
hout
=>
Use
Lug
eon
valu
e of
the
final
run
Dec
reas
ing
Luge
on v
alue
s th
roug
hout
the
test
indi
cate
voi
d fil
ling
=> U
se lo
wes
t Lug
eon
valu
e
Mea
surin
g T
ime
10m
in[b
ar]
Pre
ssu
re9
1317
139
[bar
][L
ug]
Pre
s. D
iff.
1,57
5,57
9,57
5,57
1,57
[bar
]
Flo
w6,
318
,229
,512
,46
[l]
Pen
etra
tion
0,62
0,51
0,48
0,34
0,59
[Lug
]0,
5
Pre
s. D
iff.
1,51
5,51
9,51
5,51
1,51
[bar
]
Flo
w11
,317
,422
,913
,87
[l]
Pen
etra
tion
1,16
0,49
0,37
0,39
0,72
[Lug
]0,
4
Pre
s. D
iff.
1,45
5,45
9,45
5,45
1,45
[bar
]
Flo
w7,
88,
58,
95
2,4
[l]
Pen
etra
tion
0,83
0,24
0,15
0,14
0,26
[Lug
]0,
15
Pre
s. D
iff.
1,38
5,38
9,38
5,38
1,38
[bar
]
Flo
w3,
14,
85,
33,
12
[l]
Pen
etra
tion
0,36
0,14
0,09
0,09
0,23
[Lug
]0,
1
Inte
r-pr
eta-
tion
Wat
er P
enet
ratio
n T
est
120
126
132
7,43
7,49
7,55
Gro
undw
ater
Pre
ssur
e
138,
777,
62
0,00
0,20
0,40
0,60
0,80
0,00
0,50
1,00
1,50
0,00
0,20
0,40
0,60
0,80
1,00
0,00
0,10
0,20
0,30
0,40
Pag
e 1
122 2(2)

ON
K-P
H3
Pre
ssu
re b
uild
-up
tes
t
01234567
Date/Time
9.12.2005 11:12
9.12.2005 11:15
9.12.2005 11:17
9.12.2005 11:20
9.12.2005 11:22
9.12.2005 11:25
9.12.2005 11:28
9.12.2005 11:30
9.12.2005 11:33
9.12.2005 11:35
9.12.2005 11:38
9.12.2005 11:40
9.12.2005 11:43
9.12.2005 11:45
9.12.2005 11:48
9.12.2005 11:51
9.12.2005 11:53
9.12.2005 11:56
9.12.2005 11:58
9.12.2005 12:01
9.12.2005 12:03
9.12.2005 12:06
9.12.2005 12:08
9.12.2005 12:11
9.12.2005 12:13
9.12.2005 12:16
9.12.2005 12:19
9.12.2005 12:21
9.12.2005 12:24
9.12.2005 12:26
9.12.2005 12:29
9.12.2005 12:31
9.12.2005 12:34
9.12.2005 12:36
9.12.2005 12:39
9.12.2005 12:42
9.12.2005 12:44
9.12.2005 12:47
9.12.2005 12:49
9.12.2005 12:52
Pressure (bar)
123 Appendix 5.20

124 Appendix 5.21
Pressure build-up test, pressure registration device

125 Appendix 6.1

126

Rautaruukki RROM-2
Specifications
Antenna dimensions
-diameter 42 mm -length 1570 mm -electrode separation a=318 mm -diameter of the electrodes 40 mm
Measuring cable minimum 4-conductor, length up to 1000 m, loop resistance for output voltage conductors max 40 Ohm
Measuring current 10 mA/20 Hz
Range 1-400 000 Ohm-m
Output voltage +5 V…-6 V
Power feed 18 V, 3 Ah
Power consumption 2.4 W
Operation temperature -20…+50 °C
127 Appendix 6.2

Specifications:
Weight LengthDiameter
8kg2.27m42mm
64”N & 16”N Resistivity Range 1 to 10,000 Ohmm
SPR 1 to 10,000 Ohm
SP Range -2.5V to +2.5V
Current return Measure return
Cable armour Bridle electrode
Max. Pressure 20MPa
Max. Temperature 80ºC
Normal Resistivity Sonde
The Geovista digital Normal Resistivity Sonde can be used on its own or in combination with other Geovista sondes for efficient logging and correlation purposes. The SP can be recorded with the sonde either powered on or off, using the 16” electrode and a surface fish.
Focused Resistivity Sonde Provides resistivity logs with finer vertical resolution and a deeper depth of
investigation. Performance is best in higher conductivity mud and higher
resistivity formations. The probe can be used on its own or in combination
with other Geovista sondes.
Weight 7.0 kg
Length 2.37m
Diameter 38mm
Range 1 to 10,000 Ohmm
Max. Pressure 20MPa
Max. Temperature 80ºC
Specifications:
Logging Sondes
Geovista reserve the right to change the products’ list and specifications without prior notice
U N I T 6 , C A E F F W T B U S I N E S S P A R K , G L A N C O N W Y, L L 2 8 5 S P , U K W E B S I T E : ht tp : / /www.geovis ta.co.uk P H O N E : +44 (0)1492 57 33 99 F A X : +44 (0)1492 58 11 77 E - M A I L : geovis ta@geovis ta .co.uk
128 Appendix 6.3

Introduction to
RAMAC/GPR
borehole radar
MALÅ GeoScience 2000-03-31
129 Appendix 6.4

INTRODUCTION
Borehole radar is based on the sameprinciples as ground penetrating radarsystems for surface use, which meansthat it consists of a radar transmitterand receiver built into separate probes.The probes are connected via an opticalcable to a control unit used for timesignal generation and data acquisition.The data storage and display unit isnormally a Lap Top computer, which iseither a stand-alone component or isbuilt into the circuitry of the controlunit. Borehole radar instruments canbe used in different modes: reflection,crosshole, surface-to-borehole anddirectional mode. Today’s availablesystems use centre frequencies from 20to 250 MHz.
Radar waves are affected by soil and rock conductivity. If the conductivity ofthe surrounding media is more than a certain figure reflection radar surveysare impossible. In high conductivity media the radar equation is not satisfiedand no reflections will appear. In crosshole- and surface-to-borehole radarmode measurements can be carried out in much higher conductivity areasbecause no reflections are needed. Important information concerning thelocal geologic conditions are evaluated from the amplitude of the first arrivaland the arrival time of the transmitted wave only, not a reflected component.
Common borehole radar applications include:
• Geological investigations
• Engineering investigations
• Environmental investigations
• Hydropower dams investigations
• Fracture detection
• Cavity detection
• Karstified area investigation
• Salt layers investigations
DIPOLE REFLECTION SURVEYS
In reflection mode the radar transmitter and receiver probes are lowered inthe same borehole with a fixed distance between them. See figure 1. In thismode an optical cable for triggering of the probes and data acquisition isnecessary to avoid parasitic antenna effects of the cable. The most commonly
130

used antennas are dipoleantennas, which radiate andreceive reflected signals from a360-degree space(omnidiretionally). Boreholeradar interpretation is similarto that of surface GPR datawith the exception of thespace interpretation. In surfaceGPR surveys all the reflectionsorginate from one half spacewhile the borehole data re-ceive reflections from a 360-degree radius. It is impossibleto determine the azimuth tothe reflector using data fromonly one borehole if dipoleantennas are used. What canbe determined is the distance to the reflector and in the case where the reflec-tor is a plane, the angle between the plane and the borehole.As an example, let ‘s imagine a fracture plane crossing a borehole and apoint reflector next to the same borehole (figure 1, left).
When the probes are above the fracture reflections from the upper part of theplane are imaged, in this case from the left side of the borehole. When theprobes are below the plane, reflections from the bottom of the plane areimaged, in this case the right side of the borehole. The two sides of the planeare represented in the synthetic radargram in figure 1. They are seen as twolegs corresponding to each side of the plane. When interpreting boreholeradar data, it is important to remember that the radar image is a 360-degreerepresentation in one plane. A point reflector shows up as a hyperbola, in thesame way as a point reflector appears in surface GPR data.Interpreting di-pole radar data from a single borehole, the interpreter can not give the direc-tion to the point reflector only the distance to source can be interpreted. Inorder to estimate the direction to the reflection, data from more than oneborehole need to be interpreted.
Figure 2:Dipole reflection measurement in granite. Theantenna centre frequency used was 100 MHz.In granite, normally several tens of meters ofrange are achieved using this antenna frequency.
Figure 1
131

Full Waveform Sonic Tool
The ALT full waveform sonic tool has been specially designed for the water, mining and geotechnical industries. Its superior specification makes it ideal for a cement bond logs, for the measurement of permeability index, and as a specialist tool to carry out deep fracture identification.
TECHNICAL SPECIFICATIONS
OD: 50 or 68mm Length: variable depending on configuration Max pressure: 200 bars Max temperature: 70°C Variable spacing: all traces synchronously and simultaneously recorded Frequency of sonic wave: 15KHz Sonic wave sampling rate: configurable, 2 uSec -> 50 µSec Sonic wave length: configurable, up to 1024 samples per receiver Dynamic range: 12 bits plus configurable 4 bits gain incl. AGC Data communication: compatible with ALT acquisition system Required wireline: single or multi- conductors
Modular tool allowing a configuration of up to 2 transmitters and 8 receivers
Advantages of the tool include :
High energy of transmission to give a greater depth of penetration or longer spacings. Lower frequency of operation for greater penetration, especially for the CBL.Ability to record a long wave train for Tube wave train reflection wich allows for the measurement of fracture aperture and permeability index. The absolute value of the amplitude of the received wave form is measurable thus allowing for the calibration of the amplitude. Truly modular construction allowing variation of receiver/transmitter combinations. Higher logging speeds when used in conjunction with the ALT Logger acquisition system due to the superior rate of data communication possible.
132 Appendix 6.5

Acquisition systems
ALT’s family of acquisition system is based on modern electronic design in which software control techniques havebeen used to the best advantage. The hardware incorporates the latest electronic components with embedded systemscontrolled via the specially developed ALTlogger Windows interface program.
M a i n f e a t u r e s
high speed USB interface Self selecting AC power source from AC 100V to AC 240VRuggedised system, heavy duty, fault tolerantInterfaces downhole probes from many manufacturer (not available on Abox system)Wireline and winch flexibility (runs on coax, mono, 4 or 7 conductor wireline)Compatible with most shaft encoder (runs on any 12V or 5V quadrature shaft encoder with any combination of wheel circum-
ference/shaft pulse per revolution)Totally software controlledVery easy to use, with graphical user interface (dashboard), self diagnostic features, configurable through files and minimal
technical knowledge needed from the user Runs on any notebook PC compatible Windows 2000 & windows XP.Real time data display and printingSupports Windows supported printers and Printrex thermal printersoptional network enabled distributed architecture
A LT l o g g e r 1 9 ’ ’ r a c k a n d m i n i r a c k
The rack system has been designed to accommodate multivendor tool types. The modular and flexible design architecture of thesystem will allow virtually any logging tool to run on any winch supposed the required Tool Adapter and Depth Encoder Adapter isinserted into the ALTlogger Unit. Any new combination of logging tool and winch unit will just require selection of the properALTlog.ini File and the proper Tol-File.
The Tool Adapter is the software and hardware suitable to interface a specific family of tools. It provides the interface between atool specific power, data protocol and wireline conductor format and the system core. When a logging tool is selected for use, thesystem automatically addresses the type of adapter associated with the tool.
The latest Digital Signal Processing (DSP) adapter adds even more flexibility to the system with expansion slots for future develop-ments and upgrades, by implementing a 100% firmware based modem system.
ALTlogger 19” rack mountable ALTlogger minirack ABOX
48.3 cm (19”)50 cm (19,7”)13.2 cm (3U)16-20kgs without packaging
WLHW
37.6 cm (14.5”)35 cm (13.8”)13.2 cm (3U)12-16kgs without packaging
26 cm16 cm9 cm3kgs
The specifications are not contractual and are subject to modification without notice.
133 Appendix 6.6

Bâtiment A, Route de Niederpallen, L-8506 Redange-sur-Attert. Grand-Duché de Luxembourg
T:(352) 23 649 289 • F:(352) 23 649 364 e-mail: [email protected] www.alt.lu
B r o w s e r a n d p r o c e s s o r s ( r e a l t i m e d a t a m o n i t o r i n g )
A Browser is a Client Process. The Browser offer the operator of the logging system a numberof different on-line display facilities to present log data on the screen in a user-friendly, easycontrollable, attractive layout. Depending on the tool category, different Browser are used todisplay log data such as conventional curves, full waveform sonics, borehole images ...
Typical user screen with scrolling log display and data monitoring
D a s h b o a r d
The heart of the graphical user interface is called the Dashboard andconsists of multiple threads running concurrently and handling speci-fic system tasks. The dashboard is also the operator’s control panel. Itis used to select and control all systems functions and to monitor dataacquisistion. The dashboard contains seven sub windows:
Depth (depth system)
Tool (tool configuration & power)
Communication (data flows and communication control)
Acquisition (data sampling and replay controls)
Browser and processors (data browser and processors controls)
Status (self diagnostic system status indicators)
tension (tension gauge system
The acquisition system ALTLoggersoftware runs on Windows OS and exploits the true pre-emptive multitasking ability of the Windows NT Kernel
T O L f i l e
Information specific to a particu-lar tool is contained in a uniquetool configuration file which hasthe extension *.TOL. Informationcontained in the *.TOL file is usedby different components of thesystem for initialising Dashboardcomponents (tool power, dataprotocol, etc…), as well as settingparameters for client processes(browser & processors) handlingdata calibration, data processing,data display or printing. A copy ofthe TOL file is included in eachdata file acquired
134

OBI 40s l i m h o l e o p t i c a l t e l e v i e w e r
The tool generates a continuous oriented 360° image of theborehole wall using an optical imaging system. (downhole CCDcamera which views a image of the borehole wall in a prism).The tool includes a orientation device consisting of a precision3 axis magnetometer and 3 accelerometers thus allowingaccurate borehole deviation data to be obtained during thesame logging run (accurate and precise orientation of theimage).
Optical and acoustic televiewer data are complimentary toolsespecially when the purpose of the survey is structural analysis.
A common data display option is the projection on a virtualcore that can be rotated and viewed from any orientation.Actually, an optical televiewer image will complement and evenreplace coring survey and its associated problem of corerecovery and orientation.
The optical televiewer is fully downhole digital and can be runon any standard wireline (mono, four-conductor, seven-conductor). Resolution is user definable (up to 0.5mm verticalresolution and 720 pixels azimuthal resolution)
Bâtiment A, Route de Niederpallen, L-8506 Redange-sur-Attert. Grand-Duché de Luxembourg
T:(352) 23 649 289 • F:(352) 23 649 364 e-mail: [email protected] www.alt.lu
135

OBI 40s l i m h o l e o p t i c a l t e l e v i e w e r
Applications:
The purpose of the optical imaging tool is to provide detailed, oriented, structuralinformation. Possible applications are :
• fracture detection and evaluation
• detection of thin beds
• bedding dip
• lithological characterization
• casing inspection
Technical specificationsDiameter 40mmLength approx. 1.7mWeight approx 7 kgsMax temp 50°CMax pressure 200 barsBorehole diameter 1 3/4" to 24" depending on borehole conditionsLogging speed variable function of resolution and wireline
Cable:Cable type mono, four-conductor, seven-conductorDigital data transmission up to 500 Kbps depending on wireline, realtime compressedCompatibility ALTIogger- ALT-Abox- Mount Sopris MgXII (limited to 41 Kbps)
sensor:Sensor type downhole DSP based digital CCD cameraOptics plain polycarbonate conic prism systemAzimuthal resolution user definable 90/180/360 or 720 pixels /360°Vertical resolution user definable, depth or time sampling rateColor resolution 24 bit RGB valueWhite balance: automatic or user adjustableAperture & Shutter automatic or user adjustableSpecial functions User configurable real time digital edge enhancing
User configurable ultra low light condition modeOrientation 3 axis magnetometer and 3 accelerometers.Inclination accuracy 0.5 degreeAzimuth accuracy: 1.0 degree
The specifications are not contractual and are subject to modification without notice.
Logging parameters:
• 360° RGB orientated optical image
• Borehole azimuth and dip
• Tool internal Temperature
136

Borehole Loggingwww.smoy.fi
Suomen Malmi OyP.O. Box 10FI-00210 ESPOO+358 9 8524 010
Dip: -5.843
Site: Olkiluoto
Surveyed by:AS, AK, JM
Z: -59.976
Y: 6792 046.873
X: 1526 126.618
Reported by: JM
Hole no: ONK-PH03
Project no:
Survey date: 13.09.2005
Client: Posiva Oy
Length: 144.91
Azimuth: 225.1355
Report date: Sept 2005
Ø: 76
Depth
1m:500m
Velocity P 0.6 m
4000 7000 m/s
Velocity S 0.6 m
2000 5000 m/s
Gamma-gamma Density
2.6 3.2 g/cm3
Natural Gamma
0 150 µR/h
Susceptibility
0 200 1E-5 SI
Resistivity Wenner
20 2000 Ohm.m
RadarFirstArrivalTime
30 22 ns
Radar First Wave Ampl
0 30000 µV
Tunnel
pile (m)
Fr.freq.
0 151/m
Core loss
Lith.
0.0
10.0
20.0
30.0
40.0
50.0
60.0
70.0
80 0
700.0
705.0
710.0
715.0
720.0
725.0
730.0
735.0
740.0
745.0
750.0
755.0
760.0
765.0
770.0
775.0
Pegmatite/Pegmatitic granite
Veined gneiss
Pegmatite/Pegmatitic granite
Diatexitic gneiss
Pegmatite/Pegmatitic granite
Quartz gneiss
Diatexitic gneiss
Diatexitic gneiss
Pegmatite/Pegmatitic granite
Diatexitic gneiss
Diatexitic gneiss
Veined gneiss
Pegmatite/Pegmatitic granite
Diatexitic gneiss
Pegmatite/Pegmatitic granite
Diatexitic gneiss
Pegmatite/Pegmatitic granite
Diatexitic gneiss
Pegmatite/Pegmatiticgranite
Diatexitic gneiss
Pegmatite/Pegmatitic granite
Diatexitic gneiss
137 Appendix 6.7

80.0
90.0
100.0
110.0
120.0
130.0
140.0
780.0
785.0
790.0
795.0
800.0
805.0
810.0
815.0
820.0
825.0
830.0
835.0
840.0
Pegmatite/Pegmatitic granite
Diatexitic gneiss
Mafic gneiss
Diatexitic gneiss
Pegmatite/Pegmatitic granite
Diatexitic gneiss
Diatexitic gneiss
Diatexitic gneiss
Diatexitic gneiss
Diatexitic gneiss
Veined gneiss
Diatexitic gneiss
Mica gneiss
Diatexitic gneiss
Pegmatite/Pegmatitic granite
Mica gneiss
138

Borehole Radarwww.smoy.fi
Suomen Malmi OyP.O. Box 10FI-00210 ESPOO+358 9 8524 010
Dip: - 5.843
Site: Olkiluoto
Surveyed by:AS, JM
Z: -59.976
Y: 6792 046.873
X: 1526 126.618
Reported by: JM
Hole no: ONK-PH03
Project no:
Survey date: 13.09.2005
Client: Posiva Oy
Length: 144.91
Azimuth: 225.1355
Report date: Sept. 2005
Ø: 76
Depth
1m:500m
Radar Raw Image, 250 MHz
0 200 nanosec
Resistivity Wenner
20 2000 Ohm.m
Radar 1st Arr. Time
29 22 ns
Radar 1st Wave Ampl
0 30000 µV
Tunnel
pile (m)
Fr.freq.
0 151/m
Core loss
Lith.
0.0
10.0
20.0
30.0
40.0
50.0
60.0
70.0
80 0
700.0
705.0
710.0
715.0
720.0
725.0
730.0
735.0
740.0
745.0
750.0
755.0
760.0
765.0
770.0
775.0
Pegmatite/Pegmatitic granite
Veined gneiss
Pegmatite/Pegmatitic granite
Diatexitic gneiss
Pegmatite/Pegmatitic granite
Quartz gneiss
Diatexitic gneiss
Diatexitic gneiss
Pegmatite/Pegmatitic granite
Diatexitic gneiss
Diatexitic gneiss
Veined gneiss
Pegmatite/Pegmatitic granite
Diatexitic gneiss
Pegmatite/Pegmatitic granite
Diatexitic gneiss
Pegmatite/Pegmatitic granite
Diatexitic gneiss
Pegmatite/Pegmatiticgranite
Diatexitic gneiss
Pegmatite/Pegmatitic granite
Diatexitic gneiss
139 Appendix 6.8

80.0
90.0
100.0
110.0
120.0
130.0
140.0
780.0
785.0
790.0
795.0
800.0
805.0
810.0
815.0
820.0
825.0
830.0
835.0
840.0
Pegmatite/Pegmatitic granite
Diatexitic gneiss
Mafic gneiss
Diatexitic gneiss
Pegmatite/Pegmatitic granite
Diatexitic gneiss
Diatexitic gneiss
Diatexitic gneiss
Diatexitic gneiss
Diatexitic gneiss
Veined gneiss
Diatexitic gneiss
Mica gneiss
Diatexitic gneiss
Pegmatite/Pegmatitic granite
Mica gneiss
140

Bor
ehol
e R
adar
ww
w.s
moy
.fi
Suo
men
Mal
mi O
yP
.O. B
ox 1
0F
I-00
210
ES
PO
O+3
58 9
852
4 01
0
Dip
:-5.
843
Sit
e:O
lkilu
oto
Su
rvey
ed b
y:JM
, AS
Z:
-59.
976
Y:
6792
046
.873
X:
1526
126
.618
Rep
ort
ed b
y:JM
Ho
le n
o:O
NK
-PH
03
Pro
ject
no
:
Su
rvey
dat
e:13
.09.
2005
Clie
nt:
Pos
iva
Oy
Len
gth
:144
.91
Azi
mu
th:2
25.1
355
Rep
ort
dat
e:S
ept.
2005
Ø:
75.7
Dep
th
1m:2
00m
Rad
ar In
ters
ect.
Ang
les
090
Tun
nel
pile
(m
)
Rad
ar O
rient
atio
ns
Sch
mid
t Plo
t - L
ower
Hem
isph
ere
Ran
ge O
ut
07
m
Ref
l. E
xt B
ckw
d
300
m
Ref
l. E
xt. F
wd
030
m
Fr.
freq
.
015
1/m
Cor
e lo
ss
Lith
.O
rient
. Ref
lect
.de
gree
s
090
Fra
ct.A
ngle
sde
gree
s
090
Orie
nted
Fra
ct.
degr
ees
090
0.0
4.0
8.0
12.0
700.
0
705.
0
710.
0
0° 180°
Sch
mid
t Plo
t - L
ower
Hem
isph
ere
Dep
th: -
1.30
[m] t
o 16
.00
[m]
Mea
nC
ount
s12
Dip
[deg
]55
.38
Azi
[deg
]95
.91
755
.32
103.
645
55.4
885
.20
Peg
mat
ite/
Peg
mat
itic
gran
ite
Vei
ned
gnei
ss
Peg
mat
ite/
Peg
mat
itic
gran
ite
Dia
texi
ticgn
eiss
141 Appendix 6.9

16.0
20.0
24.0
28.0
32.0
36.0
40.0
44.0
715.
0
720.
0
725.
0
730.
0
735.
0
740.
0
0° 180°
Sch
mid
t Plo
t - L
ower
Hem
isph
ere
De p
th: 1
6.00
[m] t
o 32
.06
[m]
Mea
nC
ount
s14
Dip
[deg
]54
.69
Azi
[deg
]18
.77
652
.15
209.
118
56.6
721
.13
0° 180°
Sch
mid
t Plo
t - L
ower
Hem
isph
ere
Dep
th: 3
2.06
[m] t
o 48
.02
[m]
Mea
nC
ount
s8
Dip
[deg
]50
.04
Azi
[deg
]71
.27
243
.50
77.5
06
52.4
068
.33
Peg
mat
ite/
Peg
mat
itic
gran
ite
Qua
rtz
gnei
ss
Dia
texi
ticgn
eiss
Dia
texi
ticgn
eiss
Peg
mat
ite/
Peg
mat
itic
gran
ite
Dia
texi
ticgn
eiss
Dia
texi
ticgn
eiss
Vei
ned
gnei
ss
Peg
mat
ite/
Peg
mat
itic
gran
ite
Dia
texi
ticgn
eiss
Peg
mat
ite/
Peg
mat
itic
gran
ite
142

48.0
52.0
56.0
60.0
64.0
68.0
72.0
76.0
745.
0
750.
0
755.
0
760.
0
765.
0
770.
0
775.
0
0° 180°
Sch
mid
t Plo
t - L
ower
Hem
isph
ere
Dep
th: 4
8.02
[m] t
o 64
.00
[m]
Mea
nC
ount
s15
Dip
[deg
]53
.17
Azi
[deg
]90
.54
852
.56
87.9
67
53.8
895
.06
0° 180°
Sch
mid
t Plo
t - L
ower
Hem
isph
ere
Dep
th: 6
4.04
[m] t
o 80
.06
[m]
Mea
nC
ount
s9
Dip
[deg
]49
.52
Azi
[deg
]82
.26
336
.29
99.0
46
56.3
073
.74
gran
ite
Dia
texi
ticgn
eiss
Peg
mat
ite/
Peg
mat
itic
gran
ite
Dia
texi
ticgn
eiss
Peg
mat
ite/P
egm
gran
ite
Dia
texi
ticgn
eiss
Peg
mat
ite/
Peg
mat
itic
gran
ite
Dia
texi
ticgn
eiss
143

80.0
84.0
88.0
92.0
96.0
100.
0
104.
0
108.
0
780.
0
785.
0
790.
0
795.
0
800.
0
805.
0
0° 180°
Sch
mid
t Plo
t - L
ower
Hem
isph
ere
Dep
th: 8
0.06
[m] t
o 95
.96
[m]
Mea
nC
ount
s12
Dip
[deg
]45
.39
Azi
[deg
]66
.43
737
.74
77.8
45
56.3
836
.17
0° 180°
Sch
mid
t Plo
t - L
ower
Hem
isph
ere
De p
th: 9
5.98
[m] t
o 11
2.04
[m]
Mea
nC
ount
s12
Dip
[deg
]36
.53
Azi
[deg
]94
.33
732
.88
74.5
55
41.9
221
0.52
Peg
mat
ite/
Peg
mat
itic
gran
ite
Dia
texi
ticgn
eiss
Maf
ic g
neis
s
Dia
texi
ticgn
eiss
Peg
mat
ite/
Peg
mat
itic
gran
ite
Dia
texi
ticgn
eiss
Dia
texi
ticgn
eiss
Dia
texi
ticgn
eiss
144

112.
0
116.
0
120.
0
124.
0
128.
0
132.
0
136.
0
140.
0
810.
0
815.
0
820.
0
825.
0
830.
0
835.
0
840.
0
0° 180°
Sch
mid
t Plo
t - L
ower
Hem
isph
ere
Dep
th: 1
12.0
4 [m
] to
127.
94 [m
]
Mea
nC
ount
s13
Dip
[deg
]51
.71
Azi
[deg
]12
9.53
745
.95
125.
986
58.4
013
9.68
0° 180°
Sch
mid
t Plo
t - L
ower
Hem
isph
ere
Dep
th: 1
27.9
4 [m
] to
144.
12 [m
]
Mea
nC
ount
s19
Dip
[deg
]48
.19
Azi
[deg
]71
.91
837
.58
77.4
111
56.0
233
1.01
Dia
texi
ticgn
eiss
Dia
texi
ticgn
eiss
Vei
ned
gnei
ss
Dia
texi
ticgn
eiss
Mic
a gn
eiss
Dia
texi
ticgn
eiss
Peg
mat
ite/
Peg
mat
itic
gran
ite
145
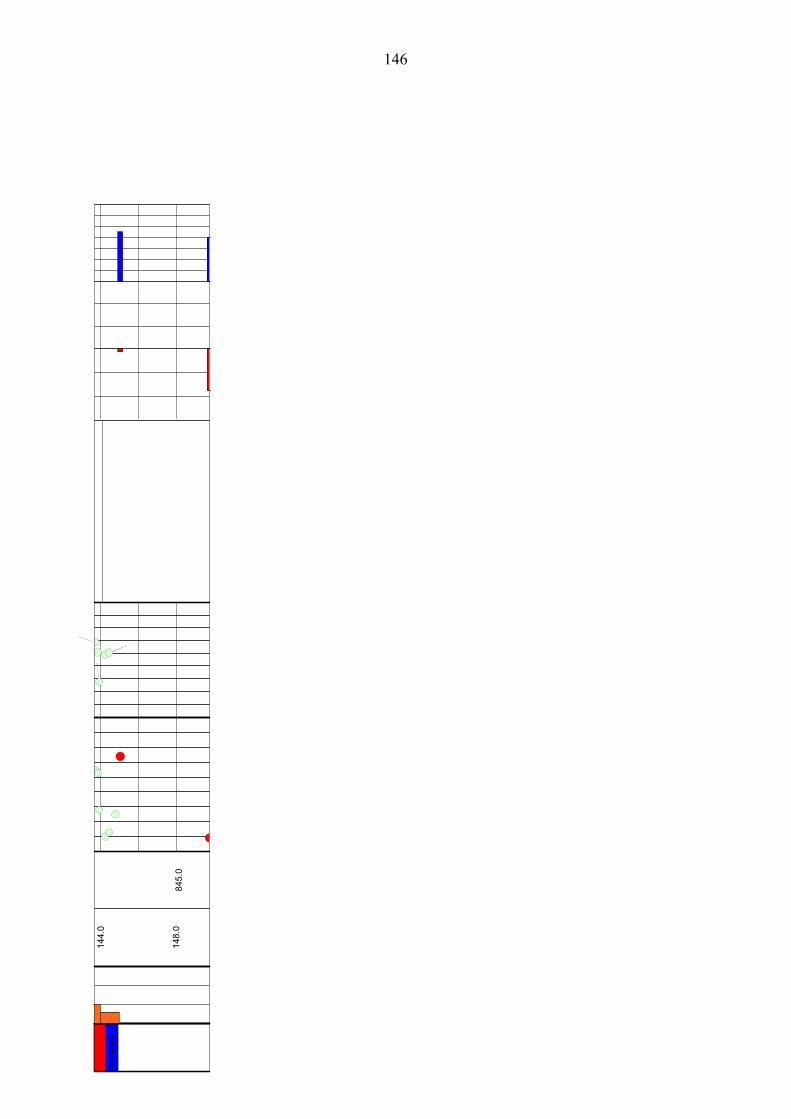
144.
0
148.
084
5.0
Mic
a gn
eiss
146

TY
PE
N
r.
Dep
th
Ang
le
Azi
mut
hD
ip
Ext
. ba
ckw
ard
Ext
. fo
rwar
d R
ange
out
C
LA
SS
Com
men
t F
ILT
ER
PL
AN
E
L-9
8 -1
.34
63.0
9
0.
000
0.57
9 4
Wea
k D
irec
tion
not
give
n.
NoF
ilter
PL
AN
E
L-2
10
-0.8
256
.62
0.00
0 1.
874
4C
lear
D
irec
tion
not
give
n.
HFI
R
PL
AN
E
L-9
7 0.
0939
.93
100
640.
000
4.55
9 4.
5C
lear
Folia
tion,
tigh
t fr
actu
res
not
orie
nted
. Wal
l. H
FIR
P
LA
NE
L
-148
1.
6840
.61
100
640.
000
5.27
8 4.
5C
lear
Fo
liatio
n FI
R
PL
AN
E
L-1
03
2.73
36.2
411
064
0.00
0 6.
419
5W
eak
Folia
tion
NoF
ilter
PL
AN
E
L-1
55
3.2
6.67
0.00
0 6.
906
2.5
Stro
ng,
Ext
ents
Far
Not
ori
ente
d,
expl
anat
ion
unkn
own.
See
n 12
m d
own
from
pr
ojec
ted
loca
tion,
not
at
inte
rsec
tion
P
LA
NE
L
-96
3.33
31.0
711
064
1.57
1 8.
537
4.5
Cle
ar
Folia
tion
NoF
ilter
P
LA
NE
L
-92
5.67
23.1
9
1.
686
8.23
9 4
Stro
ng
Not
ori
ente
d N
oFilt
er
PL
AN
E
L-1
01
5.73
28.6
4
2.
536
9.62
8 4
Stro
ng
Not
ori
ente
d N
oFilt
er
PL
AN
E
L-1
04
6.79
40.0
987
893.
775
3.77
5 3.
5W
eak
Frac
ture
N
oFilt
er
PL
AN
E
L-2
09
6.88
50.5
387
891.
837
1.83
7 2.
4C
lear
Fr
actu
re.
Atte
nuat
ion.
H
FIR
PL
AN
E
L-1
02
7.4
30.0
5
5.
146
6.01
8 3.
5St
rong
Not
ori
ente
d.
Atte
nuat
ion.
GR
co
ntac
t. N
oFilt
er
PL
AN
E
L-1
50
8.61
31.5
280
283.
339
5.06
8 3.
2C
lear
Fr
actu
re. S
een
do
wnw
ards
. FI
R
PL
AN
E
L-9
9 9.
329
.62
8028
6.04
4 6.
044
3.5
Cle
ar
Frac
ture
N
oFilt
er
PL
AN
E
L-9
3 11
.63
29.7
112
406.
913
4.28
6 3.
5W
eak
Folia
tion
NoF
ilter
PL
AN
E
L-1
49
12.5
728
112
407.
027
3.45
9 3.
5W
eak
Folia
tion.
O
rien
tatio
n al
tern
ates
FI
R
PL
AN
E
L-1
00
13.5
629
.46
8151
8.67
86.
054
4.8
Cle
ar
Folia
tion
NoF
ilter
P
LA
NE
L
-87
15.2
535
.92
9245
6.44
54.
814
4.4
Cle
ar
Frac
ture
N
oFilt
er
PL
AN
E
L-1
47
17.4
632
.898
854.
147
3.29
32.
7St
rong
Fr
actu
re.
Atte
nuat
ion.
FI
R
PL
AN
E
L-9
5 18
.46
30.3
134
182
5.13
26.
002
3.5
Cle
ar
Frac
ture
N
oFilt
er
147 Appendix 6.10

PL
AN
E
L-1
46
19.0
535
.06
359
493.
623
2.78
82.
5C
lear
Fr
actu
re
FIR
P
LA
NE
L
-208
19
.26
70.4
9
1.
137
0.61
32.
8St
rong
N
ot o
rien
ted
HFI
R
PL
AN
E
L-1
56
19.8
89.
5333
318
4.86
61.
809
1.8
Far
Fra
ctur
e. S
een
7 m
upw
d an
d 12
m
dw
nwd
from
pr
ojec
ted
intr
s F
IR
PL
AN
E
L-9
0 21
.38
26.5
711
381
6.21
87.
118
3St
rong
Frac
ture
. A
ttenu
atio
n.
Cur
ved
NoF
ilter
PL
AN
E
L-9
1 22
.93
27.3
528
387
7.51
510
.634
3.2
Stro
ng
Folia
tion.
A
ttenu
atio
n.
Con
duct
or.
NoF
ilter
PL
AN
E
L-2
05
23.1
37.9
328
387
3.89
23.
892
3.3
Cle
ar
Folia
tion.
A
ttenu
atio
n.
Con
duct
or.
HFI
R
PL
AN
E
L-1
45
23.4
434
.15
281
874.
083
3.24
23.
3W
eak
Frac
ture
. A
ttenu
atio
n.
Con
duct
or. U
pwd
sam
e as
L-2
05
FIR
PL
AN
E
L-1
52
24.2
30.1
418
140
4.26
74.
267
2.5
Cle
ar
Folia
tion.
Tim
e de
lay.
FI
R
PL
AN
E
L-2
07
25.3
532
.54
4.15
94.
159
2.5
Cle
ar
Not
ori
ente
d,
poss
ible
fol
iatio
n H
FIR
PL
AN
E
L-8
8 25
.68
23.9
5
6.
354
7.27
32.
8C
lear
N
ot o
rien
ted,
po
ssib
le f
olia
tion
NoF
ilter
P
LA
NE
L
-206
25
.93
36.8
120
439
3.54
43.
136
2.5
Cle
ar
Folia
tion
HFI
R
PL
AN
E
L-1
54
26.7
638
.49
3.86
24.
653
3.5
Cle
ar
Not
ori
ente
d,
poss
ible
fol
iatio
n FI
R
PL
AN
E
L-9
4 27
.12
28.6
572
306.
102
6.10
23
Cle
ar
Folia
tion
NoF
ilter
PL
AN
E
L-2
11
28.7
127
.42
4520
8.84
78.
847
4Fr
actu
re. U
pwd
clos
e to
L-8
6 A
GC
P
LA
NE
L
-86
29.0
425
.68
4329
8.98
28.
982
4C
lear
Fr
actu
re
NoF
ilter
PL
AN
E
L-1
07
29.8
572
.86
1.15
41.
154
4C
lear
N
ot o
rien
ted,
po
ssib
le f
olia
tion
NoF
ilter
P
LA
NE
L
-89
30.6
836
.68
7233
4.76
83.
957
4C
lear
Fo
liatio
n N
oFilt
er
PL
AN
E
L-8
5 31
.17
82.7
2
0.
496
0.49
64
Wea
k N
ot o
rien
ted,
po
ssib
le f
olia
tion
NoF
ilter
PL
AN
E
L-1
08
32.4
637
.17
5.54
05.
941
3.5
Cle
ar
Not
ori
ente
d,
poss
ible
fol
iatio
n N
oFilt
er
PL
AN
E
L-1
53
32.5
666
.24
1.57
80.
739
2C
lear
N
ot o
rien
ted,
F
IR
148

poss
ible
fol
iatio
n
PL
AN
E
L-1
51
32.9
415
.32
7.67
610
.580
2C
lear
Not
ori
ente
d,
poss
ible
fol
iatio
n.
Atte
nuat
ion.
FI
R
PL
AN
E
L-2
03
33.7
272
.68
0.86
00.
860
3C
lear
N
ot o
rien
ted,
po
ssib
le f
olia
tion
HFI
R
PL
AN
E
L-8
3 34
.83
27.7
9
5.
259
7.92
94
Stro
ng
Not
ori
ente
d,
poss
ible
fol
iatio
n.
Atte
nuat
ion,
tim
e de
lay,
con
duct
or.
NoF
ilter
PL
AN
E
L-2
04
34.8
334
.92
4.04
64.
046
2.8
Cle
ar
Not
ori
ente
d,
poss
ible
fol
iatio
n.
Atte
nuat
ion,
tim
e de
lay,
con
duct
or.
HFI
R
PL
AN
E
L-7
8 36
.58
28.0
7
6.
135
6.13
53.
2C
lear
Not
ori
ente
d,
poss
ible
fol
iatio
n.
Atte
nuat
ion,
tim
e de
lay,
con
duct
or.
NoF
ilter
PL
AN
E
L-8
2 36
.94
30.1
835
416.
010
6.01
03.
2C
lear
Folia
tion.
A
ttenu
atio
n.
Tim
e de
lay.
C
ondu
ctor
. N
earl
y sa
me
as
L-7
8 N
oFil
ter
PL
AN
E
L-1
06
37.2
832
.06
5.89
25.
892
3.2
Stro
ng
Not
ori
ente
d,
poss
ible
fol
iatio
n.
Atte
nuat
ion,
tim
e de
lay,
con
duct
or.
Nea
rly
sam
e as
L
-78
and
L-1
06
NoF
ilte
r
PL
AN
E
L-8
0 37
.546
.23
3.41
33.
062
3.5
clea
r
Not
ori
ente
d,
poss
ible
fol
iatio
n.
Atte
nuat
ion,
tim
e de
lay,
con
duct
or.
NoF
ilter
PL
AN
E
L-1
05
38.7
312
.51
108
4713
.645
10.7
093
Stro
ng
Frac
ture
. Tim
e de
lay,
at
tenu
atio
n.
NoF
ilter
P
LA
NE
L
-74
39.5
529
.66
9043
5.16
66.
042
3C
lear
Fr
actu
re
NoF
ilter
P
LA
NE
L
-84
40.4
331
.58
6723
5.92
35.
923
3.5
Cle
ar
Frac
ture
N
oFilt
er
PL
AN
E
L-7
9 41
.66
16.3
3
11
.489
8.60
23.
5C
lear
N
ot o
rien
ted.
N
oFilt
er
149

Pos
sibl
e fo
liatio
n.
PL
AN
E
L-1
44
41.8
130
.46
4.25
34.
253
2.5
Cle
ar
Not
ori
ente
d.
Pos
sibl
e fo
liatio
n.
FIR
P
LA
NE
L
-71
41.8
923
.75
120
464.
516
6.36
42.
5C
lear
Fo
liatio
n N
oFilt
er
PL
AN
E
L-6
9 42
.07
40.6
2
2.
973
4.51
22.
5St
rong
Not
ori
ente
d.
Pos
sibl
e fo
liatio
n.
NoF
ilter
PL
AN
E
L-2
02
43.9
572
.87
261
801.
003
1.00
33.
2St
rong
Frac
ture
. A
ttenu
atio
n, ti
me
dela
y, c
ondu
ctor
. H
FIR
P
LA
NE
L
-67
46.0
823
.65
7736
9.13
09.
130
2.5
Cle
ar
Frac
ture
N
oFilt
er
PL
AN
E
L-8
1 46
.29
15.8
5
6.
688
6.68
83
Cle
ar
Not
ori
ente
d.
Pos
sibl
e fo
liatio
n.
NoF
ilter
P
LA
NE
L
-77
46.7
38.8
72
873.
841
3.84
13
Wea
k Fr
actu
re
NoF
ilter
P
LA
NE
L
-73
47.0
326
.15
6.24
16.
241
3C
lear
N
ot o
rien
ted
NoF
ilter
P
LA
NE
L
-60
49.2
122
.11
9941
9.23
49.
234
3.5
Stro
ng
Folia
tion
NoF
ilter
P
LA
NE
L
-142
49
.72
36.0
4
4.
807
4.80
73.
5C
lear
N
ot o
rien
ted
FIR
PL
AN
E
L-7
6 50
.42
37.9
417
773
3.08
93.
089
3.5
wea
k
Frac
ture
. A
ttenu
atio
n, ti
me
dela
y.
NoF
ilter
P
LA
NE
L
-70
50.6
928
.34
7.00
57.
005
4C
lear
N
ot o
rien
ted
NoF
ilter
PL
AN
E
L-6
3 51
.64
44.7
975
484.
577
4.57
74.
5C
lear
Folia
tion.
C
ondu
ctor
, at
tenu
atio
n, ti
me
dela
y.
NoF
ilter
PL
AN
E
L-1
43
52.6
738
.22
6236
4.67
13.
876
4C
lear
Frac
ture
. A
ttenu
atio
n, ti
me
dela
y.
FIR
PL
AN
E
L-7
2 52
.716
.78
11.4
6312
.422
3.5
Cle
ar
Not
ori
ente
d.
Atte
nuat
ion.
T
ime
dela
y.
NoF
ilter
PL
AN
E
L-7
5 53
.07
23.4
387
308.
224
8.22
43
Cle
ar
Folia
tion.
A
ttenu
atio
n.
Tim
e de
lay.
N
oFil
ter
PL
AN
E
L-6
5 53
.24
38.1
5
5.
468
3.88
03.
5C
lear
Not
ori
ente
d.
Pos
sibl
e fo
liatio
n.
NoF
ilter
150

PL
AN
E
L-1
57
53.3
350
.27
2.82
92.
829
3.5
Cle
ar
Not
ori
ente
d.
Pos
sibl
e fo
liatio
n.
FIR
P
LA
NE
L
-212
54
.69
48.2
980
703.
283
3.28
33.
5
Folia
tion
AG
C
PL
AN
E
L-6
4 55
.63
35.9
810
749
4.81
14.
811
3.5
Cle
ar
Folia
tion
NoF
ilter
PL
AN
E
L-2
01
55.6
970
.36
0.97
10.
971
3C
lear
Not
ori
ente
d.
Pos
sibl
e fo
liatio
n.
HFI
R
PL
AN
E
L-2
00
56.4
155
.57
2.21
52.
215
3C
lear
Not
ori
ente
d.
Pos
sibl
e fo
liatio
n.
HFI
R
PL
AN
E
L-5
5 56
.48
25.5
816
975
6.27
17.
179
3St
rong
Frac
ture
. A
ttenu
atio
n, ti
me
dela
y.
NoF
ilter
PL
AN
E
L-1
99
56.9
257
.91
8869
2.08
12.
081
3C
lear
Frac
ture
. A
ttenu
atio
n.
Tim
e de
lay.
C
ondu
ctor
. H
FIR
PL
AN
E
L-5
9 58
.05
22.6
5
9.
198
5.95
23.
8
Not
ori
ente
d.
Pos
sibl
e fo
liatio
n.
NoF
ilter
PL
AN
E
L-1
97
58.2
65.8
7766
1.60
61.
606
3.3
Cle
ar
Folia
tion.
A
ttenu
atio
n.
HFI
R
PL
AN
E
L-6
6 58
.41
40.1
819
234.
156
4.15
63.
5C
lear
Fr
actu
re.
Atte
nuat
ion.
N
oFilt
er
PL
AN
E
L-6
1 59
.222
.510
579
6.42
45.
492
2.8
Stro
ng
Folia
tion
NoF
ilter
P
LA
NE
L
-56
59.7
234
.11
7868
4.50
44.
504
3.5
Cle
ar
Frac
ture
N
oFilt
er
PL
AN
E
L-5
7 60
.67
45.2
794
324.
184
2.75
73
Stro
ng
Frac
ture
N
oFilt
er
PL
AN
E
L-1
39
6225
.03
7438
8.12
15.
387
3.5
Cle
ar
Folia
tion.
A
ttenu
atio
n.
FIR
PL
AN
E
L-1
98
63.2
765
.46
1.62
71.
200
3.5
Cle
ar
Not
ori
ente
d.
Pos
sibl
e fo
liatio
n.
HFI
R
PL
AN
E
L-5
3 64
.61
47.5
488
623.
331
1.95
13.
5C
lear
Fr
actu
re
NoF
ilter
P
LA
NE
L
-58
64.8
922
.81
5517
8.26
29.
187
4C
lear
Fr
actu
re
NoF
ilter
PL
AN
E
L-2
16
64.9
665
.32
2.06
01.
207
3.5
Not
ori
ente
d.
Pos
sibl
e fo
liatio
n.
AG
C
PL
AN
E
L-6
2 64
.99
36.0
985
513.
166
3.16
62
Lon
g Fo
liatio
n N
oFilt
er
PL
AN
E
L-1
11
65.9
665
.55
2.04
21.
621
4C
lear
N
ot o
rien
ted.
N
oFilt
er
151

Atte
nuat
ion,
tim
e de
lay.
Pos
sibl
e fo
liatio
n.
PL
AN
E
L-6
8 66
.43
12.8
8
12
.648
13.6
253
Far,
wea
k
Not
ori
ente
d.
Pos
sibl
e fo
liatio
n.
Con
duct
ive
zone
N
oFilt
er
PL
AN
E
L-5
0 67
.35
23.3
810
629
11.9
098.
227
4.5
Cle
ar, S
tron
g
Folia
tion.
Tim
e de
lay,
at
tenu
atio
n.
Con
duct
or.
NoF
ilter
PL
AN
E
L-5
1 67
.53
18.5
110
629
13.2
5311
.353
4C
lear
, Str
ong
Folia
tion.
Tim
e de
lay,
at
tenu
atio
n.
Con
duct
or.
NoF
ilter
PL
AN
E
L-1
96
68.0
774
.33
5061
1.05
81.
058
3.5
Cle
ar
Frac
ture
. A
ttenu
atio
n.
Tim
e de
lay.
C
ondu
ctor
. H
FIR
PL
AN
E
L-1
95
68.7
957
.67
8466
2.09
52.
095
3.5
Stro
ng
Frac
ture
. A
ttenu
atio
n.
Tim
e de
lay.
C
ondu
ctor
. H
FIR
PL
AN
E
L-1
13
68.9
948
.12
2.61
52.
615
3.5
Cle
ar
Not
ori
ente
d.
Tim
e de
lay.
C
ondu
ctor
. A
ttenu
atio
n. N
ear
sim
ilar
to L
_195
N
oFilt
er
PL
AN
E
L-5
4 69
.31
19.3
5
14
.132
13.1
874.
5V
ery
Stro
ng
Not
ori
ente
d.
Tim
e de
lay.
C
ondu
ctor
. A
ttenu
atio
n.
NoF
ilter
PL
AN
E
L-2
13
69.3
161
.2
1.
887
1.88
73.
5
Not
ori
ente
d.
Tim
e de
lay.
C
ondu
ctor
. A
ttenu
atio
n. N
o Fr
acts
A
GC
PL
AN
E
L-2
14
69.9
65.0
172
701.
655
1.65
53.
5
Frac
ture
. A
ttenu
atio
n.
Tim
e de
lay.
C
ondu
ctor
. A
GC
152

PL
AN
E
L-1
10
70.4
547
.51
3.33
33.
333
3.5
clea
r. f
ar
Not
ori
ente
d N
oFil
ter
PL
AN
E
L-5
2 71
.34
55.6
7
2.
783
2.78
33.
5St
rong
. C
lear
N
ot o
rien
ted
NoF
ilter
P
LA
NE
L
-109
71
.36
12.6
20.4
7915
.595
4.5
farU
p N
ot o
rien
ted
NoF
ilter
PL
AN
E
L-1
16
73.2
938
.76
9359
5.42
26.
206
4C
lear
Frac
ture
. Del
ay.
Con
duct
or. N
o gr
eat a
ttenu
atio
n (m
afic
vei
n?)
NoF
ilter
P
LA
NE
L
-141
73
.38
21
16
.787
7.89
95
Far
Not
ori
ente
d FI
R
PL
AN
E
L-1
12
75.2
30.0
5
6.
889
5.58
23.
5C
lear
Not
ori
ente
d.
Atte
nuat
ion,
tim
e de
lay,
con
duct
or.
NoF
ilter
PL
AN
E
L-4
7 75
.39
42.8
4
3.
246
2.49
74.
5St
rong
Not
ori
ente
d.
Atte
nuat
ion,
tim
e de
lay,
con
duct
or.
NoF
ilter
PL
AN
E
L-4
9 76
.47
43.8
5
5.
014
2.08
45
Cle
ar
Not
ori
ente
d.
Tim
e de
lay,
co
nduc
tor.
No
att.
NoF
ilter
PL
AN
E
L-1
94
76.7
472
.3
1.
191
1.19
13.
5St
rong
Not
ori
ente
d.
Atte
nuat
ion,
tim
e de
lay,
con
duct
or.
Low
er c
onta
ct o
f G
R.
HFI
R
PL
AN
E
L-1
40
77.3
642
.58
4.37
72.
884
4W
eak
Not
ori
ente
d.
Atte
nuat
ion,
co
nduc
tor,
tim
e de
lay.
FI
R
PL
AN
E
L-4
8 79
.87
27.4
9
8.
842
7.06
04.
5St
rong
Not
ori
ente
d.
Pos
sibl
e fo
liatio
n.
NoF
ilter
PL
AN
E
L-2
15
79.9
939
.89
5.33
52.
217
4
Not
ori
ente
d.
Pos
sibl
e fo
liatio
n.
AG
C
PL
AN
E
L-2
17
81.2
666
.65
1.55
30.
727
3.5
Not
ori
ente
d.
Pos
sibl
e fo
liatio
n.
AG
C
PL
AN
E
L-4
6 81
.44
35.5
8
5.
245
5.65
53.
5St
rong
Not
ori
ente
d.
Pos
sibl
e fo
liatio
n.
NoF
ilter
P
LA
NE
L
-192
81
.64
49.1
628
513.
227
3.22
73.
5St
rong
Fr
actu
re
HFI
R
153

PL
AN
E
L-1
93
82.8
769
.53
1.72
51.
725
4.5
Stro
ng
Not
ori
ente
d.
Stro
ng c
ondu
ctor
, co
mpl
ete
atte
nuat
ion,
tim
e de
lay.
H
FIR
PL
AN
E
L-1
15
83.0
812
.31
162
4512
.676
15.6
122.
8
Stro
ng,
wea
ker
dow
nwar
ds
Folia
tion.
Str
ong
cond
ucto
r,
com
plet
e at
tenu
atio
n, ti
me
dela
y.
NoF
ilter
PL
AN
E
L-4
3 83
.13
36.8
5.16
45.
164
3.5
Wea
k
Not
ori
ente
d.
Stro
ng c
ondu
ctor
, co
mpl
ete
atte
nuat
ion,
tim
e de
lay.
N
oFilt
er
PL
AN
E
L-1
88
84.3
339
.73
4.57
24.
572
3.8
Stro
ng
Not
ori
ente
d.
Stro
ng c
ondu
ctor
, co
mpl
ete
atte
nuat
ion,
tim
e de
lay.
Pos
sibl
e fo
liatio
n.
HFI
R
PL
AN
E
L-1
38
84.6
834
.13
103
255.
755
5.75
53.
8St
rong
Folia
tion.
Str
ong
cond
ucto
r,
com
plet
e at
tenu
atio
n, ti
me
dela
y.
FIR
PL
AN
E
L-3
8 85
.61
39.3
298
573.
817
3.81
73.
6St
rong
Fr
actu
re.
Atte
nuat
ion.
N
oFilt
er
PL
AN
E
L-1
91
86.9
443
.01
3040
1.34
25.
084
4.5
clea
r
Folia
tion.
A
ttenu
atio
n.
Tim
e de
lay.
H
FIR
PL
AN
E
L-4
5 87
.86
37.6
1
3.
103
4.70
93.
5C
lear
Not
ori
ente
d.
Pos
sibl
e fo
liatio
n.
NoF
ilter
PL
AN
E
L-1
87
88.1
150
.99
2.14
43.
742
4W
eak
Not
ori
ente
d.
Pos
sibl
e fo
liatio
n.
HFI
R
PL
AN
E
L-4
2 88
.73
33.8
9
3.
675
7.44
05
Cle
ar
Not
ori
ente
d.
Pos
sibl
e fo
liatio
n.
NoF
ilter
P
LA
NE
L
-189
89
.58
61.3
9
2.
363
2.36
34
Stro
ng
Not
ori
ente
d.
HFI
R
154

Pos
sibl
e fo
liatio
n.
PL
AN
E
L-1
83
90.6
664
.91
182
872.
092
1.44
44
Wea
k
Frac
ture
. A
ttenu
atio
n.
Tim
e de
lay.
M
afic
gne
iss.
H
FIR
PL
AN
E
L-3
9 90
.84
28.8
389
205.
208
8.73
24.
5C
lear
Folia
tion.
A
ttenu
atio
n.T
ime
dela
y, m
afic
gn
eiss
. N
oFilt
er
PL
AN
E
L-1
90
91.4
258
.91
3.07
02.
023
5fa
r
Not
ori
ente
d.
Pos
sibl
e fo
liatio
n.
HFI
R
PL
AN
E
L-3
4 91
.59
24.5
952
536.
322
9.06
34
Cle
ar
Folia
tion
NoF
ilter
PL
AN
E
L-1
14
91.6
78.
15
23
.744
19.7
823
Stro
ng
Not
ori
ente
d.
Pos
sibl
e fo
liatio
n.
visi
bili
ty w
eake
r do
wnw
ards
N
oFilt
er
PL
AN
E
L-1
84
91.9
744
.73
4.22
34.
939
5W
eak
Not
ori
ente
d.
Pos
sibl
e fo
liatio
n.
HFI
R
PL
AN
E
L-4
4 92
.09
34.8
7
4.
877
5.70
44.
5C
lear
Not
ori
ente
d.
Pos
sibl
e fo
liatio
n. A
lmos
t sa
me
as L
-184
N
oFil
ter
PL
AN
E
L-1
37
92.3
636
.56
352
506.
393
6.39
34.
5St
orng
Fr
actu
re
FIR
PL
AN
E
L-1
86
92.7
653
.81
3.51
04.
105
5.5
Stro
ng
Not
ori
ente
d.
Atte
nuat
ion.
H
FIR
PL
AN
E
L-4
0 92
.85
23.6
359
387.
293
9.13
34
Cle
ar
Frac
ture
. C
ondu
ctor
. A
ttenu
atio
n.
Tim
e de
lay.
Fr
actu
re g
roup
N
oFilt
er
PL
AN
E
L-1
81
94.3
140
.01
5437
5.32
55.
325
4.5
Cle
ar
Folia
tion.
A
ttenu
atio
n.
Tim
e de
lay.
H
FIR
PL
AN
E
L-1
58
95.1
233
.85
7644
7.44
46.
610
4.5
Cle
ar
Folia
tion.
A
ttenu
atio
n.
FIR
PL
AN
E
L-3
1 96
.43
21.9
8
7.
380
12.0
324.
3ve
ry s
tron
g N
ot o
rien
ted.
A
ttenu
atio
n.
FIR
155

Pos
sibl
e fo
liatio
n.
PL
AN
E
L-3
7 97
.02
30.1
3
8.
620
6.01
35
Cle
ar
Not
ori
ente
d.
Pos
sibl
e fo
liatio
n.
NoF
ilter
PL
AN
E
L-1
85
97.2
754
.36
1.68
42.
283
3W
eak
Not
ori
ente
d.
Pos
sibl
e fo
liatio
n. C
urve
d do
wnw
ards
H
FIR
P
LA
NE
L
-135
97
.75
15.0
511
543
7.68
69.
625
2.5
Stro
ng
Folia
tion
FIR
PL
AN
E
L-4
1 98
.97
27.5
1
9.
730
12.3
965
Cle
ar
Not
ori
ente
d.
Pos
sibl
e fo
liatio
n.
NoF
ilter
P
LA
NE
L
-182
99
.48
49.5
229
693.
533
3.73
04
Cle
ar
Frac
ture
H
FIR
PL
AN
E
L-2
19
100.
57.
86
13
.845
27.7
254
Not
ori
ente
d.
Pos
sibl
e fo
liatio
n.
FIR
+A
GC
PL
AN
E
L-2
9 10
1.09
27.3
690
185.
280
9.74
35
Cle
ar
Folia
tion.
D
ownw
ards
be
tter
seen
fu
rthe
r aw
ay
from
hol
e N
oFilt
er
PL
AN
E
L-1
80
101.
4742
.68
213
624.
370
5.11
14.
5W
eak
Fra
ctur
e H
FIR
PL
AN
E
L-2
3 10
2.33
23.3
311
145
10.9
9410
.073
4.5
Stro
ng
Folia
tion.
A
ttenu
atio
n, ti
me
dela
y, c
ondu
ctor
. N
oFilt
er
PL
AN
E
L-1
34
103.
0331
.63
1441
7.20
47.
632
4.5
Stro
ng
Folia
tion.
A
ttenu
atio
n, ti
me
dela
y, c
ondu
ctor
. FI
R
PL
AN
E
L-1
77
103.
8173
.68
1.52
91.
529
5C
lear
Not
ori
ente
d.
Pos
sibl
e fo
liatio
n,
atte
nuat
ion,
tim
e de
lay,
con
duct
or.
HFI
R
PL
AN
E
L-1
36
104.
0333
.93
3520
7.43
76.
603
5St
rong
Folia
tion.
A
ttenu
atio
n, ti
me
dela
y, c
ondu
ctor
. FI
R
PL
AN
E
L-3
3 10
4.13
29.6
535
206.
042
7.79
04
Cle
ar
Folia
tion.
A
ttenu
atio
n, ti
me
dela
y, c
ondu
ctor
. N
oFilt
er
156

PL
AN
E
L-1
76
104.
361
.01
2.39
12.
391
4.3
Cle
ar
Not
ori
ente
d.
Pos
sibl
e fo
liatio
n,
atte
nuat
ion,
tim
e de
lay,
con
duct
or.
HFI
R
PL
AN
E
L-3
0 10
4.46
22.9
10.1
059.
643
4.5
Cle
ar
Not
ori
ente
d.
Pos
sibl
e fo
liatio
n,
atte
nuat
ion,
tim
e de
lay,
con
duct
or.
NoF
ilter
PL
AN
E
L-3
5 10
5.62
28.6
3
8.
748
8.74
85
Cle
ar
Not
ori
ente
d.
Pos
sibl
e fo
liatio
n,
atte
nuat
ion,
tim
e de
lay,
con
duct
or.
NoF
ilter
PL
AN
E
L-3
6 10
5.89
33.1
711
443
5.82
05.
820
4C
lear
Folia
tion.
A
ttenu
atio
n, ti
me
dela
y, c
ondu
ctor
. N
oFilt
er
PL
AN
E
L-3
2 10
6.7
42.2
5
5.
147
5.14
74.
5St
rong
Not
ori
ente
d.
Pos
sibl
e fo
liatio
n.
NoF
ilter
PL
AN
E
L-1
17
106.
8430
.94
7.68
87.
688
4St
rong
Not
ori
ente
d.
Pos
sibl
e fo
liatio
n.
NoF
ilter
PL
AN
E
L-1
74
108.
4556
.8
3.
255
3.25
55
Cle
ar
Not
ori
ente
d.
Pos
sibl
e fo
liatio
n.
HFI
R
PL
AN
E
L-1
32
108.
5331
.98
128
86.
751
6.75
14
Cle
ar
Frac
ture
. A
ttenu
atio
n.
FIR
PL
AN
E
L-1
75
109.
1749
.22
1833
3.88
33.
883
4.5
Cle
ar
Frac
ture
. Tim
e de
lay
H
FIR
PL
AN
E
L-1
27
110.
2138
.02
235
376.
270
4.68
35
Cle
ar
Frac
ture
. A
ttenu
atio
n.
FIR
PL
AN
E
L-1
78
110.
6749
.26
4.20
93.
220
5Fa
r, c
LE
AR
Not
ori
ente
d.
Pos
sibl
e fo
liatio
n.
HFI
R
PL
AN
E
L-1
79
112.
3440
.71
5.65
23.
355
5Fa
r, c
LE
AR
Not
ori
ente
d.
Pos
sibl
e fo
liatio
n.
HFI
R
PL
AN
E
L-2
18
112.
7254
.94
4.28
32.
250
5N
ot o
rien
ted.
P
ossi
ble
AG
C
157

folia
tion.
Tim
e de
lay,
no
atte
nuat
ion
PL
AN
E
L-2
7 11
3.5
22.6
912
645
11.9
7011
.046
5C
lear
Fo
liatio
n N
oFilt
er
PL
AN
E
L-1
30
113.
8374
.38
1.32
81.
328
5C
lear
Not
ori
ente
d.
Pos
sibl
e fo
liatio
n.
FIR
P
LA
NE
L
-222
11
4.8
11.5
416
231
19.0
8914
.185
4
Folia
tion
FIR
+A
GC
PL
AN
E
L-1
3 11
5.35
14.7
816
231
14.4
8213
.514
4St
rong
Fo
liatio
n N
oFilt
er
PL
AN
E
L-1
28
115.
4648
.3
5.
294
4.96
05.
5C
lear
Not
ori
ente
d.
Pos
sibl
e fo
liatio
n.
FIR
PL
AN
E
L-2
6 11
5.52
33.1
7
7.
503
6.24
14.
5C
lear
Not
ori
ente
d.
Pos
sibl
e fo
liatio
n.
NoF
ilter
PL
AN
E
L-2
4 11
6.05
20.7
5
14
.006
12.1
334.
5L
ong
Stro
ng
Not
ori
ente
d.
Atte
nuat
ion.
P
ossi
ble
folia
tion.
N
oFilt
er
PL
AN
E
L-1
31
116.
4715
.88
15.3
7012
.479
4.5
Stro
ng
Not
ori
ente
d.
Atte
nuat
ion.
P
ossi
ble
folia
tion.
FI
R
PL
AN
E
L-1
5 11
6.84
38.5
818
073
6.22
24.
647
5L
ong
Frac
ture
. C
ondu
ctor
. A
ttenu
atio
n.
NoF
ilter
PL
AN
E
L-2
21
116.
855.
93
11
.908
24.8
532
Not
ori
ente
d.
Atte
nuat
ion.
C
ondu
ctor
. P
ossi
ble
folia
tion.
FI
R+
agc
PL
AN
E
L-2
8 11
7.14
50.1
979
844.
129
3.80
65
Cle
ar
Folia
tion.
A
ttenu
atio
n.
Con
duct
or.
NoF
ilter
PL
AN
E
L-1
9 11
7.86
58.3
272
503.
122
2.59
15
Cle
arU
p Fr
actu
re. T
ime
Del
ay.
NoF
ilter
PL
AN
E
L-1
24
118.
5855
.82
768
3.90
62.
772
5.5
Stro
ng
Frac
ture
. A
ttenu
atio
n.
HFI
R
PL
AN
E
L-1
29
119.
321
.88
13.8
9910
.180
5.5
Far
Not
ori
ente
d.
Pos
sibl
e FI
R
158
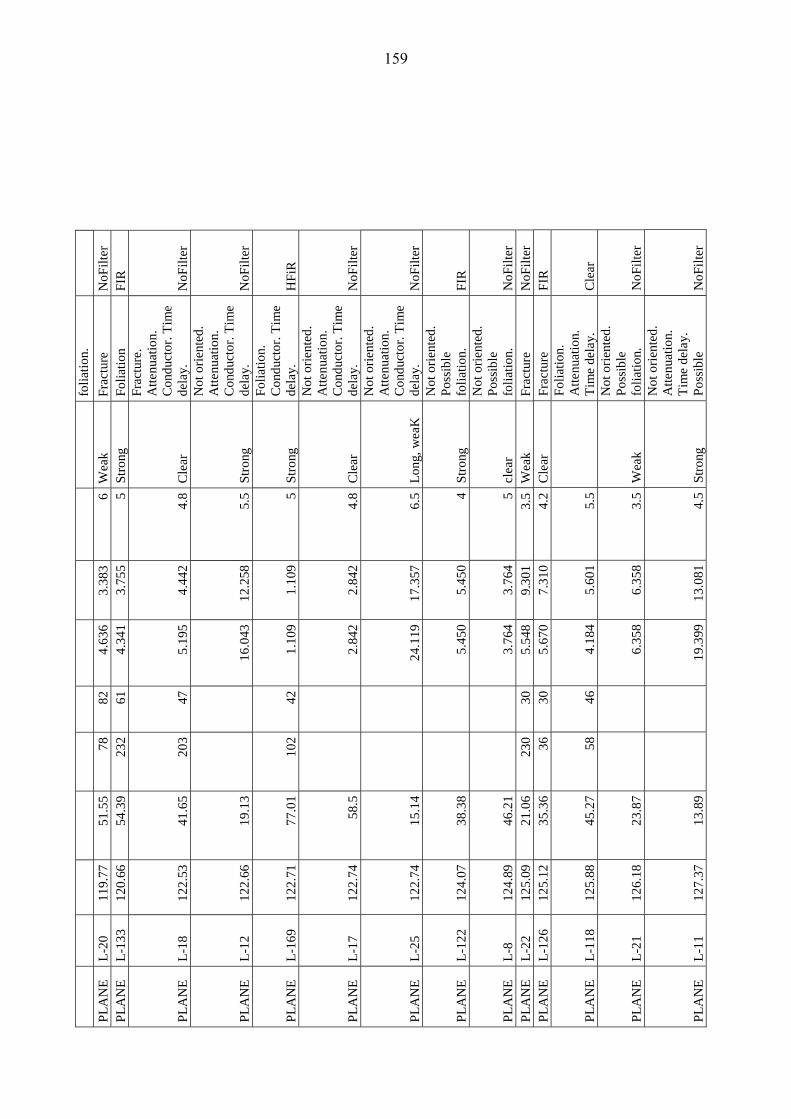
folia
tion.
PL
AN
E
L-2
0 11
9.77
51.5
578
824.
636
3.38
36
Wea
k F
ract
ure
NoF
ilte
r P
LA
NE
L
-133
12
0.66
54.3
923
261
4.34
13.
755
5St
rong
Fo
liatio
n FI
R
PL
AN
E
L-1
8 12
2.53
41.6
520
347
5.19
54.
442
4.8
Cle
ar
Frac
ture
. A
ttenu
atio
n.
Con
duct
or. T
ime
dela
y.
NoF
ilter
PL
AN
E
L-1
2 12
2.66
19.1
3
16
.043
12.2
585.
5St
rong
Not
ori
ente
d.
Atte
nuat
ion.
C
ondu
ctor
. Tim
e de
lay.
N
oFilt
er
PL
AN
E
L-1
69
122.
7177
.01
102
421.
109
1.10
95
Stro
ng
Folia
tion.
C
ondu
ctor
. Tim
e de
lay.
H
FiR
PL
AN
E
L-1
7 12
2.74
58.5
2.84
22.
842
4.8
Cle
ar
Not
ori
ente
d.
Atte
nuat
ion.
C
ondu
ctor
. Tim
e de
lay.
N
oFilt
er
PL
AN
E
L-2
5 12
2.74
15.1
4
24
.119
17.3
576.
5L
ong,
wea
K
Not
ori
ente
d.
Atte
nuat
ion.
C
ondu
ctor
. Tim
e de
lay.
N
oFilt
er
PL
AN
E
L-1
22
124.
0738
.38
5.45
05.
450
4St
rong
Not
ori
ente
d.
Pos
sibl
e fo
liatio
n.
FIR
PL
AN
E
L-8
12
4.89
46.2
1
3.
764
3.76
45
clea
r
Not
ori
ente
d.
Pos
sibl
e fo
liatio
n.
NoF
ilter
P
LA
NE
L
-22
125.
0921
.06
230
305.
548
9.30
13.
5W
eak
Fra
ctur
e N
oFil
ter
PL
AN
E
L-1
26
125.
1235
.36
3630
5.67
07.
310
4.2
Cle
ar
Frac
ture
FI
R
PL
AN
E
L-1
18
125.
8845
.27
5846
4.18
45.
601
5.5
Folia
tion.
A
ttenu
atio
n.
Tim
e de
lay.
C
lear
PL
AN
E
L-2
1 12
6.18
23.8
7
6.
358
6.35
83.
5W
eak
Not
ori
ente
d.
Pos
sibl
e fo
liatio
n.
NoF
ilter
PL
AN
E
L-1
1 12
7.37
13.8
9
19
.399
13.0
814.
5St
rong
Not
ori
ente
d.
Atte
nuat
ion.
T
ime
dela
y.
Pos
sibl
e N
oFilt
er
159

folia
tion.
PL
AN
E
L-1
23
128.
0832
.07
7.59
55.
892
4.5
Stro
ng
Not
ori
ente
d.
Pos
sibl
e fo
liatio
n.
FIR
PL
AN
E
L-1
0 12
8.16
23.7
1
11
.879
10.9
625
long
Not
ori
ente
d.
Pos
sibl
e fo
liatio
n.
NoF
ilter
P
LA
NE
L
-159
12
8.46
37.0
523
550
6.35
26.
352
4.5
Cle
ar
Frac
ture
FI
R
PL
AN
E
L-1
70
128.
8861
.65
2.34
32.
343
4St
rong
Not
ori
ente
d.
Pos
sibl
e fo
liatio
n.
HFI
R
PL
AN
E
L-2
20
129.
16.
41
29
.802
13.8
893.
3
Not
ori
ente
d.
Pos
sibl
e fo
liatio
n.
FIR
+A
GC
PL
AN
E
L-1
71
129.
8150
.22
3.48
13.
157
4St
rong
Not
ori
ente
d.
Pos
sibl
e fo
liatio
n. S
mal
l ti
me
dela
y H
FIR
P
LA
NE
L
-14
129.
9923
.43
9555
10.0
658.
224
4C
lear
F
olia
tion
N
oFil
ter
PL
AN
E
L-1
19
130.
8613
.28
9133
18.4
7511
.652
4C
lear
Fo
liatio
n FI
R
PL
AN
E
L-1
73
131.
3760
.23
2.45
01.
945
4.5
Cle
ar
Not
ori
ente
d.
Pos
sibl
e fo
liatio
n.
HFI
R
PL
AN
E
L-1
68
131.
540
.56
213
506.
046
6.04
64.
5C
lear
Fr
actu
re
HFI
R
PL
AN
E
L-2
13
1.94
21.3
526
454
11.1
5110
.217
4
Frac
ture
. A
ttenu
atio
n.
Tim
e de
lay.
N
oFilt
er
PL
AN
E
L-1
62
132.
7945
.37
355
797.
002
3.46
64.
5St
rong
Fr
actu
re
HFI
R
PL
AN
E
L-7
13
2.88
22.4
9
10
.136
9.20
94
stro
ng
Not
ori
ente
d.
Pos
sibl
e fo
liatio
n.
NoF
ilter
PL
AN
E
L-1
60
133.
1830
.86
8445
5.10
34.
235
4.5
Cle
ar
Folia
tion.
A
ttenu
atio
n.
Tim
e de
lay.
FI
R
PL
AN
E
L-1
72
134.
0150
.74
3646
4.71
83.
762
5.5
Stro
ng
Frac
ture
H
FIR
P
LA
NE
L
-16
134.
2933
.06
6542
7.51
27.
512
5C
lear
F
ract
ure
NoF
ilte
r
PL
AN
E
L-1
21
135.
1319
.37
10.3
497.
508
3.6
Stro
ng
Not
ori
ente
d.
Pos
sibl
e fo
liatio
n.
FIR
P
LA
NE
L
-4
136.
1431
.21
4011
9.38
25.
947
5.5
Stro
ng
Fol
iati
on
NoF
ilte
r
160

PL
AN
E
L-9
13
6.75
33.7
199
318.
291
5.36
55.
5lo
ng
Fol
iati
on
NoF
ilte
r
PL
AN
E
L-6
13
6.76
78.4
5
0.
784
0.78
44
shor
t
Not
ori
ente
d.
Pos
sibl
e fo
liatio
n.
NoF
ilter
P
OIN
T
P-1
13
6.97
0
3.
84St
rong
P
oint
-lik
e re
flec
tor
PL
AN
E
L-1
67
137.
3165
.88
1.60
11.
601
4C
lear
Not
ori
ente
d.
Pos
sibl
e fo
liatio
n.
HFI
R
PL
AN
E
L-1
64
138.
4664
.66
209
601.
677
1.67
74
Stro
ng
Frac
ture
H
FIR
P
LA
NE
L
-161
13
8.72
45.1
266
522.
764
2.76
44
Cle
ar
Frac
ture
FI
R
PL
AN
E
L-1
63
138.
9440
.52
3.75
12.
197
3St
rong
Not
ori
ente
d.
Pos
sibl
e fo
liatio
n.
HFI
R
PL
AN
E
L-5
13
9.12
32.4
711
333
7.56
23.
305
4.5
Folia
tion.
A
ttenu
atio
n.
Tim
e de
lay.
N
oFilt
er
PL
AN
E
L-1
20
140.
6824
.89
9624
12.6
781.
664
6C
lear
Fr
actu
re
FIR
PL
AN
E
L-3
14
2.58
58.6
327
902.
039
0.00
03
Frac
ture
. A
ttenu
atio
n.
Tim
e de
lay.
C
ondu
ctor
. N
oFilt
er
PL
AN
E
L-1
65
142.
8534
.83
233
555.
707
0.00
03.
5St
rong
Frac
ture
. A
ttenu
atio
n.
Tim
e de
lay.
C
ondu
ctor
. H
FOR
PL
AN
E
L-1
66
143.
2957
.26
761
2.44
90.
000
3.6
Stro
ng
Frac
ture
. A
ttenu
atio
n.
Tim
e de
lay.
C
ondu
ctor
. H
FIR
PL
AN
E
L-1
14
5.04
64.2
1
1.
347
0.00
04.
5N
ot o
rien
ted.
Out
of
dep
th r
ange
. N
oFilt
er
PL
AN
E
L-1
25
149.
779.
1
17
.755
0.00
04
Far,
Cle
ar
Not
ori
ente
d. O
ut
of d
epth
ran
ge.
FIR
161
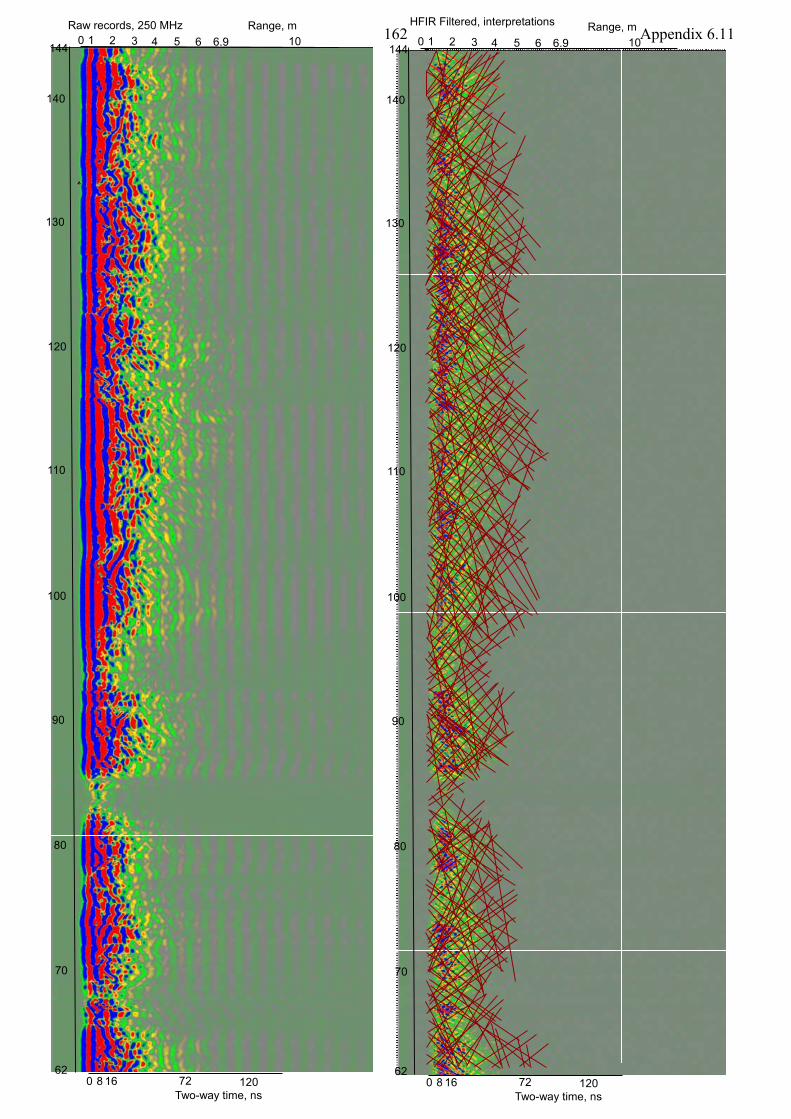
! "#"$ %
162 Appendix 6.11
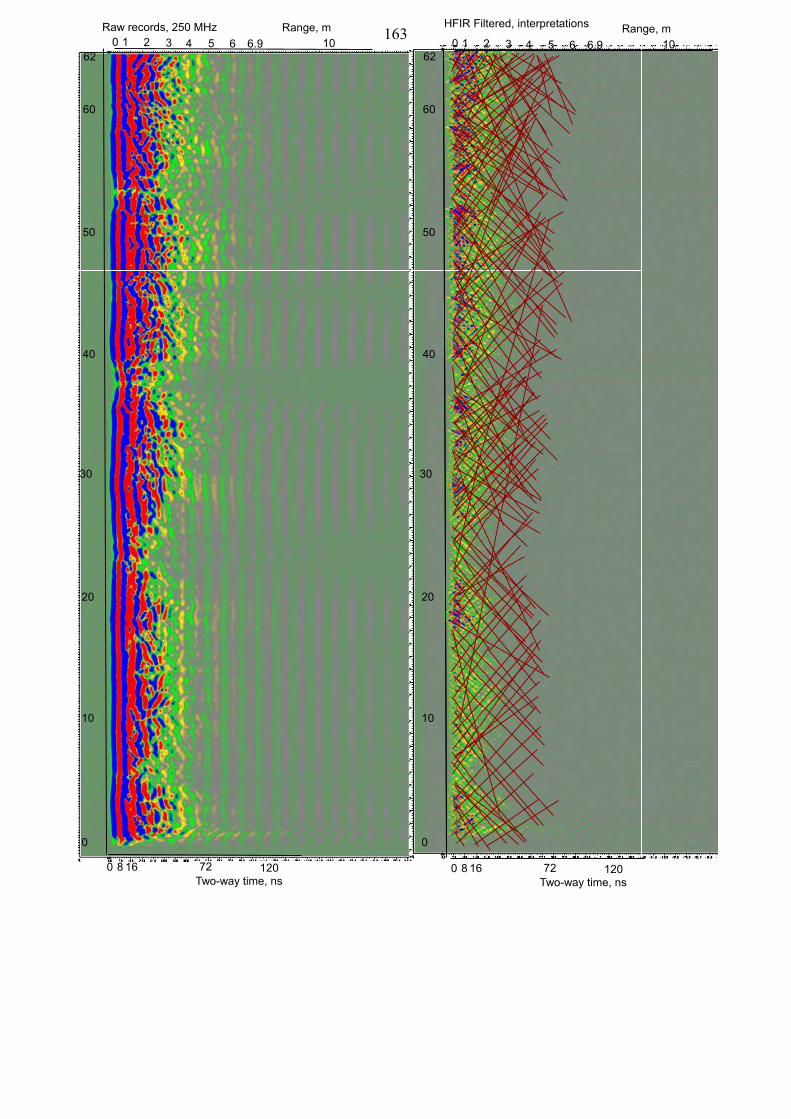
! "#"$ %
163

Aco
ustic
Log
ging
ww
w.s
moy
.fi
Suo
men
Mal
mi O
yP
.O. B
ox 1
0F
I-00
210
ES
PO
O+3
58 9
852
4 01
0
Sit
e:O
lkilu
oto
Dip
:-5.
843
Z:
-59.
976
Su
rvey
ed b
y:A
S, A
K, J
M
Y:
6792
046
.873
X:
1526
126
.618
Rep
ort
ed b
y: J
MP
roje
ct n
o:
Ho
le n
o:O
NK
-PH
03
Su
rvey
dat
e:13
.09.
2005
Clie
nt:
Pos
iva
Oy
Azi
mu
th:2
25.1
355
Len
gth
:144
.91
Ø:
76
Rep
ort
dat
e: S
ept 2
005
Dep
th
1m:5
00m
Tub
ewav
e E
n. R
1
200
2000
00
Tub
ewav
e E
n. R
2
200
2000
00
Tub
ewav
e A
tt.
-40
40dB
/m
Vel
ocity
P 0
.6 m
4000
7000
m/s
Vel
ocity
P 1
m
4000
7000
m/s
App
aren
tQ
110
00
P A
ttenu
atio
n
-100
100
dB
/m
Vel
ocity
S 0
.6 m
2000
5000
m/s
Vel
ocity
S 1
m
2000
5000
m/s
S A
ttenu
atio
n
-200
100
dB
/m
G-G
Den
sity
2.6
3.2
g/c
m3
Poi
sson
's R
atio
00.
5
She
ar M
odul
us (
GP
a)
1060
You
ng's
Mod
ulus
(G
Pa)
4012
0
Bul
k M
odul
us (
GP
a)
090
Tun
nel
pile
(m
)
Lith
.F
r.fr
eq.
015
1/m
Cor
e lo
ss
0.0
5.0
10.0
15.0
20.0
25.0
30.0
700.
0
705.
0
710.
0
715.
0
720.
0
725.
0
Peg
mat
iteP
egm
atiti
cgr
anite
Vei
ned
gnei
ss
Peg
mat
it eP
egm
atiti
cgr
anite
Dia
texi
ticgn
eiss
Peg
mat
it eP
egm
atiti
cgr
anite
Qua
rtz
gnei
ss
Dia
texi
ticgn
eiss
Dia
texi
ticgn
eiss
Peg
mat
it eP
egm
atiti
cgr
anite
164 Appendix 6.12

35.0
40.0
45.0
50.0
55.0
60.0
65.0
70.0
75.0
80.0
85.0
90.0
95.0
100.
0
105.
0
110.
0
730.
0
735.
0
740.
0
745.
0
750.
0
755.
0
760.
0
765.
0
770.
0
775.
0
780.
0
785.
0
790.
0
795.
0
800.
0
805.
0
Dia
texi
ticgn
eiss
Dia
texi
ticgn
eiss
Vei
ned
gnei
ss
Peg
mat
it eP
egm
atiti
cgr
anite
Dia
texi
ticgn
eiss
Peg
mat
it eP
egm
atiti
cgr
anite
Dia
texi
ticgn
eiss
Peg
mat
it eP
egm
atiti
cgr
anite
Dia
texi
ticgn
eiss
Peg
mat
it egr
anite
Dia
texi
ticgn
eiss
Peg
mat
it eP
egm
atiti
cgr
anite
Dia
texi
ticgn
eiss
Peg
mat
it eP
egm
atiti
cgr
anite
Dia
texi
ticgn
eiss
Maf
icgn
eiss
Dia
texi
ticgn
eiss
Peg
mat
it eP
egm
atiti
cgr
anite
Dia
texi
ticgn
eiss
Dia
texi
ticgn
eiss
Dia
texi
tic
165

115.
0
120.
0
125.
0
130.
0
135.
0
140.
0
145.
0
150.
0
810.
0
815.
0
820.
0
825.
0
830.
0
835.
0
840.
0
845.
0
Dia
texi
ticgn
eiss
Dia
texi
ticgn
eiss
Dia
texi
ticgn
eiss
Vei
ned
gnei
ss
Dia
texi
ticgn
eiss
Mic
agn
eiss
Dia
texi
ticgn
eiss
Peg
mat
it eP
egm
atiti
cgr
anite
Mic
agn
eiss
166

Aco
ustic
Log
ging
ww
w.s
moy
.fi
Suo
men
Mal
mi O
yP
.O. B
ox 1
0F
I-00
210
ES
PO
O+3
58 9
852
4 01
0
Sit
e:O
lkilu
oto
Dip
:-5.
843
Z:
-59.
976
Su
rvey
ed b
y:A
S, J
M
Y:
6792
046
.873
X:
1526
126
.618
Rep
ort
ed b
y:JM
Pro
ject
no
:
Ho
le n
o:O
NK
-PH
03
Su
rvey
dat
e:13
.09.
2005
Clie
nt:
Pos
iva
Oy
Azi
mu
th:2
25.1
355
Len
gth
:144
.91
Ø:
76
Rep
ort
dat
e:S
ept.
2005
Dep
th
1m:5
00m
Ful
l Wav
e S
onic
, 0.6
m
020
48µs
Ful
l Wav
e S
onic
, 1 m
020
48µs
Lith
.T
unne
l
pile
(m
)
Vel
ocity
P 0
.6 m
4000
7000
m/s
Vel
ocity
S 0
.6 m
2000
5000
m/s
Fr.
freq
.
015
1/m
Cor
e lo
ss
0.00
5.00
10.0
0
15.0
0
20.0
0
25.0
0
30.0
0
35.0
0
40.0
0
700.
0
705.
0
710.
0
715.
0
720.
0
725.
0
730.
0
735.
0
Peg
mat
iteP
egm
atiti
cgr
anite
Vei
ned
gnei
ss
Peg
mat
it eP
egm
atiti
cgr
anite
Dia
texi
ticgn
eiss
Peg
mat
it eP
egm
atiti
cgr
anite
Qua
rtz
gnei
ss
Dia
texi
ticgn
eiss
Dia
texi
ticgn
eiss
Peg
mat
it eP
egm
atiti
cgr
anite
Dia
texi
ticgn
eiss
Dia
texi
ticgn
eiss
Vei
ned
gnei
ss
Peg
mat
it eP
titi
167 Appendix 6.13
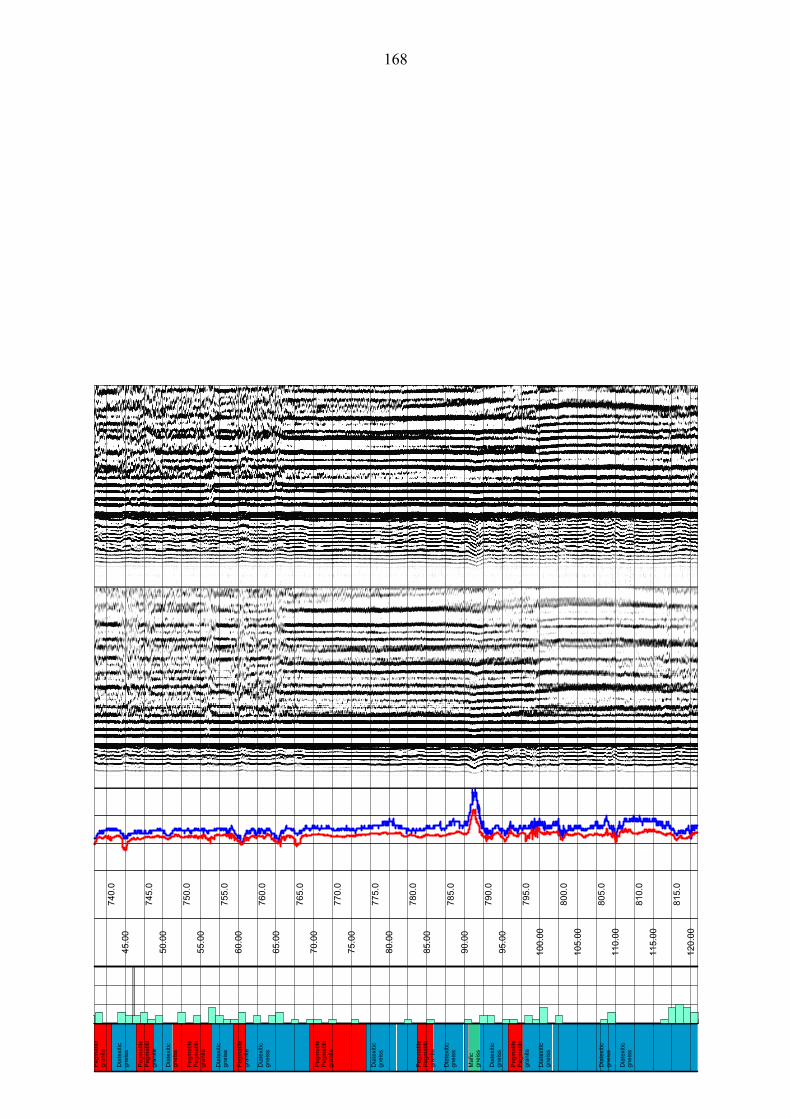
45.0
0
50.0
0
55.0
0
60.0
0
65.0
0
70.0
0
75.0
0
80.0
0
85.0
0
90.0
0
95.0
0
100.
00
105.
00
110.
00
115.
00
120.
00
740.
0
745.
0
750.
0
755.
0
760.
0
765.
0
770.
0
775.
0
780.
0
785.
0
790.
0
795.
0
800.
0
805.
0
810.
0
815.
0
Peg
mat
itic
gran
ite
Dia
texi
ticgn
eiss
Peg
mat
it eP
egm
atiti
cgr
anite
Dia
texi
ticgn
eiss
Peg
mat
it eP
egm
atiti
cgr
anite
Dia
texi
ticgn
eiss
Peg
mat
it egr
anite
Dia
texi
ticgn
eiss
Peg
mat
it eP
egm
atiti
cgr
anite
Dia
texi
ticgn
eiss
Peg
mat
it eP
egm
atiti
cgr
anite
Dia
texi
ticgn
eiss
Maf
icgn
eiss
Dia
texi
ticgn
eiss
Peg
mat
it eP
egm
atiti
cgr
anite
Dia
texi
ticgn
eiss
Dia
texi
ticgn
eiss
Dia
texi
ticgn
eiss
168

125.
00
130.
00
135.
00
140.
00
145.
00
150.
00
820.
0
825.
0
830.
0
835.
0
840.
0
845.
0
Dia
texi
ticgn
eiss
Dia
texi
ticgn
eiss
Vei
ned
gnei
ss
Dia
texi
ticgn
eiss
Mic
agn
eiss
Dia
texi
ticgn
eiss
Peg
mat
it eP
egm
atiti
cgr
anite
Mic
agn
eiss
169

Borehole Imagingwww.smoy.fi
Suomen Malmi OyP.O. Box 10FI-00210 ESPOO+358 9 8524 010
Dip: -5.843
Site: Olkiluoto
Surveyed by: JM, LJ, AS
Z: -59.976
Y: 6792 046.873
X: 1526 126.618
Reported by: JM
Hole no: ONK-PH03
Project no:
Survey date: 13.09.2005
Client: Posiva Oy
Length: 144.91
Azimuth: 225.1355
Report date: Sept 2005
Ø: 76
Depth
1m:2m
ONK-PH03 Image Section 49-100 m
Oriented to High Side (180º = Bottom)
0° 0°180°90° 270°
ONK-PH03 3-D Image
0°
49.00
49.10
49.20
49.30
Results, Example of borehole image(the rest of the images on CD)
170 Appendix 6.14

MUISTIO 1 (3) Appendix 7.1
Hirvonen Hannele
PARAMETERS, ANALYSIS METHODS, LABORATORIES AND ACCURACIES
PARAMETERS METHODS EQUIPMENT DETECTION LIMITS
ACCURACY LABORATORY
pH Posiva water sampling guide ISO-10532 / 1
Orion 550A 0.05 TVO
Conductivity SFS-EN-27888 / 1 Kemetron UPW Tetrametric 331
5 % TVO
Density Posiva water sampling guide /1
AntonPaar DMA 35N
0.001 g/cm3
TVO
Sodium fluorescein fluorometer Shimadzu RF-1501 Spectrofluoro-fotometer
3 µg/L 2 x RSD < 8% TVO
Alkalinity Posiva water sampling guide / 1
Mettler DL 50 0.05 mmol/L 2 x RSD < 10% TVO
Acidity Posiva water sampling guide /1
Mettler DL 50 0.05 mmol/L 2 x RSD < 20% TVO
DOC/DIC SFS-EN 1484 Shimadzu TOC-5000
0.1 mg/L 2 x RSD < 3% TVO
Na FAASSFS 3017
Thermo Elemental Solaar M6 MK2
80 µg/L 2 x RSD < 10% TVO
K FAAS SFS 3017
Thermo Elemental Solaar M6 MK2
2 µg/L 2 x RSD < 10% TVO
Ca FAAS SFS 3018
Thermo Elemental Solaar M6 MK2
20 µg/L 2 x RSD < 10% TVO
Mn GFAAS SFS 5074 SFS 5502
Thermo Elemental Solaar M6 MK2
0.1 µg/L2 x RSD < 10%
TVO
Mg FAAS SFS 3018
Thermo Elemental Solaar M6 MK2
4 µg/L 2 x RSD < 10% TVO
Iron, Fetot Spectrophotometer /1
Shimadzu 1601 UV-VIS
10 µg/L 2 x RSD < 10% TVO
Ferrous iron, Fe2+ Spectrophotometer /1
Shimadzu 1601 UV-VIS
10 µg/L 2 x RSD < 10% TVO
Fe (tot) GFAAS SFS 5074 SFS 5502
Thermo Elemental Solaar M6 MK2
0.2 µg/L 2 x RSD < 10%
TVO
Sr ICP-AES ARL 3250 1 µg/L ± 10% VTT Cl Titration/ Posiva
water sampling guide /1
Mettler DL 50 5 mg/L 2 x RSD < 5% TVO
Br IC, SFS-EN ISO 10304-1
Dionex DX-100 0.5 mg/L 2 x RSD < 8 % TVO
F ISE / Posiva water sampling guide /1
Orion Research 290A
0.1 mg/L 2 x RSD < 10% TVO
171

MUISTIO 2 (3) Appendix 7.1
Hirvonen Hannele
PARAMETERS METHODS EQUIPMENT DETECTION LIMITS
ACCURACY LABORATORY
S2- Spectrophotometer SFS 3038
Shimadzu 1601 UV-VIS
10 µg/L 2 x RSD < 20% TVO
SO4 IC, SFS-EN ISO 10304-1
Dionex DX-100 0.2 mg/L 2 x RSD < 6% TVO
Stot IC, SFS-EN ISO 10304-1
Dionex DX-100 0.2 mg/L 2 x RSD < 6% TVO
PO4 Spectrophotometer SFS-EN 1189
Shimadzu 1601 UV-VIS
30 µg/L 2 x RSD < 7% TVO
NH4 Spectrophotometer SFS 3032
Shimadzu 1601 UV-VIS
2 µg/L 2 x RSD < 8% TVO
Total nitrogen, Ntot SFS 3031 Hitachi U-2000 50 µg/L 15%< 500 µg/L 10%> 500 µg/L
Rauman ympäristö-laboratorio
Nitrate, NO3 SFS 3030 Hitachi U-2000 5 µg/L 15%< 500 µg/L 10% > 500 µg/L
Rauman ympäristö-laboratorio
Nitrite, NO2 SFS 3029 Hitachi U-2000 Rauman ympäristö-laboratorio
3H Electricalenrichment + home made Proportional Gas counter (PGC) detection method
LKB Quantulus 0.2 TU 100±2, 20±0.5 and 1.00±0.10 TU
TheNetherlands
2H MS Finnigan MAT 251
1‰GTK
18O MS Finnigan MAT 251
< 0.1‰ GTK
13C (DIC) MS VG Optima 0.3 pM 0.05‰ Uppsala 14C (DIC) AMS EN-tandem
accelerator + VG Optima
0.1 pM Uppsala
86Sr/87Sr MS Eichrom Sr-spec Ion-exchange resin+ MS: VG Sector 54
0.003‰
GTK
34S (SO4) MS VG MM 602 0.1 mBq/L 0.2‰ Waterloo 18O (SO4) MS/2 VG MM Prism 0.5‰ Waterloo Rn-222 Liquid scintillation
counting / 3 Guardian 1414 5-10% STUK
U(tot) ja U-234/U-238
Alfaspectrometer ASTM D3648-95, 1995
Tennelec TC 256 0.2 mBq/L HYRL
172

MUISTIO 3 (3) Appendix 7.1
Hirvonen Hannele
Laboratories: TVO Teollisuuden Voima Oy VTT VTT Technical Research Centre of Finland. Uppsala Ångströmlab, University of Uppsala, Sweden GTK Geological Survey of Finland Waterloo Environmental Isotope Lab, University of Waterloo, Canada The Netherlands Centre for Isotope Research, The Netherlands STUK Radiation and Nuclear Safety Authority, Finland HYRL University of Helsinki, Department of radiochemistry
References
1 Paaso, N. (toim.), Mäntynen, M., Vepsäläinen, A. ja Laakso, T. 2003. Posivan vesinäytteenoton kenttä-työohje, rev.3, Posiva Työraportti 2003-02.
2 Drimmie, R.J., Heemskerk, A.R. and Johnson, J.C., Tritium analysis. Technical Procedure 1.0, Rev 03. Environmental Isotope Laboratory, 28 p. Depatment of Earth Sciences, university of Waterloo, Canada
3 Salonen L. and Hukkanen H., Advantaged of low-background liquid scintillation alpha- spectrometry and pulse shape analysis in measuring 222Rn, uranium and 226Ra in groundwater samples, Journal of Radioanalytical and Nuclear Chemistry, Vol 226, Nos 1-2, 1997.
173

MUISTIO Appendix 7.2
Hirvonen Hannele
ANALYSIS RESULTS
174

MUISTIO 1 (1) Appendix 7.3
Hirvonen Hannele
OLSO REFERENCE WATER RESULTS
175