Embed Size (px)
Citation preview

Dr. Poonsri Vate-U-LanAssistant Program Director
Ph. D. (eLM)

Measuring Interactivity in aVirtual Learning Environment (VLE)
KULDEEP NAGI
Fulbright Fellow and Faculty
College of Internet Distance Learning (CIDE)
Assumption University, Bangkok, Thailand 10240
Measuring Interactivity in a Virtual Learning Environment (VLE) -A Case Study of
Learning Objects (LOs) in an open-source Learning Management System (LMS)

Measuring Interactivity in aVirtual Learning Environment (VLE)
• Born in India, US citizen
• Lived in Seattle, WA, USA for +25 Years
• Fulbright Fellowship Award – 2006 work at Assumption University
About Me

Measuring Interactivity in aVirtual Learning Environment (VLE)
About Assumption University- Bangkok
CAMPUS
Measuring Interactivity in aVirtual Learning Environment (VLE)
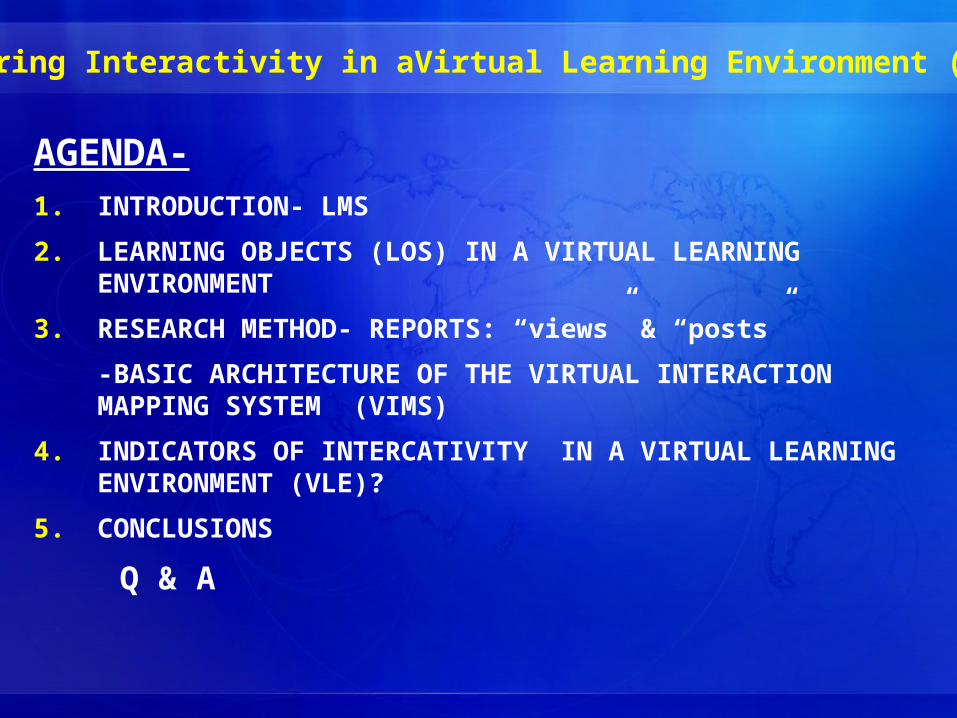
AGENDA-1. INTRODUCTION- LMS
2. LEARNING OBJECTS (LOS) IN A VIRTUAL LEARNING ENVIRONMENT
3. RESEARCH METHOD- REPORTS: “views” & “posts”
-BASIC ARCHITECTURE OF THE VIRTUAL INTERACTION MAPPING SYSTEM (VIMS)
4. INDICATORS OF INTERCATIVITY IN A VIRTUAL LEARNING ENVIRONMENT (VLE)?
5. CONCLUSIONS
Q & A
Measuring Interactivity in aVirtual Learning Environment (VLE)
1.INTRODUCTION• The word Moodle is an acronym for Modular Object-Oriented Dynamic Learning Environment; Moodle is a license free open-source software platform. • Development of this eLearning platform is undertaken by a globally diffused network of commercial and non-commercial users, spearheaded by the company based in Perth, Western Australia • This Virtual learning environment (VLE) is an integrated software system designed to enable eTrainers and students in the management and administration of educational content• In a VLE, such as Moodle a learning object (LO) is usually defined as any entity, digital or non-digital that may be used for learning, education or training. It is also called as web-based interactive chunks or parts of eTraining courseware designed to explain a stand-alone learning objective. • In Moodle the “Reports” is a tool provided in its menu that could be very useful in gauging the level of interactivity between the learning objects (LOs) and students during the delivery of a eLeaning courseware.
Measuring Interactivity in aVirtual Learning Environment (VLE)
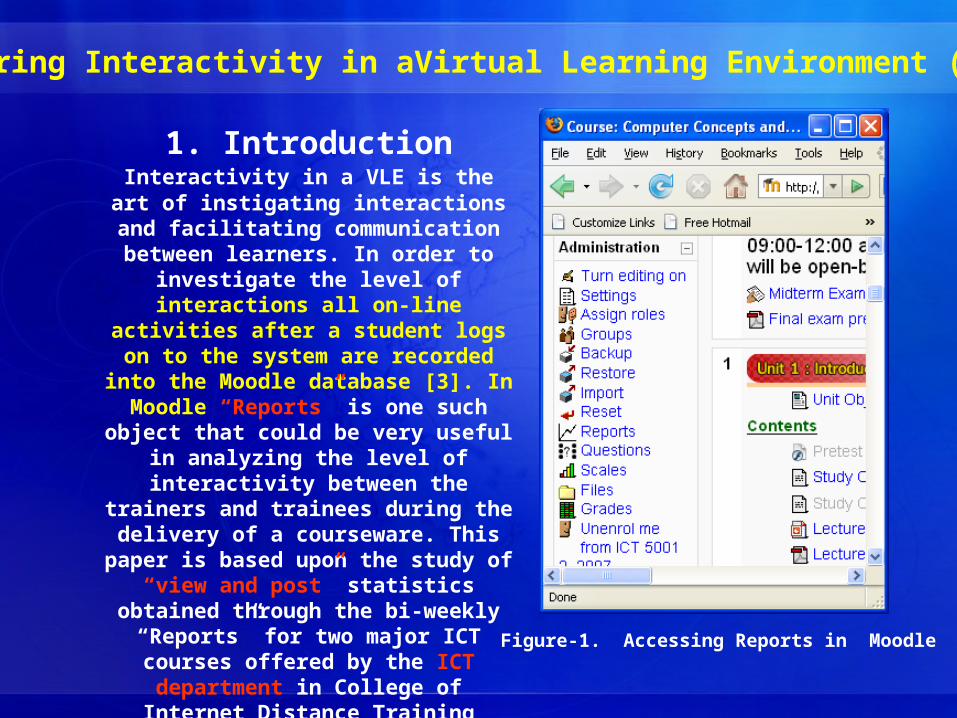
1. IntroductionInteractivity in a VLE is the art of
instigating interactions and facilitating communication
between learners. In order to investigate the level of
interactions all on-line activities after a student logs on to the system are recorded into the
Moodle database [3]. In Moodle “Reports” is one such object that could be very useful in analyzing the level of interactivity between the trainers and trainees during
the delivery of a courseware. This paper is based upon the study of
“view and post” statistics obtained through the bi-weekly
“Reports” for two major ICT courses offered by the ICT
department in College of Internet Distance Training (CIDE), Assumption University of
Thailand.
Figure-1. Accessing Reports in Moodle
Measuring Interactivity in aVirtual Learning Environment (VLE)
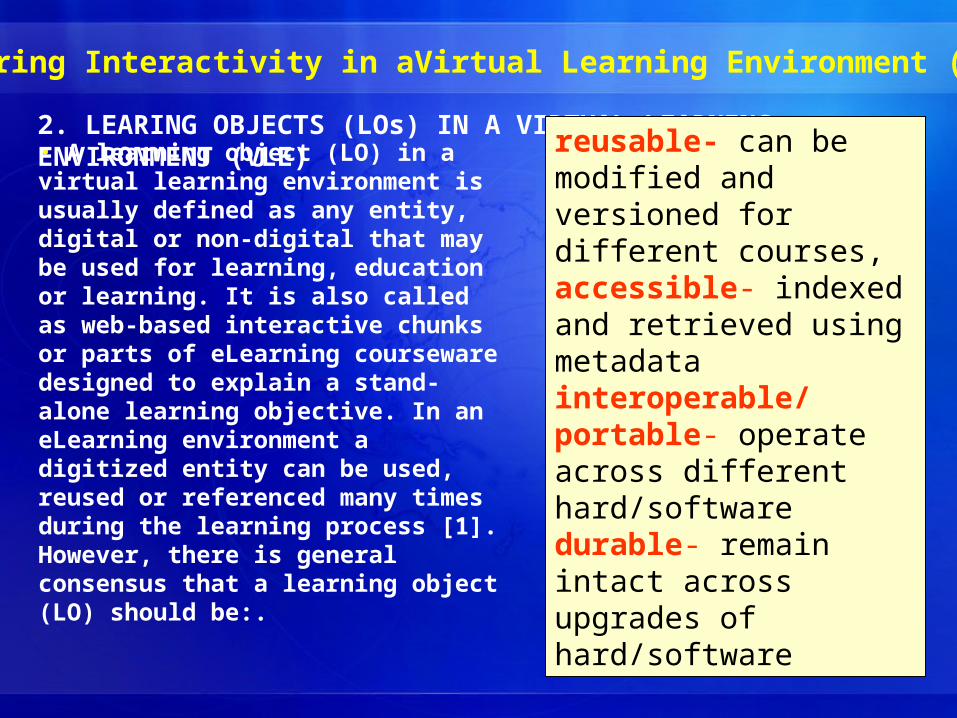
• A learning object (LO) in a virtual learning environment is usually defined as any entity, digital or non-digital that may be used for learning, education or learning. It is also called as web-based interactive chunks or parts of eLearning courseware designed to explain a stand-alone learning objective. In an eLearning environment a digitized entity can be used, reused or referenced many times during the learning process [1]. However, there is general consensus that a learning object (LO) should be:.
2. LEARING OBJECTS (LOs) IN A VIRTUAL LEARNING ENVIRONMENT (VLE) reusable- can be
modified and versioned for different courses, accessible- indexed and retrieved using metadata interoperable/ portable- operate across different hard/software durable- remain intact across upgrades of hard/software
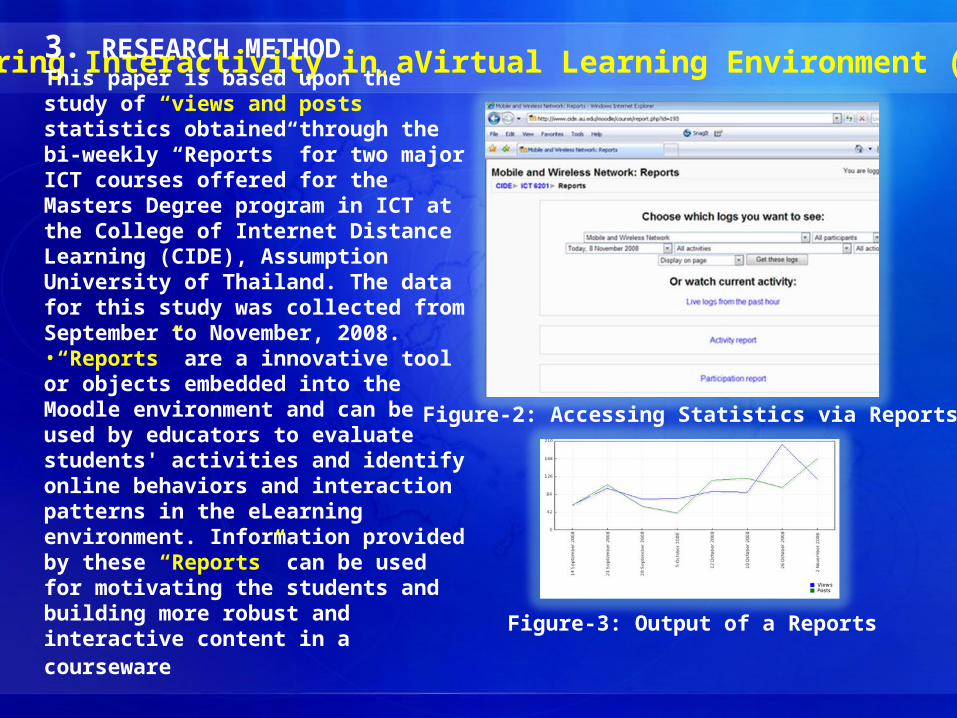
Measuring Interactivity in aVirtual Learning Environment (VLE) 3. RESEARCH METHODThis paper is based upon the study of “views and posts” statistics obtained through the bi-weekly “Reports” for two major ICT courses offered for the Masters Degree program in ICT at the College of Internet Distance Learning (CIDE), Assumption University of Thailand. The data for this study was collected from September to November, 2008. •“Reports” are a innovative tool or objects embedded into the Moodle environment and can be used by educators to evaluate students' activities and identify online behaviors and interaction patterns in the eLearning environment. Information provided by these “Reports” can be used for motivating the students and building more robust and interactive content in a courseware
Figure-2: Accessing Statistics via Reports
Figure-3: Output of a Reports
Measuring Interactivity in aVirtual Learning Environment (VLE)
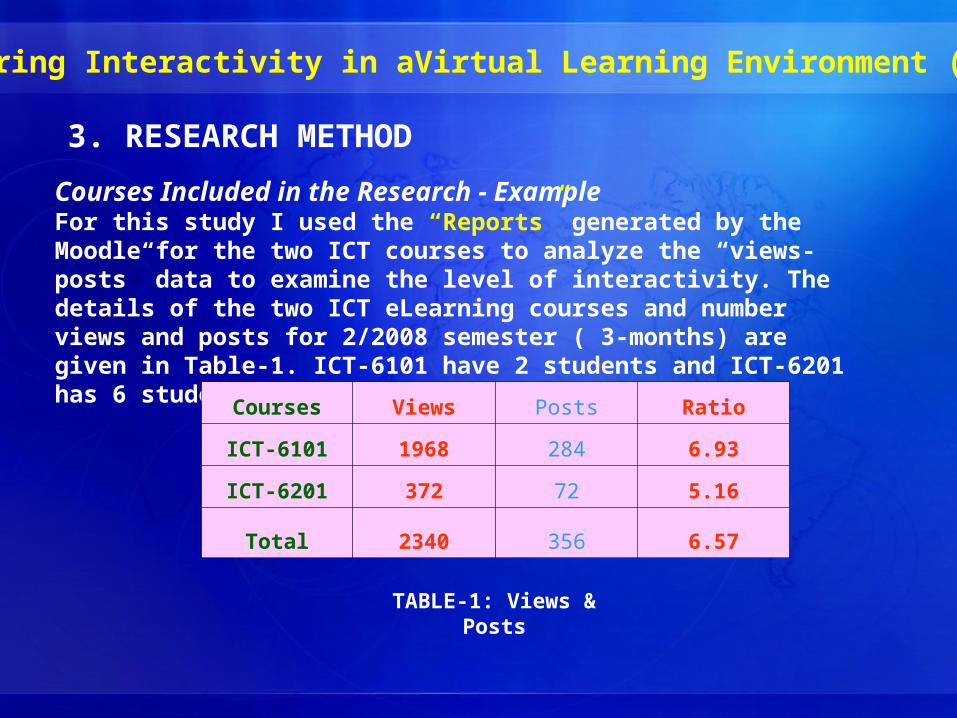
3. RESEARCH METHODCourses Included in the Research - Example
For this study I used the “Reports” generated by the Moodle for the two ICT courses to analyze the “views-posts” data to examine the level of interactivity. The details of the two ICT eLearning courses and number views and posts for 2/2008 semester ( 3-months) are given in Table-1. ICT-6101 have 2 students and ICT-6201 has 6 students.
TABLE-1: Views & Posts
Courses Views Posts Ratio
ICT-6101 1968 284 6.93
ICT-6201 372 72 5.16
Total 2340 356 6.57
Measuring Interactivity in aVirtual Learning Environment (VLE)
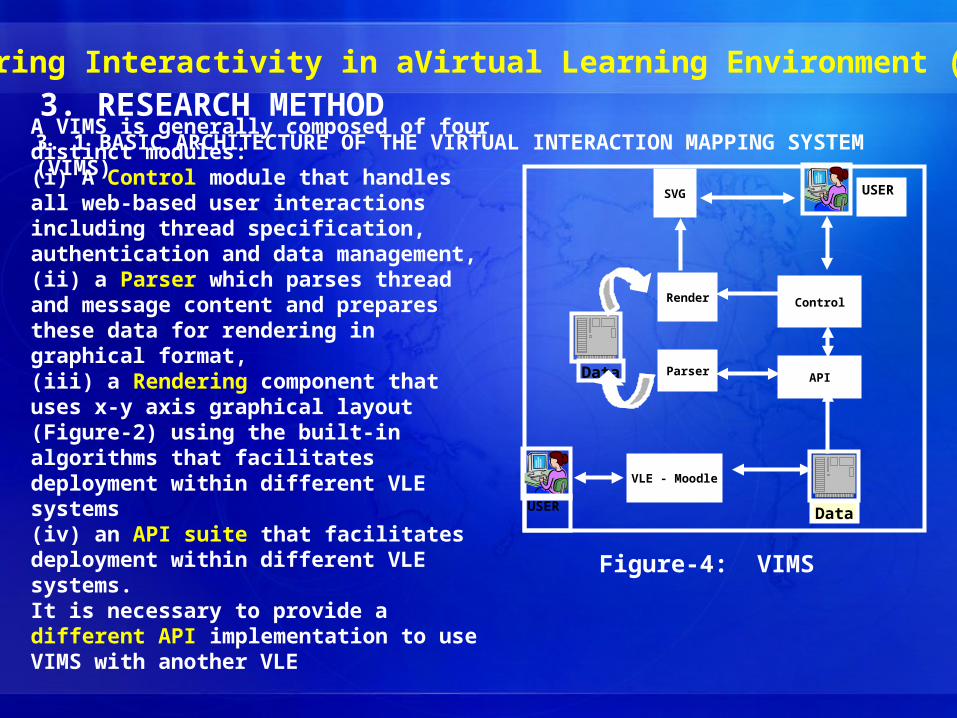
A VIMS is generally composed of four distinct modules: (i) A Control module that handles all web-based user interactions including thread specification, authentication and data management, (ii) a Parser which parses thread and message content and prepares these data for rendering in graphical format, (iii) a Rendering component that uses x-y axis graphical layout (Figure-2) using the built-in algorithms that facilitates deployment within different VLE systems (iv) an API suite that facilitates deployment within different VLE systems.It is necessary to provide a different API implementation to use VIMS with another VLE
3. 1 BASIC ARCHITECTURE OF THE VIRTUAL INTERACTION MAPPING SYSTEM (VIMS)
Render
Parser API
Control
VLE - Moodle
SVG
Data
Data
USER
USER
Figure-4: VIMS
3. RESEARCH METHOD
Measuring Interactivity in aVirtual Learning Environment (VLE)
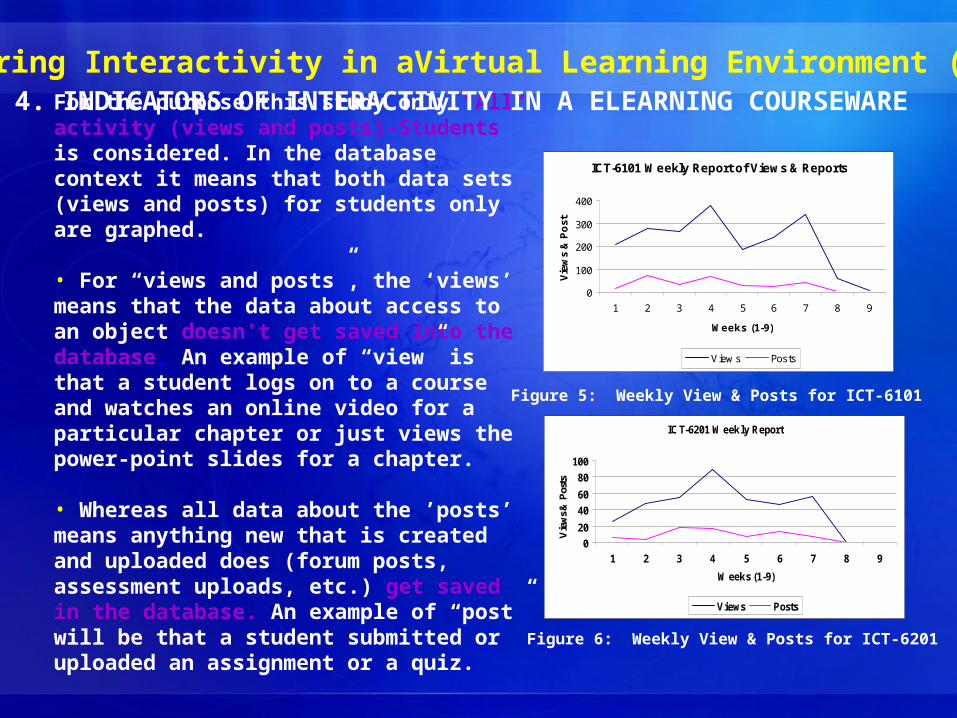
For the purpose this study only “All activity (views and posts)-Students” is considered. In the database context it means that both data sets (views and posts) for students only are graphed.
• For “views and posts”, the ‘views’ means that the data about access to an object doesn't get saved into the database, An example of “view” is that a student logs on to a course and watches an online video for a particular chapter or just views the power-point slides for a chapter.
• Whereas all data about the ’posts’ means anything new that is created and uploaded does (forum posts, assessment uploads, etc.) get saved in the database. An example of “post” will be that a student submitted or uploaded an assignment or a quiz.
Figure 5: Weekly View & Posts for ICT-6101
ICT-6101 Weekly Report of Views & Reports
0
100
200
300
400
1 2 3 4 5 6 7 8 9
Weeks (1-9)
Vie
ws
& P
ost
View s Posts
Figure 6: Weekly View & Posts for ICT-6201
ICT-6201 Weekly Report
0
20
40
60
80
100
1 2 3 4 5 6 7 8 9
Weeks (1-9)V
iew
s &
Pos
ts
Views Posts
4. INDICATORS OF INTERACTIVITY IN A ELEARNING COURSEWARE

Measuring Interactivity in aVirtual Learning Environment (VLE) • Pedagogical studies in eLearning have revealed that a meaningful and effective interaction with courseware learning objects (LOs) in a VLE system enhances the learning experiences. • During interaction the learner analyses, describes and evaluates the objects and at the same time clarifies and inquires if the content contained in the object is understandable and usable. • Research has also shown that more of knowledge sharing, collaboration and community building occurs in learner-to-learner communication rather than instructor centered communication .
Figure-7: Ratio of Views to Posts
• The Moodle “Reports” containing data of “views and posts” can help visualization of the activities in a way to assists the instructors to understand at a glance, several important indicators without any further investigation or research.
Weekly Report for 2 Courses
0
100
200
300
400
1 2 3 4 5 6 7 8 9
Weeks (1-9)
Weeks ICT-6101 Views ICT-6101 Posts ICT-6201 Views ICT-6201 Posts
4. INDICATORS OF INTERACTIVITY IN A ELEARNING COURSEWARE
Measuring Interactivity in aVirtual Learning Environment (VLE)
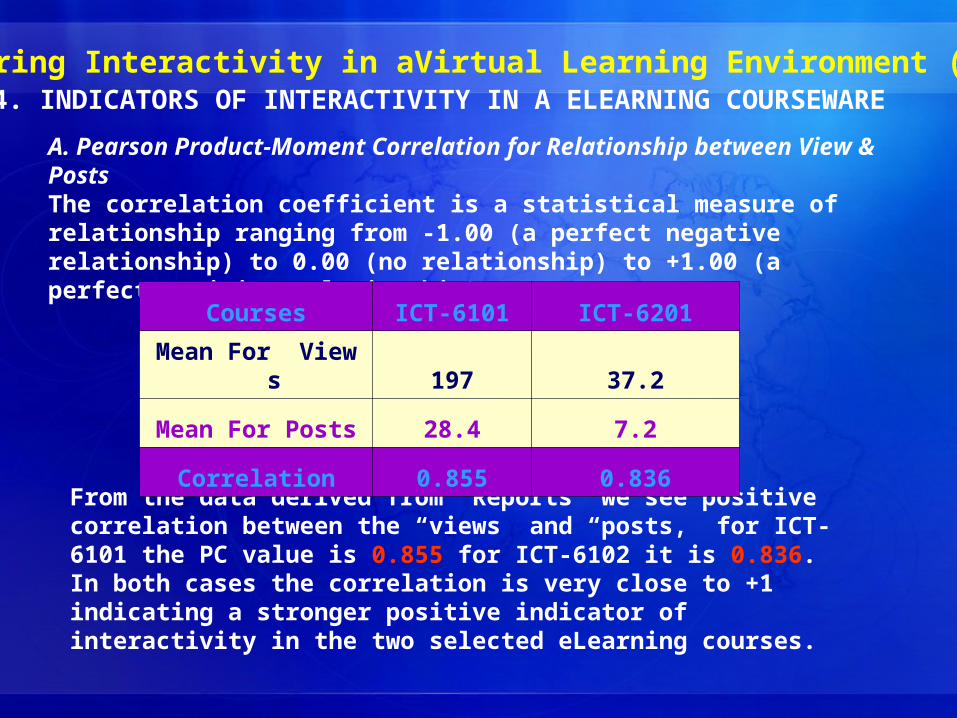
A. Pearson Product-Moment Correlation for Relationship between View & Posts The correlation coefficient is a statistical measure of relationship ranging from -1.00 (a perfect negative relationship) to 0.00 (no relationship) to +1.00 (a perfect positive relationship).
From the data derived from “Reports” we see positive correlation between the “views” and “posts,” for ICT-6101 the PC value is 0.855 for ICT-6102 it is 0.836. In both cases the correlation is very close to +1 indicating a stronger positive indicator of interactivity in the two selected eLearning courses.
Courses-ICT 6 101 -6201ICT
Mean For Views 197 3 7 .2
Mean For Posts 28.4 7 2.
Correlation 0855 0836.
4. INDICATORS OF INTERACTIVITY IN A ELEARNING COURSEWARE
Measuring Interactivity in aVirtual Learning Environment (VLE)
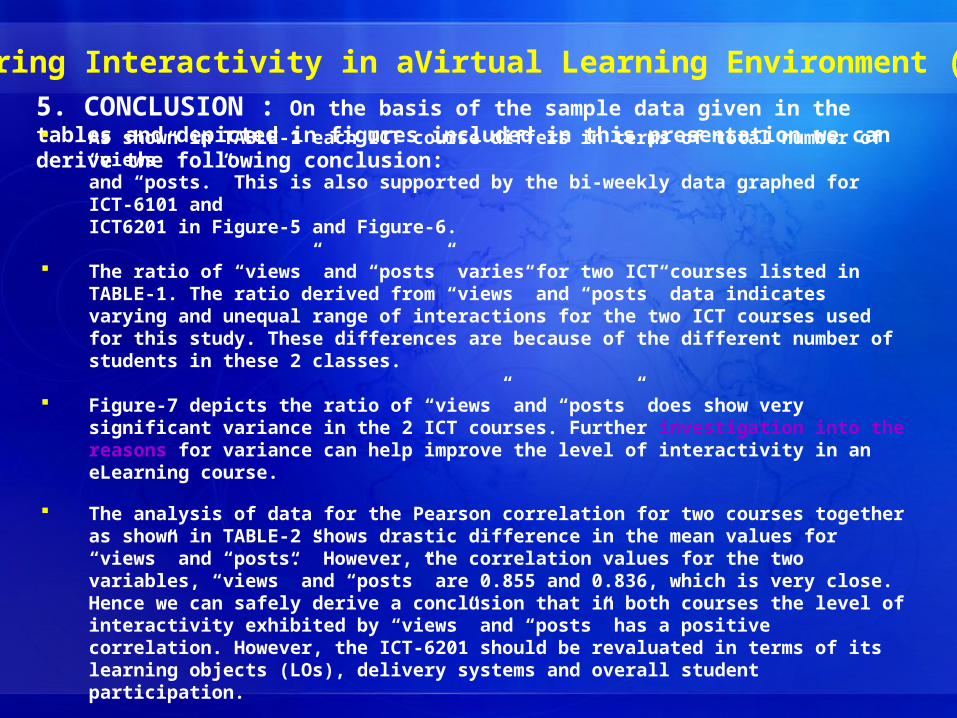
5. CONCLUSION : On the basis of the sample data given in the tables and depicted in figures included in this presentation we can derive the following conclusion: As shown in TABLE-1 each ICT course differs in terms of total number of
“views” and “posts.” This is also supported by the bi-weekly data graphed for ICT-6101 and ICT6201 in Figure-5 and Figure-6.
The ratio of “views” and “posts” varies for two ICT courses listed in TABLE-1. The ratio derived from “views” and “posts” data indicates varying and unequal range of interactions for the two ICT courses used for this study. These differences are because of the different number of students in these 2 classes.
Figure-7 depicts the ratio of “views” and “posts” does show very significant variance in the 2 ICT courses. Further investigation into the reasons for variance can help improve the level of interactivity in an eLearning course.
The analysis of data for the Pearson correlation for two courses together as shown in TABLE-2 shows drastic difference in the mean values for “views” and “posts.” However, the correlation values for the two variables, “views” and “posts” are 0.855 and 0.836, which is very close. Hence we can safely derive a conclusion that in both courses the level of interactivity exhibited by “views” and “posts” has a positive correlation. However, the ICT-6201 should be revaluated in terms of its learning objects (LOs), delivery systems and overall student participation.
Measuring Interactivity in aVirtual Learning Environment (VLE)
5. CONCLUSIONS• In the current version of Moodle 1.8 released in 2007 the “Reports” tool is basically course centric. In other words, each eLearning course has to be examined individually for all the data sets pertaining to all the “views and posts” for students, teachers and Administrators in a ICT program.
• Going forward it may be possible that the new release of Moodle will have added code to do some sort of ranking of “Reports” using data of “views” and “posts” ratios and combining it with other relevant indicators to create a list, such as Top-10 most participatory or interactive eLearning courses in a program

Questions&
Answers

Thank You
College of Internet Distance Education
(CIDE)Assumption University
Thailand, Bangkok