Embed Size (px)
Citation preview
Domestic Transportation Systems
Dr. John Vande Vate
Supply Chain Models: Logistics
Outline
The big picture
Carriers: TL & LTL
Inland Waterways and Intercoastal Waterways
Railroads
Air cargo
Shippers: Send goods
Consignee Receives the goods
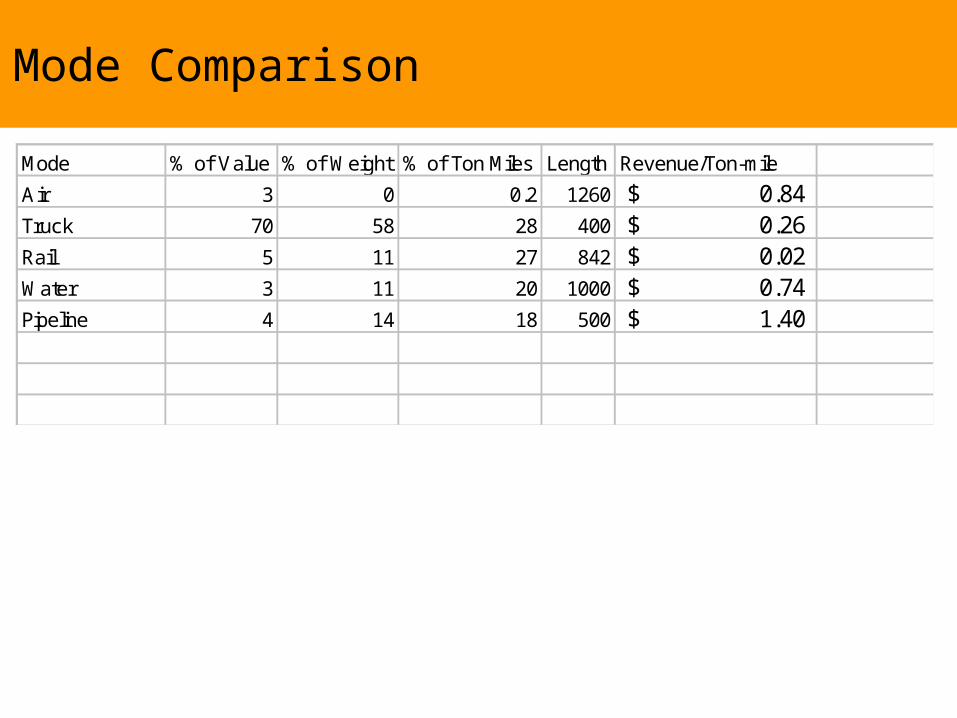
Mode Comparison
Mode % of Value % of Weight % of Ton Miles Length Revenue/Ton-mile
Air 3 0 0.2 1260 0.84$ Truck 70 58 28 400 0.26$ Rail 5 11 27 842 0.02$ Water 3 11 20 1000 0.74$ Pipeline 4 14 18 500 1.40$
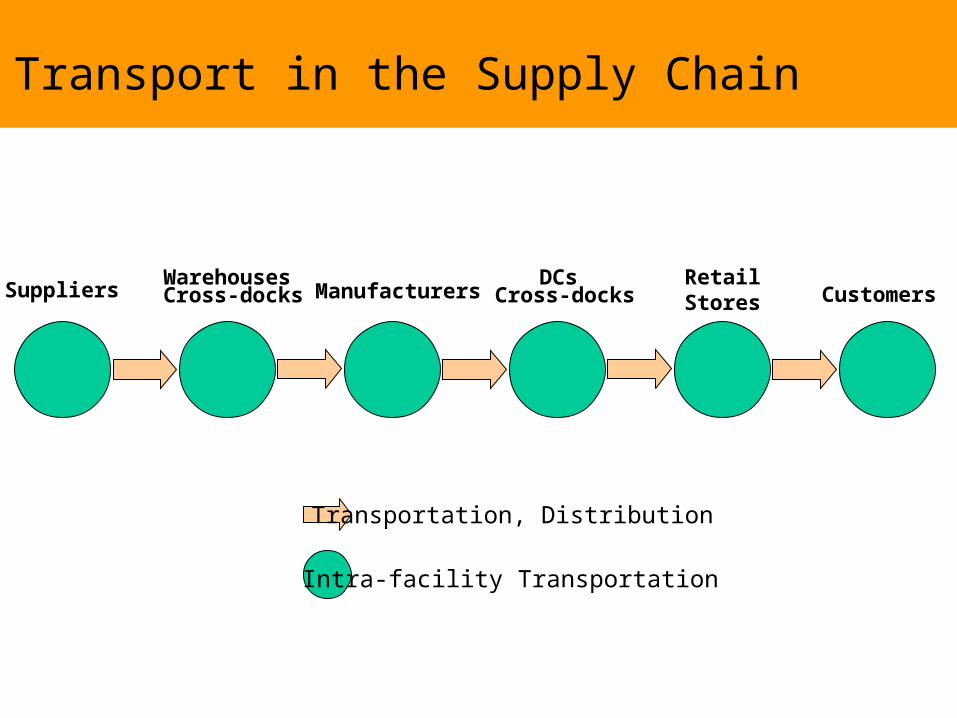
SuppliersWarehouses Cross-docks Manufacturers
DCs Cross-docks Customers
RetailStores
Transport in the Supply Chain
Intra-facility Transportation
Transportation, Distribution
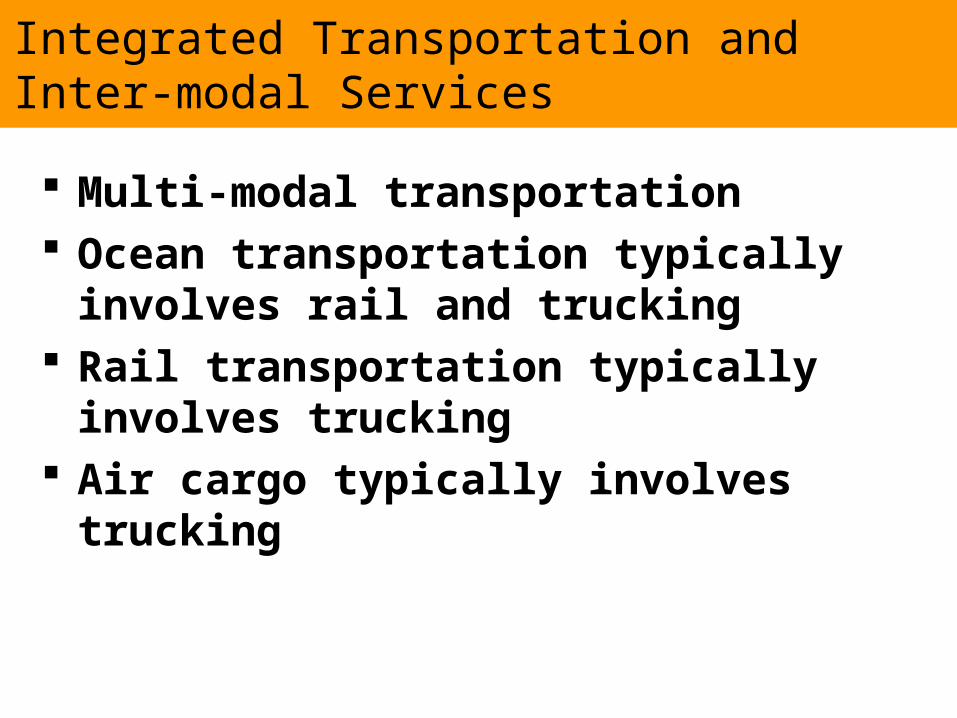
Integrated Transportation andInter-modal Services
Multi-modal transportation Ocean transportation typically involves rail
and trucking Rail transportation typically involves
trucking Air cargo typically involves trucking
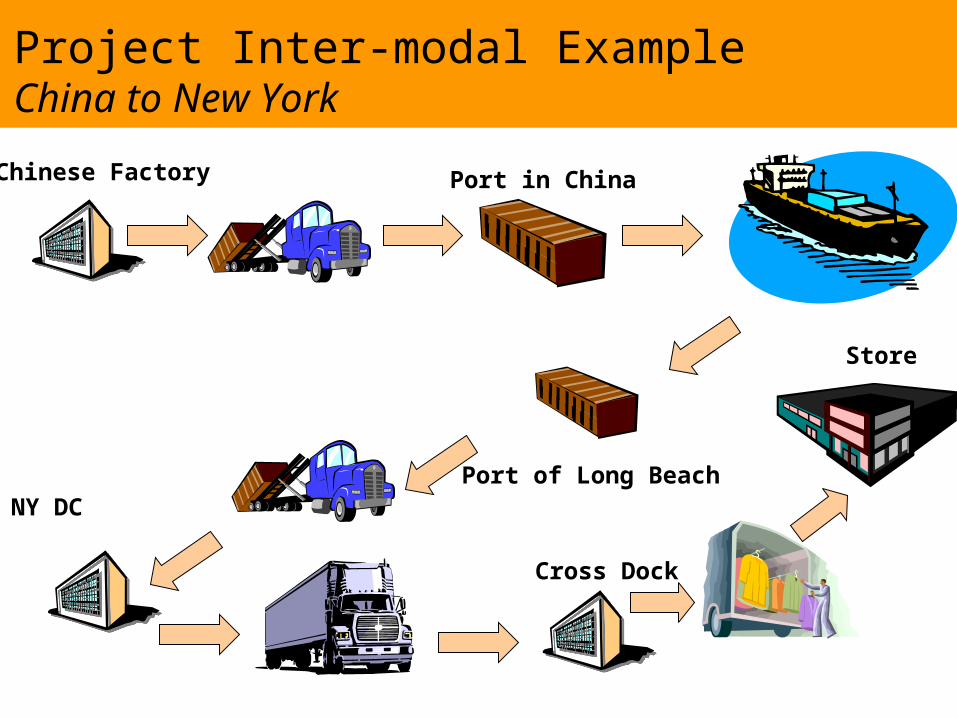
Project Inter-modal ExampleChina to New York
Chinese Factory Port in China
Port of Long BeachNY DC
Cross Dock
Store
Trucking Outline
Background information DOT driving regulations TL transportation LTL transportation
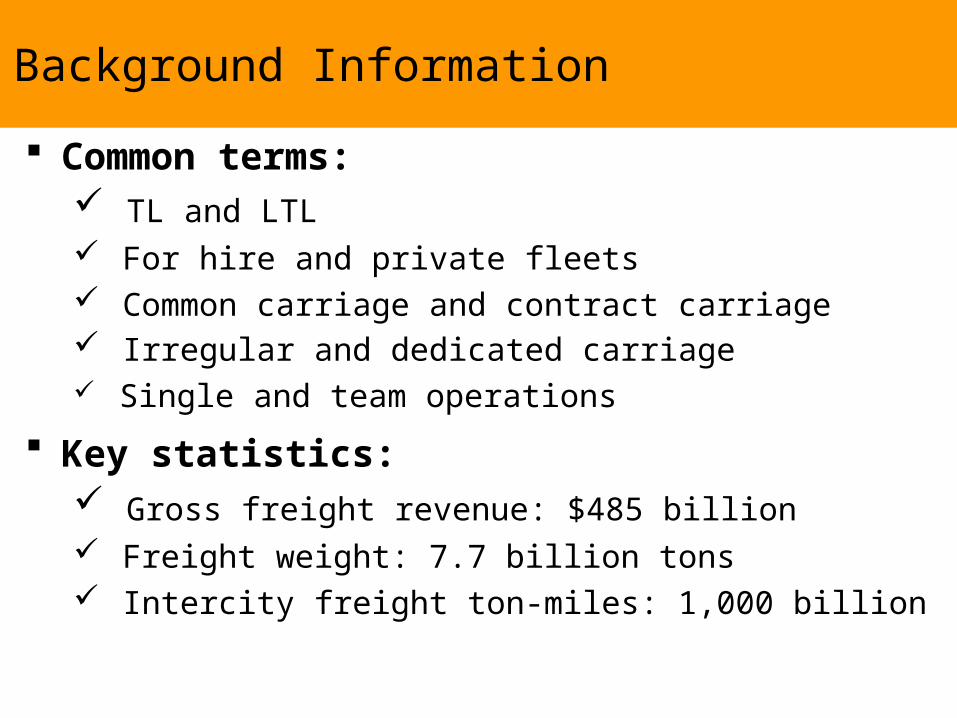
Background Information
Common terms: TL and LTL For hire and private fleets Common carriage and contract carriage Irregular and dedicated carriage
Single and team operations
Key statistics: Gross freight revenue: $485 billion Freight weight: 7.7 billion tons Intercity freight ton-miles: 1,000 billion
Background Information
Number of trucks: 2.3 million tractors 4.4 million trailers 20 million trucks of all weight classes
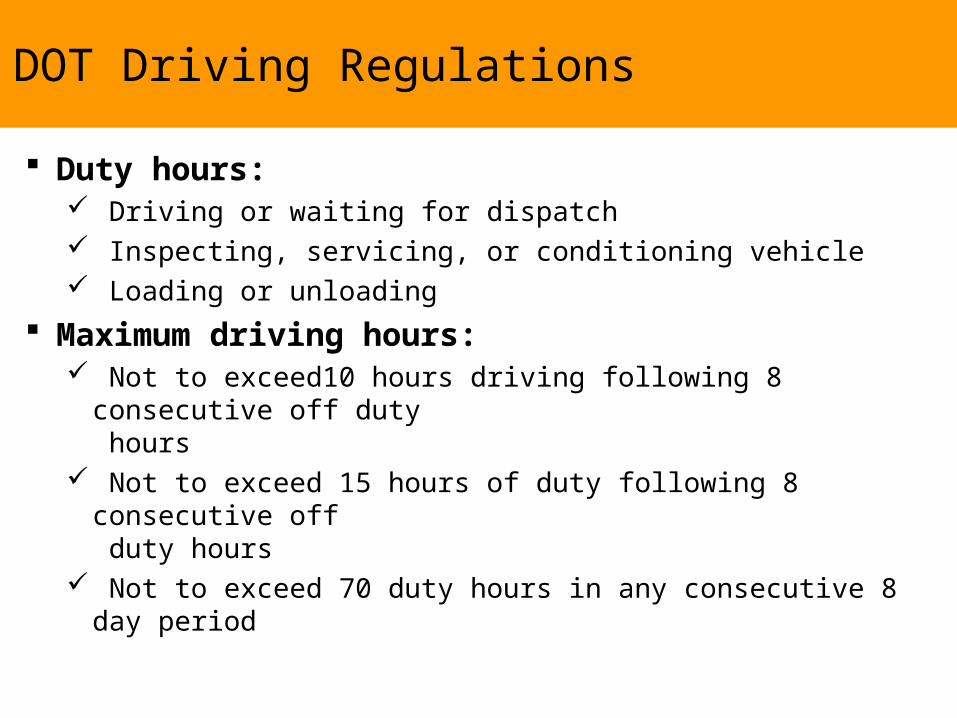
DOT Driving Regulations
Duty hours: Driving or waiting for dispatch Inspecting, servicing, or conditioning vehicle Loading or unloading
Maximum driving hours: Not to exceed10 hours driving following 8 consecutive off duty
hours Not to exceed 15 hours of duty following 8 consecutive off
duty hours Not to exceed 70 duty hours in any consecutive 8 day period
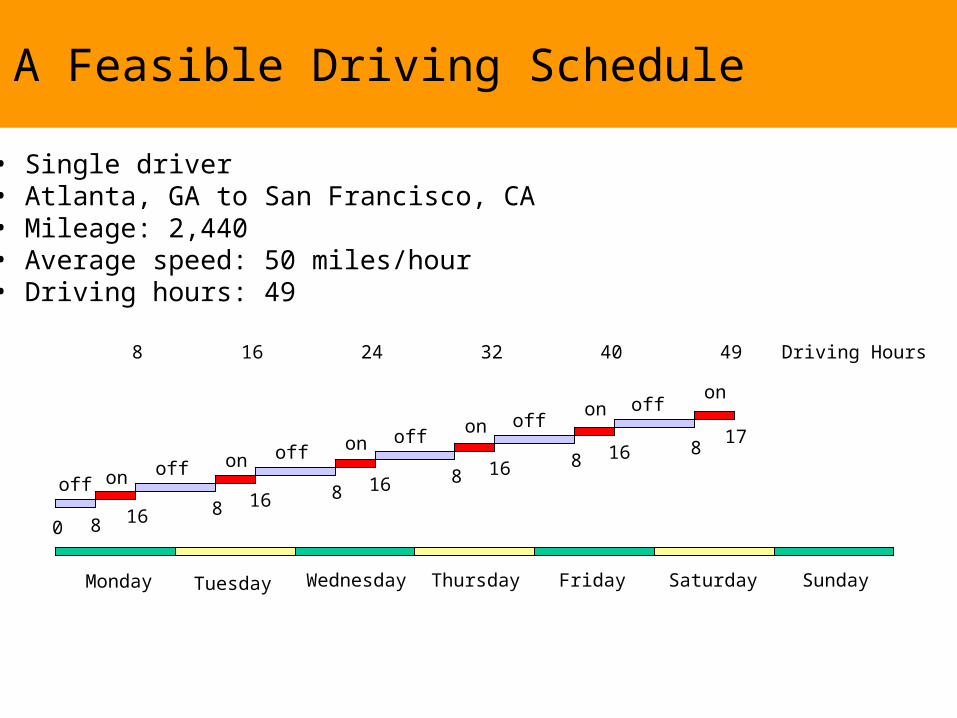
A Feasible Driving Schedule
Monday Tuesday Wednesday Thursday Friday Saturday Sunday
8 16 8 16 8 16 8 16 8 1617
offoff
off
offoff
off
onon
onon
onon
• Single driver• Atlanta, GA to San Francisco, CA• Mileage: 2,440• Average speed: 50 miles/hour• Driving hours: 49
8
0
Driving Hours8 16 24 32 40 49
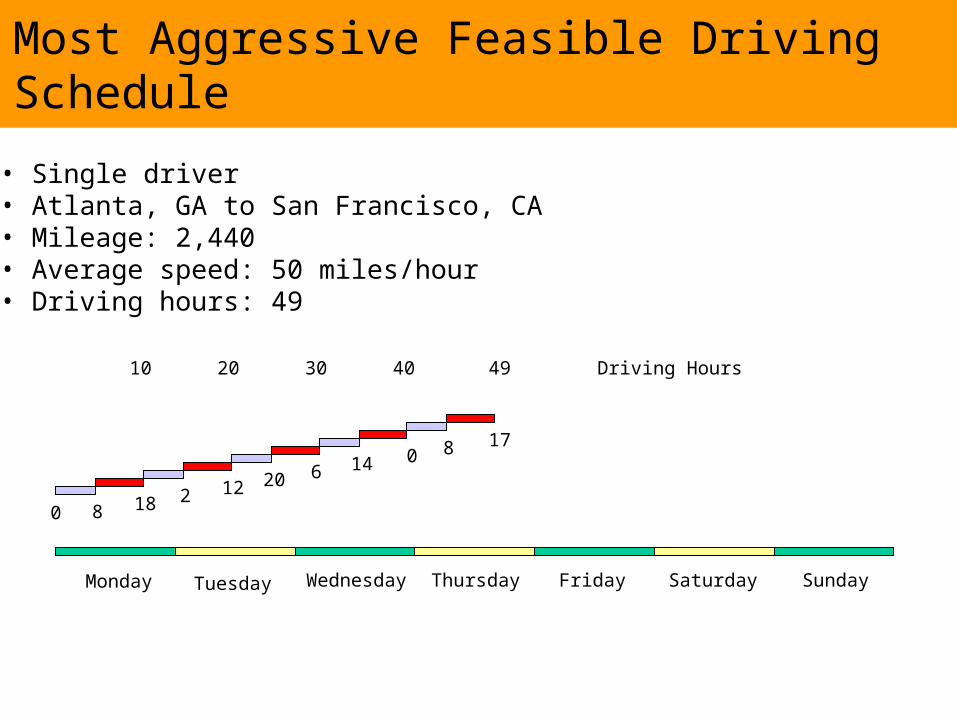
Most Aggressive Feasible Driving Schedule
Monday Tuesday Wednesday Thursday Friday Saturday Sunday
• Single driver• Atlanta, GA to San Francisco, CA• Mileage: 2,440• Average speed: 50 miles/hour• Driving hours: 49
0 8 18 2 12 20 6 14 0 8 17
Driving Hours10 20 30 40 49
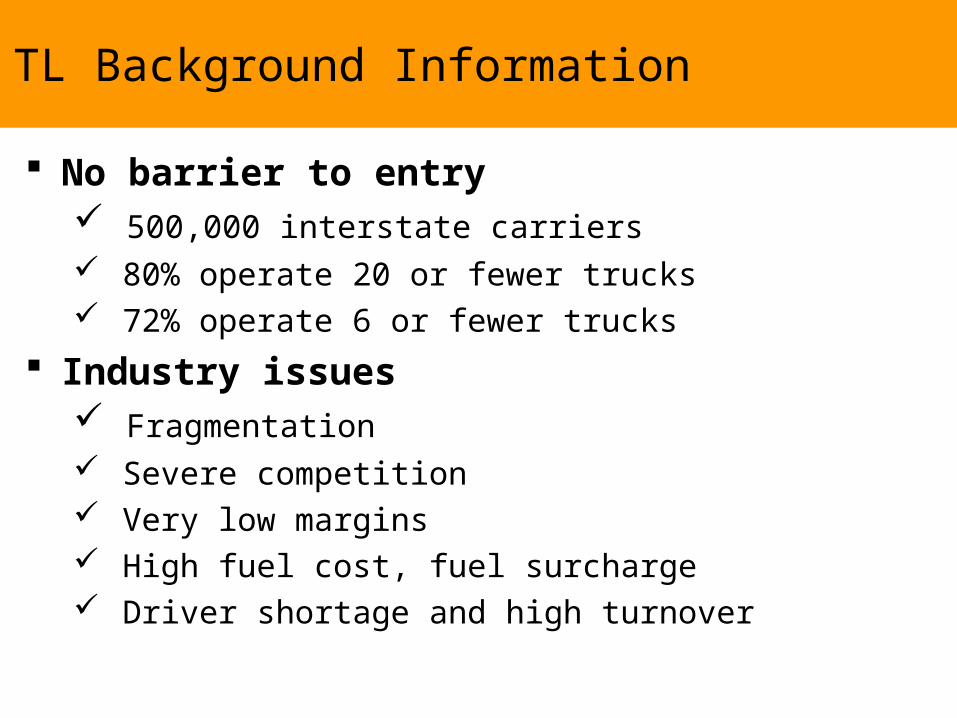
TL Background Information
No barrier to entry 500,000 interstate carriers 80% operate 20 or fewer trucks 72% operate 6 or fewer trucks
Industry issues Fragmentation Severe competition Very low margins High fuel cost, fuel surcharge Driver shortage and high turnover
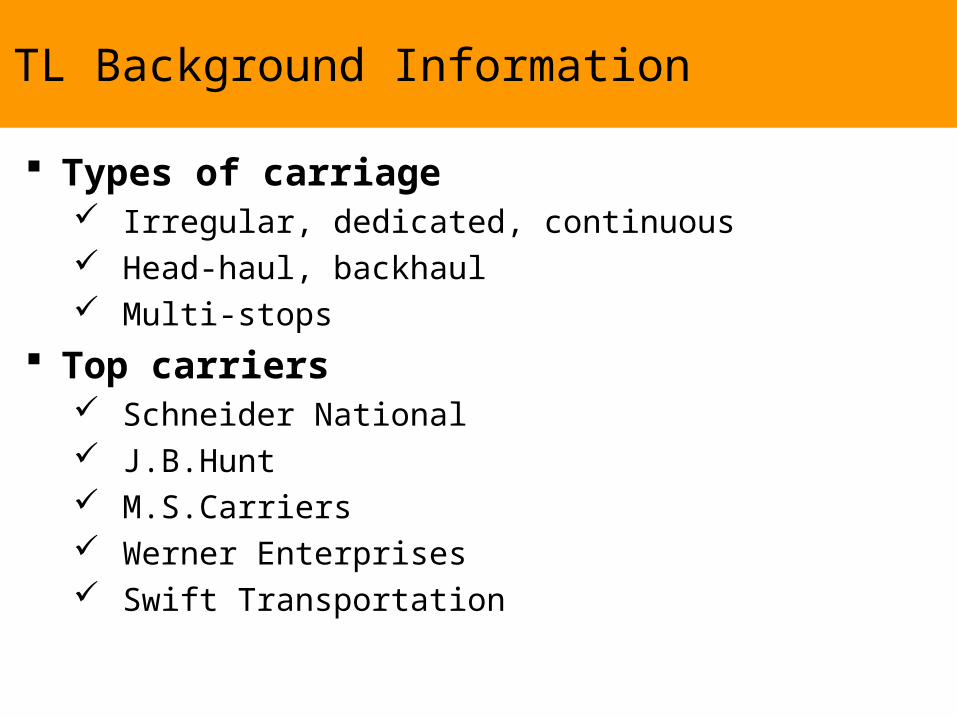
TL Background Information
Types of carriage Irregular, dedicated, continuous Head-haul, backhaul Multi-stops
Top carriers Schneider National J.B.Hunt M.S.Carriers Werner Enterprises Swift Transportation
Truckload Topics
Freight acceptance and solicitation Drop and swap TL economics 101 Pricing of services
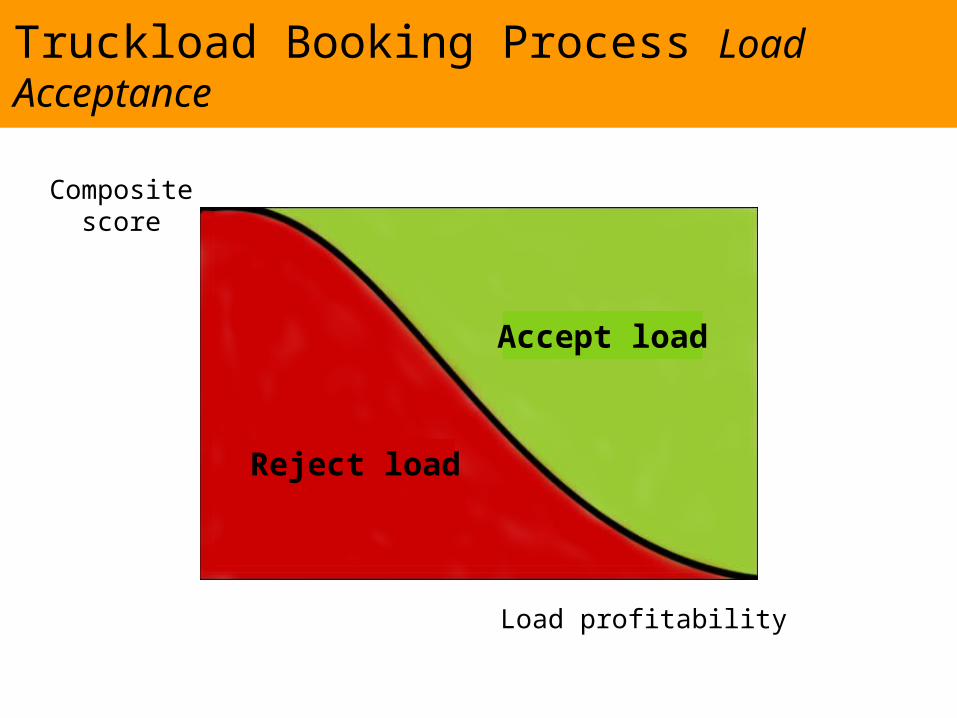
Compositescore
Load profitability
Truckload Booking Process Load Acceptance
Reject load
Accept load
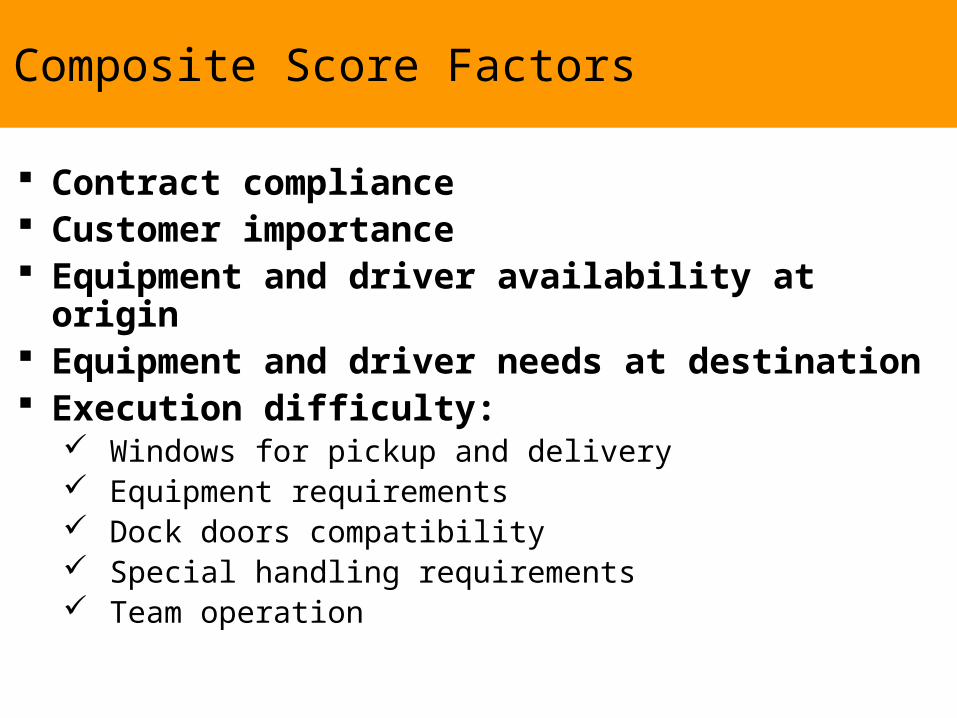
Composite Score Factors
Contract compliance Customer importance Equipment and driver availability at origin Equipment and driver needs at destination Execution difficulty:
Windows for pickup and delivery Equipment requirements Dock doors compatibility Special handling requirements Team operation
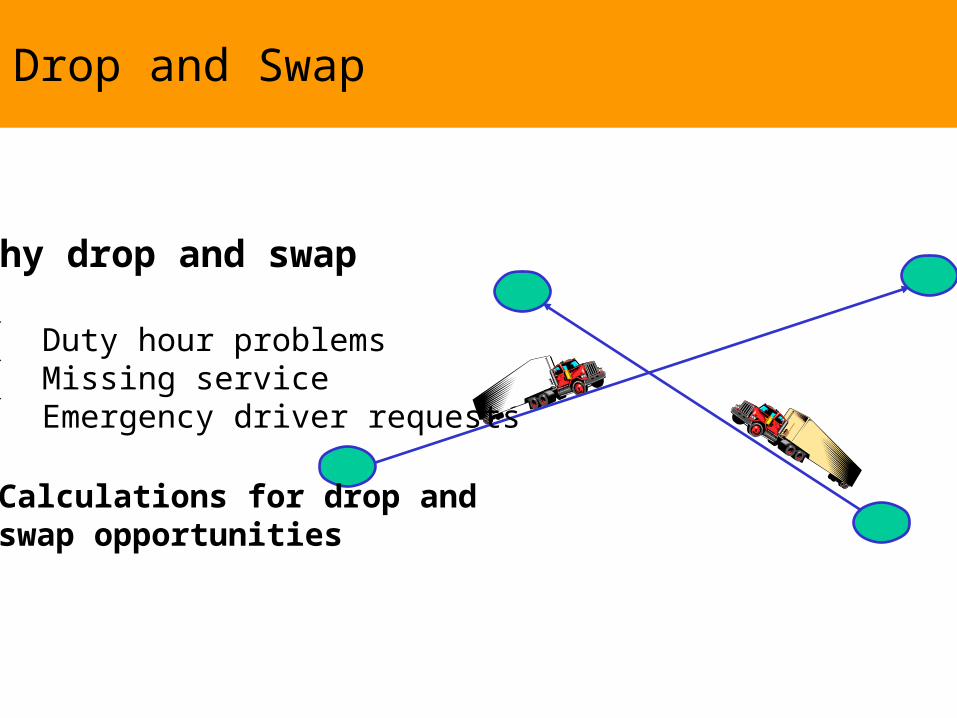
Drop and Swap
Why drop and swap
Duty hour problems Missing service Emergency driver requests
Calculations for drop and swap opportunities
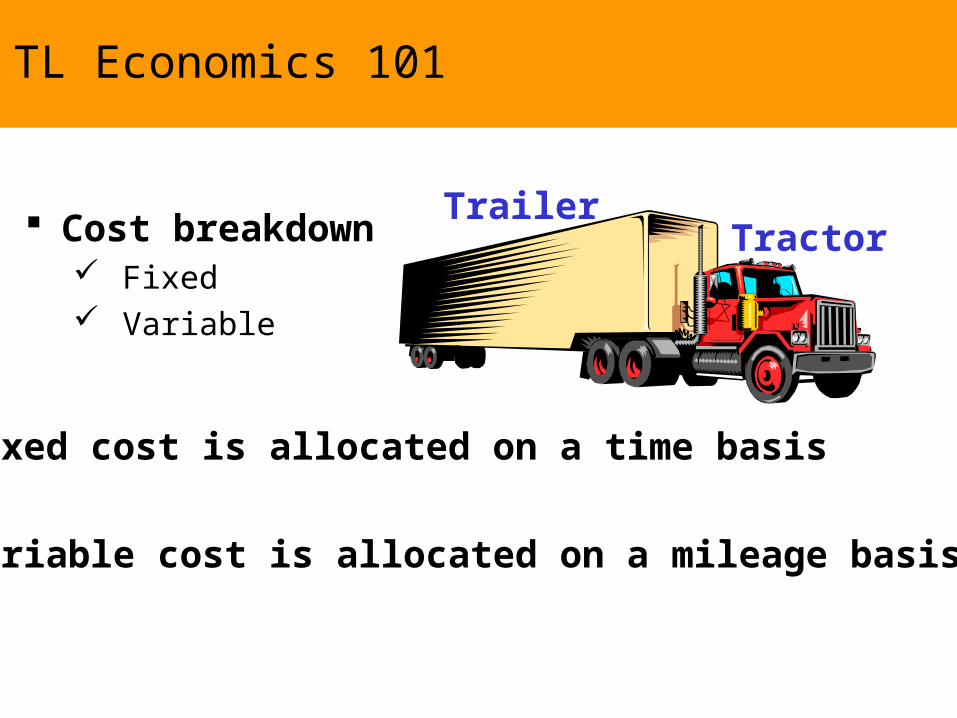
TL Economics 101
Cost breakdown Fixed Variable
Fixed cost is allocated on a time basis
Variable cost is allocated on a mileage basis
TrailerTractor
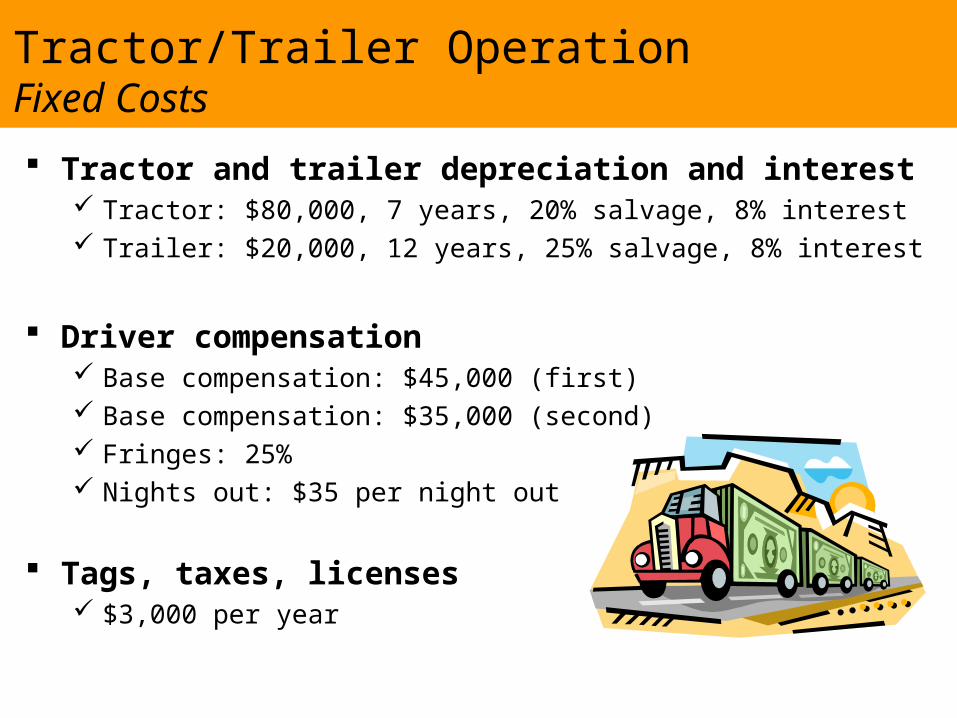
Tractor/Trailer OperationFixed Costs
Tractor and trailer depreciation and interest Tractor: $80,000, 7 years, 20% salvage, 8% interest Trailer: $20,000, 12 years, 25% salvage, 8% interest
Driver compensation Base compensation: $45,000 (first) Base compensation: $35,000 (second) Fringes: 25% Nights out: $35 per night out
Tags, taxes, licenses $3,000 per year
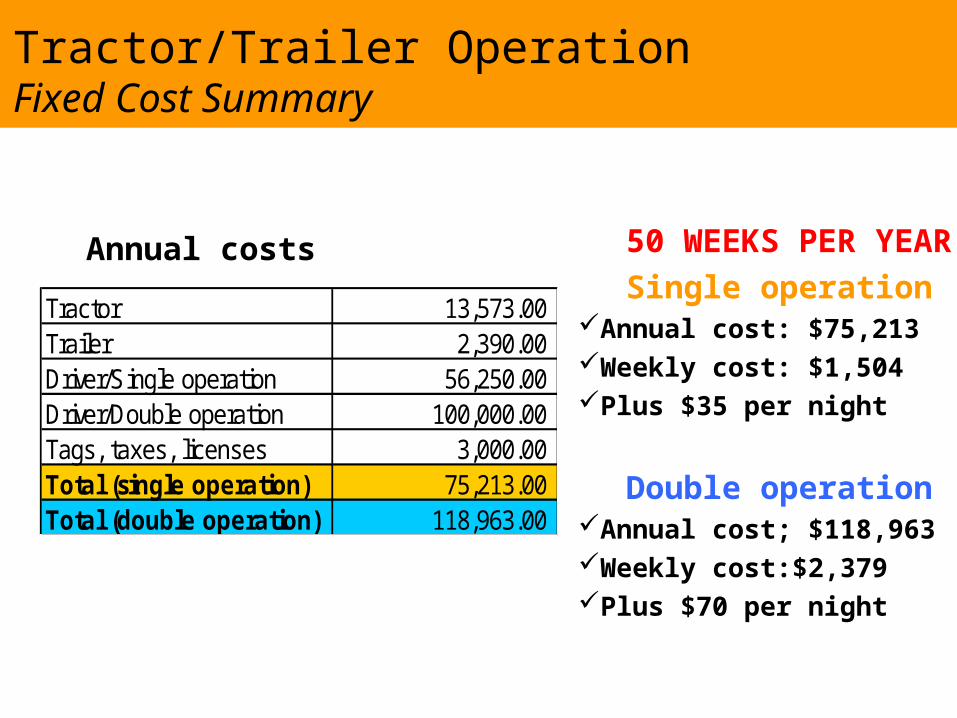
Tractor/Trailer OperationFixed Cost Summary
Annual costs 50 WEEKS PER YEAR
Single operationAnnual cost: $75,213Weekly cost: $1,504Plus $35 per night
Double operationAnnual cost; $118,963Weekly cost:$2,379Plus $70 per night
Tractor 13,573.00Trailer 2,390.00Driver/Single operation 56,250.00Driver/Double operation 100,000.00Tags, taxes, licenses 3,000.00 Total (single operation) 75,213.00 Total (double operation) 118,963.00
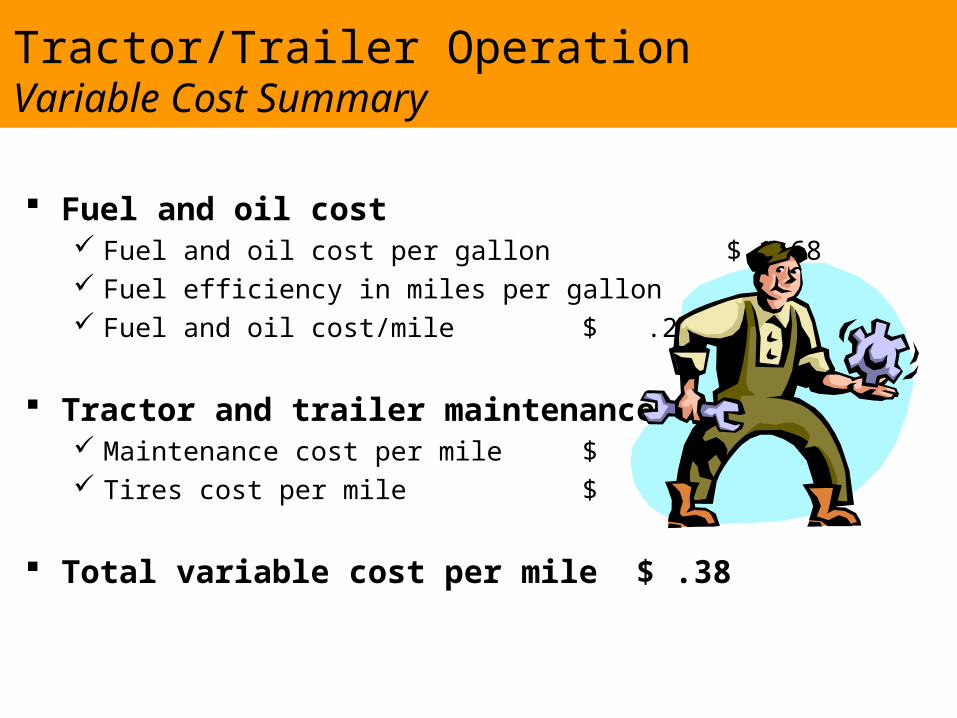
Tractor/Trailer OperationVariable Cost Summary
Fuel and oil cost Fuel and oil cost per gallon $ 1.68 Fuel efficiency in miles per gallon 6 Fuel and oil cost/mile $ .28
Tractor and trailer maintenance Maintenance cost per mile $ .06 Tires cost per mile $ .04
Total variable cost per mile $ .38
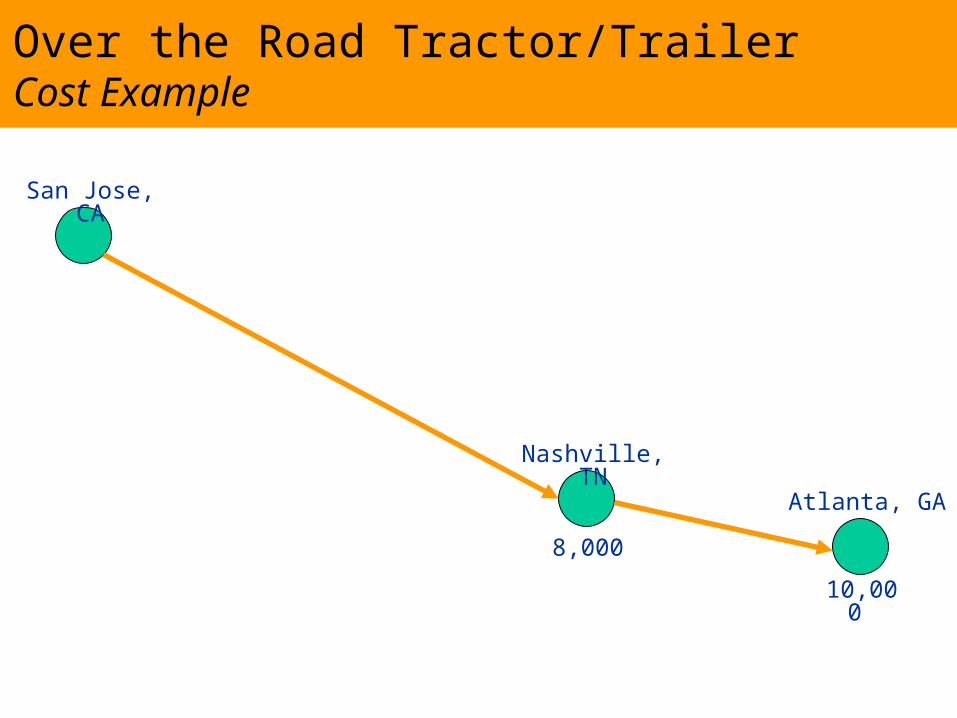
Over the Road Tractor/Trailer Cost Example
San Jose, CA
Nashville, TN
Atlanta, GA
8,000
10,000
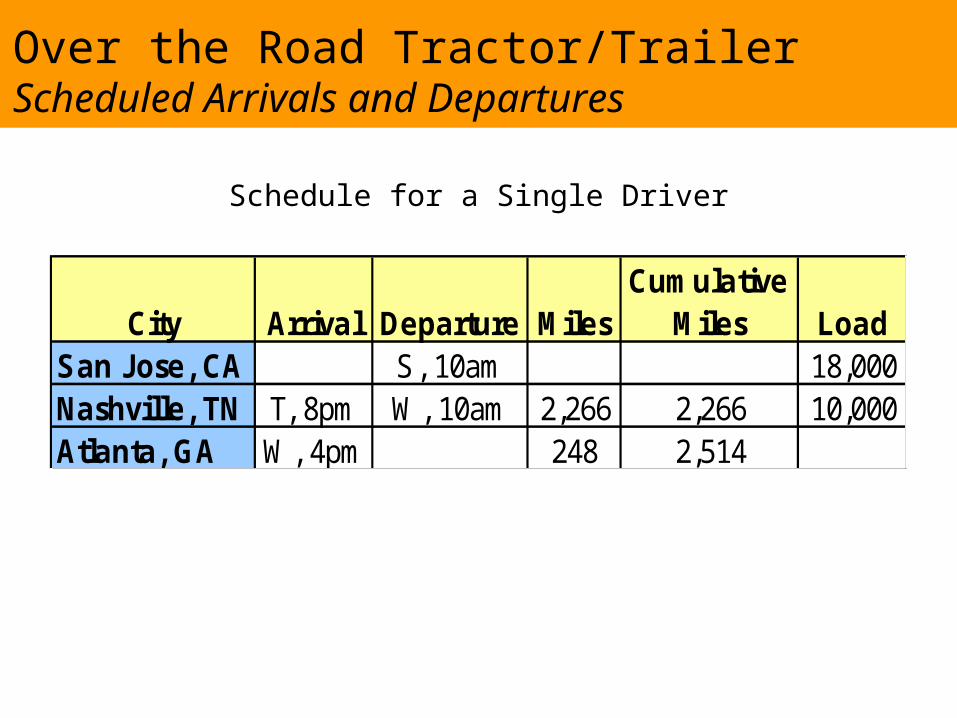
Over the Road Tractor/TrailerScheduled Arrivals and Departures
Schedule for a Single Driver
City Arrival Departure MilesCumulative
Miles LoadSan Jose, CA S, 10am 18,000Nashville, TN T, 8pm W, 10am 2,266 2,266 10,000Atlanta, GA W, 4pm 248 2,514
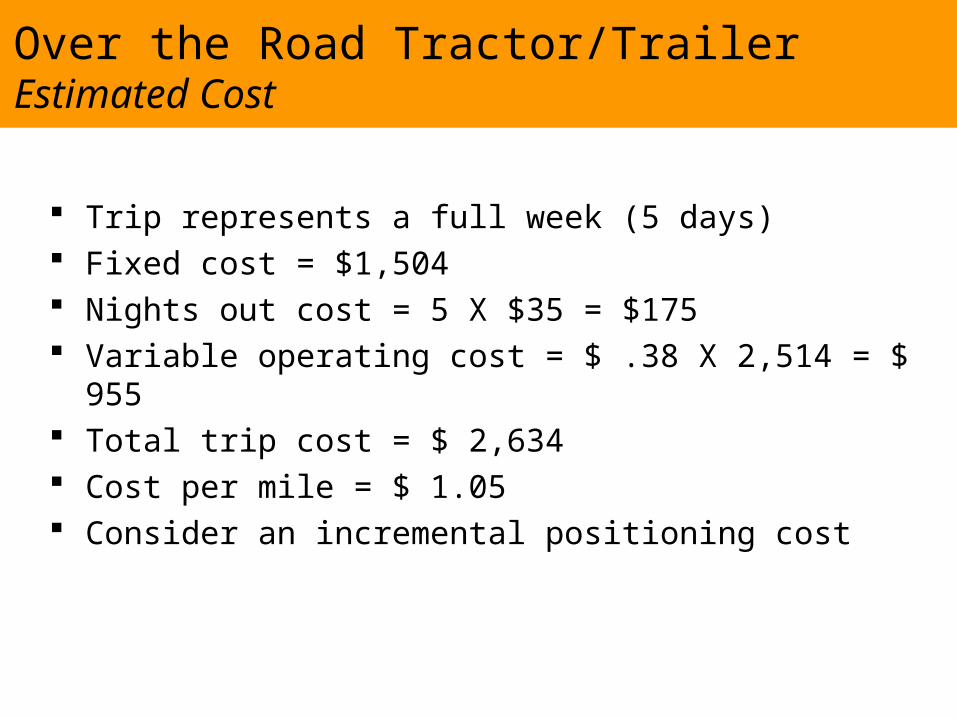
Trip represents a full week (5 days) Fixed cost = $1,504 Nights out cost = 5 X $35 = $175 Variable operating cost = $ .38 X 2,514 = $ 955 Total trip cost = $ 2,634 Cost per mile = $ 1.05 Consider an incremental positioning cost
Over the Road Tractor/Trailer Estimated Cost
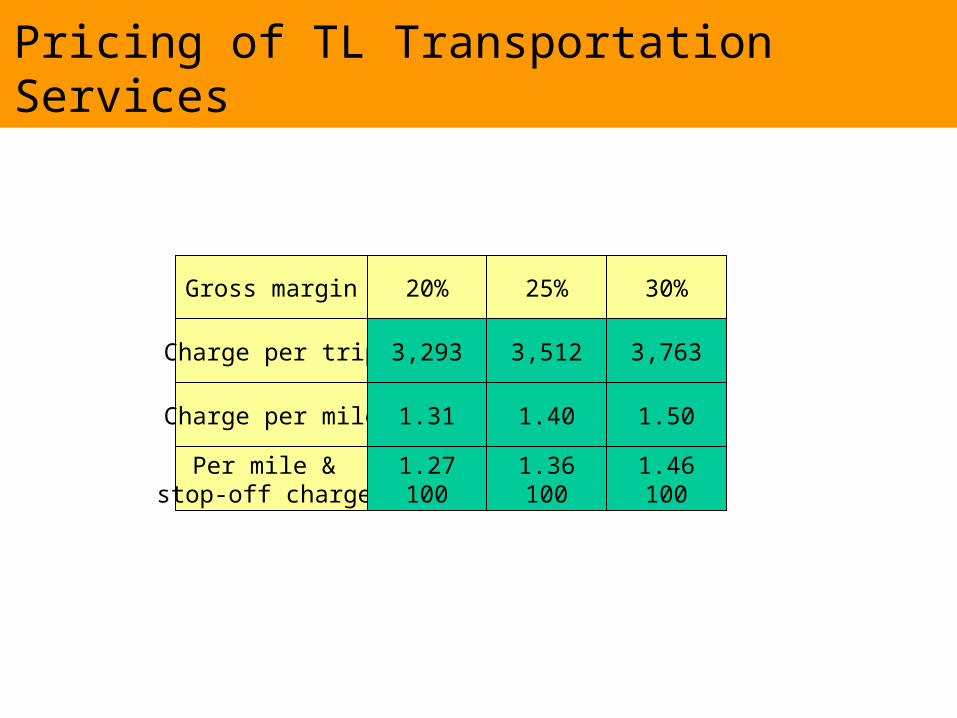
Pricing of TL Transportation Services
Gross margin
Charge per trip
Charge per mile
Per mile & stop-off charge
20% 25% 30%
3,293
1.31
1.27100
3,512
1.40
1.36100
1.46100
1.50
3,763
LTL Transportation
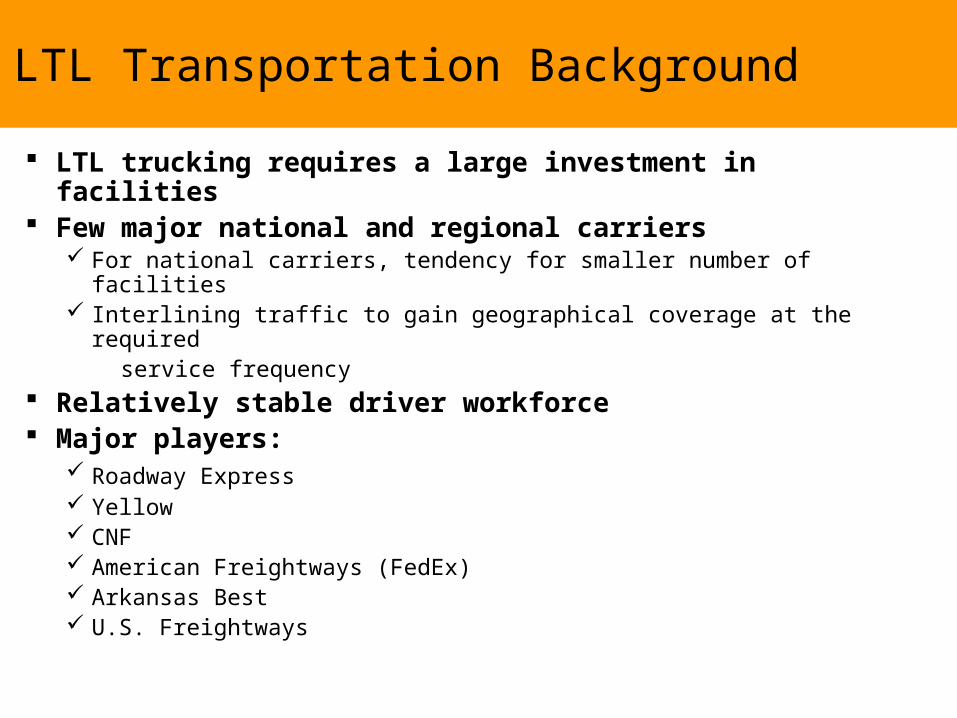
LTL Transportation Background
LTL trucking requires a large investment in facilities Few major national and regional carriers
For national carriers, tendency for smaller number of facilities Interlining traffic to gain geographical coverage at the required service frequency
Relatively stable driver workforce Major players:
Roadway Express Yellow CNF American Freightways (FedEx) Arkansas Best U.S. Freightways
LTL Transportation Background
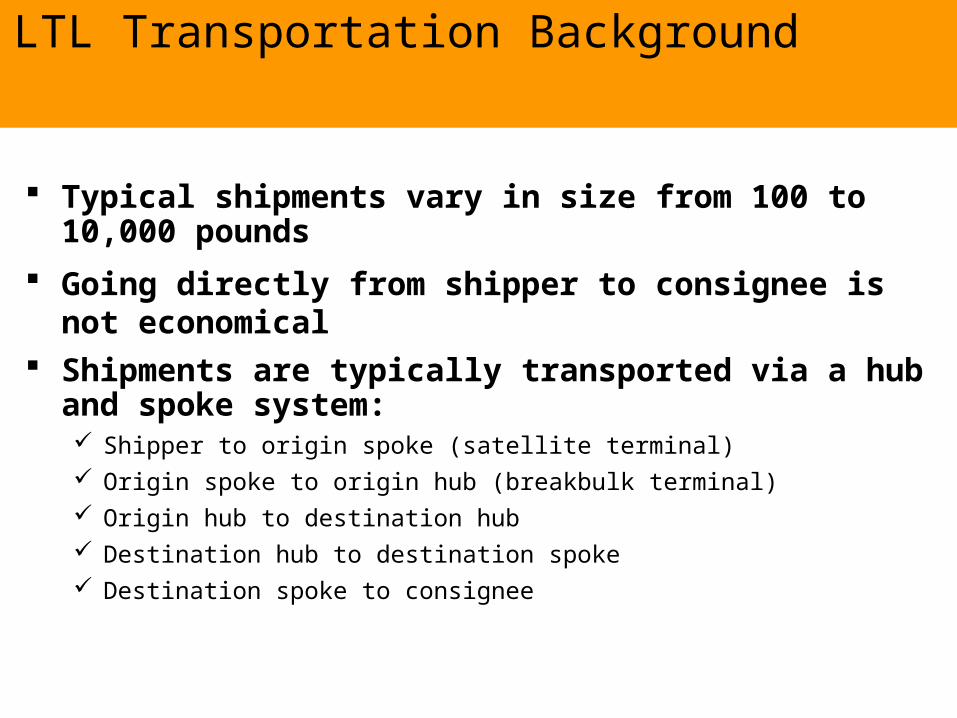
Typical shipments vary in size from 100 to 10,000 pounds
Going directly from shipper to consignee is not economical
Shipments are typically transported via a hub and spoke system: Shipper to origin spoke (satellite terminal) Origin spoke to origin hub (breakbulk terminal) Origin hub to destination hub Destination hub to destination spoke Destination spoke to consignee
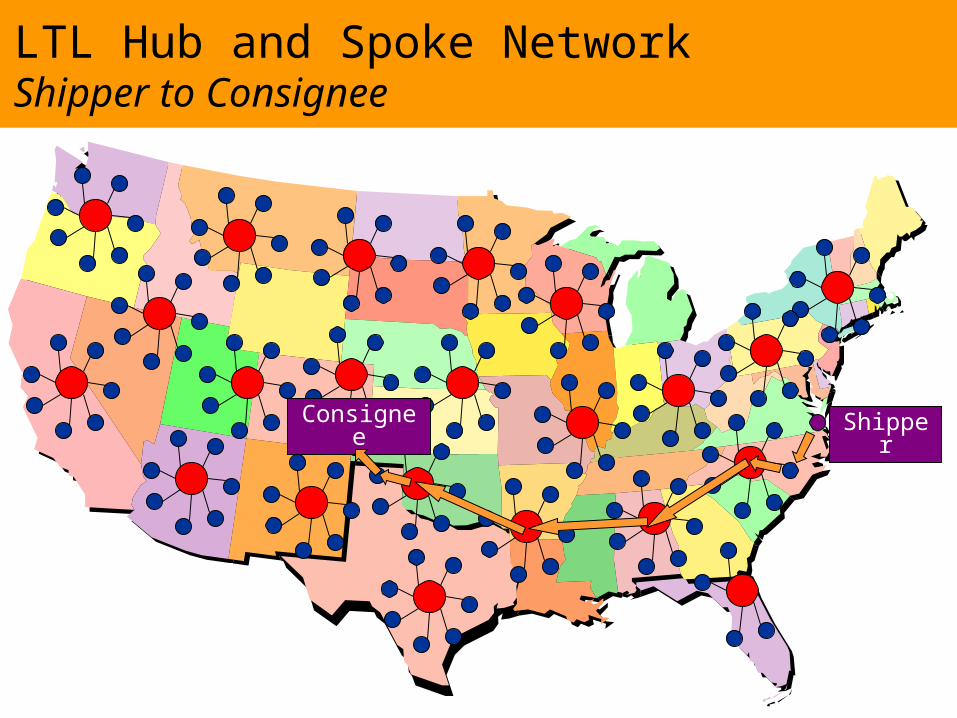
LTL Hub and Spoke NetworkShipper to Consignee
ShipperConsignee
Hub Operations
Receiving spoke and hub loads Freight breakdown and sorting Relays Outbound load buildup Sending satellite and hub loads Local pickups and deliveries
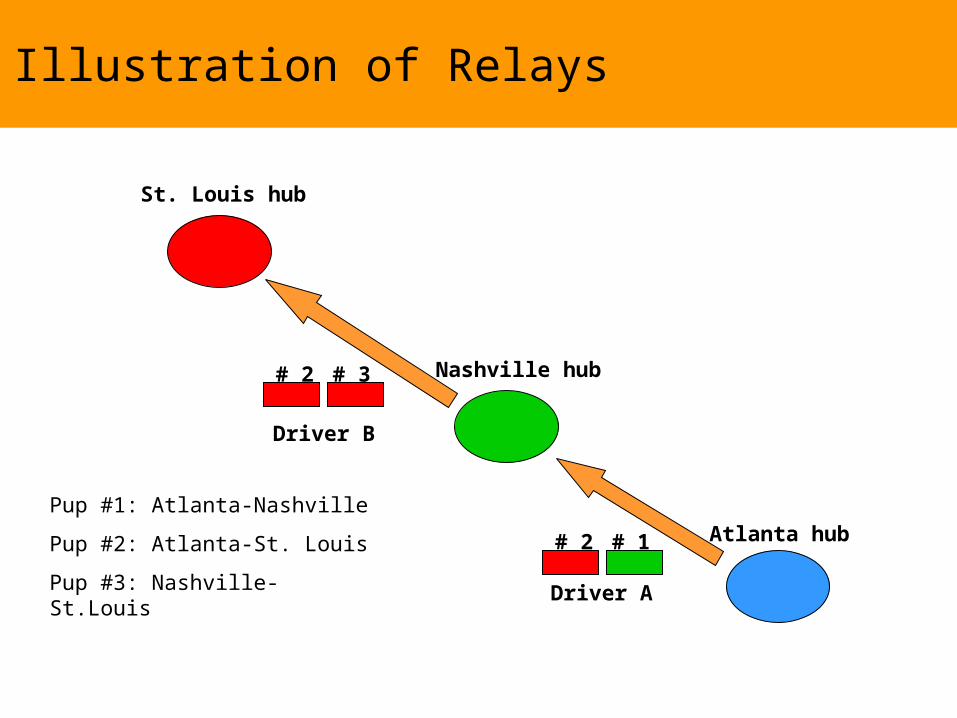
Illustration of Relays
Atlanta hub
Nashville hub
St. Louis hub
# 2 # 1
# 2 # 3
Pup #1: Atlanta-Nashville
Pup #2: Atlanta-St. Louis
Pup #3: Nashville- St.Louis Driver A
Driver B
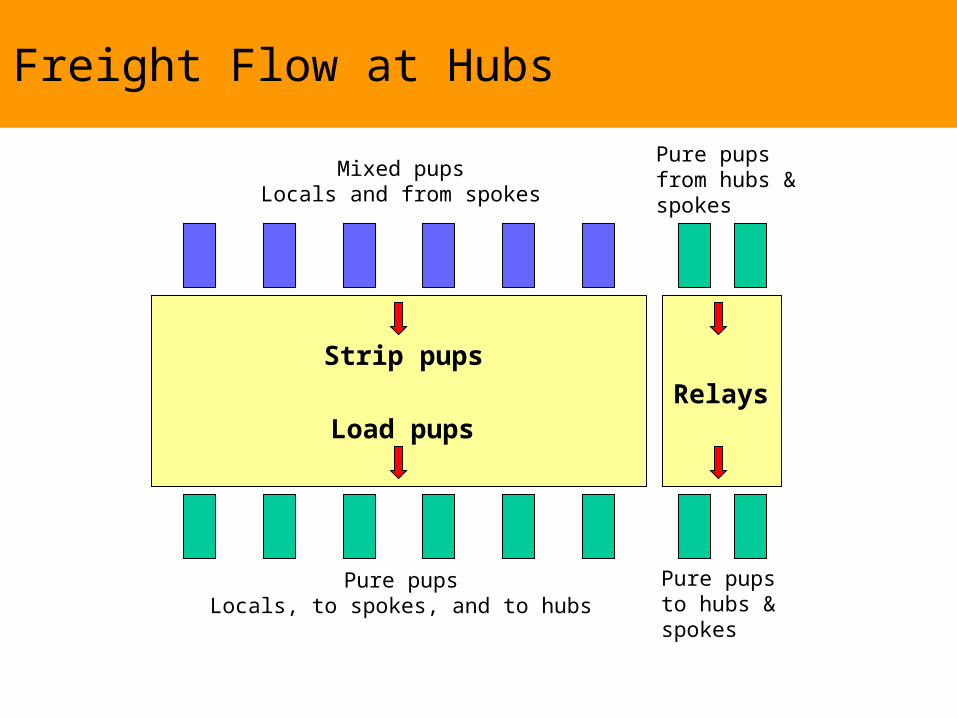
Freight Flow at Hubs
Pure pupsfrom hubs & spokes
Pure pupsto hubs & spokes
Relays
Strip pups
Load pups
Mixed pupsLocals and from spokes
Pure pupsLocals, to spokes, and to hubs
Rail Transportation
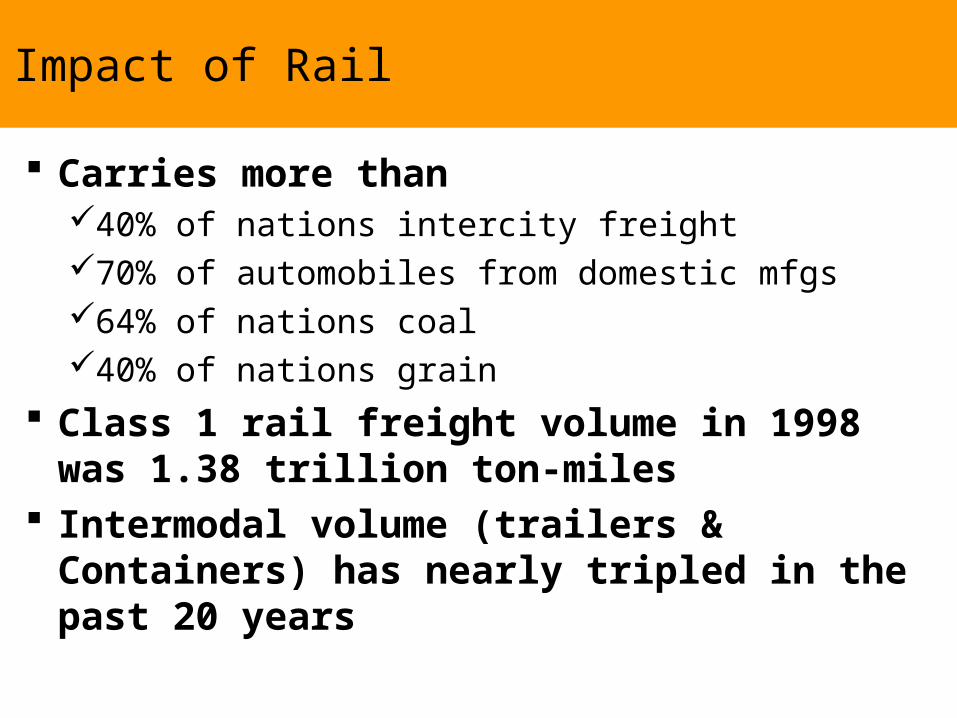
Impact of Rail
Carries more than 40% of nations intercity freight70% of automobiles from domestic mfgs64% of nations coal40% of nations grain
Class 1 rail freight volume in 1998 was 1.38 trillion ton-miles
Intermodal volume (trailers & Containers) has nearly tripled in the past 20 years
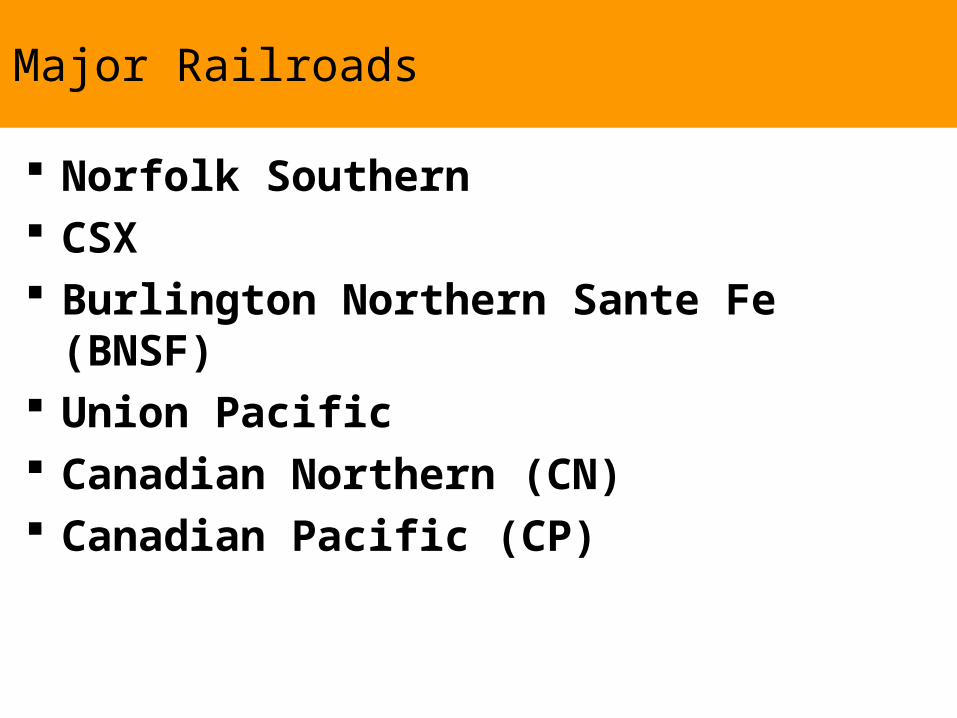
Major Railroads
Norfolk Southern CSX Burlington Northern Sante Fe (BNSF) Union Pacific Canadian Northern (CN) Canadian Pacific (CP)
General Freight Trains
Averages69 cars2660 tons21 miles per hour
Sorted at Hump Yard or Switch Yard Local railroad picks up and delivers
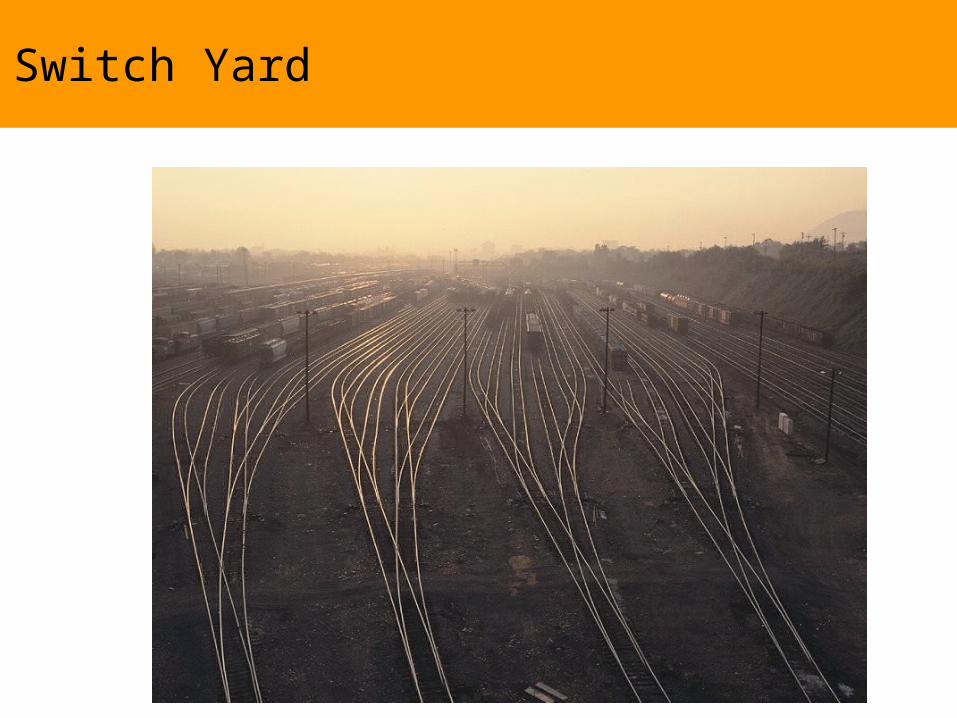
Switch Yard
Unit Trains
Sufficient volume for dedicated power Coal and Grain Long, slow, heavy No switching
Intermodal Trains
TypesTrailer on Flatcar (TOFC)Double StackRoadrailerTriple Crown
Scheduled Estimated 9 trillion containers and trailers
loaded on intermodal trains in 2000
Air Cargo Transportation
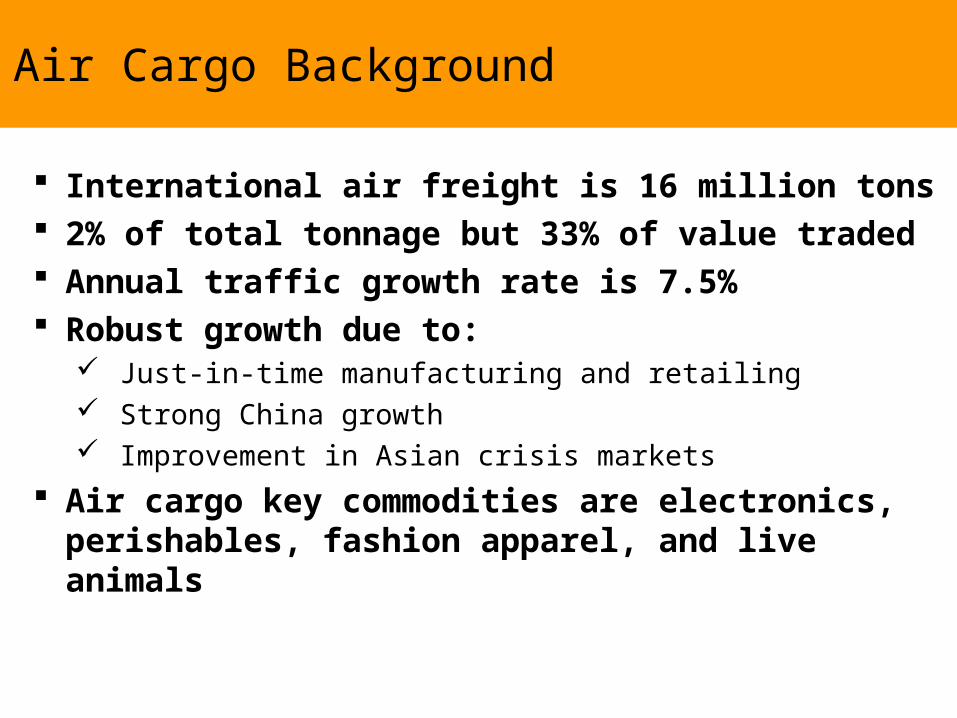
Air Cargo Background
International air freight is 16 million tons 2% of total tonnage but 33% of value traded Annual traffic growth rate is 7.5% Robust growth due to:
Just-in-time manufacturing and retailing Strong China growth Improvement in Asian crisis markets
Air cargo key commodities are electronics, perishables, fashion apparel, and live animals
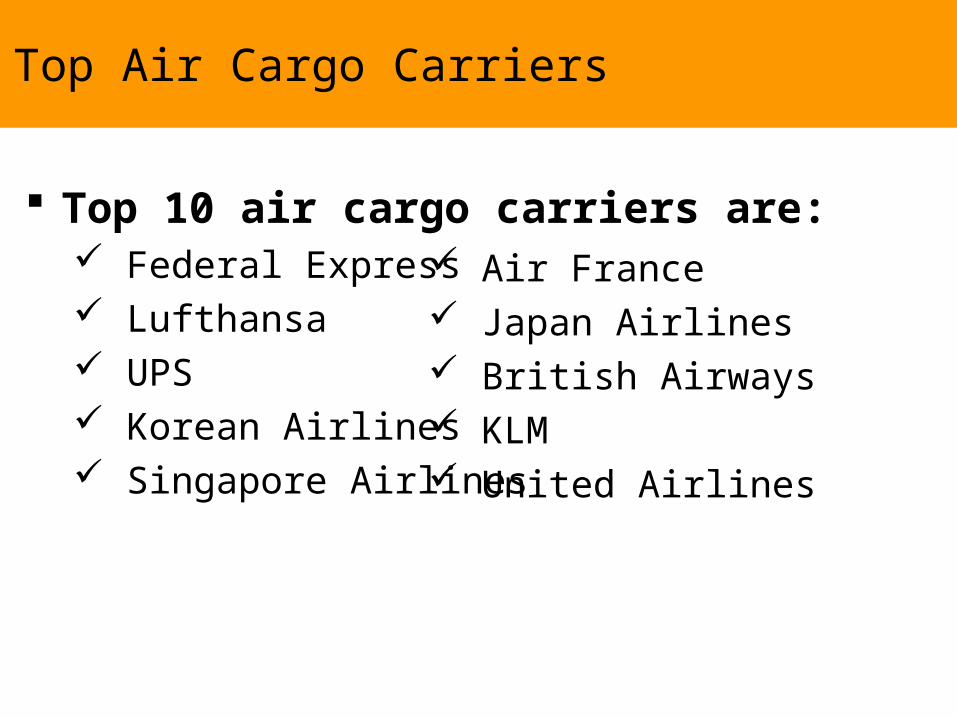
Top Air Cargo Carriers
Top 10 air cargo carriers are: Federal Express Lufthansa UPS Korean Airlines Singapore Airlines
Air France Japan Airlines British Airways KLM United Airlines
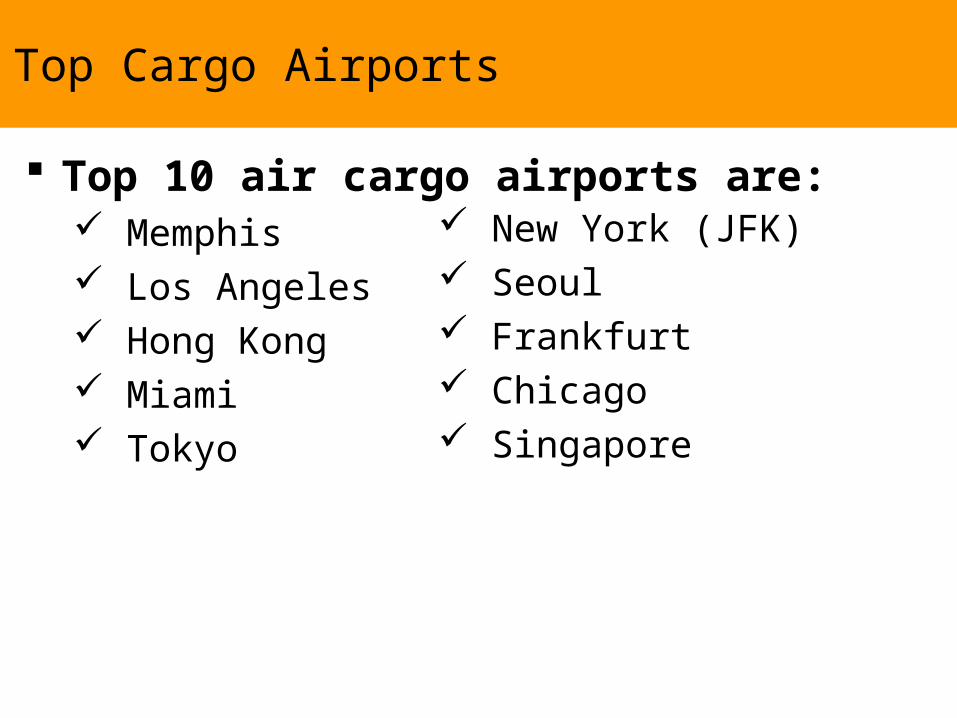
Top Cargo Airports
Top 10 air cargo airports are: Memphis Los Angeles Hong Kong Miami Tokyo
New York (JFK) Seoul Frankfurt Chicago Singapore
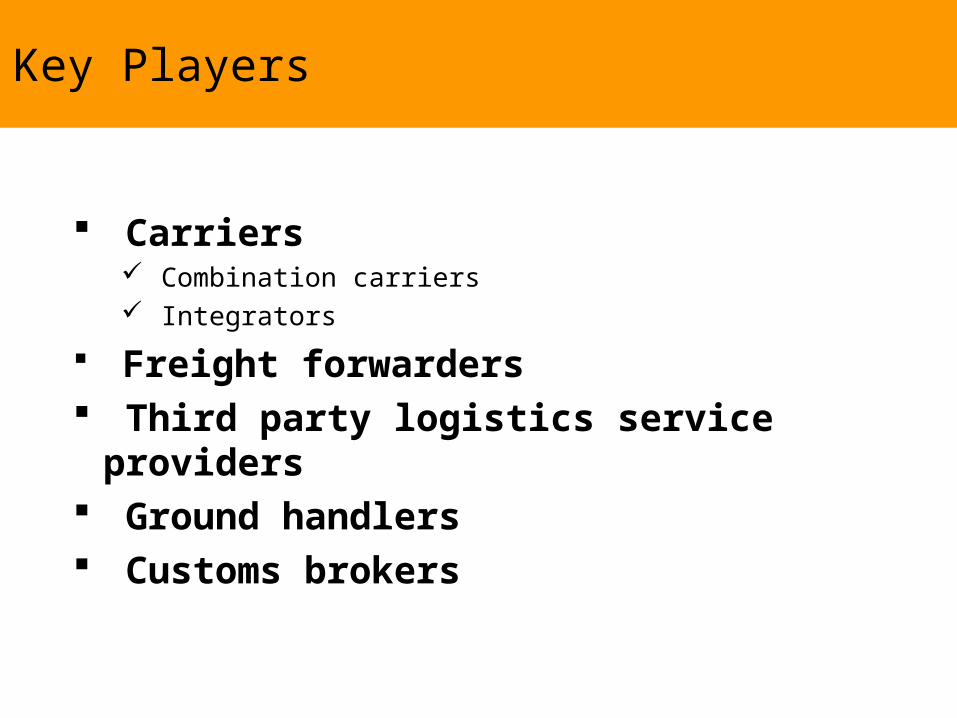
Key Players
Carriers Combination carriers Integrators
Freight forwarders Third party logistics service providers Ground handlers Customs brokers
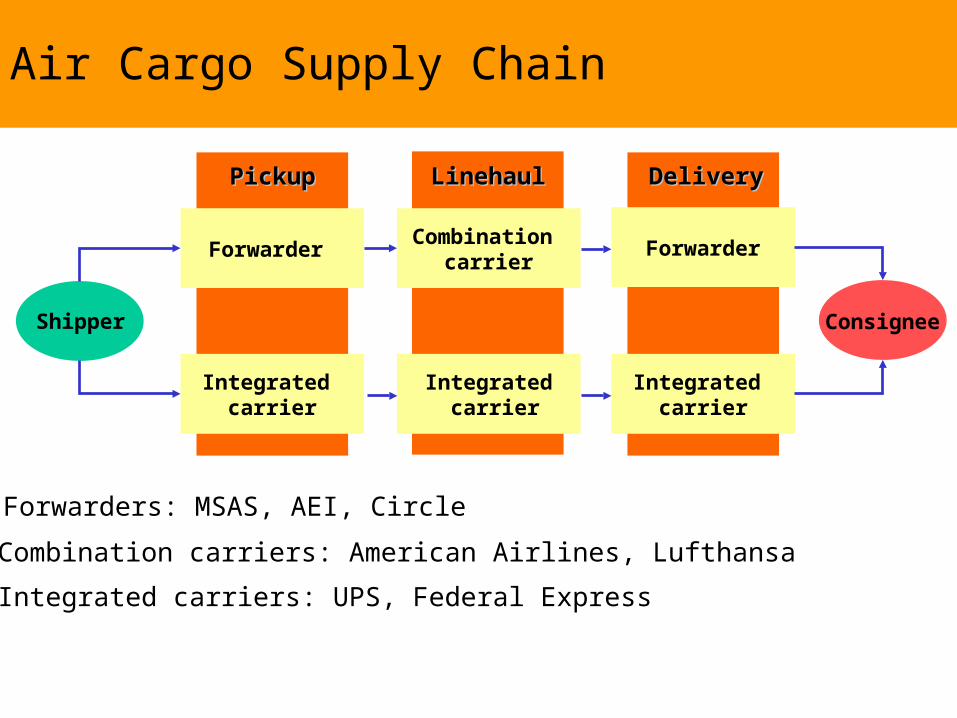
Air Cargo Supply Chain
Shipper
PickupPickup
Consignee
LinehaulLinehaul DeliveryDelivery
Forwarder
Integrated carrier
Combination carrier
Integrated carrier
Forwarder
Integrated carrier
Forwarders: MSAS, AEI, Circle
Combination carriers: American Airlines, Lufthansa
Integrated carriers: UPS, Federal Express
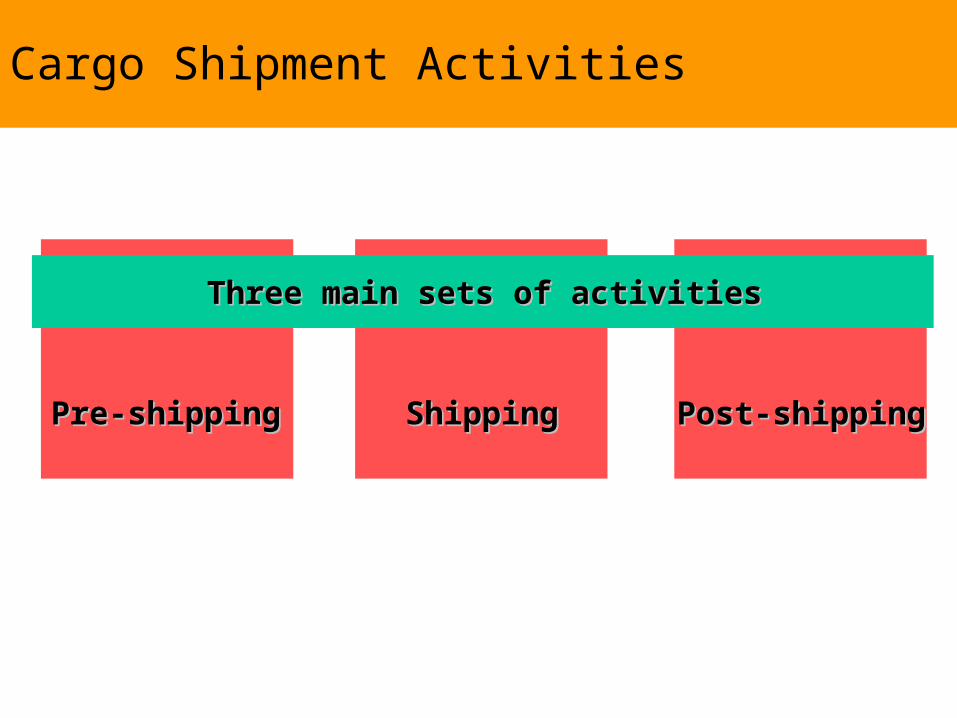
Cargo Shipment Activities
Three main sets of activitiesThree main sets of activities
Pre-shippingPre-shipping ShippingShipping Post-shippingPost-shipping
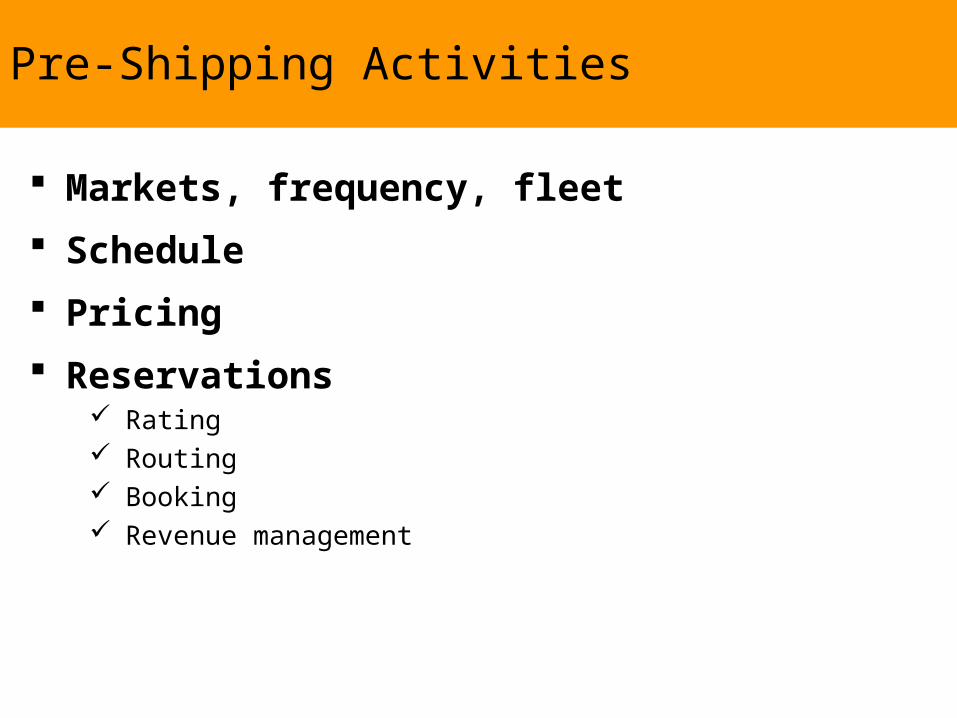
Pre-Shipping Activities
Markets, frequency, fleet
Schedule
Pricing
Reservations Rating Routing Booking Revenue management
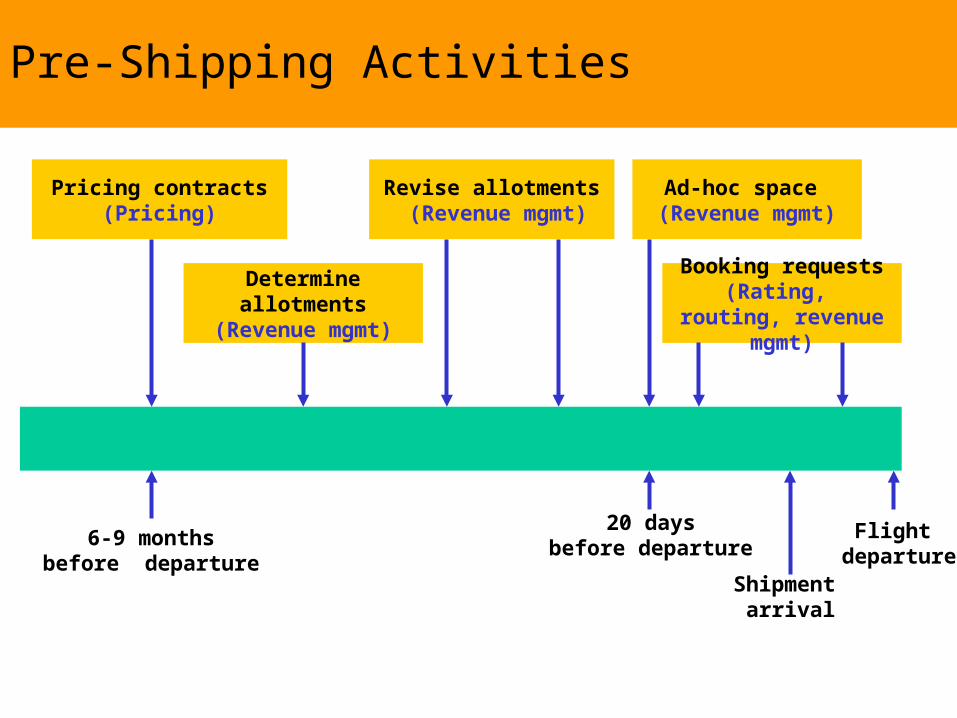
Pre-Shipping Activities
Pricing contracts (Pricing)
Revise allotments (Revenue mgmt)
Determine allotments (Revenue mgmt)
Ad-hoc space (Revenue mgmt)
Booking requests (Rating, routing, revenue mgmt)
6-9 monthsbefore departure
20 daysbefore departure
Shipment arrival
Flight departure
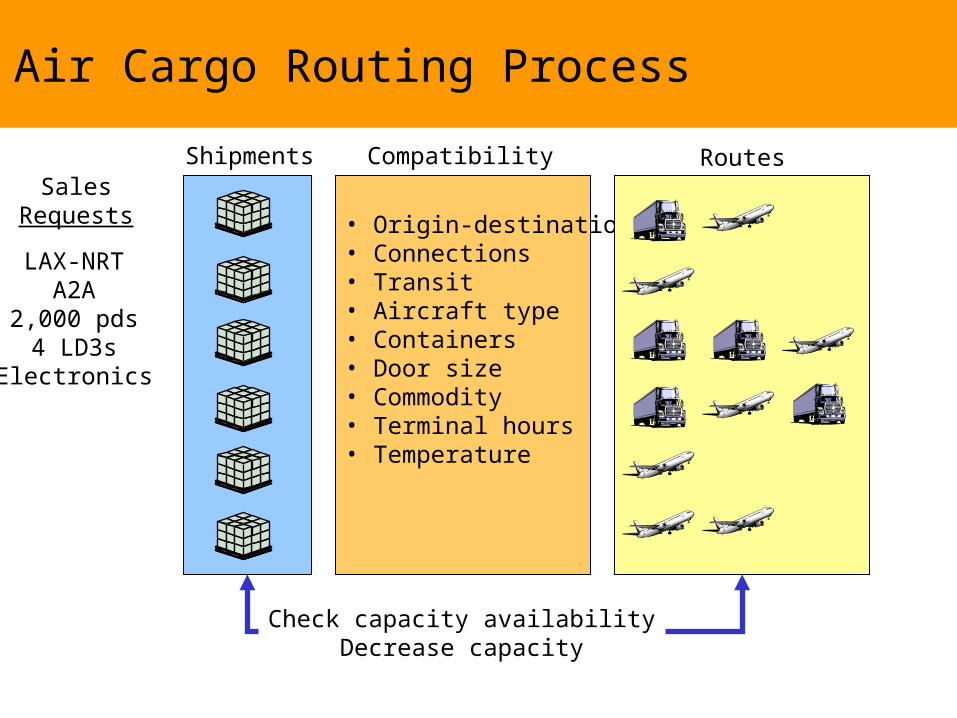
Air Cargo Routing Process
SalesRequests
Check capacity availabilityDecrease capacity
Shipments
• Origin-destination• Connections• Transit• Aircraft type• Containers• Door size• Commodity• Terminal hours• Temperature
Compatibility Routes
LAX-NRTA2A
2,000 pds4 LD3s
Electronics
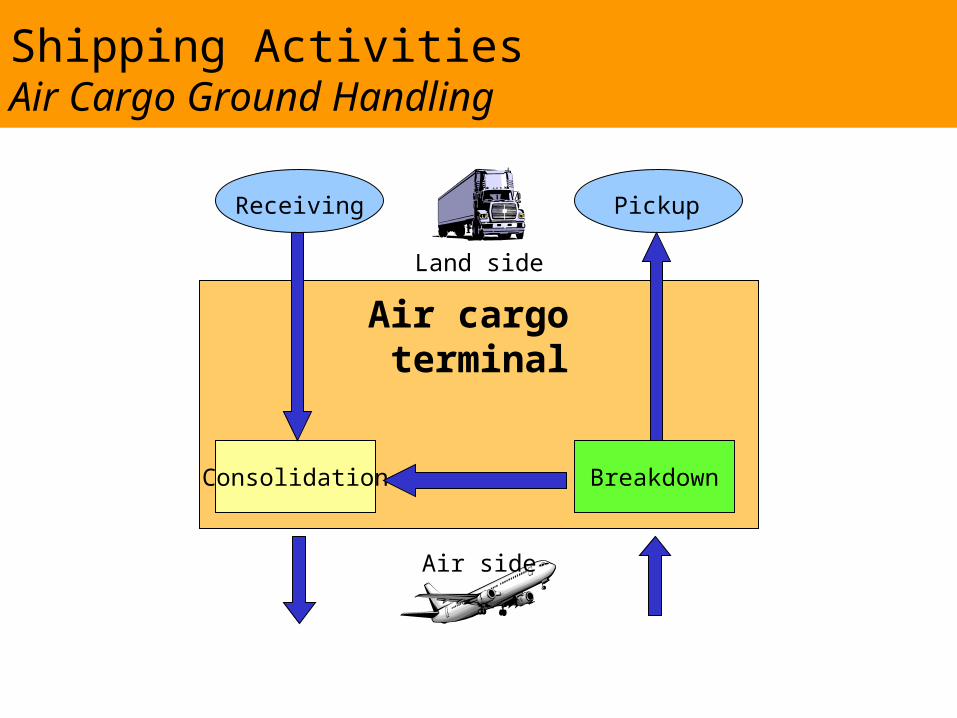
Shipping ActivitiesAir Cargo Ground Handling
Land side
Receiving
Air side
Consolidation Breakdown
Air cargo terminal
Pickup
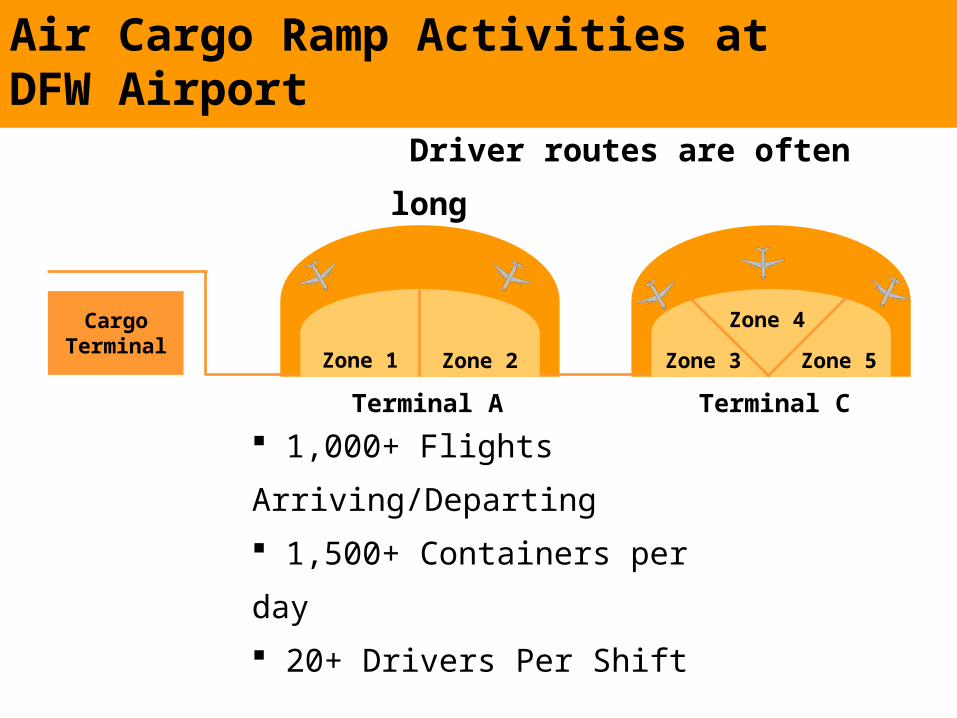
Air Cargo Ramp Activities at DFW Airport
Cargo Terminal
1,000+ Flights Arriving/Departing
1,500+ Containers per day
20+ Drivers Per Shift
Zone 1 Zone 2 Zone 3
Zone 4
Zone 5
Terminal A Terminal C
Driver routes are often long