Embed Size (px)
Citation preview

DO MORE MERGERS AND ACQUISITIONS CREATE VALUE
FOR THE FIRM?
A thesis submitted for the degree of Doctor of Philosophy
by
Shaomeng Li
School of Social Science
Brunel University
January 2015

Abstract
This thesis is aimed to empirically investigate the performance impact of
frequent acquisitions as an aggressive merger and acquisition (M&A) strategy for an
acquiring firm. In literature related to the study of M&A, a common question is whether
acquisitions improve the performance of acquirers. Neither theoretical nor empirical
studies have a clear view on the performance effect of M&A. Some argue positively and
some are opposite. Although existing research are mixed for their arguments, a takeover
is commonly perceived as a shock to the firm with a constant effect on changing
business performance. This static perception of M&A creates a difficulty in explaining
why firms acquire others when the performance effect is negative. To address the issue,
this thesis examines the M&A effect dynamically with taking into account the role of
merger frequency in affecting performance.
On the basis of a large sample that consists of about 14,000 acquisitions from
more than 100 countries over last 12 years, the thesis finds that the investors perceive a
lower value if the acquiring firm is involved in frequent mergers. This is because more
mergers are expected to attract considerable amount of management attention away
from profitable activities in order to digest the challenges of new business integration at
least in the short run. This “digesting constraint” argument is evident by our estimations.
Firm becomes less profitable in the short run after a merger shock, and this adverse
effect can be more severe if the firm is involved in more frequent mergers.
Evidence of the thesis further show that, the effect of merger shocks is not static
and persistent, and it changes with time. The shock affects adversely profitability in the
short run, usually lasting a couple of years, and then the negative effect on performance
could be turned either oppositely if the firm digests the shock successfully, or otherwise,
continuously but diminishing over time if the digestion takes longer such as for frequent
acquisition. This finding implies that the pace of firm resilience to a merger shock can
be affected by its merger strategies. The pace can be slow if the firm pursues frequent
mergers aggressively.
The performance effect of a merger shock is dynamic and changes with time.
The dynamic view for merger shocks from this study opens a new vision for literature in
merger studies. Overall the market expectation to a merger effect on changing firm
performance is quite consistently related to what has actually happened to the firm after
the merger shock.

Acknowledgements
First and foremost I am in debt to my supervisor Professor Guy Liu for his
continuous support to my doctoral study and research and his patience during tough
time in my Ph.D. pursuit. His guidance helped me in all the time of research and writing
of this thesis. I could not have imagined having a better advisor and mentor for my Ph.D.
study.
Besides my advisor, I would also like to express my sincere gratitude to Dr.
Bryan Mase, Dr. Ding Wang and Dr. Siming Liu for their support and comments.
Last but not the least, I would like to thank my wife, Aimin Ni and my parents.
1
Table of Contents
1. Introduction ...................................................................................................................... 4
1.1. General concept and development of merger and acquisition .......................................4
1.1.1. The type of M&As .................................................................................................4
1.1.2. Development of M&A ...........................................................................................5
1.2. Research Context ...........................................................................................................6
1.2.1. Background ............................................................................................................6
1.2.2. Motivation and Aims .............................................................................................9
1.3. Research method ..........................................................................................................10
1.3.1. Event-study approach ...........................................................................................10
1.3.2. Panel data estimation ...........................................................................................11
1.3.3. Data ......................................................................................................................11
1.4. Major Contributions .....................................................................................................12
1.4.1. Chapter 2 ..............................................................................................................12
1.4.2. Chapter 3 ..............................................................................................................13
1.4.3. Chapter 4 ..............................................................................................................13
1.5. Thesis structure ............................................................................................................14
1.5.1. Introduction (Chapter 1) .......................................................................................14
1.5.2. Short-term univariate analysis (Chapter 2) ..........................................................14
1.5.3. Short-term multivariate analysis (Chapter 3) .......................................................15
1.5.4. Long-run empirical analysis (Chapter 4) .............................................................16
1.5.5. Conclusion (Chapter 6) ........................................................................................17
2. Do more mergers and acquisitions create value for shareholders? A univariate
analysis .................................................................................................................................... 18
2.1. Introduction ..................................................................................................................18
2.2. Literature review ..........................................................................................................21
2.2.1. Theory ..................................................................................................................21
2.2.2. Empirical evidence of frequent acquisition ..........................................................26
2.2.3. Empirical evidence of other determinates on merger impact ...............................30
2.3. Research setup .............................................................................................................34
2.3.1. Define performance measurement: abnormal returns ..........................................34
2.3.2. Define merger frequency for acquiring firms ......................................................39
2.3.3. Empirical predictions ...........................................................................................41
2.4. Data ..............................................................................................................................43
2.5. Empirical results ..........................................................................................................49
2.5.1. The impact of frequency on announcement returns .............................................49
2
2.5.2. The impact of frequency on subsequent acquisition performance .......................51
2.6. Robustness check .........................................................................................................54
2.6.1. Robustness tests for merger frequency by deal-characteristics ............................54
2.6.2. Robustness tests for merger frequency by firm-characteristics ...........................57
2.6.3. Robustness test for merger frequency by economic concerns .............................60
2.6.4. Robustness test for subsequent acquisitions ........................................................61
2.7. Conclusions ..................................................................................................................63
Appendix A .............................................................................................................................. 65
Appendix B .............................................................................................................................. 67
Appendix C .............................................................................................................................. 69
3. How does frequent acquisition affect the market expectation of performance changes
after acquisition? The role of merger quantity and time interval ..................................... 70
3.1. Introduction ..................................................................................................................70
3.2. Literature review ..........................................................................................................72
3.2.1. Theory ..................................................................................................................72
3.2.2. Empirical evidence ...............................................................................................74
3.3. A brief review of merger activities and announcement returns for infrequent and
frequent acquirers in the past ...................................................................................................78
3.4. Model specification and variables ................................................................................82
3.4.1. Specification of model .........................................................................................82
3.5. Specification of variables .............................................................................................84
3.5.1. Announcement returns .........................................................................................84
3.5.2. Merger frequency .................................................................................................86
3.5.3. Control variables ..................................................................................................88
3.6. Data ..............................................................................................................................89
3.7. Empirical evidence and discussions .............................................................................92
3.7.1. The impact of merger frequency ..........................................................................92
3.7.2. The impact of control variables ...........................................................................95
3.8. Robustness checks .......................................................................................................99
3.9. Conclusions ................................................................................................................109
Appendix A ............................................................................................................................ 111
Appendix B ............................................................................................................................ 114
4. The effect of merger shocks on firm fundamentals: a dynamic estimation ............ 116
4.1. Introduction ................................................................................................................116
4.2. Literature review ........................................................................................................119
4.2.1. Theoretical background ......................................................................................119
4.2.2. Empirical evidence .............................................................................................124
4.3. Model specification ....................................................................................................129

3
4.3.1. A dynamic panel model for firm operating performance ...................................130
4.4. Variable construction, data source and sample ..........................................................133
4.4.1. Merger frequency ...............................................................................................134
4.4.2. Dependent variable ............................................................................................137
4.4.3. Control variables ................................................................................................137
4.4.4. Data and sample selection ..................................................................................140
4.5. Estimation results: from “need to chew” to “chew to change” ..................................146
4.5.1. Effects of merger shocks and frequency on profitability ...................................146
4.5.2. Effects of controls ..............................................................................................151
4.5.3. Effect of merger shocks on profitability for different expected merger shock-
lasting time .........................................................................................................................152
4.6. Robustness checks .....................................................................................................155
4.6.1. How long will the shock last? ............................................................................155
4.6.1. Labour productivity............................................................................................161
4.6.2. Cash-based measure ...........................................................................................161
4.6.3. Additional sensitive checks ................................................................................162
4.7. Conclusions ................................................................................................................165
Appendix A ............................................................................................................................ 166
Appendix B ............................................................................................................................ 169
Appendix C ............................................................................................................................ 170
5. Conclusions ................................................................................................................... 171
5.1. Findings and contributions .........................................................................................171
5.2. Recommendations for future research .......................................................................174
5.3. An exception in practice ............................................................................................175
5.4. Implications ................................................................................................................176
Appendix A ............................................................................................................................ 177
References ............................................................................................................................. 178

1
List of Tables
Table 2-1. Sample statistics of 14,103 takeovers from 2000 to 2010. .........................................46
Table 2-2. Sample statistics for payment method, target ownership and types of acquiring firms
.....................................................................................................................................................48
Table 2-3. Cumulative abnormal returns for infrequent, frequent and highly frequent across
different time interval ..................................................................................................................51
Table 2-4. Cumulative abnormal returns by the deal order and different average temporal
intervals between deals ................................................................................................................53
Table 2-5. Cumulative abnormal returns sorted by infrequent, frequent and highly frequent
acquirers based on the target ownership (Panel A) and payment method (Panel B). ..................56
Table 2-6. Cumulative abnormal returns sorted by infrequent, frequent and highly frequent
acquirers based on P/E ratios .......................................................................................................58
Table 2-7. Cumulative abnormal returns sorted by infrequent, frequent and highly frequent
acquirers based on the relative acquisition size ...........................................................................59
Table 2-8. Cumulative abnormal returns sorted by infrequent, frequent and highly frequent
acquirers based on economic concerns ........................................................................................60
Table 2-9. Cumulative abnormal returns for infrequent, frequent and highly frequent acquirers
firms associated with the initial success across deal order .........................................................61
Table 2-10. Robustness checks for cumulative abnormal returns based on deal order across
different comparative controls .....................................................................................................62
Table 3-1. Summary of early empirical research on merger frequency by using multivariate
approach .......................................................................................................................................74
Table 3-2. Example of serially coding for the three measures of merger frequency....................87
Table 3-3. Summary statistics of merger frequency and firm characteristics ..............................91
Table 3-4. Correlation matrix.......................................................................................................93
Table 3-5. The effect of merger frequency on stock performance of acquirers ...........................98
Table 3-6. The effect of 4-year merger frequency on stock performance of acquirers ................99
Table 3-7. The effect of merger frequency on acquirer stock performance across different
economies ..................................................................................................................................103
Table 3-8. Empirical results across US and EU countries .........................................................106
Table 4-1. Illustration of computing merger frequency under different shock-lasting time ......136
Table 4-2. Distribution of sample acquiring firms across countries ..........................................142
Table 4-3. Summary statistics of mean of merger frequency and firm characteristics ..............143
Table 4-4. Correlations between measures ................................................................................145
Table 4-5. Estimation of effect of merger frequency. (Aggregate sample) ...............................149
2
Table 4-6. Estimation of effect of merger frequency on single and multiple acquirers .............150
Table 4-7. Estimation of effect of merger frequency over different lengths of expected merger
shock-lasting time ......................................................................................................................153
Table 4-8. The lasting effect of a merger shock ........................................................................156
Table 4-9. Estimation of effect of merger frequency on labor productivity ..............................159
Table 4-10. Estimation of effect of merger frequency on firm labor productivity for single and
multiple acquirers .......................................................................................................................160
Table 4-11. Estimation of effect of merger frequency on firm cash flow returns on assets ......163
Table 4-12. Estimation of effect of merger frequency on cash flow returns on assets for single
and multiple acquirers ................................................................................................................164

3
List of Figures
Figure 2-1. The relationship between CARs and the time interval ..............................................54
Figure 3-1. Comparison of the number of acquisitions: infrequent, frequent and highly frequent
acquirers .......................................................................................................................................80
Figure 3-2. Cumulative abnormal returns (CAR) across acquirers and number of mergers........81
Figure 4-1. How the effects of merger shocks on performance gradually change over the lengths
of expected merger shock-lasting time ......................................................................................155
Figure 4-2. How long does the performance effect of a merger shock last? ..............................158
4
1. Introduction
1.1. General concept of merger and acquisition
The compacting globally drives companies to grow rapidly, to act efficiently and
effectively, to be profitable and to develop a competitively dominant position in the
world. As a result, the mergers and acquisitions are inevitable for corporations to pursue
in order to restructure a more competitive business for growth.
1.1.1. The type of M&As
Merger and acquisitions (M&As) are often classified as horizontal, vertical and
conglomerate mergers. A horizontal merger and acquisition occurs when two
corporations in similar lines of business or competitors combine. In general, horizontal
merger causes the combined firm to obtain synergy and increases the market power by
merging and acquiring related business. Apart from this, firms can also benefit both
economies of scale and diversification by providing different products or services for
risk reduction.
Vertical mergers are a combination of companies involved in different levels of
production or business for producing a good. Combined companies usually have a
buyer-seller relationship. The main reason for vertical merger, by directly merging with
suppliers, is to increase synergies, decrease reliance and increase profitability. In
general, vertical M&As can be classified into two types. Firstly, a backward vertical
merger, which usually refers to the purchase of suppliers of the raw material in the chain
of production and attempts to achieve production cost-saving and efficiency
improvement. Secondly, a forward acquisition, which is usually a takeover of the
acquirer’s consumer and attempts to reduce marketing and delivering costs.

5
Conglomerate acquisition will create a combination of companies that have
different or unrelated fields of business, which extends and diversifies an acquiring
firm’s product mixes (Mueller, 1977). In addition, Brealey et al. (2006) suggest that this
type of M&A is the least popular one. The main motive for conglomerate M&A is
efficient capital allocation and to enter a new emerging market to seek diversification of
risks (Marks and Mirvis, 1998).
1.1.2. Development of M&A
There are six periods of intense merger activity, which are often called merger
waves, driven by prevailing business growth imperatives since 1893 (e.g., Mitchell and
Mulherin , 1996; Brealey and Myers, 2003).
The First Wave (1893-1904) included many horizontal mergers, creating many
giants of the manufacturing and transportation industries in the US. Stigler (1950)
described this as a wave of monopoly and oligopoly by merger. The wave stopped due
to World War I. The Second Wave (1919-1929), was a wave of vertical merger and
further consolidation in the principal industries formed by the First Wave, which was
triggered by the application of radio technology and the development of automotive
manufacturers. The Third Wave (1955-1970) was a wave of diversified conglomerate
mergers, which mainly occurred between US firms and helped firms to enter a new
market. This wave is ended because of the stock market crash in the early 1970’s. The
Fourth Wave (1974-1989) was an era of co-generic mergers, hostile takeovers and
corporate raiders, which is also named the “highly leveraged takeovers” era. This era
ended with the collapse of banks. The Fifth Wave (1993-2000) was the era of cross-
border mergers. The rise of globalization has exponentially increased the competition,
therefore, this era emphasized larger economies of scale and global economics to
achieve competitive advantage in the global market. The fifth wave came to an end with
6
the bursting of the “Millennium Bubble”. The Sixth Wave (2003-2008) was the era of
globalization, private equity and shareholder activism.
1.2. Research context
1.2.1. Background
Several decades ago, mergers and acquisitions1 seldom dominated the headlines
as much as at present. It has been widely documented that nowadays many economies
(e.g. USA) have witnessed a dramatic increase in merger activities. This is because of
M&As, as an important strategy for business growth, are increasingly influential for
corporations. A glance at existing literature indicates substantial mergers and
acquisitions in a wide range of sectors, such as finance, steel, pharmaceuticals and gas.
An increase in M&A activity is often referred to either a wave of merger or
merger clustering in the literature. Several waves of M&As have led to substantial
industrial restructuring in different parts of the world. According to data from Thomson
One Banker, aggregate transaction value has sharply increased from £1.95 billion in
1968 to £2,354 billion in 2013. Over the past decades the USA, UK and Continental
Europe have made their FDI predominantly through cross-border M&As rather than
greenfield investment. In addition, emerging countries, such as China and India, have
witnessed a rapid growth of market for corporate control, taking up roughly 30% of
overall global M&As in 2013.
Mergers and acquisitions decisions are critical to the success of corporations. In
a dynamic economic environment, acquiring firms are often faced with strategic
decisions concerning growth by acquisitions, or by internal investment. After all,
1 Mergers and acquisitions are both aspects of strategic management, corporate finance and management dealing with
the buying, selling, dividing and combining of different companies and similar entities that can help an enterprise
grow rapidly in its sector or location of origin, or a new field or new location, without creating a subsidiary, other
child entity or using a joint venture. Mergers and acquisitions activity can be defined as a type of restructuring in that
they result in some entity reorganization with the aim to provide growth or positive value.
7
through those takeovers, a decision maker is able to develop a competitive advantage
and ultimately increase and maximize (at least in theory) the actual benefits generated
by takeovers to improve company fundamentals. Many acquiring firms realize that
M&As could be an efficient way to expand ownership boundaries, create corporate
synergies, gain economies of scale, expand operations and reduce production costs. In
theory, the effects of M&A are controversial for changing firm performance. In practice
also, experiences are unclear. Literature suggests that many of mergers were
disappointing since the motivations behind the takeover were probably flawed, and
efficiency and synergy gains from economics of scale were somewhat ambiguous.
Empirical evidence has provided many possible M&A motivations, which can
be briefly summarized as follows: resource-seeking, technology-seeking, market-
seeking, diversification-seeking and asset-seeking (Andrade et al., 2001; Deng, 2004).
Even though different companies have various reasons for engaging in mergers and
acquisitions, the main purpose is to improve shareholders’ value or firm fundamentals
over and above that of the sum of two companies (Sudarsanam, 1995). Therefore,
finance scholars have primarily focused on study of the issue of whether acquisitions
are wealth creating or wealth reducing events for the acquiring firm.
The predominant focus of literature has focused on individual acquisitions and
their performance implications. Many studies just simply and deliberately eliminate
firms that undertook frequent acquisitions which may confoundingly occur during the
pre- or post-acquisition window of a focal takeover. However, this would be
problematic. Extensive empirical studies (e.g. Fuller et al., 2002; Conn et al. 2004;
Ismail, 2008), which attempt to explain the causes and effects of takeovers on
performance of acquiring firms, suggest that a large share of global acquirers has carried
out multiple acquisitions during a specific short period, some of them even within the
same year. When an acquirer performs frequent acquisitions, the overall impact of those

8
takeovers on its performance could not be attributed to the characteristics of
individual/single merger case.
Although frequent mergers have become an increasingly important strategy
widely adopted by firms, there is little evidence reported on how a frequent-merger
strategy affects firm performance. For instance, from the short-run perspective, Conn et
al. (2004) found a negative impact when the acquiring firms pursue frequent
acquisitions. In contrast, Fowler and Schmidt (1989) suggest that frequent acquisition
could enhance acquirer’s expertise in M&As, which improves merger performance.
From a long-run perspective, it is found that most of the existing work is either
theoretical, based on game theory models (e.g., Nilssen and Sorgard, 1998; Fumagalli
and Vasconcelos, 2009), or just pursuing simple statistical tests, except for a few papers
that have explored this issue theoretically from the empirical corporate finance
perspective. For, instance, Capron (1999) suggests a positive relationship between
merger frequency and acquirer’s performance in the long-run, in contrast to the
prevalent view of the negative relationship (See for example, Bertrand and Betschinger,
2012).
In the existing studies, there are many limitations. For instance, Kusewitt (1985),
Fowler and Schmidt (1989), Conn et al.(2004), Billett and Qian (2008) and Laamanen
and Keil (2008) show some limitations in their studies, such as geographically biased
samples, missing account of the effect of a time interval between takeovers or merger
shocks in the estimation, only focusing on the market reaction; failure to find out the
actual benefit of frequent acquisition and the link between it and investor expectation;
and at least in the case of Conn et al. (2004) an inappropriate model specified for
estimation. Overall, these limitations call for further research.
9
1.2.2. Motivation and aims
The main focus of the thesis is on the theme of “does an aggressive merger
strategy with frequent acquisitions outperform the infrequent strategy for acquiring
firms”. In particular, it aims to examine a) how the different acquisition frequency
patterns of acquirers affect their performance; b) whether the time interval between
mergers or merger shocks can affect the relation between merger shocks and the post-
merger performance; c) whether acquisitions by frequent acquirers have more favorable
impacts on the performance of acquiring firms than do single takeovers.
There are three reasons for this choice of topic. Firstly, to gain a thorough
understanding of frequently acquisitive behaviour and its impact on company
performance. This understanding will help firms to develop either a short-run or a long-
run acquisition strategy for growth, and also help investors to re-evaluate companies
that become addicted to acquisition.
Secondly, although the effect of mergers on firm’s performance has drawn a
large amount of attention, relatively few published studies that associated with frequent
acquisition could be found. So far, there is a lack of empirical research in the nexus
between a frequently acquisitive strategy and acquirer’s performance: this thesis aims to
fill in the gap.
Thirdly, scholars in financial studies have a high concentration of interest in the
USA, UK or any other single market (Cartwright, 2005), while few studies use
worldwide sample of data for M&A studies.
10
1.3. Research method
1.3.1. Event-study approach
The thesis starts with an event-study chapter which explores the effect of merger
frequency on performance by looking at the announcement effect of M&A on investors’
perception on acquiring firm’s value. The methodology of event study is widely applied
to pursue this investigation. Generally, this methodology assumes that the market is
informatively efficient, and price changes could effectively reflect new information. In
merger and acquisition research, the events are assessed by a change in stock price
during the period in which the event occurs.
The thesis follows the mainstream studies (e.g. Fuller et al., 2002; Conn et al,
2004) and takes the simplified method to evaluate impact of a merger announcement.
The cumulative abnormal return (CAR) cumulates abnormal returns (ARs) over a
“window” period or days around the event date which is set to be the date of
announcement of an M&A event. The CAR is calculated as follows:
𝐶𝐴𝑅𝑖(𝑇1−𝑇2) = ∑ 𝐴𝑅𝑖𝑡
𝑇2
𝑇1
= ∑ (𝑅𝑖𝑡 − 𝑅𝑚𝑡)
𝑡=𝑇2
𝑡=𝑇1
To investigate the sensitivity of the empirical results to different lengths of event
window, this study first employed a 5-day event window which is commonly applied by
existing studies (e.g. Faccio et al., 2006; Boubakri et al., 2012; Gaur, et al., 2013). To
reduce the probability of capturing confounding events in CAR calculations, the event
window was reduced from five days to three days to conduct the robustness checks.
11
1.3.2. Panel data estimation
The panel data estimation is applied to examine the static relation between
announcement returns and merger frequency and the dynamic effect of merger shocks
on firm fundamentals. With a panel estimation, econometric issues relating to the
specific effect such as unobserved heterogeneity and endogeneity, which may arise from
the estimation of the relation between merger frequency and firm performance, have
been thoroughly explored in various chapters.
To make potential econometric concerns less severe and full use of the available
rich dataset, the Least Square Dummy Variable (LSDV) and the system generalized
method of moments (GMM) panel estimators are applied. These techniques are further
complemented by various robustness checks to ensure that the empirical results of the
respective approaches are consistently estimated.
1.3.3. Data
Compared to the existing studies, the dataset used in this thesis are substantially
larger than those found in published M&A studies, and are more internationally
representative. This allows a detailed analysis of the role that merger strategy or merger
frequency plays. The dataset includes the most up to date and comprehensive worldwide
firm-level data, which consists of two parts.
Firstly, the acquisition data used for both univariate and multivariate analysis are
collected from the Securities Data Corporation (SDC)’s Global Mergers & Acquisitions
database. All sample acquisitions are announced and completed during the period from
January 1, 2000 to December 31, 2010. The dataset covers a larger amount successful
acquisitions and tender offers of public, private and subsidiary target firms. All

12
acquiring firms included in the dataset are public companies. After a filtering process,
the acquisition dataset ends up with more than 6,800 unique firms undertaking over
14,000 takeover transactions throughout 117 countries with a total transaction value of
$4.49 trillion. Secondly, an accounting and a stock dataset of acquirers based on the
merger dataset discussed above are used. The accounting information was retrieved
from the Thomson Financials and Worldscope database. The stock data were obtained
from Datastream,
1.4. Major contributions
The section is a brief summary of the major contributions in the thesis.
1.4.1. Chapter 2
The contribution of this chapter to the existing literature is threefold. Firstly, this
chapter examines the impact of the merger frequency on the acquirer’s performance by
using a large and diverse sample of 14,103 takeover deals worldwide. Secondly, it
contributes to the existing literature on corporate finance by distinguishing the creation
of synergy, and division of gains between acquirers with different merger frequencies.
Thirdly, it extends M&A literature by recording that the greater negative effect on the
announcement returns usually appears in subsequent deals for acquirers associated with
higher merger frequency. Significantly, it shows that the negative effect of a merger on
performance becomes lower when the time intervals between subsequent deals are
longer.
13
1.4.2. Chapter 3
This chapter makes four significant contributions to the existing literature on
corporate merger strategy. Firstly, the study develops a new method of defining the
merger frequency that interacts the number of mergers with the time that a merger effect
may last after the event occurrence. Secondly, this study adds to the literature on how
acquisitions affect the acquiring firm’s stock performance in both the temporal and
quantitative perspectives. Thirdly, it builds upon studies about the different implications
to relationship between the aggressiveness of merger strategy and market expectation.
Fourthly, a new argument is posited that the larger deal size produces a more positive
impact on performance improvement for the acquiring firms due to the risk pressure on
management.
1.4.3. Chapter 4
The research design developed in this chapter enables four new contributions to
the literature. Firstly, this chapter is innovative because it systematically analyzes the
operational performance implications of the frequent acquisition by employing a large
global sample of acquiring companies. Secondly, this chapter introduces a new
argument that the number and time of a merger shock matter simultaneously for the
fundamental performance of the acquiring firm. Thirdly, it contributes to the literature
by distinguishing effects between frequent acquirers and single acquirers: an area
neglected in the literature. Fourthly, it extends the existing digesting theory (McCarthy,
1963) and the chewing theory (Kusewitt, 1985) into a dynamic context. It argues that
the effect of merger shocks or frequency changes with time. As a result, the existing
process of “Need to Chew” needs to be followed by a new process “Chew to Change”.
McCarthy (1963) suggests that the presence of the clash of cultures and conflicts of
objectives between the acquirer and the acquire leads to inefficiency in digestion and

14
absorption of the “nutrition”. Kusewitt (1985) refers to this indigestion issue as “biting
off more than you can chew”. Both of these arguments suggest that the negative effect
of merger frequency is attributable to the number of acquisitions. However, when time
is taken into account in the process of digestion, the longer process helps the firm to
gradually absorb the shocks of frequent acquisition, and then allows it to gain more
corporate synergies for business operation.
1.5. Thesis structure and highlights
This thesis consists of five chapters as shown below.
1.5.1. Introduction (Chapter 1)
This chapter includes the background, research motivation and aims, research
methods, major contributions and arguments and outlines the structure of the research
thesis.
1.5.2. Short-term univariate analysis (Chapter 2)
Chapter 2 seeks to examine the effect of merger frequencies on the expectation
of investors to the integration of new business for their performance in the future. Given
this objective, the chapter focuses on performance assessment from an investment
perspective.
By using a sample of 14,103 acquisitions collected from different countries over
11 years from 2000 to 2010, a univariate analysis is delivered to explore the effects of

15
frequent acquisition on announcement returns for three groups of acquirers: infrequent,
frequent and highly frequent acquirers. The comparative results of announcements show
that the low frequent acquirers outperform the highly frequent ones, in which this
finding is consistent and robust across different time lengths, different regions, different
time periods, different ownerships of target firms, different size of deals and different
payment methods made by acquirers.
The significant findings of this chapter provide clear evidence on which the
acquiring managements or firms have developed the hubris from their previously
successful experiences on mergers and acquisitions. The development of hubris with
more mergers drives down the expectation of investors for better performing in the
future of the new integration and so lowering the value of the firm. Although the
acquiring managements are expected to have declined performance after their first deal
or second deals of mergers due to growing hubris in M&A, this does not mean that the
management learning effect will be rejected. The chapter shows evidence about the
learning effect that drives up the market expectation for the future improvement of new
integration if the time interval between the two mergers pursued by the acquiring firm is
longer.
1.5.3. Short-term multivariate analysis (Chapter 3)
This chapter aims to extend the existing studies of the frequent acquisition by
using a more internationally representative sample with control of firm specific fixed
effects, but also by defining merger frequency in terms of how merger effect can last, in
the short-term, medium-term or long-term. Splitting frequency into these three terms
enables interaction between time interval and frequency as a joint effect for estimations
of how frequency affects stock performance in two dimensions: number and time.

16
Based on multivariate approach, it is found that if the number of merger
repetitions presents “hubris”, then it is expected that the frequency is negatively related
to the market performance of acquiring firms. For a given number of mergers, if the
length of time after the event occurrence reflects the amount of learning time which the
management needs to digest opportunities and changes from new integrated business for
more learning, then the longer time of an event repeating is expected to be positively
related to performance. However, the estimation in this chapter of the interaction of
frequency with time shows that the two managerial behaviours co-exist and offset each
other.
In addition, the study shows that the larger size of a merger has a positive effect
on performance. This supports the argument about “risk pressure” on the management
of the acquiring firm. The estimation results are robust in two senses: firstly, controlled
firm fixed effects in estimation, and secondly, a larger sample provides the consistency
of estimation across different economies.
1.5.4. Long-run empirical analysis (Chapter 4)
The final empirical chapter starts with a question: Can market expectation of
merger events on the announcement time be consistent with what would happen to a
firm’s operational performance in a later period? This chapter focuses on how the
operational performance changes as an acquirer makes a different frequency of
acquisition in a different time interval. If the acquiring firm can properly digest acquired
assets and absorb “nutrition” from those assets, then the profitability of the acquiring
firm will be improved, or at least, not damaged.

17
In Chapter 3, it is found that the investors perceive a lower value if the acquiring
firm is involved in frequent mergers. This is because more mergers are expected to
attract a considerable amount of management attention away from profitable activities
in order to digest the challenges of new business integration at least in the short run.
This “digesting constraint” argument is evident in the estimations reported in this
chapter. Firms becomes less profitable in the short run after a merger shock, and this
adverse effect can be more severe if a firm is involved in more frequent mergers.
Evidence in this chapter also shows that the effect of merger shocks is not static
and persistent, and it changes with time. The shock adversely affects profitability in the
short run, usually lasting a couple of years, and then the negative effect on performance
could be turned either oppositely, if the firm digests the shock successfully, or
continuously but diminishing over time if the digestion takes longer such as for frequent
acquisition. In sum these findings imply that the pace of firm resilience to a merger
shock can be affected by its merger strategies. The pace can be slow if the firm pursues
frequent mergers aggressively.
1.5.5. Conclusion (Chapter 5)
The last chapter summarizes the major findings and contributions of the thesis,
its limitations, and provides recommendations for future research. Having presented the
structure of the thesis, the next chapter will provide an event study on the impact of
merger frequency through a univariate analysis.
18
2. Do more mergers and acquisitions create value for
shareholders? A univariate analysis
2.1. Introduction
Merger and acquisitions (M&A) are strategically important for firms to grow.
Some firms engage in frequent merger and acquisition and some do not. From the
perspective of performance improvement, it is important to consider if growth by
merger and acquisition outperforms growth without M&A activities or if more
acquisitions produce better performance. Existing literature can be summarized, firstly,
according to the impact of M&A on announcement returns, and secondly, on changing
the fundamentals of an acquiring firm. For the first school of studies about the impact
of M&A on announcement returns, it is evident that the market responds to the merger
announcement positively (Fowler & Schmidt, 1989; Mulherin and Boone, 2000;
Andrade et al. 2001; Moeller et al., 2004). These papers take an event study approach
to examine a change in the market-perceived value of the acquiring firm from pre-
announcement of the M&A to post-announcement of the event. These event-studies
identify a positive change. Based on their evidence, can this study extends that the
positive experience of M&As on improving performance of acquiring firms will result
in higher announcement returns with more and more frequent M&As?
19
Fuller et al. (2002) note that frequent acquirers are able to release more
information about their own characteristics to the public due to repetitive corporate
activities in the market. The released information is helpful because it causes the stock
market to perceive or expect the future stock returns that can be delivered or improved
by acquiring firms. This suggests that stock market reaction to a frequent acquirer may
be different from the stock market reaction to an infrequent acquirer. Indeed, following
Fuller et al. (2002), Ismail (2008) analyses a sample of 16,221 US takeovers between
1985 and 2004 and finds that single acquirers outperform frequent acquirers. However,
Ismail (2008) limited his research to the US market.
This chapter examines the effect of merger frequency on the expectation of
investors about the integration of new business for their performance in the future.
Given this objective, the chapter focuses performance assessment from an investment
perspective. If acquisition announcements are positively perceived by investors, then
the announcement returns for acquiring firms will rise, at least in the short run. In order
to examine the of the relation between acquisitions and announcement returns in the
worldwide context, a large sample is collected from different countries, which includes
6,836 acquirers and 14,103 takeovers during the period 1st January 2000 to 31st
December 2010. Among 6,836 acquirers, 2,842 carried out more than one acquisition
across the sample span. The sample used in this chapter consists of public acquirers
that have acquired $4.49 trillion worth of foreign and domestic companies over the
sample period. It is worth noting that there are few existing studies, which use global
data.
20
Following Fuller et al. (2002) and Billett and Qian (2008), merger frequency is
defined as the number of acquisitions undertaken by an acquirer during a specific time
horizon in this study. Given this definition, acquiring firms are classified according to
infrequent, frequent and highly frequent M&A activities. Infrequent activity is defined
as an acquiring firm that has acquired only one firm over the time period of an
observed window. In contrast, frequent activity is defined as an acquirer that has
pursued 2-4 M&As, and the highly frequent activity is defined as an acquirer that has
pursued five or more than five M&As during the time period.
This study begins by comparing bidder’s Cumulative Abnormal Returns (CARs)
with the firm’s acquisition frequency at one day surrounding the announcement time.
Four distinct results are identified. Firstly, the merger frequency is negatively related to
acquirer’s stock performance. Secondly, the cumulative abnormal returns diminish in
subsequent deals. More particularly, the diminishing pattern is more marked for
bidders with a higher frequency of mergers. Thirdly, past takeovers affect CARs in a
timely fashion because very short temporal intervals between mergers may not be long
enough for acquirers to learn from the past experience and inferences. Fourthly, the
size of acquisition or deal size matters for the cumulative abnormal returns. The
infrequent and frequent acquirers gain higher CARs in the larger size than in the
smaller size. These findings imply that the management of acquiring firms is perceived
to develop their hubris from the previous success in M&As.
The contribution of the study to the existing literature is three fold. Firstly, this
chapter makes a new attempt to examine the impact of the merger frequency on the

21
acquirer’s performance by using a sample of 14,103 takeover deals worldwide.
Secondly, it contributes to the existing literature of corporate finance by distinguishing
the creation of synergy, and division of gains between acquirers with different merger
frequencies. Thirdly, it extends M&A literature by recording that the greater negative
effect on the announcement returns usually appears in subsequent deals for acquirers
associated with higher merger frequency. However, this negative effect becomes lower
when the time intervals between subsequent deals are longer.
The chapter is organized in four sections. Section 2.2 reviews the related
empirical evidence and the theoretical literature on the performance of frequent
acquirers. Section 2.3 and 2.4 state research setup and data. Section 2.5 presents the
empirical results. Section 2.6 presents robustness checks. Section 2.7 concludes.
2.2. Literature review
2.2.1. Theory
Current literature explores how past deals influence current acquisition (Bower
and Hilgard, 1981) and how the accumulated experience of firms on acquisition can
enhance management's acquisition expertise (Kusewitt, 1985; Fowler and Schmidt,
1989; Bruton et al. 1994; Barkema et al. 1996; Ashkenas et al., 1998; Hitt et al., 1998).
These studies find that an acquirer with a higher merger frequency will experience a
positive impact on performance. Specifically, they argue that later acquisitions can
generate higher cumulative abnormal returns than earlier acquisitions. Fowler and
Schmidt (1989) and Bruton, Oviatt and White (1994) study the CARs associated with
22
acquisition announcements. They find that the acquiring firms’ prior experience of
mergers is a predictor of success in subsequent acquisitions. In summary, acquirers
with a lot of experience are likely to succeed.
This finding can be linked with the Organizational Learning Hypothesis.
Argyris and Schon (1978) were the first to develop the Organizational Learning
Hypothesis. The argument is that the number of acquisitions positively influences
performance and the returns will rise with the number of acquisitions over time. That is,
an experienced acquirer would be more successful than the less experienced in M&As.
The organizational learning theory also suggests that the learning impact of any takeovers
on acquiring firm performance would be related to how many acquisitions that have been
carried out previously, have the same characteristics as the current one. Conn et al. (2004)
follow the argument and state that firms making multiple acquisitions are expected to
improve their absorptive capacity for innovative change (Cohen and Levinthal, 1990)
and to choose more efficient investment (Vermeulen and Barkema, 2001). In 2008,
Laamanen and Keil (2008) further point out that frequent acquirers would potentially
become superior performers because more acquisition experience can lead to more
success in subsequent deals.
Fuller et al. (2002) give the empirical evidence in support of the organization
learning argument. They find higher CARs for more frequent acquisitions of private
target firms based on a sample of acquisition announcements between 1990 and 2000.
An acquirer firm can learn valuable lessons from the repeated process of mergers and
integration (Paine and Power, 1984; Amburger and Miner, 1992 and Pablo, 1994).
23
They gain increasingly market power from more acquisitions (Conn et al., 2004), and later
or subsequent acquisitions will perform better than earlier ones (Vermeulen and Barkema,
2001). They argue for a correlation between the number of acquisitions and the success of
the outcome. The later the occurrence in the deal order position in the sequence of
acquisitions then the more successful the acquirers' performance. In a follow-up piece,
Kamien and Zhang (1993) turn to the effect of endogenous mergers, defined as a
merger and acquisition that occurs between identical firms selling a homogeneous
product. They argue that, if a firm makes a series of endogenous mergers, the firm may
monopolize the industry. As a result, the performance of an acquiring firm would be
improved with the number of acquisitions due to the dominant market power.
The Managerial Hubris Hypothesis, proposed by Roll in 1986, argues that some
optimistic managerial behaviour leads to corporate decisions that destroy the value of
the firm. It suggests that the management may pay less attention to the current merger
than to the previous ones because an overly optimistic confidence develops. In addition,
the overconfidence would cause overpayment for the targets or higher leverage being
taken on to pay for subsequent acquisitions (Moeller et al., 2004; Malmendier and Tate,
2008). Billett and Qian (2008) test the managerial hubris hypothesis. They look at
whether a self-attribution bias (Daniel et al., 1998; Gervais and Odean, 2001) leads to
overconfidence by the acquirers' decision makers over the sequence of acquisitions.
Billett and Qian (2008) indicate that managerial overconfidence may distort managerial
decisions so that "the subsequent acquisitions may tend to be value destructive" (Conn
et al. 2004). A number of articles also find evidence in support of the hubris argument,
which generally involves data from, for instance,the U.S.: Billett and Qian(2008),
Bruner (2002), Hietala et al. (2003), Malmendier and Tate (2003); and the U.K.: Doukas
and Petmezas (2007). However, overconfidence proxies used in those earlier studies,
such as frequent acquisition or multiple acquisition are subject to criticism.

24
In M&A, the Agency Problem Hypothesis occurs when there is conflict between
management and shareholders. Management may maximize their own interests at the
expense of shareholders' wealth (Jensen, 1986). The agency view divides the firm's
directors into two groups: insider and outsider. Many articles employ an empirical test
on the agency theory (e.g. Harris and Raviv, 1978), but results are mixed (e.g.
Hoskisson et al., 1993; Wright et al., 1996; Sanders, 2001; Rajgopal and Shevlin, 2002;
Wright et al. 2002; Wright et al., 2007). From the perspective of managerial decision-
making, agency issues (Eisenhardt, 1989) might cause the size effect (Moeller et al.,
2004). Using a sample of US listed frequent acquirers over the 1990-2002, Croci (2005)
investigates why managers make serial acquisitions. His empirical test on building
empire cooperation suggests the motivation for conducting multiple acquisitions is that
the management serves its reputation and interests and sidelines the shareholders’ value.
Apart from the above arguments, the Diminishing Returns Theory predicts the
diminishing efficiency of investment for frequently acquisitive firms. In the M&A
literature, Schipper and Thompson (1983) first introduce the argument. They argue that
the best investment opportunities are taken first. The latest acquisition, by contrast, will
be the worst. The decreasing attractiveness of an investment opportunity set, therefore,
means that subsequent takeovers are bound to decrease in value over time. It may not have
to predict a negative CAR but does predict a lower return in subsequent acquisitions.
Using a sample of US listed firms between 1982 and 1999, Klasa and Stegemoller (2007)
explore the relationship of acquisition sequences and acquisition performance. They
find that the attractiveness of the investment opportunity decreases when sequence
increases. Consequently, the higher sequence of acquisitions would more negatively
affect the acquisition performance (Conn et al., 2004).

25
The Capitalization Hypothesis of Schipper and Thompson (1983) suggests that
cumulative abnormal returns at a merger programme to an acquirer performing serial
takeovers should be capitalized at or prior to the announcement of the program. This
means the market views most favourably the first announcement of a merger
programme, and a zero effect on share returns of later acquisitions or, at least, their
magnitude, will be relatively small because subsequent takeovers are now events
known by the market. Both Schipper and Thompson (1983) and Loderer and Martin
(1990) provide evidence in support of this hypothesis. Schipper and Thompson (1983)
examined 55 US firms that engaged in acquisition programs during the period 1952-
1968. They find that stock prices react positively to the announcement of the
acquisition for up to 12 months. However, they find little market reaction to the later
acquisition announcements. In addition, Loderer and Martin (1990) find a significantly
larger return in the first announcement of the program than in the later acquisitions. In
contrast, other authors reject the hypothesis (Asquith et al., 1983; Croci, 2005; Ismail,
2008). For instance, Asquith et al. (1983) found that cumulative abnormal returns of
roughly comparable size are observed for the bidding firms’ first through fourth
merger bids.
The valuation hypothesis indicates that if an acquiring firm's stock were
overvalued, the firm would make an acquisition (Shleifer and Vishny, 2003). Shleifer
and Vishny also point out that the periods of high market valuations would cause
merger waves. Based on the hypothesis, Ismail (2008) uses P/E ratio to examine the
26
difference between single and multiple acquirers' return. He finds that the valuation of
frequent acquirers is significantly higher than that of single acquirers.
Apart from the above argument hypothesises, there are some other researches
document that the timing of acquisitions or temporal intervals as an extension to the
organizational learning theory is also one factor for investor’s returns (Hayward, 2002).
Appropriate temporal intervals could benefit the acquiring firms because an
appropriate time interval provides sufficient time to allow the building processes of
inference and experience from previous acquisitions to take place. However, very short
or very long temporal intervals are all have negative influence for investors’ returns
due to insufficient time of learning or ineffectiveness of inference and experience
(Hayward, 2002).
In summary, evidence about the impacts of frequent acquisition on
announcement returns is mixed. Some are positive with frequency and some are
opposite in stock markets. The two opposite arguments call for further research on the
issues related to merger frequency effects on stock performance.
2.2.2. Empirical evidence of frequent acquisition
Research with discussion of an immediate effect by an M&A event on
company performance is called a short-run study on M&A. Most of the existing short-
27
run studies (For example Fuller et al., 2002; Billett and Qian, 2008) found a negative
impact of takeovers on the announcement returns of acquiring firms on stock markets
if acquiring firms pursue more acquisitions. This suggests that the first or single
acquisition creates the highest announcement returns, but two or more acquisitions
deteriorate the returns. A few studies argue oppositely about the negative relationship
between merger frequency and stock performance of acquiring firms in the short run
(For example, Rovit and Lemire, 2003).
Asquith et al. (1983) is the very first study to identify that many acquiring firms,
accounted 45% of their sample, are highly frequent acquirers, performing four or more
subsequent takeovers from 1963 to 1979. Following Asquith et al (1983), Fuller et al.
(2002) first examine the pattern of announcement returns for frequent acquirers based
on a sample of 3,135 acquisitions by 539 US acquirers from 1990 to 2000. They define
a frequent acquirer as a firm that acquires at least five target firms during the sample
period. They found that the acquirers' announcement returns are negatively related to
the frequency. Additionally, their study suggests that the announcement returns are
improved when privately held targets are acquired. As a limitation, the study did not
investigate differences in announcement returns between acquirers with different
merger frequencies.
By using a UK sample of acquiring firms, Conn et al. (2004) examine the
impact of merger frequency on acquirers’ performance. They found that infrequent
acquirers gain higher announcement returns than the highly frequent ones. Ismail
(2008) extends Conn et al.'s study by examining a U.S. sample over the period between
28
1985 and 2004. He classified 5,655 unique U.S. acquiring firms according to single
acquirers and multiple acquirers who acquire two or more target firms during the
sample period. Ismail shows that the announcement returns of single acquirers
outperform multiple ones. Additionally, he found that the privately held targets
generate higher returns for the single acquirers than the multiple acquirers.
Billett and Qian (2008) is the first study that investigates both the effects of
individual CEOs and firms’ acquisition decisions on announcement returns. They
define a frequent acquirer as a firm that acquires at least two target firms within a five-
year period. Based on a sample of 3,795 US acquisitions, they found that a negative
announcement effect was concentrated in subsequent acquisitions of public targets.
Billett and Qian argue that a CEO who is subject to self-attribution is more likely to
overestimate their managerial ability. This suggests that a CEO tends to make more
value-destroying takeovers if the CEO develops his hubris from previous successful
acquisition experience.
From an organizational learning perspective, Haleblian and Finkelstein (1999)
define a merger frequency as the experience of organizational acquisition by counting
the number of deals that a sample acquirer made prior to current event year. They
found both positive and negative impacts of merger experience based on a sample of
449 US large takeovers2. They argued that a dissimilar prior merger experience leads
to a negative effect on performance of the current acquisition. In contrast, a similar
prior acquisition makes positive influences on the current acquisition.
2 They defined large acquisitions that have an excess value greater than $10 million.
29
For the study of subsequent acquisitions, Schipper and Thompson (1983)
investigate announcement returns by using a sample of 55 firms in the period from
1952 to 1968. They found that cumulative abnormal returns for the first mergers of
acquiring firms are much higher than subsequent acquisitions, supporting both the
capitalization hypothesis3 and the diminishing returns hypothesis4.
Furthermore, Loderer and Martin (1990) explore acquisition series5 by using a
sample of 5,172 M&A deals occurred between 1966 and 1984. They found that the
first takeover creates the highest cumulative abnormal returns to acquirer shareholders.
In addition, the study found a significant declining trend in abnormal returns of
subsequent takeovers for acquiring firms. For a high frequency, recent literature
suggest a strong declining trend in cumulative abnormal returns which decrease from -
0.045% to -1.96 % (Firth, 1980; Dodd, 1980; Bradley et al., 1983; Lang et al., 1989;
Mitchell and Lehn, 1990; Smith and Kim, 1994; Holl and Kyriazis, 1997; Higson and
Elliot, 1998; Walker, 2000; Sud Gupta and Misra upta and Misraarsanam and Mahate,
2003; Gupta and Misra, 2007; Song and Walking, 2004; Campa and Hernando, 2004).
3 The capitalization hypothesis suggests that the first acquisition yields positive returns and then no returns for later
acquisitions since the gain of the second acquisition is partly discounted in the share price. 4 The diminishing returns hypothesis suggests that the acquiring firm always choose the best investment opportunity
first, and the latest investment will be the worst. 5 An acquisition series starts after a two-year or more non-acquisition hiatus and ends with an analogous 2-year or
more no-acquisition hiatus.

30
Overall, all the above cited studies either gave a definition of the frequent
acquirers or distinguished between frequent and infrequent acquirers. Most of the
studies emphasized the effects of merger activities on the performance of acquiring
firms; however, they ignored the direct effect of merger frequency on the performance
of acquiring firms. More specifically, merger is a process of accumulating; it also
needs to consider the timing of acquisitions as a significant factor.
2.2.3. Empirical evidence of other determinates on merger impact
There are also many other factors that can influence the outcome of an
acquisition for an acquirer, such as the order of a merger in a series, in addition to the
number of acquisitions. For instance, the corporate status of the target (e.g. Officer et
al., 2009), the payment method used (e.g. Healy et al., 1992) and the degree of
relatedness between acquirers and targets (e.g. Palich et al., 2000), can also affect the
performance of announcement returns.
2.2.3.1. Target type
A large body of existing studies investigates the post-merger performance of
acquiring firms who take both publicly and privately held targets. Most of these studies
reveal that acquisitions of non-public firms significantly improve bidders’ value.
(Chang, 1998; Koeplin et al., 2000; Andrade et al., 2001; Fuller et al., 2002; Kooli et
al., 2003; Moeller et al., 2004; Shen and Reuer, 2005; Faccio et al., 2006; and Officer
et al., 2009).
31
Using a sample of 3,135 U.S domestic takeovers during the period 1980 to
2001, Fuller et al. (2002) examine 539 frequent acquirers and a -1.02% of significant
negative change in abnormal returns on average for firms that acquired public held
targets. In addition, John et al. (2010) found that returns for bidders in the
announcement period (-1 to 1) are significantly positive for the sample of acquisitions
of public traded firms with low-shareholder protection, but returns are significantly
negative for takeovers of public targets in high-shareholder protection countries.
Bargerona et al. (2008) found that publicly held acquirers pay 63% higher premium to
shareholders of public targets than to shareholders of private targets.
One explanation for positive market reaction to the acquisitions of non-public
firms is that bidders purchase at a substantially discounted price when acquiring non-
public companies because the illiquidity nature of non-public targets. Koeplin et al.
(2000) state that private targets are purchased at, on average, 18% (by using earnings
multiples) or 20% to 30% (by using book multiples) discount in comparison to public
firms. In studies about subsequent acquisitions of non-public targets, they reported 20%
(by using cash flow multiples) and 34% (by using earnings multiples) median discount.
Officer (2007) suggests that private targets are sold at an average discount from 15% to
30%.
Alternatively, the transparency of information explains differences in
performance of acquisitions between publicly and privately held targets. Based on the
monitoring hypothesis, the lack of information on non-public firms leads to a difficulty
for the acquirers to evaluating targets (Reuer and Ragozzino, 2008). However,
32
acquirers would receive more opportunities to gain significant abnormal returns from
the takeovers of non-public firms by exploiting private information situations. The
asymmetry of information causes private companies to suffer low market liquidity. In
contrast, public targets are more visible and transparent to investors, in which this is
positively perceived by investors (Deeds et al. 1999). Hence, the classic reaction to the
risk of adverse selection for bidders is to reduce the offer price (Akerlof, 1970).
Moreover, there is a possibility that the target will turn out to be a lemon and this may
lead to a reduction of value on its offer, even though the bidder has private information
on a specific target.
2.2.3.2. Payment method
The literature in the study of the M&A performance suggest that the selection
of payment method is also a factor which affects acquirer’s abnormal returns (e.g.
Fuller et al., 2002).
Myers and Majluf (1984) indicate that the presence of asymmetric information
between acquirers and targets allows bidders who believe that their shares are
overvalued to use stock as a medium of exchange. Within the context of managerial
control, the use of stocks payment method can dilute the existing shareholders’ control
power over the company. Faccio and Lang (2002) suggest that an acquirer will choose
cash payment rather than stock payment if retaining control of target firms in post-
merger is more important. However, without sufficient size and concentration of
ownership, the acquiring firm is likely to be less apprehensive about the stock offer.
There are some studies which support the managerial control argument, for instance,
33
Harris and Raviv (1988), Eckbo et al. (1990), Travlos et al. (1990), Cornu and Isakov
(2000) and Faccio and Masulis (2005).
Alternatively, an acquiring firm inclines to finance an acquisition by cash in
which the acquirer’s shares are undervalued and thus will overpay the deal (Myers and
Majluf, 1984; Fishman, 1989; Linn and Switzer, 2001; Fuller et al., 2002). Travlos
(1987) suggests that acquirers always finance an acquisition in the most profitable way.
He found that acquiring firms experience significant losses when making pure stock
offers, but gain regular rates of returns for pure cash bids. In addition, scholars suggest
that the effects of payment method on abnormal returns are independent of the type of
acquisitions. For instance, Ghosh (2001) and Carline et al. (2002) suggest a consistent
result that the all-cash offer leads to a significant improvement in the post-merger
performance. In contrast, the tax-based hypothesis is often cited in favour of stock
offers, which suggests that shareholders of target firms will immediately experience a
tax loss if bidders pay them with cash, but tax implications are deferred (Fuller et al.,
2002). This taxation hypothesis or argument is supported and evident by studies, such as
Yang et al. (1983), Fuller et al. (2002), Ismail and Krause (2010) and Ayers et al.
(2004).
The use of all-cash or higher proportion of a cash offer may send a positive
signal of a bidder’s value to the market. If the acquiring firm is uncertain about the real
value of a target firm, the acquiring firm is more likely to make a stock offer since the
target only accepts cash offers with the value, at least, as much as its true value. The
issue of this uncertainty in target valuation indicates that bidders force target firms to
34
share the financing risk of overpaying. Therefore, the higher the uncertainty on an
acquirer’s own firm value is, the more the preference for a cash offer to be made; the
higher the uncertainty on the target’s firm value is, the more the preference for a stock
offer value (Martin, 1996)). Hansen (1987) defines this as a contingency pricing effect.
A number of studies show that the contingency pricing effect plays a role in
determining payment method. These studies suggest that acquirers who make cash
offers gain higher abnormal returns than those who make stock offers within the
announcement period (e.g. Brown and Ryngaert, 1991; Martin, 1996).
Furthermore, a number of empirical studies demonstrate that the mix of cash
and stock as a medium of exchange in merger and acquisition activities between large
firms is increasingly selected (Betton et al., 2008). For example, Faccio and Masulis
(2005) collect a larger sample of 3,667 deals occurred between European firms during
the 1990s. They found that only 414 takeovers are paid by the mixed method of
payment, accounting for 11.3% of the whole sample. Among those deals, an average
proportion of 57% in cash and 43% in stock. However, transaction value of takeovers
paid by the mixed-payment is five times higher than all-cash offers. In addition, all of
these studies found that acquirers are more likely to take relatively smaller firms with
cash rather than stock.
2.3. Research setup
2.3.1. Define performance measurement: Abnormal Returns
To investigate market reactions to the announcement of M&A deals, the
methodology of event study is widely applied. Event studies can evaluate the effect of
35
merger announcements on shareholder value from both sides: the target firm and the
bidder. The evaluation is made by comparing the stock value of a firm during the
specific period before and after the announcement of a merger. The event study
methodology assumes that the market is informatively efficient, and price changes
reflect new information. Indeed, Haleblian et al. (1999) suggest that the event study
methodology is related to the market efficiency assumption. In addition, evidence from
Elton and Gruber (1987) shows that the market does react to the new information
rapidly.
Beginning with Dolley (1933), event study was firstly used to investigate the
relationship between stock splits and stock price. Ball and Brown (1968) and Fama et
al. (1969) then introduced modern methodology of event studies in their studies, which
is essentially the same as today. They made two major improvements by considering
the information content of earnings announcements (Ball and Brown, 1968) and the
split of effects of stock after eliminating the effects of increasingly simultaneous
dividend (Fama et al., 1968). In 1980, Brown and Warner further developed a simple
event study methodology based on the market model, which performs well under a
wide variety of conditions. The main purposes of this methodology are: firstly to
capture ‘abnormal returns’ attributed to the event from the difference between the
‘actual returns’ and ‘normal returns’, secondly to test the existence of information
effect, and thirdly to detect the factors that can explain changes in firm value at the
event date (Prabhala, 1997).
In merger and acquisition research, the events are assessed by a change in stock
price during the period in which the event occurs. The price change is called

36
“abnormal returns” and is calculated as the difference between the observed returns
and the returns that would be predicted for given the performance of the market. Healy
et al. (1992), Kapland and Weisbach (1992) and Harrison and Godfrey (1997) show
supportive evidence of predictive validity, which justifies the study to apply abnormal
returns to measure acquisition performance. The abnormal returns are defined as
follows:
𝐴𝑅𝑖𝑡 = 𝑅𝑖𝑡 − (𝛼𝑖 + 𝛽𝑖𝑅𝑚𝑡) ⑴
where t is the time, i= 1, 2, ..., n stands for a stock; 𝑅𝑖𝑡 is the observed returns on stock
i for day t; 𝛼𝑖 = Intercept; 𝛽𝑖 =Beta of stock i (measure of non-diversifiable risk);
𝑅𝑚𝑡=Returns on the market portfolio at day t. 𝛼 is a measure of the amount of return
produced by a stock's inherent factors rather than market sensitivity factors. The
calculation of 𝛽 is improved by Kroll and Caples (1987) and may be expressed as the
covariance of stock returns and market returns, divided by the variance of market
return, which can be defined as follows:
𝛽𝑖 =𝐶𝑂𝑉(𝑅𝑖,𝑅𝑚)
𝜎𝑚2 . ⑵
As document in Haleblian and Finkelstein (1999), the abnormal returns
equation above is adjusted for both market performance and individual stock risk.
Healy et al. (1992), Kaplan and Weisbach (1992), Sirower (1997), Harrison & Godfrey
(1997) and Haleblian & Finkelstein (1999) find that market beta is related to security
returns.
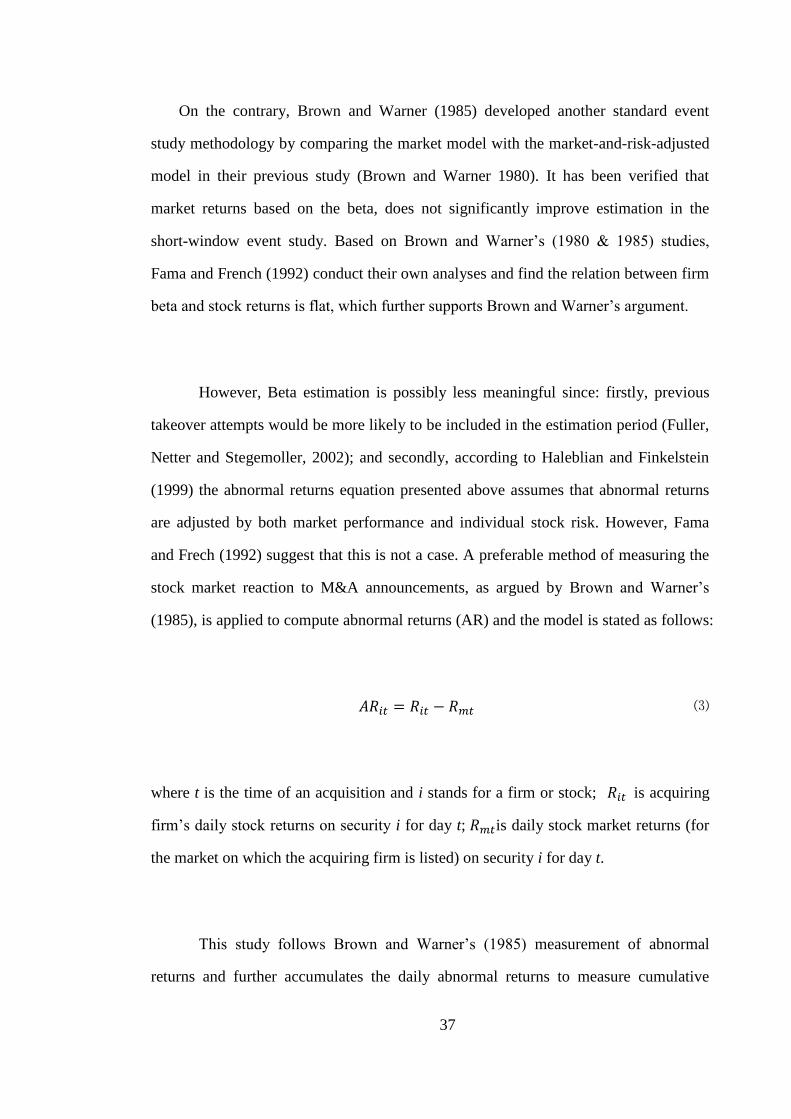
37
On the contrary, Brown and Warner (1985) developed another standard event
study methodology by comparing the market model with the market-and-risk-adjusted
model in their previous study (Brown and Warner 1980). It has been verified that
market returns based on the beta, does not significantly improve estimation in the
short-window event study. Based on Brown and Warner’s (1980 & 1985) studies,
Fama and French (1992) conduct their own analyses and find the relation between firm
beta and stock returns is flat, which further supports Brown and Warner’s argument.
However, Beta estimation is possibly less meaningful since: firstly, previous
takeover attempts would be more likely to be included in the estimation period (Fuller,
Netter and Stegemoller, 2002); and secondly, according to Haleblian and Finkelstein
(1999) the abnormal returns equation presented above assumes that abnormal returns
are adjusted by both market performance and individual stock risk. However, Fama
and Frech (1992) suggest that this is not a case. A preferable method of measuring the
stock market reaction to M&A announcements, as argued by Brown and Warner’s
(1985), is applied to compute abnormal returns (AR) and the model is stated as follows:
𝐴𝑅𝑖𝑡 = 𝑅𝑖𝑡 − 𝑅𝑚𝑡 ⑶
where t is the time of an acquisition and i stands for a firm or stock; 𝑅𝑖𝑡 is acquiring
firm’s daily stock returns on security i for day t; 𝑅𝑚𝑡is daily stock market returns (for
the market on which the acquiring firm is listed) on security i for day t.
This study follows Brown and Warner’s (1985) measurement of abnormal
returns and further accumulates the daily abnormal returns to measure cumulative
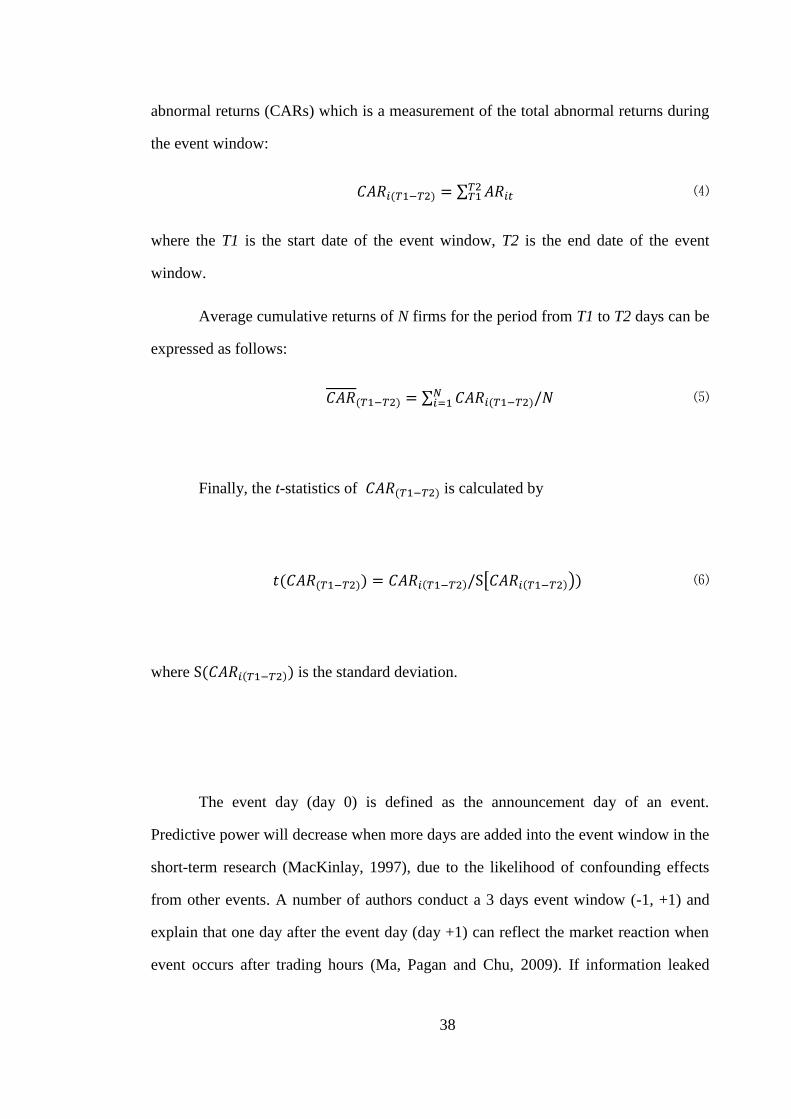
38
abnormal returns (CARs) which is a measurement of the total abnormal returns during
the event window:
𝐶𝐴𝑅𝑖(𝑇1−𝑇2) = ∑ 𝐴𝑅𝑖𝑡𝑇2𝑇1 ⑷
where the T1 is the start date of the event window, T2 is the end date of the event
window.
Average cumulative returns of N firms for the period from T1 to T2 days can be
expressed as follows:
𝐶𝐴𝑅(𝑇1−𝑇2) = ∑ 𝐶𝐴𝑅𝑖(𝑇1−𝑇2)/𝑁𝑁𝑖=1 ⑸
Finally, the t-statistics of 𝐶𝐴𝑅(𝑇1−𝑇2) is calculated by
𝑡(𝐶𝐴𝑅(𝑇1−𝑇2)) = 𝐶𝐴𝑅𝑖(𝑇1−𝑇2)/S[𝐶𝐴𝑅𝑖(𝑇1−𝑇2))) ⑹
where S(𝐶𝐴𝑅𝑖(𝑇1−𝑇2)) is the standard deviation.
The event day (day 0) is defined as the announcement day of an event.
Predictive power will decrease when more days are added into the event window in the
short-term research (MacKinlay, 1997), due to the likelihood of confounding effects
from other events. A number of authors conduct a 3 days event window (-1, +1) and
explain that one day after the event day (day +1) can reflect the market reaction when
event occurs after trading hours (Ma, Pagan and Chu, 2009). If information leaked

39
before the announcement date of the official deal, it can capture the market reaction in
day -1 (one day before the event day).
However, a longer window can capture more economic impact of the
acquisition since the initial stock market reaction, to the announcement of an
acquisition, is often incomplete or biased (Harrison, Oler, and Allen, 2008). To
investigate the sensitivity of the empirical results to different lengths of an event
window, a five-day event window (-2, +2) around the announcement day (day 0) is
used, which is consistent with prior studies (Cox and Portes, 1998; Fuller, Netter and
Stegemolloer, 2002; Faccio et al., 2006; Boubakri, Chan and Kooli, 2012; Gaur,
Malhotra and Zhu, 2013). To reduce the probability of capturing confounding events in
CAR calculations, the event window is reduced from five days to three days to conduct
the robustness checks (See Appendix A).
2.3.2. Define merger frequency for acquiring firms
How to define merger frequency in event study is a common concern for the
research of impact of frequent acquisition. Existing studies count a number of mergers
emerged during a specific period as “frequency”, and some split or classify acquiring
firm according to the single acquirer for the firm that acquired only one target during
the sample period, and the frequent acquirer that severed multiple acquisitions in the
sample period. Fuller et al. (2002) studied the performance of firms involved in
mergers by defining a firm performed at least five acquisitions as a frequent acquirer.
The definition of frequent acquirers by Fuller et al. (2002) has been widely cited by
existing studies for merger frequency studies. For instance, Ismail (2008) broadly
groups US acquisitions according to single and multiple (at least two acquisitions)
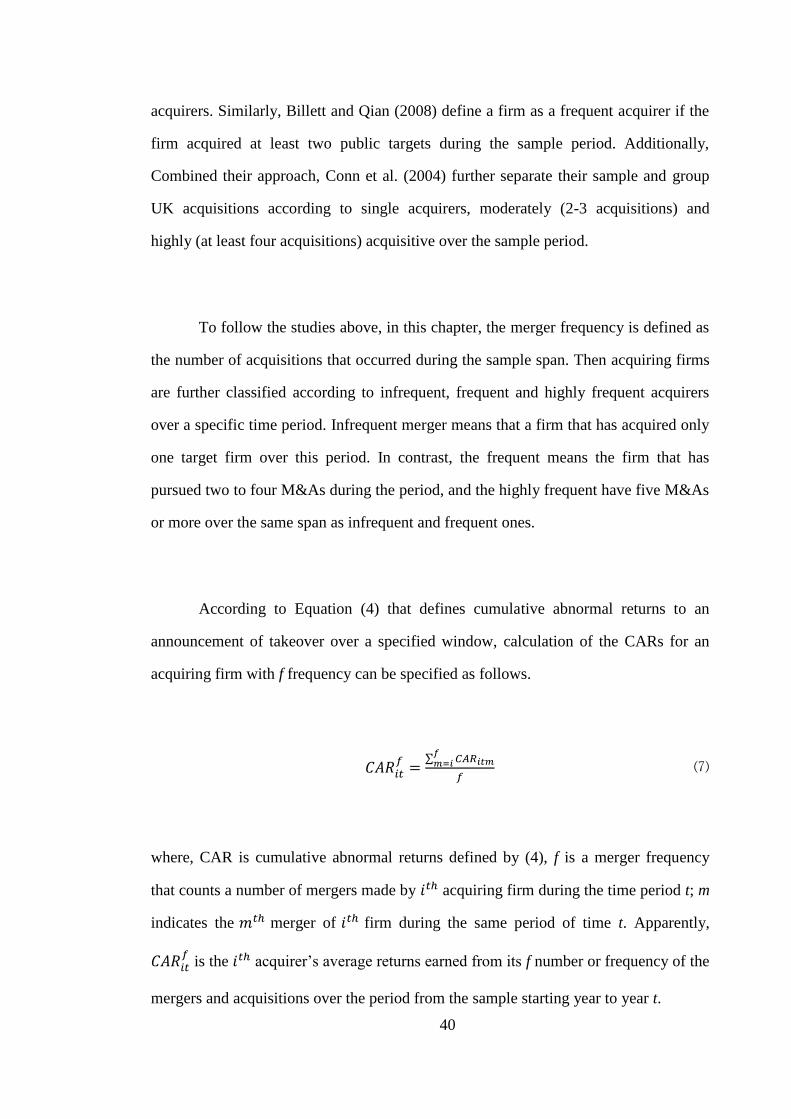
40
acquirers. Similarly, Billett and Qian (2008) define a firm as a frequent acquirer if the
firm acquired at least two public targets during the sample period. Additionally,
Combined their approach, Conn et al. (2004) further separate their sample and group
UK acquisitions according to single acquirers, moderately (2-3 acquisitions) and
highly (at least four acquisitions) acquisitive over the sample period.
To follow the studies above, in this chapter, the merger frequency is defined as
the number of acquisitions that occurred during the sample span. Then acquiring firms
are further classified according to infrequent, frequent and highly frequent acquirers
over a specific time period. Infrequent merger means that a firm that has acquired only
one target firm over this period. In contrast, the frequent means the firm that has
pursued two to four M&As during the period, and the highly frequent have five M&As
or more over the same span as infrequent and frequent ones.
According to Equation (4) that defines cumulative abnormal returns to an
announcement of takeover over a specified window, calculation of the CARs for an
acquiring firm with f frequency can be specified as follows.
𝐶𝐴𝑅𝑖𝑡𝑓
=∑ 𝐶𝐴𝑅𝑖𝑡𝑚
𝑓𝑚=𝑖
𝑓 ⑺
where, CAR is cumulative abnormal returns defined by (4), f is a merger frequency
that counts a number of mergers made by 𝑖𝑡ℎ acquiring firm during the time period t; m
indicates the 𝑚𝑡ℎ merger of 𝑖𝑡ℎ firm during the same period of time t. Apparently,
𝐶𝐴𝑅𝑖𝑡𝑓
is the 𝑖𝑡ℎ acquirer’s average returns earned from its f number or frequency of the
mergers and acquisitions over the period from the sample starting year to year t.

41
2.3.3. Empirical predictions
The section 2.2.1 surveys several theories in relation to frequent acquisition. It
is found that merger motives have attracted far less theoretical attention than merger
consequences or effects themselves. At the most general level, those theories are
considered as merger motives which is the moving cause behind merger impacts.
However, the research settings of the chapter aim to give an exploration of potential
impacts that are born or developed from repetitive and frequent acquisitions. It may not
be appropriate to use some of these theories to explain the impacts of frequent
acquisition. For example, diminishing returns theory and valuation theory may not be
relevant.
In addition, capitalization theory is considered inappropriate. Because there is a
big uncertainty concerning the magnitude, success, timing of a merger program and
whether a series of mergers is a merger program. This is not done to refute or prove a
single theory. Most scholars agree that merger and acquisitions are a complex process
and that there may not be a single approach that could offer a full explanation (e,g.
Steiner, 1975; Ravenscraft and Scherer, 1987; Trautwein, 1990).
Therefore, by comparing 𝐶𝐴𝑅𝑖𝑓 with different f, this chapter will test several
arguments that are more likely to be associated with frequent acquisition:

42
Firstly, the organizational learning hypothesis (OLH) (Argyris and Schon, 1978)
that expects higher 𝐶𝐴𝑅𝑖𝑡𝑓
with increasing f, which means
𝐶𝐴𝑅𝑖𝑡𝑓
⎢𝑖𝑛𝑓𝑟𝑒𝑞𝑢𝑒𝑛𝑡 𝑚𝑒𝑟𝑔𝑒𝑟𝑓=1
< 𝐶𝐴𝑅𝑖𝑡𝑓
⎢𝑓𝑟𝑒𝑞𝑢𝑒𝑛𝑡 𝑚𝑒𝑟𝑔𝑒𝑟2≤𝑓≤4
< 𝐶𝐴𝑅𝑖𝑡𝑓
⎢ℎ𝑖𝑔ℎ𝑙𝑦 𝑓𝑟𝑒𝑞𝑢𝑒𝑛𝑡 𝑚𝑒𝑟𝑔𝑒𝑟𝑓≥5
[rank one]
and the opposite arguments of the Managerial Hubris Hypothesis (MHH ) (Roll, 1986)
or Agency Theory (Jensen, 1986) that expects lower 𝐶𝐴𝑅𝑖𝑡𝑓
with increasing f:
𝐶𝐴𝑅𝑖𝑡𝑓
⎢𝑖𝑛𝑓𝑟𝑒𝑞𝑢𝑒𝑛𝑡 𝑚𝑒𝑟𝑔𝑒𝑟𝑓=1
> 𝐶𝐴𝑅𝑖𝑡𝑓
⎢𝑓𝑟𝑒𝑞𝑢𝑒𝑛𝑡 𝑚𝑒𝑟𝑔𝑒𝑟2≤𝑓≤4
> 𝐶𝐴𝑅𝑖𝑡𝑓
⎢ℎ𝑖𝑔ℎ𝑙𝑦 𝑓𝑟𝑒𝑞𝑢𝑒𝑛𝑡 𝑚𝑒𝑟𝑔𝑒𝑟𝑓≥5
[rank two]
Secondly, 𝐶𝐴𝑅𝑖𝑡𝑓
can be specified as 𝐶𝐴𝑅𝑖𝑡𝐹 with F indicating 𝐹𝑡ℎ merger made
by the acquiring firm i. By ranking 𝐶𝐴𝑅𝑖𝑡𝐹 with different F, a stronger claim against
each hypothesis can be obtained if
𝐶𝐴𝑅𝑖𝑡𝐹 ⎢𝐹=1 < 𝐶𝐴𝑅𝑖𝑡
𝐹 ⎢𝐹=2 < … < 𝐶𝐴𝑅𝑖𝑡𝐹 ⎢𝐹=𝑛…………………………….[rank three]
in support of the OLH, otherwise, if
𝐶𝐴𝑅𝑖𝑡𝐹 ⎢𝐹=1 > 𝐶𝐴𝑅𝑖𝑡
𝐹 ⎢𝐹=2 > … > 𝐶𝐴𝑅𝑖𝑡𝐹 ⎢𝐹=𝑛………………….………….[rank four]
43
in support of the Managerial Hubris or Agency Theory.
This is because when the management of the acquirer undertakes its first bid,
they will be more careful in choosing a target and investing in the business of the target,
thus making a successful decision for the acquisition. However, according to the hubris
theory, once the management develops hubris from initially successful merger
experience, the management of the acquiring firm will be less careful about target
selection and risk assessment of an acquisition. This could result in paying excessive
takeover premiums and thus leading to the value losses for subsequent deals.
Thirdly, timing of acquisitions or temporal intervals theory predicts that if an
acquirer performs frequent acquisition within a longer time period, the acquirer is
expected to have higher CARs than the one undertaking frequent acquisition within a
shorter time period. Further it can be expected that the former has a longer average
time interval between mergers that the latter. The longer break between deals will
benefit acquirers since learning depends on the time between two acquisitions. Short
periods do not allow acquiring firms to draw inferences and experience from past
takeovers (Hayward, 2002).
2.4. Data
The sample used for this study includes all completed M&As and tender offers
to public, private and subsidiary target firms completed by worldwide public
companies over 11 years from January 1, 2000 to December 31, 2010. During the
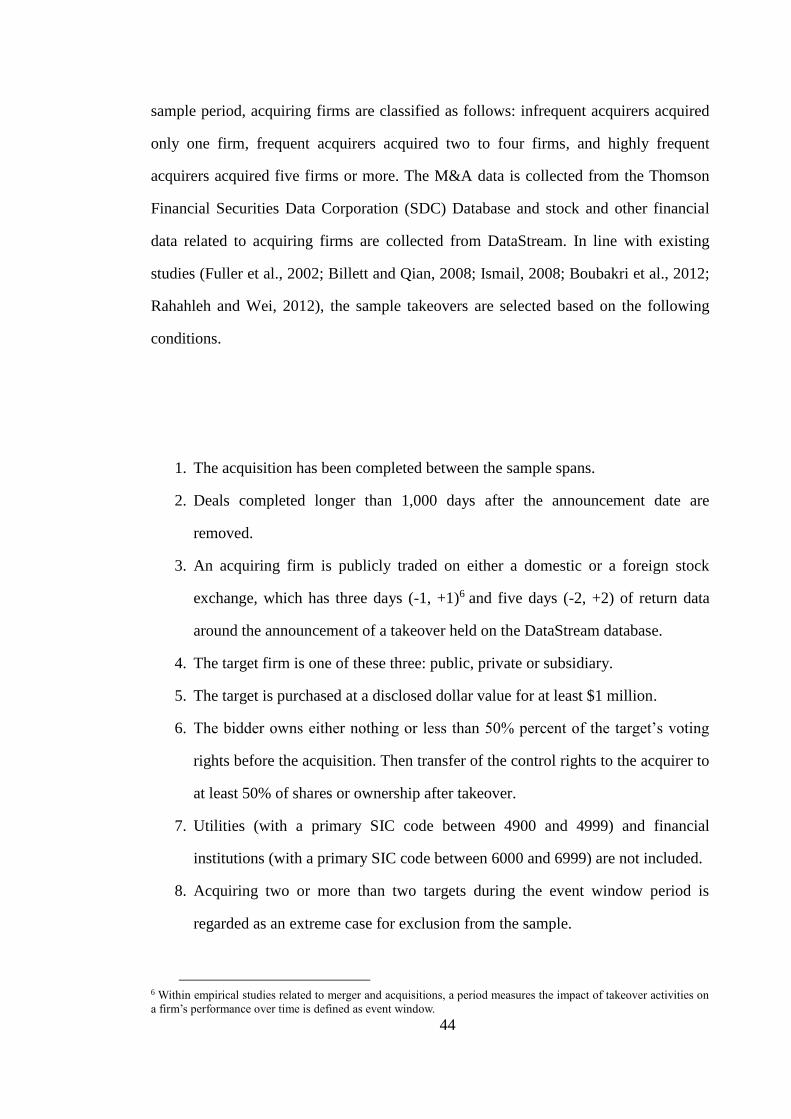
44
sample period, acquiring firms are classified as follows: infrequent acquirers acquired
only one firm, frequent acquirers acquired two to four firms, and highly frequent
acquirers acquired five firms or more. The M&A data is collected from the Thomson
Financial Securities Data Corporation (SDC) Database and stock and other financial
data related to acquiring firms are collected from DataStream. In line with existing
studies (Fuller et al., 2002; Billett and Qian, 2008; Ismail, 2008; Boubakri et al., 2012;
Rahahleh and Wei, 2012), the sample takeovers are selected based on the following
conditions.
1. The acquisition has been completed between the sample spans.
2. Deals completed longer than 1,000 days after the announcement date are
removed.
3. An acquiring firm is publicly traded on either a domestic or a foreign stock
exchange, which has three days (-1, +1)6 and five days (-2, +2) of return data
around the announcement of a takeover held on the DataStream database.
4. The target firm is one of these three: public, private or subsidiary.
5. The target is purchased at a disclosed dollar value for at least $1 million.
6. The bidder owns either nothing or less than 50% percent of the target’s voting
rights before the acquisition. Then transfer of the control rights to the acquirer to
at least 50% of shares or ownership after takeover.
7. Utilities (with a primary SIC code between 4900 and 4999) and financial
institutions (with a primary SIC code between 6000 and 6999) are not included.
8. Acquiring two or more than two targets during the event window period is
regarded as an extreme case for exclusion from the sample.
6 Within empirical studies related to merger and acquisitions, a period measures the impact of takeover activities on
a firm’s performance over time is defined as event window.
45
Furthermore, in line with Martin (1996) and Fuller et al. (2002), methods of
payment used in transactions are categorized into three groups: (1) transactions made
by pure cash from the firm’s own earning, borrowing or from mixed earning and
borrowing; (2) transactions made by pure stock in a form of common or ordinary
shares (for public targets), options, warrants or stock (for private targets); and (3)
transactions made by a mixture of cash and stock.
After filtering from the initial set of 339,640 acquisitions, a final sample is
yielded, consisting of 14,103 acquisitions by 6,836 acquirers across 117 countries. The
full sample is then divided into sub-samples according to methods of payment,
ownership status of target firms, geography and industry, respectively. In Table 2-1,
acquiring firms are classified by the number of acquisitions over the sample span.
Acquiring firms which acquired single, two to four, and at least five acquisition(s)
during 2000 to 2010 are classified as an infrequent acquirer, a frequent acquirer and a
highly frequent acquirer, respectively.
Table 2-1 presents the sample statistics of 14,103 acquisitions which occurred
during the period 2000 to 2010. 3,994 sample acquisitions were made by infrequent
acquirers, 5,820 deals were made by frequent acquirers, and the rest of the 4,289 deals
were made by highly frequent acquirers. Over the time, the total number of
acquisitions increased from 825 in 2000 to 1,483 in 2010. However, the increasing
trend is not monotonically up over these years. For instance, merger activities
decreased in 2008. The median values of transactions were almost stable at around $23
million over an 11-year period. The huge difference between the mean and the median

46
averages of acquisition values suggest that some outliers exist in the sample of
transaction values. Interestingly, the total value of transactions is only around $2
trillion in 2002 and 2003, which is much lower than the rest of the years.
Table 2-1. Sample statistics of 14,103 takeovers from 2000 to 2010.
Table 2-2 presents the sample distribution by payment methods, ownership
status of targets, geography and industry. In the table, Panel A shows the number of
acquisitions in terms of target ownership status. The publicly owned target firms take
20% of the total sample deals and this group of deals has the highest mean value of
transactions, although it show the lowest number of takeovers. In contrast, acquisitions
of privately owned targets account for 49%, the highest proportion, of the full sample
but the lowest deal value. This pattern is consistent in sub-samples of infrequent,
frequent and highly frequent acquirers. In other words, non-public traded targets are
more attractive to the bidders than public targets. Previous literature (Fuller et al., 2002;
Moeller et al., 2004) explains that acquirers will get more opportunities to gain
significant abnormal returns from takeovers of privately owned firms from exploiting
private information.
Year
Number
of Deals
Number of
Acquirers
Deals by
infrequent
acquirer
Deals by
frequent
acquirer
Deals by
High
frequent
acquirer
Mean Value
of
Transactions
Median
value of
Transactions
Total Value of
Transactions
($Million) ($Million) ($Million)
2000 825 640 192 339 294 676.73 23.18 558303.00
2001 616 382 143 236 237 500.89 31.23 308549.15
2002 765 476 173 315 277 243.45 23.18 186235.71
2003 914 516 199 380 335 223.27 24.56 204065.70
2004 1259 612 290 533 436 235.04 20.11 295910.79
2005 1629 755 374 699 556 295.03 21.4 480602.28
2006 1770 771 473 780 517 318.82 22.69 564316.63
2007 2010 849 589 826 595 278.14 23.1 559051.67
2008 1564 672 536 629 399 298.84 20.83 467387.72
2009 1268 562 462 527 279 344.93 17 437375.48
2010 1483 601 563 556 364 290.88 25.67 431376.16
Total 14103 6836 3994 5820 4289 322.87 23.36 4493175.42

47
The Panel B of the table provides details on payment methods.
Overwhelmingly, there are 7,772 transactions accounting for 55% of the total deals
made by pure cash. In contrast, the stock financing only accounts for 19%. Apparently,
the cash offers are popular in acquiring small targets. Acquisitions financed by
combination of stock and cash are often used to acquire large corporations. It is found
that the infrequent bidders are more likely to use equity as the method of payment in
acquiring targets. Although stock takeovers have a lower proportion than cash ones,
the mean value of transactions financed by stock is higher than deals financed by cash
for frequent and highly frequent acquirers.
Panel C reports that 73% of targets are domestic companies and only 27% of
targets are foreign firms, which suggests that domestic targets are more favourable to
acquirers than cross-border targets. This is possibly due to the information asymmetry
between acquirers and foreign target firms. Panel D reveals that 64% of total deals are
stretched out beyond acquirers’ core business, and the rest of 36% deals originate in
bidders’ own industry. However, the mean value of transactions for related
acquisitions is much greater than for conglomerates even after controlling for the
number of mergers. This suggests that the acquiring firms are more confident in
pursuing horizontal mergers due to the advantage of information and controlling
capability.

48
Table 2-2. Sample statistics for payment method, target ownership and types of acquiring firms
All
Infrequent
Frequent
Highly frequent
Mean Value of deals
Mean Value of deals
Mean Value of deals
Mean Value of deals
Deals % ($Million)
Deals % ($Million)
Deals % ($Million)
Deals % ($Million)
Full Sample 14103
318.6
3994 28% 164.01
5820 41% 291.9
4289 30% 512.84
Panel A: Target listing status
Public 2799 20% 1092.34
1177 8% 669.12
919 7% 1097.37
703 5% 1794.34
Private 6842 49% 64.28
3133 22% 45.4
2047 15% 64.71
1662 12% 99.33
Subsidiary 4462 32% 223.2
2346 17% 159.59
1262 9% 322.53
854 6% 251.19
Panel B: Payment method
Cash 7772 55% 239.47
3147 22% 163.45
2440 17% 250.63
2185 15% 336.5
Stock 2738 19% 308.55
1698 12% 134.07
671 5% 491.99
369 3% 777.86
Mixed 3593 25% 497.41
1811 13% 310.42
1117 8% 542.79
665 5% 930.43
Panel C: Cross-border
Domestic 10302 73% 297.55
4847 34% 172.19
3146 22% 337.54
2309 16% 506.22
Foreign 3801 27% 375.64
1809 13% 259.59
1082 8% 449.22
910 6% 518.84
Panel D: Industry Relatedness
Related 5018 36% 411.53
2458 17% 243.01
1527 11% 443.42
1033 7% 765.37
Conglomerate 9085 64% 267.27
4198 30% 168.38
2701 19% 322.43
2186 16% 389.15
49
2.5. Empirical results
In this section, two questions are addressed: the first is about how merger
frequency affects cumulative abnormal returns for shareholders of the acquiring firm;
and the second is how CARs differ between the first and subsequent acquisitions. Then
the section explores whether these differences can be explained by the hubris or the
organization theory.
2.5.1. The impact of frequency on announcement returns
Table 2-3 reports univariate analysis of the five-day cumulative returns of
acquisitions made for different merger frequencies. In the row “within sample span” of
Table 2-3, the overall CARs for three subsamples are all significantly positive at the 1%
level: a 3.97% CAR for infrequent bidders, a 2.12% CARs for frequent acquisitions
and a 0.79% CAR for highly frequent bidders, respectively. It is found that the
infrequent acquirers outperform frequent acquirers7, clearly suggesting that the CARs
decline as the merger frequency increases.
As stated in Huber (1991), there invariably exists a temporal interval between
two acquisitions. During this interval, an acquirer is able to facilitate organizational
learning in integrating new business with existing one for more efficient utilization of
new acquisitions through sufficient digestion of acquisition assets and integration of
cost and risk. To take into account the performance effect of time interval between
7 For robustness, infrequent, frequent and highly frequent bidder are re-defined as a firm undertaking one to two,
three to five and greater than five acquisitions during 2000-2010. The results remain qualitatively unchanged (See
Appendix A).
50
acquisitions pursued by the acquiring firm, acquisitions are grouped according to one-
year interval and four-year interval and the sample span in which an acquirer performs
frequent acquisitions. In this context, a frequent acquirer with one-year interval means
that the acquirer completes two to four acquisitions within one year, or the firm
completes two to four acquisitions within four years if it has four-year interval. Based
on the argument of the learning effect (OLH), the market expects a better performance
for the longer interval.
As reported in Table 2-3, there is a clearly increasing trend in CARs as time
interval becomes longer, which ranges from 2.25% to 3.97% for infrequent acquirers,
0.91% to 2.12% for frequent acquirers and 0.17% to 0.79% (insignificant) for high-
frequent acquirers, respectively. The results suggest that CARs are higher when
acquirers take longer time to break from the last acquisition to next one. One
explanation for this finding is that acquirers need time to learn from previous
acquisition experience and to digest newly acquired business. This shows clear
evidence in support of OLH as the longer interval helps the acquiring firm with more
time to learn and improve integration of new business to the existing one. Time for
learning matters for improvement of acquisition quantity (Hayward, 2002).
In short, Table 2-3 provides a clear ranking of CARs that decrease with the
increasing number of acquisitions, supporting the hubris or agency argument. However,
the hubris effect can be mitigated or weakened by the learning effect when the
frequency appears slowly, such as increasing time-break length between mergers.
Further, a variety of robustness checks were introduced, including the analysis was

51
repeated by splitting the full sample by different regions and economies and redefining
the length of time intervals (See, Appendix B). These results were also robust and
consistent
Table 2-3. Cumulative abnormal returns for infrequent, frequent and highly frequent across
different time interval
Infrequent
Frequent
Highly frequent
Temporal interval CAR(+2,-2) N#
CAR(+2,-2) N#
CAR(+2,-2) N#
within one year 2.25%*** 10009
0.91%*** 3818
0.17% 276
(23.36)
(7.96)
(0.40)
within Four years 2.81%*** 6831 1.10%*** 5685 0.39%*** 1587
(22.18) (10.97) (2.64)
within sample span 3.97%*** 3994 2.12%*** 5820 0.79%*** 4289
(18.63) (17.50) (7.43)
Note: This table reports five-day (-2,+2) Cumulative Abnormal Returns (CARs) for infrequent, frequent and high
frequency acquirers across different time interval. Infrequent, frequent and highly frequent bidder is defined as an
acquirer undertaking one, two to four and more than four acquisition(s), respectively. To take into account the
performance effect of time interval between acquisitions pursued by the acquiring firm, acquisitions are grouped
according to one-year interval and four-year interval, and the sample span in which an acquirer performs frequent
acquisitions. The t-statistic is in bracket. N# reports the number of takeovers. ***Denotes significance at the 1% level. **Denotes significance at the 5% level. *Denotes significance at the 10% level.
2.5.2. The impact of frequency on subsequent acquisition
performance
To further check the finding shown in Table 2-3, CARs are ranked according to
the occurrence orders of acquisitions. The full sample is divided into two subsamples:
single acquirers and frequent acquirers. This will lead us to see if the Rank Four can be
established empirically. Table 2-4 presents evidence on CARs of acquiring firms
declining after the first deal, indicating that the market reacts more strongly to the first
deal. The results are consistent with Conn et al. (2002) who find that the announcement
return decline rather than improve in subsequent acquisition, using a sample of 4,344
52
UK acquisitions during 1984-1998. The Rank Four is clearly evident in Table 2-4.
Further, the evidence is consistent with the notion that acquirers with no acquisition
history show no evidence of hubris or learning impacts.
The Panel A and B of Table 2-4 explore whether the merger impacts of first
takeovers differ between frequent acquirers and infrequent acquirers. It is found that
for the 3,994 of 6,836 first acquisitions made by infrequent acquirers, the average CAR
is 2.53%, statistically distinguishable from zero. For frequent and highly frequent
acquirers, the average of first deal abnormal return is 2.41%, also statistically
significant. The difference between the first takeover CARs for is also insignificantly
different from zero. It appears that the negative effects of mergers only found in high-
order deals (see Panel A), where previous merger experience may lead to the
development of hubris.
The Panel C of Table 2-4 compares CARs with different time intervals between
one and another. The results still strongly suggest that CARs increase with slower pace
of merger, which is consistent across different intervals in support of the learning
hypothesis. CARs for a shorter interval are lower than one with a longer interval. For
instance, the CAR increases from 1.15% with a one-year interval to 2.08% with a two-
year interval for the overall subsample, 2.07% with a one-year interval to 3.38% with a
two-year interval for the first deal, and 1.31% to 1.75% for the second to third deal.
These results are consistent with Hayward (2002) which argues that acquirers need
more time to draw adaptive inference from prior experience on subsequent deals.
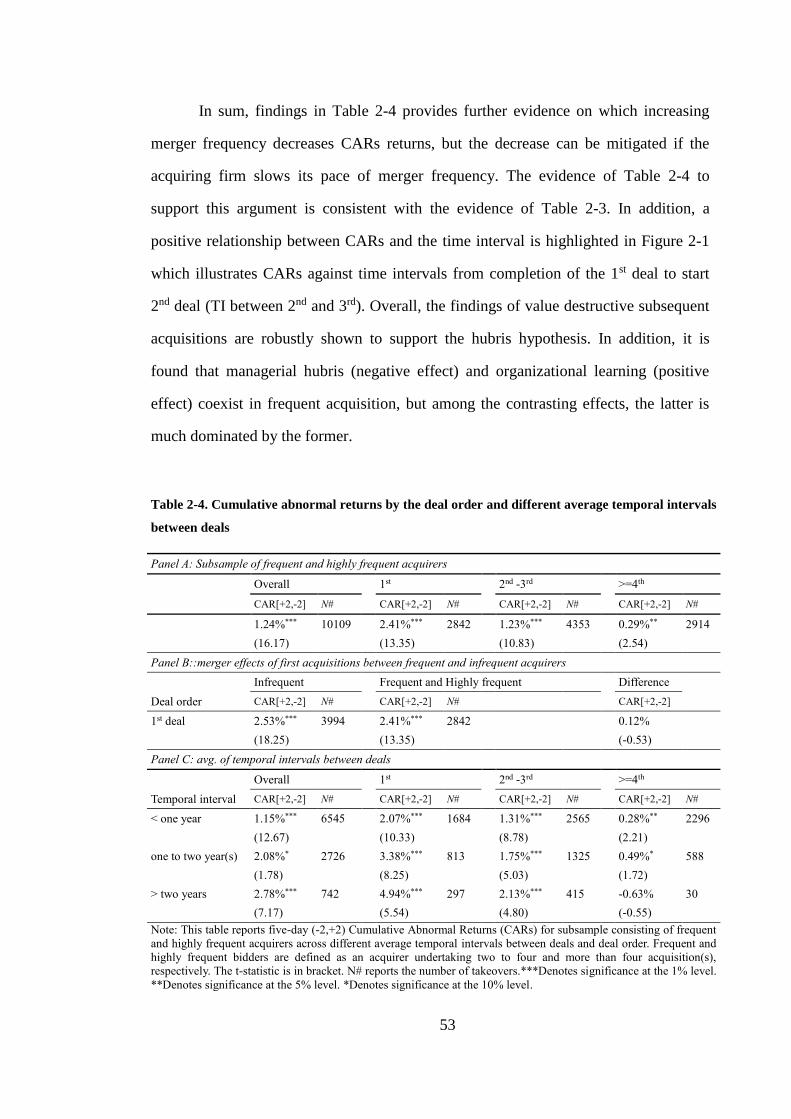
53
In sum, findings in Table 2-4 provides further evidence on which increasing
merger frequency decreases CARs returns, but the decrease can be mitigated if the
acquiring firm slows its pace of merger frequency. The evidence of Table 2-4 to
support this argument is consistent with the evidence of Table 2-3. In addition, a
positive relationship between CARs and the time interval is highlighted in Figure 2-1
which illustrates CARs against time intervals from completion of the 1st deal to start
2nd deal (TI between 2nd and 3rd). Overall, the findings of value destructive subsequent
acquisitions are robustly shown to support the hubris hypothesis. In addition, it is
found that managerial hubris (negative effect) and organizational learning (positive
effect) coexist in frequent acquisition, but among the contrasting effects, the latter is
much dominated by the former.
Table 2-4. Cumulative abnormal returns by the deal order and different average temporal intervals
between deals
Panel A: Subsample of frequent and highly frequent acquirers
Overall
1st
2nd -3rd
>=4th
CAR[+2,-2] N#
CAR[+2,-2] N#
CAR[+2,-2] N#
CAR[+2,-2] N#
1.24%*** 10109
2.41%*** 2842
1.23%*** 4353
0.29%** 2914
(16.17)
(13.35)
(10.83)
(2.54)
Panel B::merger effects of first acquisitions between frequent and infrequent acquirers
Infrequent Frequent and Highly frequent Difference
Deal order CAR[+2,-2] N# CAR[+2,-2] N# CAR[+2,-2]
1st deal 2.53%*** 3994 2.41%*** 2842 0.12%
(18.25) (13.35) (-0.53)
Panel C: avg. of temporal intervals between deals
Overall 1st 2nd -3rd >=4th
Temporal interval CAR[+2,-2] N# CAR[+2,-2] N# CAR[+2,-2] N# CAR[+2,-2] N#
< one year 1.15%*** 6545
2.07%*** 1684
1.31%*** 2565
0.28%** 2296
(12.67)
(10.33)
(8.78)
(2.21)
one to two year(s) 2.08%* 2726
3.38%*** 813
1.75%*** 1325
0.49%* 588
(1.78)
(8.25)
(5.03)
(1.72)
> two years 2.78%*** 742
4.94%*** 297
2.13%*** 415
-0.63% 30
(7.17)
(5.54)
(4.80)
(-0.55)
Note: This table reports five-day (-2,+2) Cumulative Abnormal Returns (CARs) for subsample consisting of frequent
and highly frequent acquirers across different average temporal intervals between deals and deal order. Frequent and
highly frequent bidders are defined as an acquirer undertaking two to four and more than four acquisition(s),
respectively. The t-statistic is in bracket. N# reports the number of takeovers.***Denotes significance at the 1% level.
**Denotes significance at the 5% level. *Denotes significance at the 10% level.
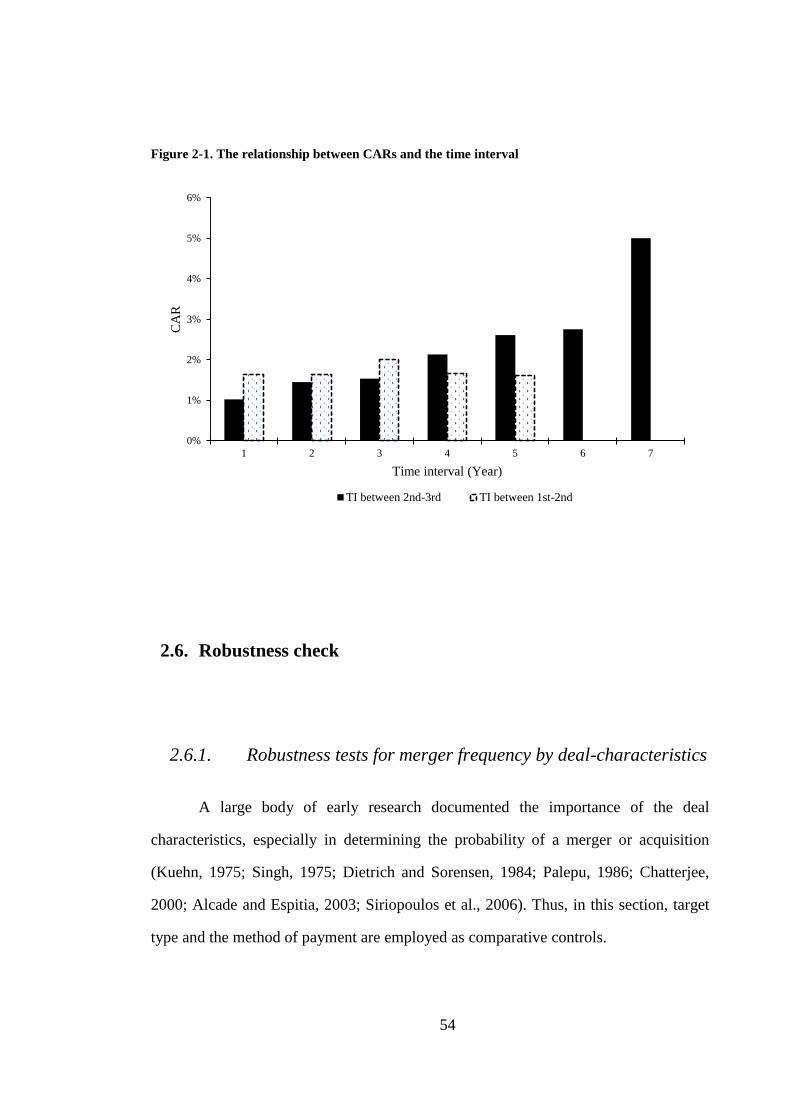
54
Figure 2-1. The relationship between CARs and the time interval
2.6. Robustness check
2.6.1. Robustness tests for merger frequency by deal-characteristics
A large body of early research documented the importance of the deal
characteristics, especially in determining the probability of a merger or acquisition
(Kuehn, 1975; Singh, 1975; Dietrich and Sorensen, 1984; Palepu, 1986; Chatterjee,
2000; Alcade and Espitia, 2003; Siriopoulos et al., 2006). Thus, in this section, target
type and the method of payment are employed as comparative controls.
0%
1%
2%
3%
4%
5%
6%
1 2 3 4 5 6 7
CA
R
Time interval (Year)
TI between 2nd-3rd TI between 1st-2nd
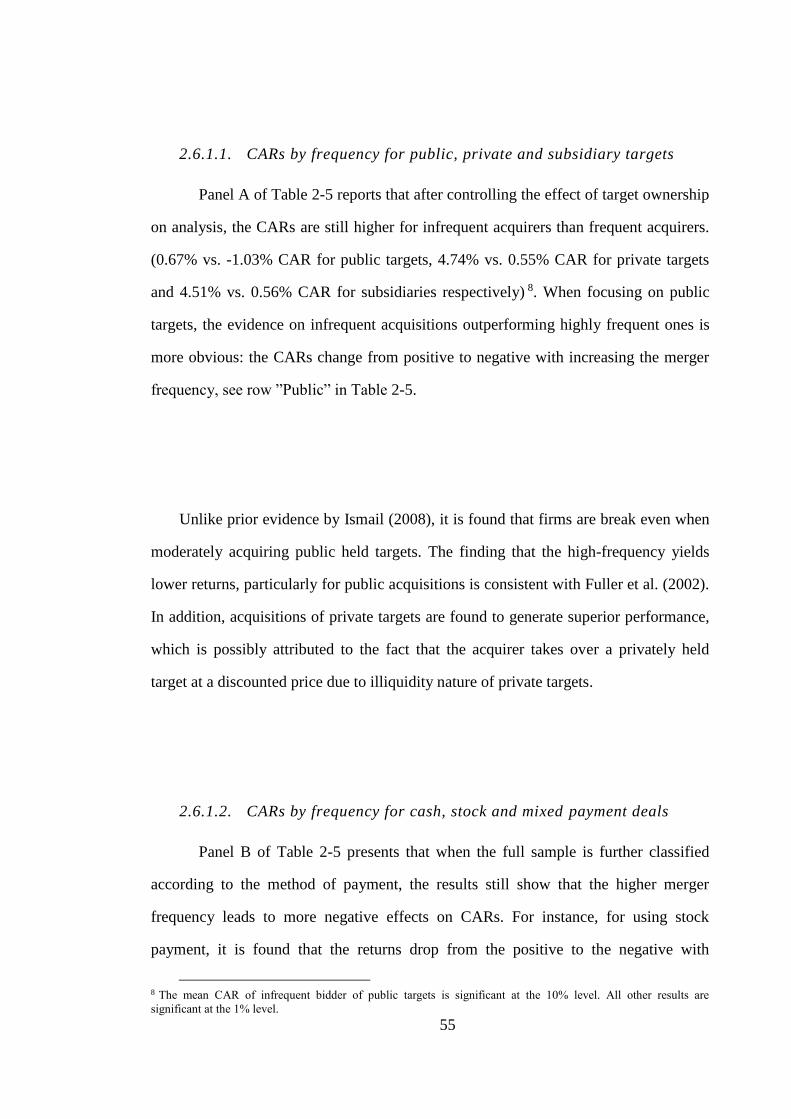
55
2.6.1.1. CARs by frequency for public, private and subsidiary targets
Panel A of Table 2-5 reports that after controlling the effect of target ownership
on analysis, the CARs are still higher for infrequent acquirers than frequent acquirers.
(0.67% vs. -1.03% CAR for public targets, 4.74% vs. 0.55% CAR for private targets
and 4.51% vs. 0.56% CAR for subsidiaries respectively) 8. When focusing on public
targets, the evidence on infrequent acquisitions outperforming highly frequent ones is
more obvious: the CARs change from positive to negative with increasing the merger
frequency, see row ”Public” in Table 2-5.
Unlike prior evidence by Ismail (2008), it is found that firms are break even when
moderately acquiring public held targets. The finding that the high-frequency yields
lower returns, particularly for public acquisitions is consistent with Fuller et al. (2002).
In addition, acquisitions of private targets are found to generate superior performance,
which is possibly attributed to the fact that the acquirer takes over a privately held
target at a discounted price due to illiquidity nature of private targets.
2.6.1.2. CARs by frequency for cash, stock and mixed payment deals
Panel B of Table 2-5 presents that when the full sample is further classified
according to the method of payment, the results still show that the higher merger
frequency leads to more negative effects on CARs. For instance, for using stock
payment, it is found that the returns drop from the positive to the negative with
8 The mean CAR of infrequent bidder of public targets is significant at the 10% level. All other results are
significant at the 1% level.

56
increasing frequency, see row “Pure stock” in Table 2-5. Findings in other rows in
Table 2-5 show a similar pattern: the infrequent outperforms the highly frequent across
different methods of payment. Furthermore, by control of frequency, it is found that
stock offers outperform cash offers for infrequent and frequent acquirers. Also, unlike
the previous research9, this study shows that stock offers generate highest CARs for a
group of the infrequent bidders.
Table 2-5. Cumulative abnormal returns sorted by infrequent, frequent and highly frequent
acquirers based on the target ownership (Panel A) and payment method (Panel B).
Infrequent
Frequent
Highly frequent
CAR[+2,-2] N#
CAR[+2,-2] N#
CAR[+2,-2] N#
Deal-Specification
Panel A: By target ownership
Public 0.67%* 673
0.04% 2792
-1.03%*** 963
(1.69)
(0.15)
(-5.18)
Private 4.74%*** 1890
2.65%*** 1163
0.55%*** 2160
(13.77)
(14.43)
(4.52)
Subsidiary 4.51%*** 1431
2.64%*** 1865
0.56%*** 1166
(13.72)
(12.67)
(3.50)
Panel B: By payment method
Pure cash 2.10%*** 1778
1.65%*** 3148
0.47%*** 2846
(9.69)
(12.34)
(5.19)
Pure stock 5.84%*** 1158
2.41%*** 1047
-1.03%*** 533
(11.48)
(6.84)
(-3.08)
Combination 5.07%*** 1058
2.86%*** 1625
0.07% 910
(11.50)
(10.83)
(0.29)
Note: This table presents five-day (-2,+2) CARs sorted across target ownership status and payment method.
Infrequent, frequent and highly frequent bidder is defined as an acquirer undertaking one, two to four and more than
four acquisition(s), respectively. The target public status is public, private or subsidiary of a public firm. The method
of payment is pure cash, pure equity or mixed. The t-statistic is in bracket. N# reports the number of takeovers.
***Denotes significance at the 1% level. **Denotes significance at the 5% level. *Denotes significance at the 10%
level.
9 See for example, Travlos (1987 )and Change (1998).
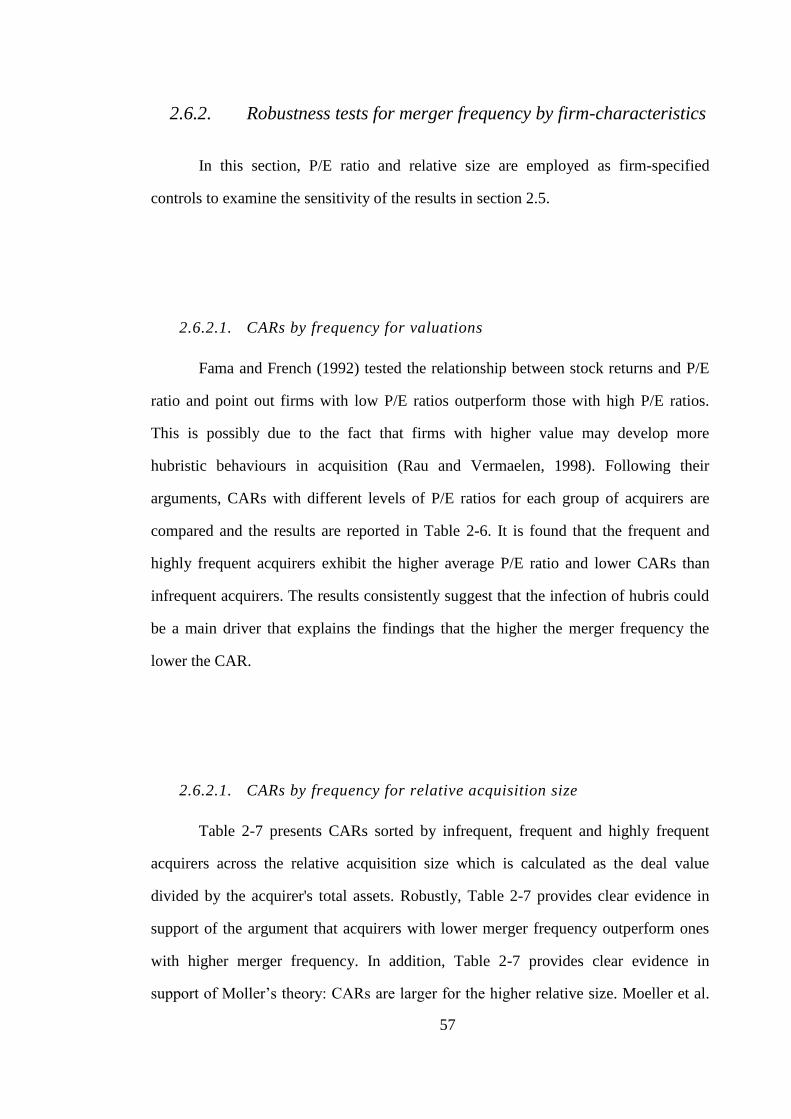
57
2.6.2. Robustness tests for merger frequency by firm-characteristics
In this section, P/E ratio and relative size are employed as firm-specified
controls to examine the sensitivity of the results in section 2.5.
2.6.2.1. CARs by frequency for valuations
Fama and French (1992) tested the relationship between stock returns and P/E
ratio and point out firms with low P/E ratios outperform those with high P/E ratios.
This is possibly due to the fact that firms with higher value may develop more
hubristic behaviours in acquisition (Rau and Vermaelen, 1998). Following their
arguments, CARs with different levels of P/E ratios for each group of acquirers are
compared and the results are reported in Table 2-6. It is found that the frequent and
highly frequent acquirers exhibit the higher average P/E ratio and lower CARs than
infrequent acquirers. The results consistently suggest that the infection of hubris could
be a main driver that explains the findings that the higher the merger frequency the
lower the CAR.
2.6.2.1. CARs by frequency for relative acquisition size
Table 2-7 presents CARs sorted by infrequent, frequent and highly frequent
acquirers across the relative acquisition size which is calculated as the deal value
divided by the acquirer's total assets. Robustly, Table 2-7 provides clear evidence in
support of the argument that acquirers with lower merger frequency outperform ones
with higher merger frequency. In addition, Table 2-7 provides clear evidence in
support of Moller’s theory: CARs are larger for the higher relative size. Moeller et al.
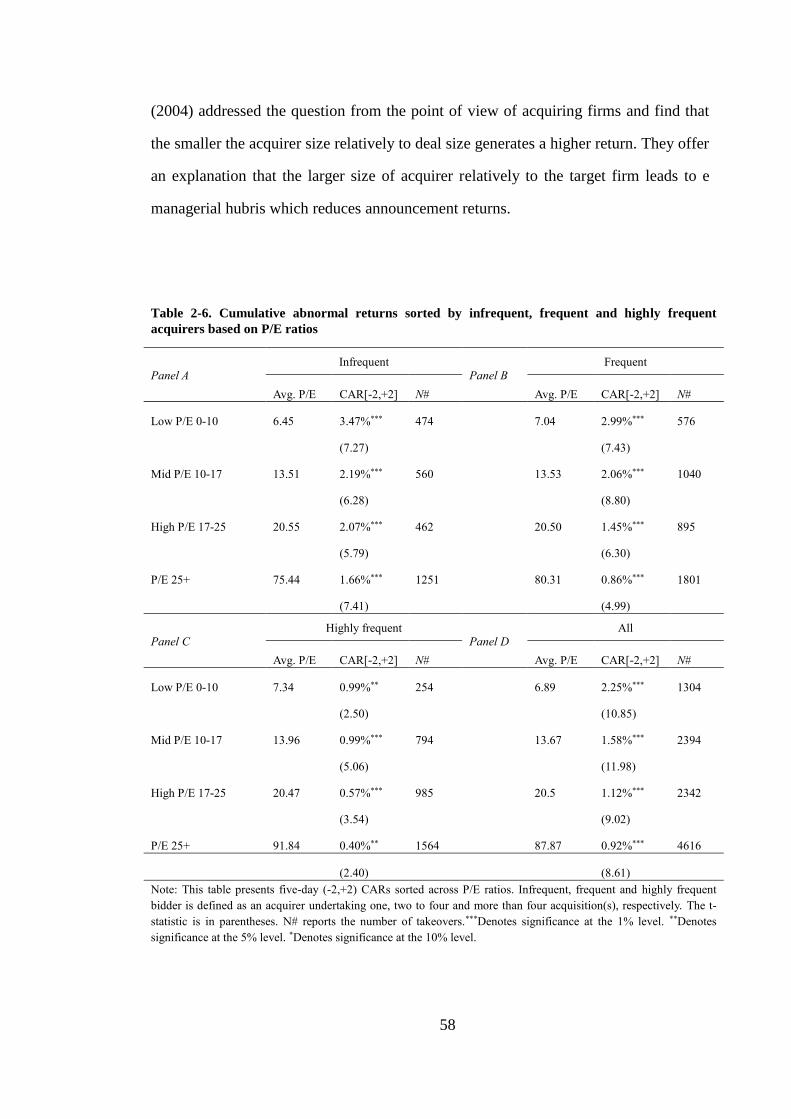
58
(2004) addressed the question from the point of view of acquiring firms and find that
the smaller the acquirer size relatively to deal size generates a higher return. They offer
an explanation that the larger size of acquirer relatively to the target firm leads to e
managerial hubris which reduces announcement returns.
Table 2-6. Cumulative abnormal returns sorted by infrequent, frequent and highly frequent
acquirers based on P/E ratios
Panel A Infrequent
Panel B Frequent
Avg. P/E CAR[-2,+2] N# Avg. P/E CAR[-2,+2] N#
Low P/E 0-10 6.45 3.47%*** 474
7.04 2.99%*** 576
(7.27)
(7.43)
Mid P/E 10-17 13.51 2.19%*** 560
13.53 2.06%*** 1040
(6.28)
(8.80)
High P/E 17-25 20.55 2.07%*** 462
20.50 1.45%*** 895
(5.79)
(6.30)
P/E 25+ 75.44 1.66%*** 1251
80.31 0.86%*** 1801
(7.41)
(4.99)
Panel C Highly frequent
Panel D All
Avg. P/E CAR[-2,+2] N# Avg. P/E CAR[-2,+2] N#
Low P/E 0-10 7.34 0.99%** 254
6.89 2.25%*** 1304
(2.50)
(10.85)
Mid P/E 10-17 13.96 0.99%*** 794
13.67 1.58%*** 2394
(5.06)
(11.98)
High P/E 17-25 20.47 0.57%*** 985
20.5 1.12%*** 2342
(3.54)
(9.02)
P/E 25+ 91.84 0.40%** 1564
87.87 0.92%*** 4616
(2.40)
(8.61)
Note: This table presents five-day (-2,+2) CARs sorted across P/E ratios. Infrequent, frequent and highly frequent
bidder is defined as an acquirer undertaking one, two to four and more than four acquisition(s), respectively. The t-
statistic is in parentheses. N# reports the number of takeovers.***Denotes significance at the 1% level. **Denotes
significance at the 5% level. *Denotes significance at the 10% level.

59
Table 2-7. Cumulative abnormal returns sorted by infrequent, frequent and highly frequent acquirers based on the relative acquisition size
Overall Infrequent
Frequent
Highly frequent
Relative Size(R.S) Avg. of R.S CAR[-2,+2] N#
Avg. of R.S CAR[-2,+2] N#
Avg. of R.S CAR[-2,+2] N#
Avg. of R.S CAR[-2,+2] N#
<5% 1.83% 0.54%*** 5832
2.20% 0.51%** 986
1.99% 0.47%*** 2142
1.57% 0.30%*** 2704
(6.22)
(2.19)
(3.16)
(2.83)
5% to 15% 9.14% 1.98%*** 3379
9.26% 2.27%*** 944
9.19% 2.09%*** 1532
8.94% 1.50%*** 903
(12.60)
(6.51)
(9.03)
(6.18)
15% to 25% 19.54% 2.49%*** 1350
19.66% 3.40%*** 476
19.49% 2.25%*** 635
19.41% 1.29%** 239
(8.38)
(5.48)
(5.94)
(2.55)
> 25% 124.11% 7.10%*** 3542
184.60% 10.00%*** 1588
127.06% 5.84%*** 1511
86.74% 2.01%* 443
(20.63)
(15.53)
(14.76)
(1.96)
Note: This table presents five-day (-2,+2) CARs sorted by infrequent, frequent and highly frequent acquirers across the relative acquisition size. Infrequent, frequent and highly frequent bidder
is defined as an acquirer undertaking one, two to four and more than four acquisition(s), respectively. The relative acquisition size is calculated as the deal value divided by the acquirer's total
assets. The t-statistic is in bracket. N# reports the number of takeovers.***Denotes significance at the 1% level. **Denotes significance at the 5% level. *Denotes significance at the 10% level.
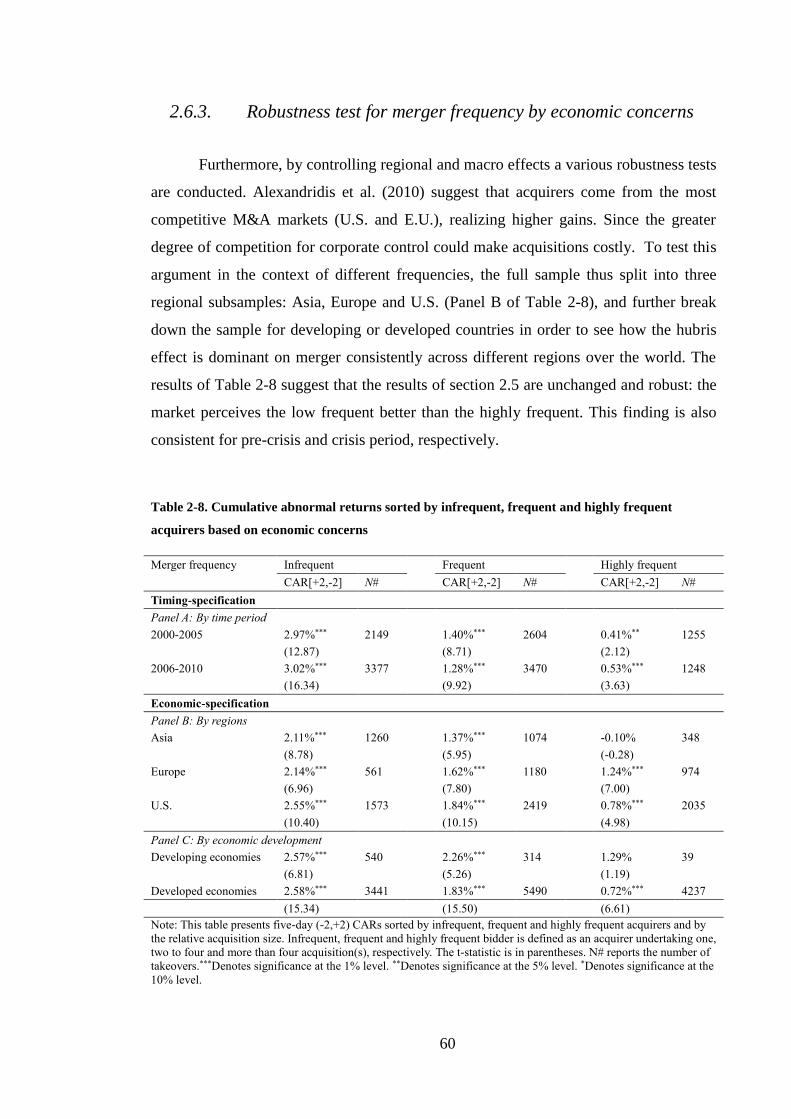
60
2.6.3. Robustness test for merger frequency by economic concerns
Furthermore, by controlling regional and macro effects a various robustness tests
are conducted. Alexandridis et al. (2010) suggest that acquirers come from the most
competitive M&A markets (U.S. and E.U.), realizing higher gains. Since the greater
degree of competition for corporate control could make acquisitions costly. To test this
argument in the context of different frequencies, the full sample thus split into three
regional subsamples: Asia, Europe and U.S. (Panel B of Table 2-8), and further break
down the sample for developing or developed countries in order to see how the hubris
effect is dominant on merger consistently across different regions over the world. The
results of Table 2-8 suggest that the results of section 2.5 are unchanged and robust: the
market perceives the low frequent better than the highly frequent. This finding is also
consistent for pre-crisis and crisis period, respectively.
Table 2-8. Cumulative abnormal returns sorted by infrequent, frequent and highly frequent
acquirers based on economic concerns
Merger frequency Infrequent
Frequent
Highly frequent
CAR[+2,-2] N#
CAR[+2,-2] N#
CAR[+2,-2] N#
Timing-specification
Panel A: By time period
2000-2005 2.97%*** 2149
1.40%*** 2604
0.41%** 1255
(12.87)
(8.71)
(2.12)
2006-2010 3.02%*** 3377
1.28%*** 3470
0.53%*** 1248
(16.34)
(9.92)
(3.63)
Economic-specification
Panel B: By regions
Asia 2.11%*** 1260
1.37%*** 1074
-0.10% 348
(8.78)
(5.95)
(-0.28)
Europe 2.14%*** 561
1.62%*** 1180
1.24%*** 974
(6.96)
(7.80)
(7.00)
U.S. 2.55%*** 1573
1.84%*** 2419
0.78%*** 2035
(10.40)
(10.15)
(4.98)
Panel C: By economic development
Developing economies 2.57%*** 540
2.26%*** 314
1.29% 39
(6.81)
(5.26)
(1.19)
Developed economies 2.58%*** 3441
1.83%*** 5490
0.72%*** 4237
(15.34)
(15.50)
(6.61)
Note: This table presents five-day (-2,+2) CARs sorted by infrequent, frequent and highly frequent acquirers and by
the relative acquisition size. Infrequent, frequent and highly frequent bidder is defined as an acquirer undertaking one,
two to four and more than four acquisition(s), respectively. The t-statistic is in parentheses. N# reports the number of
takeovers.***Denotes significance at the 1% level. **Denotes significance at the 5% level. *Denotes significance at the
10% level.

61
2.6.4. Robustness test for subsequent acquisitions
Following Conn et al. (2004) and Billett and Qian (2008), an initial successful
acquisition is defined as a first deal exhibiting positive abnormal return. Table 2-9
reports the CARs for initially successful deal (CARs>0) and subsequent deals according
to frequency. The results are consistent with the findings of Table 2-4 that CARs are
higher for the first deal than subsequent deals or high-order deals, suggesting that
bidders could develop’ hubris after making the first successful acquisition, explains
lower returns for subsequent acquisitions. Overall, the hubris phenomenon is consistent
across three merger-frequency groups of firms.
In table 2-10, the performance of subsequent deals is further tested against different
regional samples, target ownerships, pre-crisis and the crisis period, respectively. The
results remain consistently robust: the management develops hubris significantly for
subsequent acquisitions after the first deal.
Table 2-9. Cumulative abnormal returns for infrequent, frequent and highly frequent acquirers
firms associated with the initial success across deal order
Deal Order Infrequent Frequent Highly Frequent
CAR[-2,+2] N# CAR[-2,+2] N# CAR[-2,+2] N#
1st 8.29%*** 2338 7.87%*** 1365 8.63%*** 333
(55.55)
(43.04)
(15.54)
2nd-3th
1.57%*** 2124 1.15%*** 999
(8.93)
(4.85)
>=4th
0.54%*** 1154
(2.94)
Overall 8.29%*** 2338 4.03%*** 3489 1.87%*** 2486
(55.55)
(29.08)
(11.86)
Note: This table reports five-day (-2,+2) Cumulative Abnormal Returns (CARs) associated with the initial success
across deal order. The initial success is defined as the first acquisition generates CAR greater than zero. Infrequent,
frequent and highly frequent bidder is defined as an acquirer undertaking one, two to four and more than four
acquisition(s), respectively. The t-statistic is in parentheses. N# reports the number of takeovers. ***Denotes
significance at the 1% level. **Denotes significance at the 5% level. *Denotes significance at the 10% level.
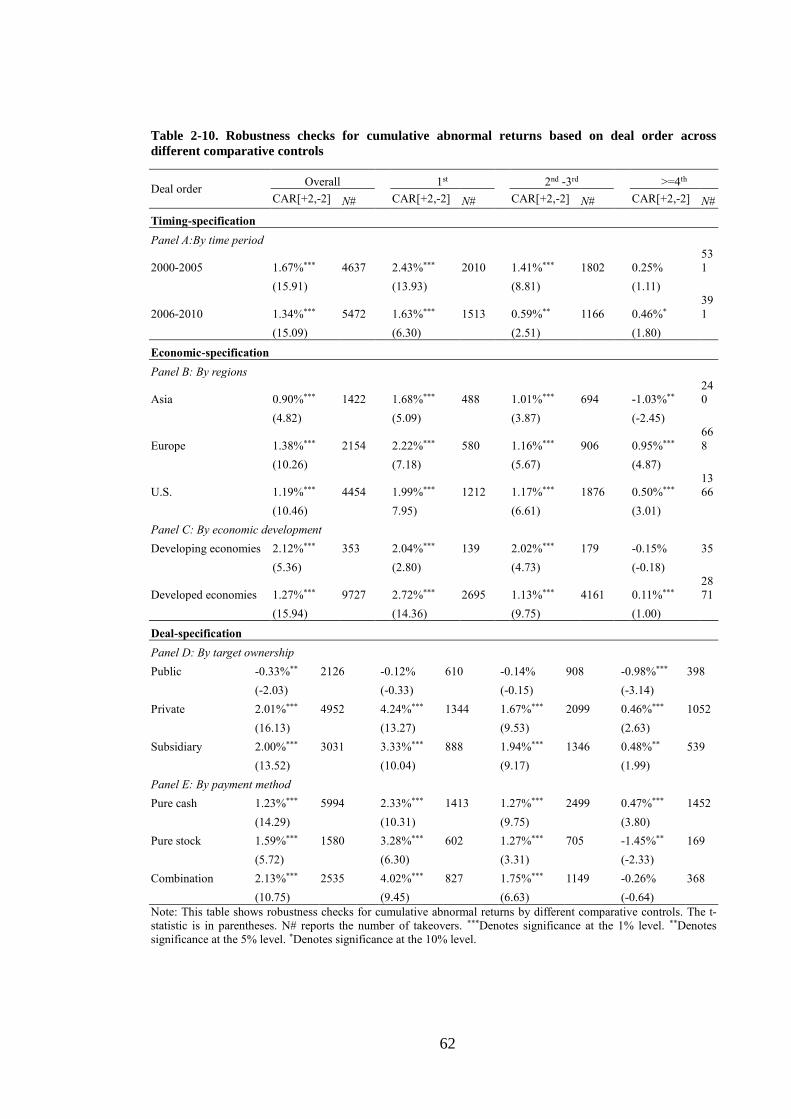
62
Table 2-10. Robustness checks for cumulative abnormal returns based on deal order across
different comparative controls
Deal order Overall
1st
2nd -3rd
>=4th
CAR[+2,-2] N#
CAR[+2,-2] N#
CAR[+2,-2] N#
CAR[+2,-2] N#
Timing-specification
Panel A:By time period
2000-2005 1.67%*** 4637
2.43%*** 2010
1.41%*** 1802
0.25%
53
1
(15.91)
(13.93)
(8.81)
(1.11)
2006-2010 1.34%*** 5472
1.63%*** 1513
0.59%** 1166
0.46%*
39
1
(15.09)
(6.30)
(2.51)
(1.80)
Economic-specification
Panel B: By regions
Asia 0.90%*** 1422
1.68%*** 488
1.01%*** 694
-1.03%**
24
0
(4.82)
(5.09)
(3.87)
(-2.45)
Europe 1.38%*** 2154
2.22%*** 580
1.16%*** 906
0.95%***
66
8
(10.26)
(7.18)
(5.67)
(4.87)
U.S. 1.19%*** 4454
1.99%*** 1212
1.17%*** 1876
0.50%***
13
66
(10.46)
7.95)
(6.61)
(3.01)
Panel C: By economic development
Developing economies 2.12%*** 353
2.04%*** 139
2.02%*** 179
-0.15% 35
(5.36)
(2.80)
(4.73)
(-0.18)
Developed economies 1.27%*** 9727
2.72%*** 2695
1.13%*** 4161
0.11%***
28
71
(15.94)
(14.36)
(9.75)
(1.00)
Deal-specification
Panel D: By target ownership
Public -0.33%** 2126
-0.12% 610
-0.14% 908
-0.98%*** 398
(-2.03)
(-0.33)
(-0.15)
(-3.14)
Private 2.01%*** 4952
4.24%*** 1344
1.67%*** 2099
0.46%*** 1052
(16.13)
(13.27)
(9.53)
(2.63)
Subsidiary 2.00%*** 3031
3.33%*** 888
1.94%*** 1346
0.48%** 539
(13.52)
(10.04)
(9.17)
(1.99)
Panel E: By payment method
Pure cash 1.23%*** 5994
2.33%*** 1413
1.27%*** 2499
0.47%*** 1452
(14.29)
(10.31)
(9.75)
(3.80)
Pure stock 1.59%*** 1580
3.28%*** 602
1.27%*** 705
-1.45%** 169
(5.72)
(6.30)
(3.31)
(-2.33)
Combination 2.13%*** 2535
4.02%*** 827
1.75%*** 1149
-0.26% 368
(10.75)
(9.45)
(6.63)
(-0.64)
Note: This table shows robustness checks for cumulative abnormal returns by different comparative controls. The t-
statistic is in parentheses. N# reports the number of takeovers. ***Denotes significance at the 1% level. **Denotes
significance at the 5% level. *Denotes significance at the 10% level.
63
2.7. Conclusions
By using a sample of 14,103 acquisitions collected from different countries over
11 years from 2000 to 2010, this study examines the effect of merger frequency on the
expectation of investors to the integration of new business for their performance in the
future. A univariate analysis is taken to explore the effects of merger frequency on
cumulative abnormal returns for three groups of acquirers, respectively, the infrequent,
the frequent and the highly frequent.
The comparative results of CARs show that the low frequent acquirers
outperform the highly frequent ones, in which this finding is consistent and robust
across different time length, different regions, different time periods, different
ownerships of target firms, different size of deals and different payment methods made
by acquirers.
The significant findings above provide clear evidence on which the acquiring
managements or firms have developed the hubris from their previously successful
experiences on mergers and acquisitions. The development of hubris with more mergers
drives down the expectation of investors for better performing in the future of the new
integration and so lowering the value of the firm. Although the managements of
acquiring firms are expected to have worse performance after their first deal or second
deals of mergers due to growing hubris in M&A, this does not mean that the
management learning effect shall be rejected. The study does show evidence on the
learning effect that drives up the market expectation for the future improvement of new
integration if the time interval between the two mergers pursued by the firm is longer.
64
The short break between the two mergers cannot provide the new integration
with sufficient time to digest new opportunities and challenges raised from the
acquisition before a new one starts. The results are consistent and robust across different
frequencies of mergers: the firm with a longer break for next merger after its last one
drives up market expectation for the future performance and so the higher value of the
firm. For a given frequency, the management learning plays a role in performance
improvement. In other words, the effect of management hubris or agency issue brought
by more mergers can be mitigated or offset by more learning allowed by the longer
break between the mergers. In sum, an increase in acquisitions develops more negative
impact of hubris or agency issue, but the adverse effects of them on performance can be
offset or weakened by increasing time interval between mergers.
Finally, this study also identifies that the hubris effect on performance can be offset
or weakened by increasing the size of acquisition. The large size exposes the acquiring
firm to a high risk for devastating business of the acquisition fails. This risk pressure
leads the firm to be more careful in handling the large deals.
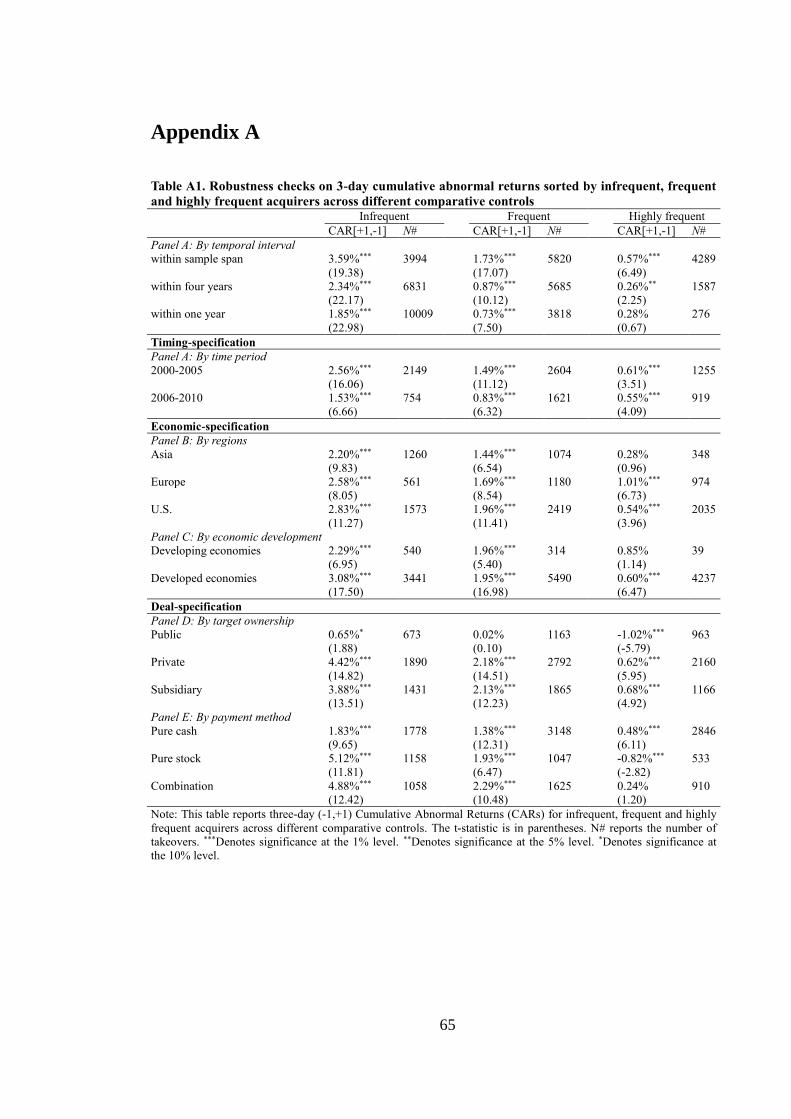
65
Appendix A
Table A1. Robustness checks on 3-day cumulative abnormal returns sorted by infrequent, frequent
and highly frequent acquirers across different comparative controls
Infrequent Frequent Highly frequent
CAR[+1,-1] N# CAR[+1,-1] N# CAR[+1,-1] N#
Panel A: By temporal interval
within sample span 3.59%*** 3994
1.73%*** 5820
0.57%*** 4289
(19.38)
(17.07)
(6.49)
within four years 2.34%*** 6831
0.87%*** 5685
0.26%** 1587
(22.17)
(10.12)
(2.25)
within one year 1.85%*** 10009 0.73%*** 3818
0.28% 276
(22.98)
(7.50)
(0.67)
Timing-specification
Panel A: By time period
2000-2005 2.56%*** 2149
1.49%*** 2604
0.61%*** 1255
(16.06)
(11.12)
(3.51)
2006-2010 1.53%*** 754
0.83%*** 1621
0.55%*** 919
(6.66)
(6.32)
(4.09)
Economic-specification
Panel B: By regions
Asia 2.20%*** 1260
1.44%*** 1074
0.28% 348
(9.83)
(6.54)
(0.96)
Europe 2.58%*** 561
1.69%*** 1180
1.01%*** 974
(8.05)
(8.54)
(6.73)
U.S. 2.83%*** 1573
1.96%*** 2419
0.54%*** 2035
(11.27)
(11.41)
(3.96)
Panel C: By economic development
Developing economies 2.29%*** 540
1.96%*** 314
0.85% 39
(6.95)
(5.40)
(1.14)
Developed economies 3.08%*** 3441
1.95%*** 5490
0.60%*** 4237
(17.50) (16.98) (6.47)
Deal-specification
Panel D: By target ownership
Public 0.65%* 673
0.02% 1163
-1.02%*** 963
(1.88)
(0.10)
(-5.79)
Private 4.42%*** 1890
2.18%*** 2792
0.62%*** 2160
(14.82)
(14.51)
(5.95)
Subsidiary 3.88%*** 1431
2.13%*** 1865
0.68%*** 1166
(13.51)
(12.23)
(4.92)
Panel E: By payment method
Pure cash 1.83%*** 1778
1.38%*** 3148
0.48%*** 2846
(9.65)
(12.31)
(6.11)
Pure stock 5.12%*** 1158
1.93%*** 1047
-0.82%*** 533
(11.81)
(6.47)
(-2.82)
Combination 4.88%*** 1058
2.29%*** 1625
0.24% 910
(12.42)
(10.48) (1.20)
Note: This table reports three-day (-1,+1) Cumulative Abnormal Returns (CARs) for infrequent, frequent and highly
frequent acquirers across different comparative controls. The t-statistic is in parentheses. N# reports the number of
takeovers. ***Denotes significance at the 1% level. **Denotes significance at the 5% level. *Denotes significance at
the 10% level.
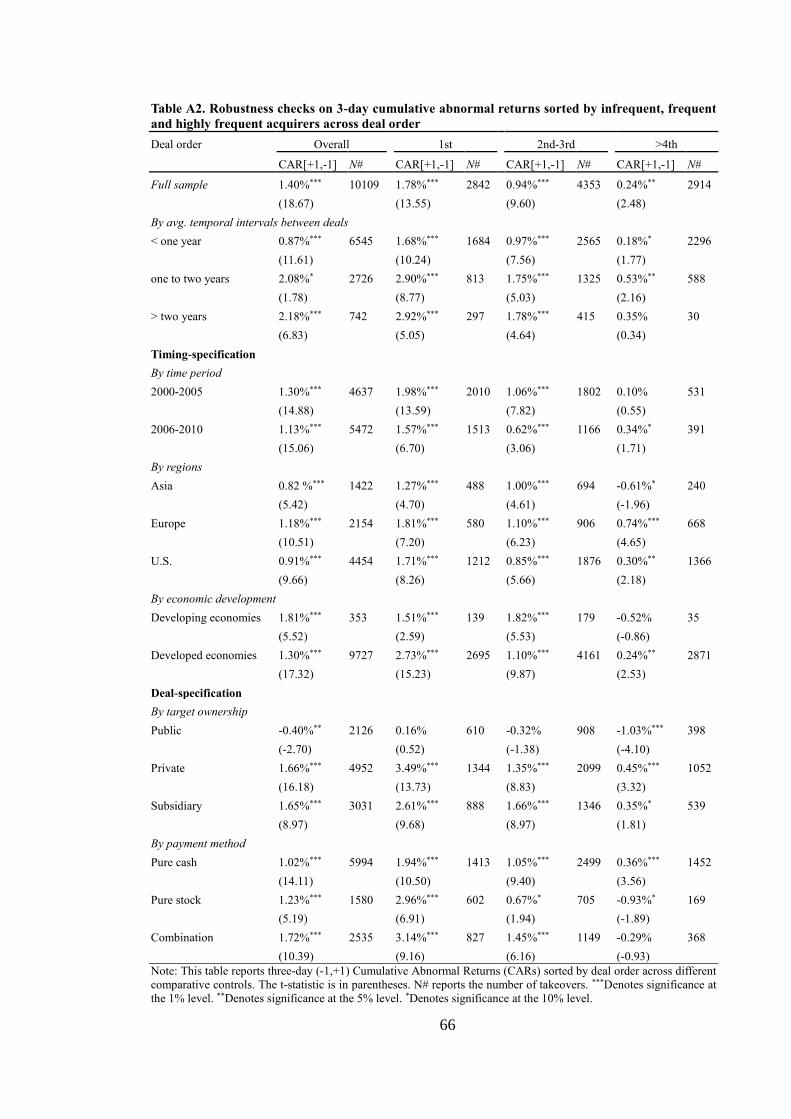
66
Table A2. Robustness checks on 3-day cumulative abnormal returns sorted by infrequent, frequent
and highly frequent acquirers across deal order
Deal order Overall 1st 2nd-3rd >4th
CAR[+1,-1] N# CAR[+1,-1] N# CAR[+1,-1] N# CAR[+1,-1] N#
Full sample 1.40%*** 10109
1.78%*** 2842 0.94%*** 4353
0.24%** 2914
(18.67)
(13.55)
(9.60)
(2.48)
By avg. temporal intervals between deals
< one year 0.87%*** 6545
1.68%*** 1684
0.97%*** 2565
0.18%* 2296
(11.61)
(10.24)
(7.56)
(1.77)
one to two years 2.08%* 2726
2.90%*** 813
1.75%*** 1325
0.53%** 588
(1.78)
(8.77)
(5.03)
(2.16)
> two years 2.18%*** 742
2.92%*** 297
1.78%*** 415
0.35% 30
(6.83)
(5.05)
(4.64)
(0.34)
Timing-specification
By time period
2000-2005 1.30%*** 4637
1.98%*** 2010
1.06%*** 1802
0.10% 531
(14.88)
(13.59)
(7.82)
(0.55)
2006-2010 1.13%*** 5472
1.57%*** 1513
0.62%*** 1166
0.34%* 391
(15.06)
(6.70)
(3.06)
(1.71)
By regions
Asia 0.82 %*** 1422
1.27%*** 488
1.00%*** 694
-0.61%* 240
(5.42)
(4.70)
(4.61)
(-1.96)
Europe 1.18%*** 2154
1.81%*** 580
1.10%*** 906
0.74%*** 668
(10.51)
(7.20)
(6.23)
(4.65)
U.S. 0.91%*** 4454
1.71%*** 1212
0.85%*** 1876
0.30%** 1366
(9.66)
(8.26)
(5.66)
(2.18)
By economic development
Developing economies 1.81%*** 353
1.51%*** 139
1.82%*** 179
-0.52% 35
(5.52)
(2.59)
(5.53)
(-0.86)
Developed economies 1.30%*** 9727
2.73%*** 2695
1.10%*** 4161
0.24%** 2871
(17.32)
(15.23)
(9.87)
(2.53)
Deal-specification
By target ownership
Public -0.40%** 2126
0.16% 610
-0.32% 908
-1.03%*** 398
(-2.70)
(0.52)
(-1.38)
(-4.10)
Private 1.66%*** 4952
3.49%*** 1344
1.35%*** 2099
0.45%*** 1052
(16.18)
(13.73)
(8.83)
(3.32)
Subsidiary 1.65%*** 3031
2.61%*** 888
1.66%*** 1346
0.35%* 539
(8.97)
(9.68)
(8.97)
(1.81)
By payment method
Pure cash 1.02%*** 5994
1.94%*** 1413
1.05%*** 2499
0.36%*** 1452
(14.11)
(10.50)
(9.40)
(3.56)
Pure stock 1.23%*** 1580
2.96%*** 602
0.67%* 705
-0.93%* 169
(5.19)
(6.91)
(1.94)
(-1.89)
Combination 1.72%*** 2535
3.14%*** 827
1.45%*** 1149
-0.29% 368
(10.39)
(9.16)
(6.16)
(-0.93)
Note: This table reports three-day (-1,+1) Cumulative Abnormal Returns (CARs) sorted by deal order across different
comparative controls. The t-statistic is in parentheses. N# reports the number of takeovers. ***Denotes significance at
the 1% level. **Denotes significance at the 5% level. *Denotes significance at the 10% level.

67
Appendix B
Table B1. Cumulative abnormal returns sorted by infrequent, frequent and highly frequent
acquirers based time intervals across different regions and economies
Panel A:By regions
Infrequent
Frequent
Highly frequent
CAR[+2,-2] N#
CAR[+2,-2] N#
CAR[+2,-2] N#
Asia
within sample span 2.11%*** 1260
1.37%*** 1074
-0.10% 348
(8.78)
(5.95)
(-0.28)
within three years 2.07%*** 1417
1.07%*** 1098
-0.85%* 167
(9.10)
(5.03)
(-1.68)
within one year 1.87%*** 2001
0.59%** 657
-2.84%* 24
(10.26)
(2.12)
(-1.79)
Infrequent Frequent Highly frequent
CAR[+2,-2] N# CAR[+2,-2] N# CAR[+2,-2] N#
Europe
within sample span 2.14%*** 561
1.62%*** 1180
1.24%*** 974
(6.96)
(7.80)
(7.00)
within three years 1.97%*** 651
1.66%*** 1360
1.11%*** 704
(6.80)
(8.95)
(5.45)
within one year 1.78%*** 1331
1.47%*** 1252
0.79%** 132
(8.87)
(8.65)
(2.01)
Infrequent Frequent Highly frequent
CAR[+2,-2] N#
CAR[+2,-2] N#
CAR[+2,-2] N#
U.S.
within sample span 2.55%*** 1573
1.84%*** 2419
0.78%*** 2035
(10.40)
(10.15)
(4.98)
within three years 2.49%*** 1872
1.52%*** 2771
0.85%*** 1384
(11.19)
(9.38)
(4.48)
within one year 2.17%*** 3288
1.09%*** 2491
0.86%* 248
(13.49)
(6.97)
(1.84)
Infrequent
Frequent
Highly frequent
CAR[+2,-2] N#
CAR[+2,-2] N#
CAR[+2,-2] N#
Panel B:By economies
Infrequent Frequent Highly frequent
CAR[+2,-2] N# CAR[+2,-2] N# CAR[+2,-2] N#
Developing economies
within sample span 2.57%*** 540
2.26%*** 314
1.29% 39
(6.81)
(5.26)
(1.19)
within three years 2.67%*** 586
1.97%*** 288
0.98% 19
(7.18)
(4.99)
(0.54)
within one year 2.50%*** 780
1.73%*** 113
- -
(8.21)
(2.78)
-
Infrequent
Frequent
Highly frequent
CAR[+2,-2] N# CAR[+2,-2] N# CAR[+2,-2] N#
Developed economies
within sample span 2.58%*** 3441
1.83%*** 5490
0.72%*** 4237
(15.34)
(15.50)
(6.61)
within three years 2.56%*** 4071
1.48%*** 6209
0.81%*** 2888
(16.77)
(13.75)
(6.38)
within one year 2.18%*** 7288
1.09%*** 5373
0.40% 507
(20.14)
(10.35)
(1.26)
Note: This table reports five-day (-2,+2) Cumulative Abnormal Returns (CARs) for infrequent, frequent and highly
frequent acquirers by time intervals across different regions and economies. The t-statistic is in parentheses. N#
reports the number of takeovers. ***Denotes significance at the 1% level. **Denotes significance at the 5% level. *Denotes significance at the 10% level.
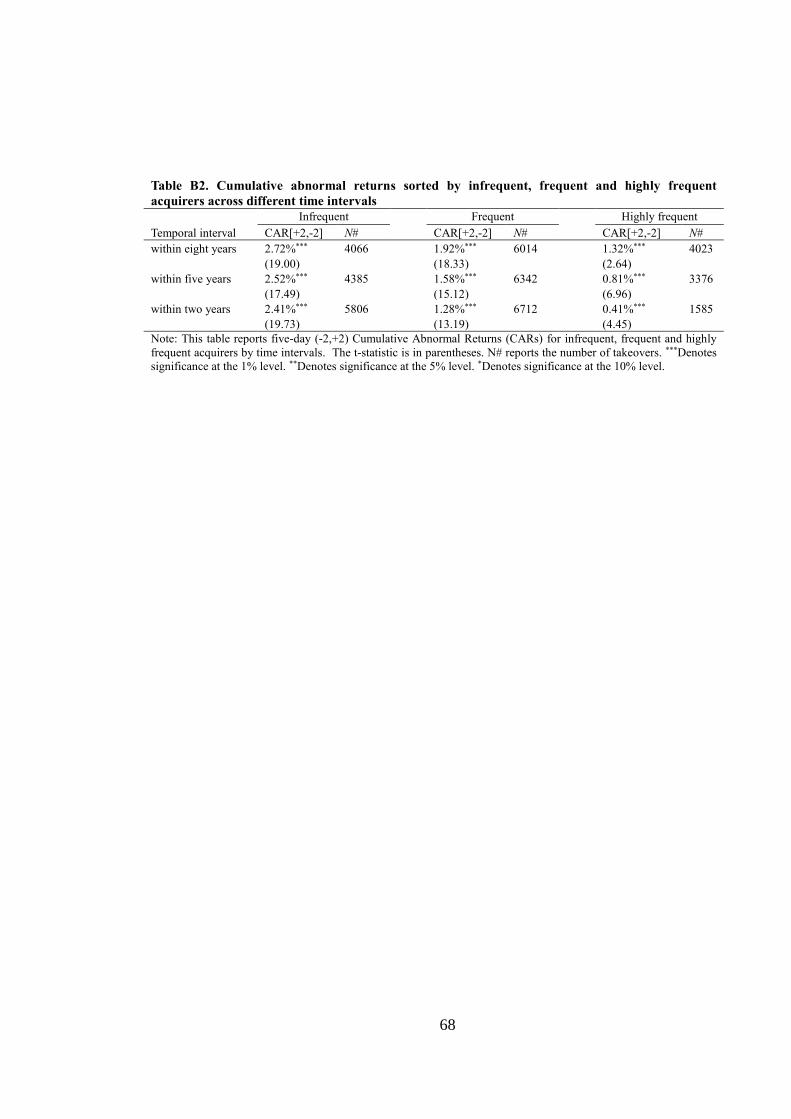
68
Table B2. Cumulative abnormal returns sorted by infrequent, frequent and highly frequent
acquirers across different time intervals
Infrequent
Frequent
Highly frequent
Temporal interval CAR[+2,-2] N#
CAR[+2,-2] N#
CAR[+2,-2] N#
within eight years 2.72%*** 4066
1.92%*** 6014
1.32%*** 4023
(19.00)
(18.33)
(2.64)
within five years 2.52%*** 4385
1.58%*** 6342
0.81%*** 3376
(17.49)
(15.12)
(6.96)
within two years 2.41%*** 5806
1.28%*** 6712
0.41%*** 1585
(19.73)
(13.19)
(4.45)
Note: This table reports five-day (-2,+2) Cumulative Abnormal Returns (CARs) for infrequent, frequent and highly
frequent acquirers by time intervals. The t-statistic is in parentheses. N# reports the number of takeovers. ***Denotes
significance at the 1% level. **Denotes significance at the 5% level. *Denotes significance at the 10% level.

69
Appendix C
Table C1. Comparative sample statistics for different definitions of acquirer type sorted by
payment method, target ownership status and interaction controls
Merger frequency Infrequent
Frequent
Highly frequent
CAR[+2,-2] N#
CAR[+2,-2] N#
CAR[+2,-2] N#
Panel A: Overall
3.84%*** 6656 1.62%*** 4228 0.27%*** 3219
(23.89)
(13.04)
(2.61)
Panel B: By target ownership
Public 0.78%*** 1177
-0.41 919
-0.72%*** 703
(2.72)
(-1.60)
(-3.22)
Private 4.73%*** 3133
2.22%*** 2047
0.51%*** 1662
(17.99)
(12.32)
(3.43)
Subsidiary 4.17%*** 2346
2.13%*** 1262
0.64%*** 854
(16.89)
(9.49)
(3.28)
Panel C: By payment method
Pure cash 2.09%*** 3147
1.46%*** 2440
0.47*** 2185
(13.02)
(10.85)
(4.45)
Pure stock 5.80%*** 1698
1.54%*** 671
-0.99%** 369
(13.93)
(3.94)
(-2.27)
Combination 5.04%*** 1811
2.02%*** 1117
0.32% 665
(14.98)
(7.15)
(1.16)
Note: This table reports five-day (-2,+2) Cumulative Abnormal Returns (CARs) for infrequent, frequent and highly
frequent acquirers by target type and payment method. Infrequent, frequent and highly frequent bidder is defined as
an acquirer undertaking one to two, three to five and more than five acquisitions during 2000-2010, respectively. The
t-statistic is in parentheses. N# reports the number of takeovers.***Denotes significance at the 1% level. **Denotes significance at the 5% level. *Denotes significance at the 10% level.
70
3. How does frequent acquisition affect the market
expectation of performance changes after acquisition? The
role of merger quantity and time interval
3.1. Introduction
Previous research on merger and acquisition adopted a univariate approach
which was widely applied in studies of merger frequency10. The second chapter, about
univariate analysis, explored how not only Cumulative Abnormal Returns (CARs)
decrease with more mergers, but also provided a little clue that how they increase with
temporal intervals. In this chapter a multivariate analysis is employed to test the joint
effects of merger frequency from the perspective of inferential statistics. As compared
to univariate approach, the multivariate one enables a more effective exploration about
the marginal effect of merger frequency on announcement returns when other effects are
controlled or isolated in the estimation. Thus, the results of multivariate estimation can
inform us about how merger frequency affects CARs particularly at the presence of
other on stock value.
Based on a large global sample of 14,000 takeovers, this chapter shows that
announcement returns are lower when an acquiring firm takes a more aggressive merger
strategy. However, this negative impact may not always exist when the time interval is
long. This suggests that among the managerial behaviours that develop in the course of
repetitive merger activities, management hubris and, over time, management learning
10 Merger frequency is measured as the quantity of acquisition for a given period.
71
may co-exist. More specifically, if an acquiring firm develops “hubris” from frequent
acquisitions, then a negative relation between frequency and CARs may be expected. If
the time intervals between those acquisitions are longer, then there will be a greater
opportunity for acquiring firms to learn experience from their takeovers. The positive
impact of learning may reduce the negative effect of hubris and thus weakens the
negative impact of merger frequency on announcement returns. Consistent with chapter
2, this study also found that for a given merger frequency the size of acquisition or
merger is positively related to announcement returns. It can be explained by the effect
of “risk pressure” on the managerial behaviour of acquiring firms.
This chapter makes three significant contributions to the existing literature on
corporate merger strategy. Firstly, the study develops a new method of defining the
merger frequency that interacts the number of mergers with the time that a merger effect
may last after the event occurrence. Secondly, this study adds to the literature on how
acquisitions affect the acquiring firm’s stock performance in both the temporal and
quantitative perspectives. Thirdly, it builds upon studies about the different implications
to relationship between aggressiveness of merger strategy and market expectation.
Fourthly, a new argument is posited that a larger deal size produces a more positive
impact on performance improvement for the acquiring firms due to the risk pressure on
management.
The rest of the chapter is structured as follows. Section 3.2 presents the testable
arguments and surveys existing evidence. Section 3.3 gives a brief review of merger
activities and stock returns in the past. Section 3.4 describes data and sample. Section
3.5 presents the estimation model and variables. In section 3.6, the possible

72
determinates of merger announcement returns are discussed. Finally, section 3.7
explains the conclusions of the discussion.
3.2. Literature review
3.2.1. Theory
Consider an acquiring firm which starts performing acquisitions without any
bias, but develops managerial hubris from its previous acquisition experience. When the
firm undertakes the first acquisition it will not overpay because the value of the first
acquisition and the expectation of the value created are not biased by hubris. Once
managerial hubris is developed, the expectation of the firm about the benefit from
subsequent takeovers become over optimistic and biased from the real outcomes. In this
case, the subsequent acquisitions will destroy value for the acquirer. However, if the
acquiring firm learns from past merger experience about its true ability, the impact of
hubris may level off and eventually decline with additional experience.
The above arguments lead to the following testable hypotheses on impacts of
frequent acquisition on announcement returns. Two theories are developed from
opposite ends of a spectrum. At one end is managerial hubris hypothesis of acquisitions
driven by managerial optimistic behaviour in corporate decisions. At the other end is
organizational learning hypthesis that drives better outcomes for current acquisition
than the prior ones, since firms accumulate experience on acquisition which can
73
enhance management's acquisition expertise (Kusewitt, 1985; Fowler and Schmidt,
1989; Bruton et al. 1994; Barkema et al. 1996; Ashkenas et al., 1998; Hitt et al., 1998).
If an acquirer’s acquisitive decisions develop hubris, it is expected that the
management of the acquiring firm will be as equally likely to make frequent
acquisitions that exceed their acquisitive capability, and thus destroy shareholder’s
value. It is also expected that the value-destruction would be more serious as acquirers
are more aggressive in acquisition during a relatively shorter time period. This theory
addresses the negative effects of over-confident issue with acquirers, yet there is also a
mechanism for improving shareholders wealth based on the theory of organizational
learning which is widely discussed by scholars, especially since Argyris and Schon
(1978). Organizational learning theory emphasizes the role of prior acquisition
experience in determining the positive outcomes of serial acquisitions. However,
Hayward (2002) argues that learning does not necessarily benefit acquirers if there is a
very short temporal interval between two acquisitions since acquirers may be unable to
learn so meaningfully in such a short time period. From this point of view, an acquirer is
more likely to generate better inferences suited for subsequent acquisitions from prior
experience as such experience can take root more successfully in a relatively longer
time period.
To sum up, from the point of view of shareholder valuation, it is expected that it
may not be suitable for firms making a large quantity of acquisitions in the short term
since frequent acquisition is harmful to shareholder wealth. Yet, acquirers may be
feasible in mergers in the long-run as a long time period may result in improvements in
the effect of learning and thus offset initial hubris.

74
Table 3-1. Summary of early empirical research on merger frequency by using multivariate
approach
STUDY SAMPLE KEY FINDING(S)
KUSEWITT (1985) Acquisitions by 138 U.S. firms
from 1967 to 1976 Negative relationship
FOWLER & SCHMIDT
(1989)
Acquisitions by 42 manufacturing
firms from 1975 to 1979 Positive relationship
HALEBLIAN &
FINKELSTEIN(1999)
449 acquisitions from 1980 to
1992
U-shaped relationship between acquisition
experience and performance
FINKELSTEIN &
HALEBLIAN (2002)
192 acquisitions by 96 acquirers
from 1970 to 1990
Second acquisition underperforms the first,
especially when from a different industry
HAYWARD (2002) 214 acquisitions by 120 firms in
six industries from 1990 to 1995
Inverted U-relationship between the similarity
of prior acquisitions and the performance of the
focal acquisition
LAAMANEN & KEIL
(2008)
A sample of 5,518 U.S.
acquisitions during the period
between 1990 and 1999
They also find that the acquisition rate is
negatively related to acquirer performance
BILLETT & QIAN (2008)
3,795 US acquisitions of 2,213
acquiring firms during the period
between 1980 and 2002
The negative effect of CEO’s merger frequency
persists in a multivariate context after
controlling the deal and firm specific
characteristics
CONN ET AL. (2004)
A sample of 4,344 UK
acquisitions during the period
from 1984 to 1998.
Negative relationship
3.2.2. Empirical evidence
Table 3-1 presents relatively recent research which took a multivariate approach
for the impact of frequent acquisition. Kusewitt (1985) firstly raised the issue of merger
frequency related to performance on the basis of investigating a sample of 3,500
acquisitions by 138 acquirers during the period 1967-1976. Kusewitt (1985) and a
subsequent study by Conn et al., (2004) show that the merger frequency is negatively
related to the performance of acquiring firms, which is consistent with the results in the
previous chapter.
To test this argument, Conn et al. (2004) further examined the difference in
merger performance among three frequencies: one acquisition, two to three acquisitions,
75
and more than three acquisitions, by using a sample of 4,344 UK acquisitions during the
period from 1984 to 1998. In the multivariate analysis, Conn et al. (2004) defined a
dummy variable to present multiple acquirers and found that both the dummy and the
number of acquisitions are significantly negative in relation to the announcement
returns after announcement. The finding made by Conn et al. (2004) supports the
managerial hubris argument rather the managerial learning argument.
Consistent with Kusewitt and Conn’s, Billett and Qian (2008) found similar
results from individual CEOs’ standpoint by using a sample of 3,795 US acquisitions of
2,213 acquiring firms during the period 1980 to 2002. Their study defines CEOs as
infrequent acquirers if they make only one acquisition, and frequent acquirers if they
make at least two acquisitions of public targets within a five-year period. They argue
that the negative effect of the CEO’s merger frequency persists in a multivariate context
after controlling the deal and firm specific characteristics. They argue that CEOs
become overconfident through prior acquisitions. As a result the CEOs destroy the
shareholder value, which indicates that CEOs develop more hubris when a firm plans
high-order deals.
Hayward (2002) 11 introduced another argument on frequency-performance
issues but from the perspective of temporal interval. He introduced two interval
measures to explore the effect of temporal interval between deals on investors’ returns.
Firstly, the average temporal interval between deals and secondly, the temporal interval
between focal acquisition and prior acquisition. There are two major findings. Firstly,
11 Hayward (2002) focused his research on firms’ learning from the acquisition experience by using a sample of 214
US acquisitions during the period between 1990 and 1995. The study measures the acquisition experience as the sum
of recent acquisitions that conduct by acquiring firms, which is similar to Haleblian and Finkelstein (1999).

76
Hayward’s results suggest that acquiring firms with a higher merger frequency perform
worse for stock returns than those with a lower merger frequency. Secondly, the author
finds that moderately temporal intervals between acquisitions could benefit the
performance of acquiring firms. This may be because a very short interval between
acquisitions may not allow enough time for the acquirers to digest prior experiences;
and a very long interval means that the prior experiences may become unavailable,
inaccessible, irrelevant or forgotten (Argote et al., 1990; Huber, 1991; Chang, 1998;
Ginsberg and Baum, 1998).
Laamanen and Keil (2008) use an acquisition rate12 in order to capture the effect
of the temporal interval between acquisitions. On the basis of a sample of 5,518 U.S.
acquisitions during the period between 1990 and 1999, they find that the time of two
acquisitions is affected by the acquisition rate. They find that the acquisition rate is
negatively related to acquirer performance. In their study the acquisition experience,
measured as the number of acquisitions over the sample time, is significantly and
negatively associated with performance. In contrast, they also find that the interaction of
merger experiences and an acquisition rate is positively associated with performance,
which alleviates the negative effects of the frequency on performance.
There also are some counter arguments about the negative relationship between
merger frequency and investment returns. For example, Fowler and Schmidt (1989)
extended Kusewitt’s (1985) findings by exploring another set of variables, including a
more valid measure of acquisition frequency which measures the number of other major
acquisitions made by an acquiring firm in the 4-year period preceding the year of the
12 Acquisition rate is calculated as the average number of acquisitions over three years

77
tender offer, and they found a significant positive relationship between acquisition
experience and market-based acquisition performance.
Most existing research predicts positive outcomes to experience (e.g. Lubatkin,
1983; Hitt et al., 1993). That is, the more the merger experience the better the
performance for acquiring firms. Haleblian and Finkelstein (1999) argue that the
Managerial Learning Theory has a wider variety of conditions than the Learning-curve
Theory. The authors focus their research on the influence of organizational acquisition
experience13 on returns to investors in the time span of the merger announcement and
limit their study to the quantity of acquisitions. Their evidence shows a U-shaped
relationship between the acquisition experience and cumulative abnormal returns. A
negative relationship when a firm's current acquisition is dissimilar to its prior
acquisitions and the relationship can become positive if the focal acquisition is similar
to prior ones. In addition, Haleblian and Finkelstein (1999) find that the acquiring firms
with multiple acquisitions in the same industry outperform others. Their findings
suggest that acquisition experiences are important for the performance of the new
integration.
In sum, current studies on merger frequency and announcement returns leave
unresolved issues. Research presented by Kusewitt (1985), Fowler and Schmidt (1989),
Conn et al. (2004), Laamanen and Keil (2008), Billett and Qian (2008) and Hayward
(2002) has three major limitations. Firstly, some samples are geographically biased.
Secondly, they do not take into account the effect of a time interval in estimation
(except Hayward (2002)). Thirdly, notably in the case of Conn et al. they employ an
13 The acquisition experience is defined as the total number of acquisitions that sample acquiring firms made from
1948 up to the acquisition of interest.
78
inappropriate model for estimation. These limitations call for further research on the
effect of the frequent acquisition.
This chapter aims to extend the existing studies of the frequent acquisition by
using a more internationally representative sample with control of firm specific fixed
effects, but also by defining merger frequency in terms of how merger effect can last, in
the short-term, medium-term or long-term. Splitting frequency into these three terms
enables interaction between time interval and frequency as a joint effect for estimations
of how frequency affects stock performance in two dimensions: number and time.
3.3. A brief review of merger activities and announcement returns
for infrequent and frequent acquirers in the past
To elaborate the trend of mergers made by acquiring firms with different merger
frequencies, the number of acquisitions for 6,836 acquirers14 from 117 countries from
2000 to 2010 are plotted. Figure 3-1a demonstrates the number of takeovers undertaken
by infrequent frequent and highly frequent acquirers during the period 2000-2010. It is
found that all groups show a similar pattern of growth of acquisitions. The volume of
acquisitions has a downward trend after the stock market crash of 2000 till 2001
reaching the first lowest point, gradually increased with the recovery of the stock market
to a peak in 2007, declines again from 2007 to 2009 (reach the second lowest point)
following the financial crisis and then grows up with global economic recovery. It is
14 See Section 4.3 for the sample selecting procedure.

79
found that infrequent acquirers have increased in both pre-crisis (2001-2007) period and
post-crisis period (2007-2009).
Figure 3-1b presents the number of infrequent, frequent and highly frequent
deals as percentage of total deals at a year. It shows clearly that there is a converging
trend of merger deals for infrequent and highly frequent acquirers: the infrequent
acquirers rose to almost 40% in 2010 when compared with the declining trend of the
highly frequent deals dropping from 42% in 2000 to 25% in 2010.
Given a decline trend of the highly frequent deals, the cumulative abnormal returns
for the highly frequent acquirers were lower when compared with the infrequent and
frequent ones over the decade from 2000 to 2010, see Figure 3-2a. In Figure 3-2b, it
also shows a clear pattern of decreasing investment returns with increasing the number
of acquisitions over the sample period. This pattern is consistent with the findings the
last chapter found.
As shown in Figure 3-2b, the cumulative abnormal returns on average decreased
with the number of deals completed by an acquiring firm over the sample period. This
pattern is consistent with the results found in Chapter 2. This comparative evidence
provides a motivation to investigate the merger frequency nexus with bidder’s stock
performance through a multivariate analysis.

80
Figure 3-1. Comparison of the number of acquisitions: infrequent, frequent and highly frequent
acquirers
(a)
(b)
Note: This figure shows graphical illustration of the number of acquisitions for infrequent and frequent bidders from
January 1, 2000 to December 31, 2010. Figure (a) and (c) reports the comparison of the number of deals made by
infrequent, frequent and highly frequent bidders: the absolute value and as % of year-total acquisitions, respectively.
Infrequent, frequent and highly frequent bidder is defined as an acquirer undertaking one, two to four and more than
four acquisition(s), respectively.
Source: Authors’ calculation based on data from SDC, Datastream and Thomson Financial.
0
100
200
300
400
500
600
700
800
900
2000 2001 2002 2003 2004 2005 2006 2007 2008 2009 2010
To
tal
num
ber
of
acq
uis
itio
ns
Infrequent Acquirers Frequent Acquirers Highly frequent acquirers
15%
20%
25%
30%
35%
40%
45%
50%
2000 2001 2002 2003 2004 2005 2006 2007 2008 2009 2010
% o
f al
l d
eals
Infrequent Acquirers Frequent Acquirers High Frequent Acquirers
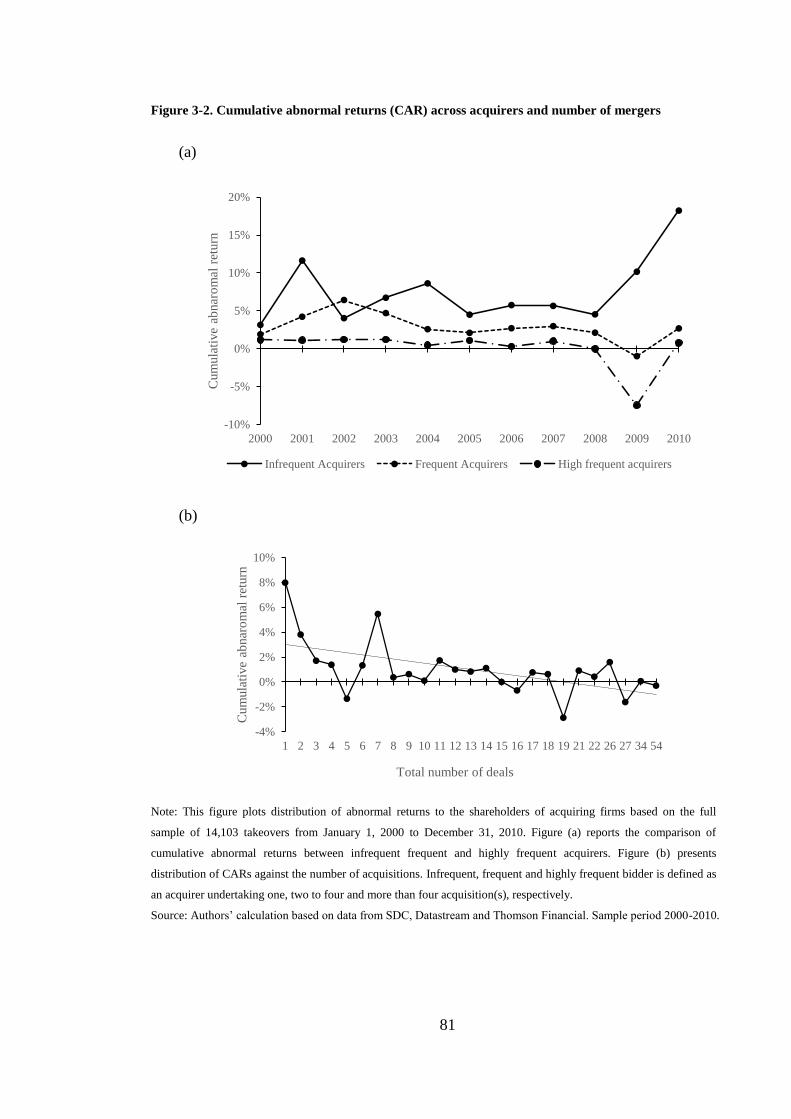
81
Figure 3-2. Cumulative abnormal returns (CAR) across acquirers and number of mergers
(a)
(b)
Note: This figure plots distribution of abnormal returns to the shareholders of acquiring firms based on the full
sample of 14,103 takeovers from January 1, 2000 to December 31, 2010. Figure (a) reports the comparison of
cumulative abnormal returns between infrequent frequent and highly frequent acquirers. Figure (b) presents
distribution of CARs against the number of acquisitions. Infrequent, frequent and highly frequent bidder is defined as
an acquirer undertaking one, two to four and more than four acquisition(s), respectively.
Source: Authors’ calculation based on data from SDC, Datastream and Thomson Financial. Sample period 2000-2010.
-10%
-5%
0%
5%
10%
15%
20%
2000 2001 2002 2003 2004 2005 2006 2007 2008 2009 2010
Cum
ula
tive
abnar
om
al r
eturn
Infrequent Acquirers Frequent Acquirers High frequent acquirers
-4%
-2%
0%
2%
4%
6%
8%
10%
1 2 3 4 5 6 7 8 9 10 11 12 13 14 15 16 17 18 19 21 22 26 27 34 54
Cum
ula
tive
abnar
om
al r
eturn
Total number of deals

82
3.4. Model specification and variables
3.4.1. Specification of model
Modeling the relation between merger frequency and investment returns helps
understand a question “Are the busiest the best?”. Most of the existing studies15 on the
question are based on pooled OLS estimation. However, the pooled regression model
has a disadvantage in that it omits the unobserved heterogeneity across individual firms
and assumes that the coefficients are the same for all individuals. Consider the pooled
OLS estimator:
𝑦𝑖𝑡 = 𝛼 + 𝛽𝑥𝑖𝑡 + 𝜀𝑖𝑡, ⑴
where 𝜀𝑖𝑡 represents the random error term.
The above pooled OLS estimator will be problematic if the true mode is the
fixed effects model. To explore that, rewrite the model as
𝑦𝑖𝑡 = 𝛼 + 𝛽𝑥𝑖𝑡 + (𝑐𝑖 − 𝛼 + 𝜀𝑖𝑡) ⑵
where 𝑐𝑖 represents the unobserved heterogeneity or firm specific effects. In the pooled
OLS regression, all unique impacts are subsumed in the error term. Yet, there is a fact
that each individual has time invariant but unique unobserved effects on the dependent
variable. If it is the case, the pooled OLS regression will lead to biased and inconsistent
estimates since the explanatory variables are no longer uncorrelated with the error terms
(Wooldridge, 2002). Econometrically, unobservable heterogeneity exists in Eq. (2) if
15 See for example, Fuller et al.(2002), Moller et al. (2004) and Billet and Qian (2008).
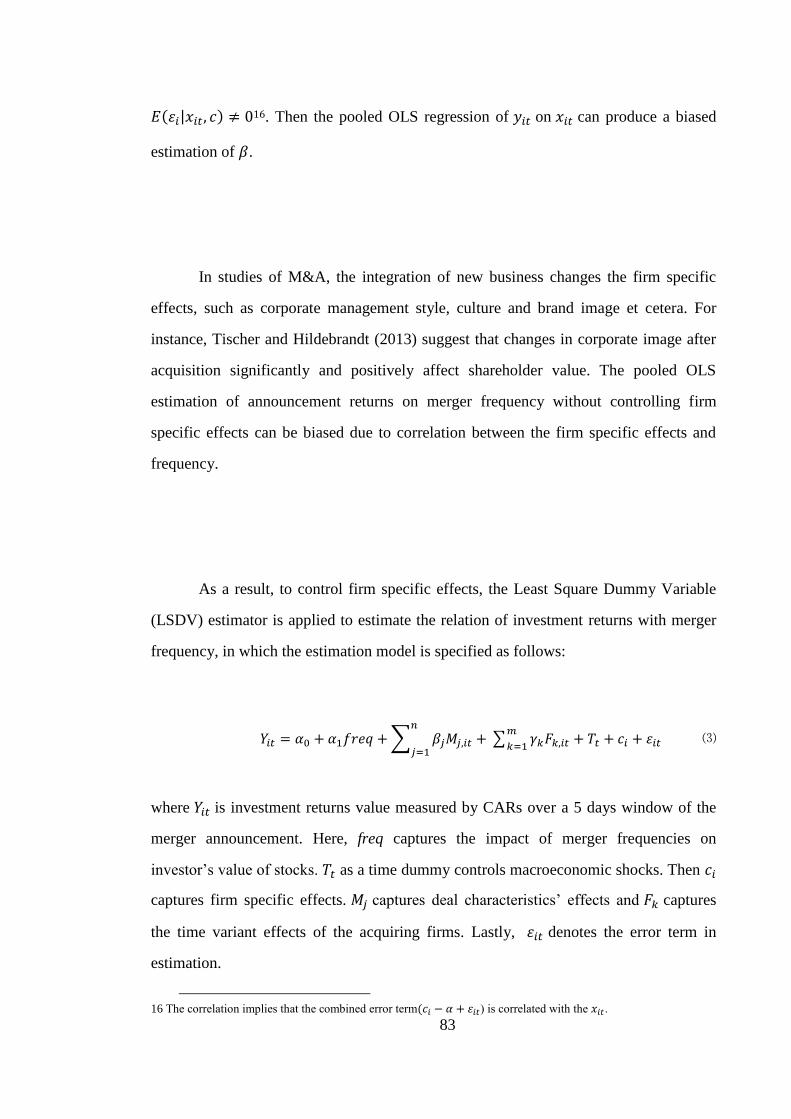
83
𝐸(𝜀𝑖|𝑥𝑖𝑡, 𝑐) ≠ 016. Then the pooled OLS regression of 𝑦𝑖𝑡 on 𝑥𝑖𝑡 can produce a biased
estimation of 𝛽.
In studies of M&A, the integration of new business changes the firm specific
effects, such as corporate management style, culture and brand image et cetera. For
instance, Tischer and Hildebrandt (2013) suggest that changes in corporate image after
acquisition significantly and positively affect shareholder value. The pooled OLS
estimation of announcement returns on merger frequency without controlling firm
specific effects can be biased due to correlation between the firm specific effects and
frequency.
As a result, to control firm specific effects, the Least Square Dummy Variable
(LSDV) estimator is applied to estimate the relation of investment returns with merger
frequency, in which the estimation model is specified as follows:
𝑌𝑖𝑡 = 𝛼0 + 𝛼1𝑓𝑟𝑒𝑞 + ∑ 𝛽𝑗𝑀𝑗,𝑖𝑡
𝑛
𝑗=1+ ∑ 𝛾𝑘𝐹𝑘,𝑖𝑡
𝑚
𝑘=1+ 𝑇𝑡 + 𝑐𝑖 + 𝜀𝑖𝑡 ⑶
where 𝑌𝑖𝑡 is investment returns value measured by CARs over a 5 days window of the
merger announcement. Here, freq captures the impact of merger frequencies on
investor’s value of stocks. 𝑇𝑡 as a time dummy controls macroeconomic shocks. Then 𝑐𝑖
captures firm specific effects. 𝑀𝑗 captures deal characteristics’ effects and 𝐹𝑘 captures
the time variant effects of the acquiring firms. Lastly, 𝜀𝑖𝑡 denotes the error term in
estimation.
16 The correlation implies that the combined error term(𝑐𝑖 − 𝛼 + 𝜀𝑖𝑡) is correlated with the 𝑥𝑖𝑡.
84
3.5. Specification of variables
Further detailed specifications of variables for model (3) are discussed below.
3.5.1. Announcement returns
Andrade et al. (2001) suggest that the most reliable evidence on impact of
merger and acquisition on shareholder wealth creation for acquiring firm draw on short-
term event studies. The main purpose of the event study is to test the existence of
information effect and to detect the factors that can explain changes in shareholder
value around the event date (Prabhala, 1997). Following existing literature, this chapter
thus estimates cumulative abnormal returns17 (CARs) as the measure of the acquiring
shareholder valuation on the basis of the event study methodology18.
The last chapter has detailed discussion on specifying this variable. There are
two elements in evaluating CARs empirically. One is about how to calculate abnormal
returns after announcement of a merger event and another is about how to specify a
period of the impact of the merger announcement or “window”. According to Dolley
(1933), Ball and Brown (1968) and Fama et al. (1969), a change in a stock price after
the announcement of an event is called “return” and the expected returns generated from
17 King (2002) provides evidence that CAR is commonly used as a measure of stock performance in M&A research.
Since the CAR reflects well on the information regarding the change of stock price for acquiring firm around the
acquisition announcement to a benchmark index. 18 Healy et al.(1992), Kapland and Weisbach (1992) and Harrison and Godfrey(1997) show significant evidence of
predictive validity, which increases the confidence in using abnormal returns to measure acquisition performance.

85
a market portfolio with an adjustment for a risk in investing in the stock are “abnormal
returns”.
Later, Brown & Warner (1985) and Fama &French (1992) have simplified the
calculation of the abnormal returns as the difference between the returns of a stock and
the returns of the market portfolio or the market average at a same day. This chapter
follows the mainstream studies and takes the simplified method to evaluate impact of a
merger announcement. The CAR cumulates the abnormal returns over a “window”
period or days, which is specified as follows:
𝐶𝐴𝑅𝑖(𝑇1−𝑇2) = ∑ 𝐴𝑅𝑖𝑡𝑇2𝑇1 = ∑ (𝑅𝑖𝑡 − 𝑅𝑚𝑡)𝑡=𝑇2
𝑡=𝑇1 (4)
where T1 is the start date of the event window, T2 is the end date of the event window.
𝑅𝑖𝑡 represents the observed returns on stock 𝑖 for day 𝑡. 𝑅𝑚𝑡 represents returns on the
market portfolio for day 𝑡.
Choosing a window of an event for equation (4), always raises an issue about
how to balance between the short window which is usually 3 days and the longer
window, such as 5 days or 7 days or even longer. The short window may not be able to
capture complete information on market response to a merger announcement. However,
the longer window may cause a confounding effect on the evaluation of an event, which
can reduce predictive power of the stock price change (Mackinlay, 1997). As a result,
to balance the two counter effects, this study defines 5-day as the event window (-2, +2)
for empirical estimation of CARs in (4), which is consistent with existing studies (Cox
86
and Portes, 1998; Fuller, Netter and Stegemolloer, 2002; Faccio et al., 2006; Boubakri,
Chan and Kooli, 2012; Gaur, Malhotra and Zhu, 2013). By considering the probability
of capturing confounding events in CAR calculations, the study also applies the 3-day
window for robustness checks of the estimations (See Appendix A).
3.5.2. Merger frequency
Kusewitt (1985) is the very first study to measures merger frequency as the
number of acquisitions that the sample firms made in a given year. Following Kusewitt,
a number of subsequent studies define merger frequency in this way, despite the fact
that Kusewitt might not intend to interpret the variable as the measure of the merger
frequency. In recent research19, most of studies attempt to capture the impact of merger
frequency by counting the number of takeovers the sample acquirers made over a
specific time period.
However, how long shall a specific time period be defined to count a number of
mergers, one year, three years or five years? It can be argued that investors or stock
markets respond to a new merger announcement by taking into account the short history
of merger made by the acquirer. This is because very old mergers in past do not have
much effect on the new integration of business. To test this argument, this chapter
defines three types of merger frequency according to the temporal business effect of a
merger:
To assume that the business effect lasts longer: Freq1, the cumulative number of
19 See for example, Croci and Petmezas (2009), Rahahleh and Wei (2012) and Boubakri et al. (2012).
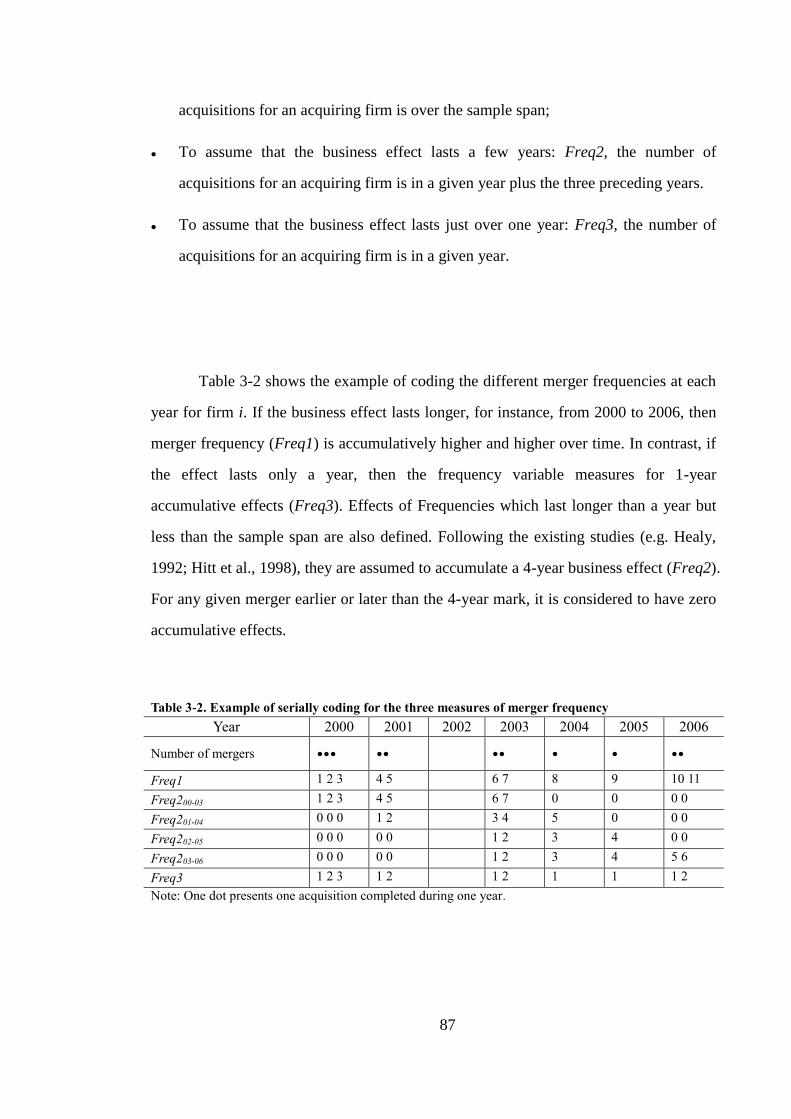
87
acquisitions for an acquiring firm is over the sample span;
To assume that the business effect lasts a few years: Freq2, the number of
acquisitions for an acquiring firm is in a given year plus the three preceding years.
To assume that the business effect lasts just over one year: Freq3, the number of
acquisitions for an acquiring firm is in a given year.
Table 3-2 shows the example of coding the different merger frequencies at each
year for firm i. If the business effect lasts longer, for instance, from 2000 to 2006, then
merger frequency (Freq1) is accumulatively higher and higher over time. In contrast, if
the effect lasts only a year, then the frequency variable measures for 1-year
accumulative effects (Freq3). Effects of Frequencies which last longer than a year but
less than the sample span are also defined. Following the existing studies (e.g. Healy,
1992; Hitt et al., 1998), they are assumed to accumulate a 4-year business effect (Freq2).
For any given merger earlier or later than the 4-year mark, it is considered to have zero
accumulative effects.
Table 3-2. Example of serially coding for the three measures of merger frequency
Year 2000 2001 2002 2003 2004 2005 2006
Number of mergers ∙∙∙ ∙∙ ∙∙ ∙ ∙ ∙∙ Freq1 1 2 3 4 5 6 7 8 9 10 11
Freq200-03 1 2 3 4 5 6 7 0 0 0 0
Freq201-04 0 0 0 1 2 3 4 5 0 0 0
Freq202-05 0 0 0 0 0 1 2 3 4 0 0
Freq203-06 0 0 0 0 0 1 2 3 4 5 6
Freq3 1 2 3 1 2 1 2 1 1 1 2
Note: One dot presents one acquisition completed during one year.
88
3.5.3. Control variables
According to Jensen (1986), Haleblian and Finkelstein (1999), Fuller et al.
(2002), Moeller et al. (2004), Billet and Qian (2008) and Gaur et al. (2013), it can be
expected that CARs after a merger announcement will be affected by the ownership
status of target firms, the method of payment for acquisition, takeover attitude, the
relatedness of acquirers to targets’ business or industry, the relative acquisition size,
acquirer international scope, and acquirer slack. Note that all monetary data are
expressed in US dollars in value of a given year. More specifically, each of the variables
is defined as follows:
i. Deal-Specific Variables
Method of payment: Cash and Stock, binary variables, where Cash (Stock) equals
one if target is acquired with 100% cash (stock), zero otherwise.
Ownership of target: Public and Private binary variables, where Public (Private)
equals one if target is publicly (privately) held, zero otherwise.
Attitude: Attitude, binary variable, where Attitude equals one if the takeover is
classified as hostile (friendly) by SDC, zero otherwise.
Acquirer to target industrial relatedness: Relatedness, binary variables, where
Relatedness equals one if target is sharing the same two-digit SIC code as acquirer,
zero otherwise. This is obtained as the traditional SIC code-based measure of
relatedness following the same approach as Servaes (1996).
Acquirer international scope: Cross border, binary variables, where Cross border
equals one if the target is a foreign company, otherwise it is zero.
89
ii. Firm-Specific Variables
Relative acquisition size: Relative size, the ratio of the deal transaction value to
acquirer’s market value it 4 weeks prior to the announcement.
Acquirer slack: Leverage, the ratio of acquiring firm’s total debt to total assets.
FCF, the ratio of acquiring firm’s free cash flow to total assets.
3.6. Data
The acquisition data used for this study are collected from Securities Data
Corporation (SDC)’s Global Mergers & Acquisitions database which includes deals
announced and completed from January 1, 2000 to December 31, 2010. The SDC
Global Mergers & Acquisitions database is a comprehensive database of over 1.9
million transactions by either public or private acquirers throughout their lifespan
starting in 1992. This study focusses on transactions with an explicit transfer of control
that the acquirer must own none or less than 50% of the target’s voting shares prior to
the merger announcement and yield at least 50% or more of the ownership position of
the target in post-merger.20
To be included in the sample, takeover deals must further match the following
criteria. The transaction value of a deal exceeds one million dollars. Acquisitions must
be completed, and have both announcement date and effective date21 and disclosed
dollar deal value. The time between announcement date and completion date must be at
20 This research is designed to examine acquisitions where the transaction is a significant change of ownership from
the target to the bidder. For instance, an acquisition where an acquirer owns 49% nor 2% of target’s voting rights is
not be included. 21 SDC database defines the Effective Date as a date when the entire transaction is completed and effective.

90
least zero or less than 1,000 days. Target firms are required to be a public firm, a private
firm or a subsidiary. Consideration of payment method classified by SDC of a deal is
one of the four: cash only, stock only, combination of cash and stock and others22.
Neither the target nor the acquirer is in the financial or utilities industry. 23 Acquirers
must not purchase more than two targets within ten trading days. Acquisitions are not
buyback offers, repurchases, or self-tender offers.
The sample includes a number of deal characteristic items from SDC, such as
the announcement and completion dates, the acquirer and the target’s name, nation and
primary SIC code, target listing status, deal value, deal attitude and consideration
structure (payment method made by the acquirer). Due to the availability of financial
data for privately owned acquiring firms, the sample is restricted to public acquirers.
After the filtering process of the data, it ends up with a sample of more than 6,800
unique firms undertaking over 14,000 takeover transactions throughout 117 countries
with a total transaction value of $4.49 trillion. Among these acquisitions, 3,994 and
10,109 deals are made by infrequent and frequent acquirers, respectively. Then the
financial and stock data of sample acquirers are obtained from Thomson Financial24
and Datastream25.
Table 3-3 reports the summary statistics of frequency and other related variables for
period between 2000 and 2010. To avoid sample selection issues, a balanced panel is
not required; thus, the number of acquisitions differs each year. The sample includes
both large and small firms.
22 The “Other” category describes a mixture of payment methods including cash, bonds, preferred stock, earn outs,
assumption of liabilities and the other consideration offered is a form of stock. 23 firms with a primary SIC code between 4900 and 4999(utilities) or 6000 and 6999 (financial institutions) are
excluded.
24 Thomson Financial provides broadest coverage of 51,900 active global companies, representing 99% of the global
market capitalization.
25 Datastream offers daily stock prices, trading volumes, and return indices, updated at the end of every trading day,
for over 100,000 equities in nearly 200 countries around the world.
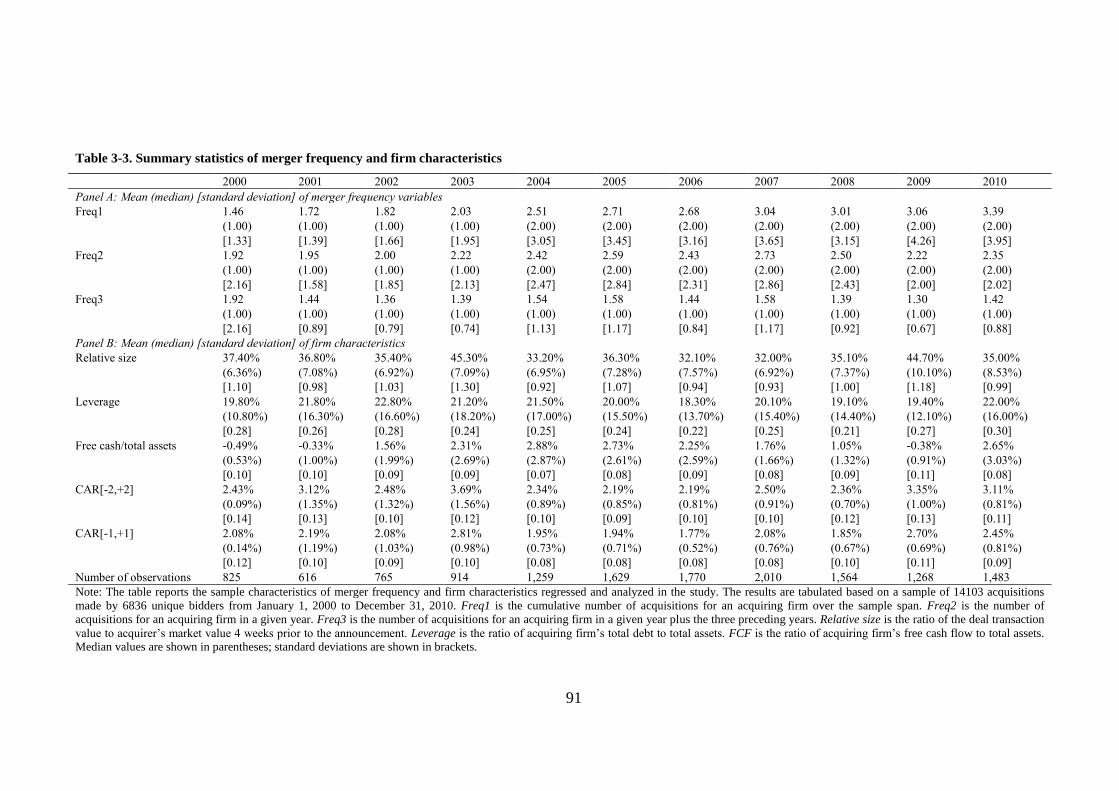
91
Table 3-3. Summary statistics of merger frequency and firm characteristics
2000 2001 2002 2003 2004 2005 2006 2007 2008 2009 2010
Panel A: Mean (median) [standard deviation] of merger frequency variables
Freq1 1.46 1.72 1.82 2.03 2.51 2.71 2.68 3.04 3.01 3.06 3.39
(1.00) (1.00) (1.00) (1.00) (2.00) (2.00) (2.00) (2.00) (2.00) (2.00) (2.00)
[1.33] [1.39] [1.66] [1.95] [3.05] [3.45] [3.16] [3.65] [3.15] [4.26] [3.95]
Freq2 1.92 1.95 2.00 2.22 2.42 2.59 2.43 2.73 2.50 2.22 2.35
(1.00) (1.00) (1.00) (1.00) (2.00) (2.00) (2.00) (2.00) (2.00) (2.00) (2.00)
[2.16] [1.58] [1.85] [2.13] [2.47] [2.84] [2.31] [2.86] [2.43] [2.00] [2.02]
Freq3 1.92 1.44 1.36 1.39 1.54 1.58 1.44 1.58 1.39 1.30 1.42
(1.00) (1.00) (1.00) (1.00) (1.00) (1.00) (1.00) (1.00) (1.00) (1.00) (1.00)
[2.16] [0.89] [0.79] [0.74] [1.13] [1.17] [0.84] [1.17] [0.92] [0.67] [0.88]
Panel B: Mean (median) [standard deviation] of firm characteristics
Relative size 37.40% 36.80% 35.40% 45.30% 33.20% 36.30% 32.10% 32.00% 35.10% 44.70% 35.00%
(6.36%) (7.08%) (6.92%) (7.09%) (6.95%) (7.28%) (7.57%) (6.92%) (7.37%) (10.10%) (8.53%)
[1.10] [0.98] [1.03] [1.30] [0.92] [1.07] [0.94] [0.93] [1.00] [1.18] [0.99]
Leverage 19.80% 21.80% 22.80% 21.20% 21.50% 20.00% 18.30% 20.10% 19.10% 19.40% 22.00%
(10.80%) (16.30%) (16.60%) (18.20%) (17.00%) (15.50%) (13.70%) (15.40%) (14.40%) (12.10%) (16.00%)
[0.28] [0.26] [0.28] [0.24] [0.25] [0.24] [0.22] [0.25] [0.21] [0.27] [0.30]
Free cash/total assets -0.49% -0.33% 1.56% 2.31% 2.88% 2.73% 2.25% 1.76% 1.05% -0.38% 2.65%
(0.53%) (1.00%) (1.99%) (2.69%) (2.87%) (2.61%) (2.59%) (1.66%) (1.32%) (0.91%) (3.03%)
[0.10] [0.10] [0.09] [0.09] [0.07] [0.08] [0.09] [0.08] [0.09] [0.11] [0.08]
CAR[-2,+2] 2.43% 3.12% 2.48% 3.69% 2.34% 2.19% 2.19% 2.50% 2.36% 3.35% 3.11%
(0.09%) (1.35%) (1.32%) (1.56%) (0.89%) (0.85%) (0.81%) (0.91%) (0.70%) (1.00%) (0.81%)
[0.14] [0.13] [0.10] [0.12] [0.10] [0.09] [0.10] [0.10] [0.12] [0.13] [0.11]
CAR[-1,+1] 2.08% 2.19% 2.08% 2.81% 1.95% 1.94% 1.77% 2.08% 1.85% 2.70% 2.45%
(0.14%) (1.19%) (1.03%) (0.98%) (0.73%) (0.71%) (0.52%) (0.76%) (0.67%) (0.69%) (0.81%)
[0.12] [0.10] [0.09] [0.10] [0.08] [0.08] [0.08] [0.08] [0.10] [0.11] [0.09]
Number of observations 825 616 765 914 1,259 1,629 1,770 2,010 1,564 1,268 1,483
Note: The table reports the sample characteristics of merger frequency and firm characteristics regressed and analyzed in the study. The results are tabulated based on a sample of 14103 acquisitions
made by 6836 unique bidders from January 1, 2000 to December 31, 2010. Freq1 is the cumulative number of acquisitions for an acquiring firm over the sample span. Freq2 is the number of
acquisitions for an acquiring firm in a given year. Freq3 is the number of acquisitions for an acquiring firm in a given year plus the three preceding years. Relative size is the ratio of the deal transaction
value to acquirer’s market value 4 weeks prior to the announcement. Leverage is the ratio of acquiring firm’s total debt to total assets. FCF is the ratio of acquiring firm’s free cash flow to total assets. Median values are shown in parentheses; standard deviations are shown in brackets.

92
3.7. Empirical evidence and discussions
The model (4) is estimated by using Least Square Dummy Variable (LSDV) in
order to control firm fixed effects on investment returns at presence of unobserved
heterogeneity. Instead of Hausman Statistic, Breusch-Pagan (BP) statistic is employed
to test a presence of heterogeneity in estimation under the expectation of which the
heteroscedasticity is correlated with explanatory variables. The significance of BP
statistic implies biased estimates if the firm fixed effects are not controlled. Therefore,
in following estimations, LSDV is applied when BP statistic is significant. The results
of estimation are reported on the basis of clustered standard error in the fixed-effects to
account for heteroscedasticity and auto-correlation at the firm level26.
3.7.1. The impact of merger frequency
As the first step of empirical estimation, it starts by examining the degree of
correlation among dependent and independent variables in Table 3-4. Within the
independent variables, two highest correlations are at -0.54 and -0.48 found between the
variables of Cash (5) and Stock (6); Public (7) and Private (8). Therefore, these four
dummies are replaced by four interaction variables which are interacted the cash and
share dummies with the target ownership dummies in robustness checks, in order to
reduce the effect of the potential multicollinearity problem on estimation. In additional,
Table 3-4 shows a point worth nothing that the correlation between all of merger
frequency 27 variables and acquisition performance are negative, which suggests
preliminarily a negative linear link between frequency and CARs.
27 For brevity, the results of Freq2 are not presented here, but are available from the author upon request. For freq2, it
does not appear then potential multicollinearity problem on estimation.
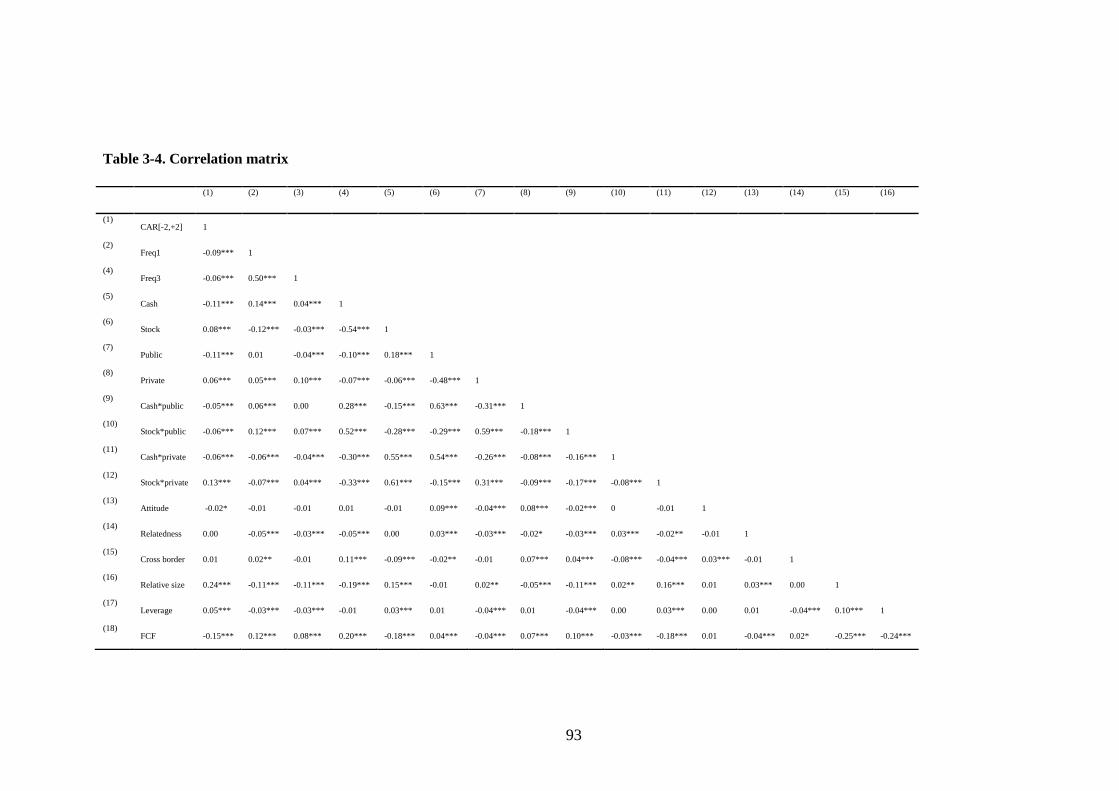
93
Table 3-4. Correlation matrix
(1) (2) (3) (4) (5) (6) (7) (8) (9) (10) (11) (12) (13) (14) (15) (16)
(1) CAR[-2,+2] 1
(2) Freq1 -0.09*** 1
(4) Freq3 -0.06*** 0.50*** 1
(5) Cash -0.11*** 0.14*** 0.04*** 1
(6) Stock 0.08*** -0.12*** -0.03*** -0.54*** 1
(7) Public -0.11*** 0.01 -0.04*** -0.10*** 0.18*** 1
(8) Private 0.06*** 0.05*** 0.10*** -0.07*** -0.06*** -0.48*** 1
(9) Cash*public -0.05*** 0.06*** 0.00 0.28*** -0.15*** 0.63*** -0.31*** 1
(10) Stock*public -0.06*** 0.12*** 0.07*** 0.52*** -0.28*** -0.29*** 0.59*** -0.18*** 1
(11) Cash*private -0.06*** -0.06*** -0.04*** -0.30*** 0.55*** 0.54*** -0.26*** -0.08*** -0.16*** 1
(12) Stock*private 0.13*** -0.07*** 0.04*** -0.33*** 0.61*** -0.15*** 0.31*** -0.09*** -0.17*** -0.08*** 1
(13) Attitude -0.02* -0.01 -0.01 0.01 -0.01 0.09*** -0.04*** 0.08*** -0.02*** 0 -0.01 1
(14) Relatedness 0.00 -0.05*** -0.03*** -0.05*** 0.00 0.03*** -0.03*** -0.02* -0.03*** 0.03*** -0.02** -0.01 1
(15) Cross border 0.01 0.02** -0.01 0.11*** -0.09*** -0.02** -0.01 0.07*** 0.04*** -0.08*** -0.04*** 0.03*** -0.01 1
(16) Relative size 0.24*** -0.11*** -0.11*** -0.19*** 0.15*** -0.01 0.02** -0.05*** -0.11*** 0.02** 0.16*** 0.01 0.03*** 0.00 1
(17) Leverage 0.05*** -0.03*** -0.03*** -0.01 0.03*** 0.01 -0.04*** 0.01 -0.04*** 0.00 0.03*** 0.00 0.01 -0.04*** 0.10*** 1
(18) FCF -0.15*** 0.12*** 0.08*** 0.20*** -0.18*** 0.04*** -0.04*** 0.07*** 0.10*** -0.03*** -0.18*** 0.01 -0.04*** 0.02* -0.25*** -0.24***
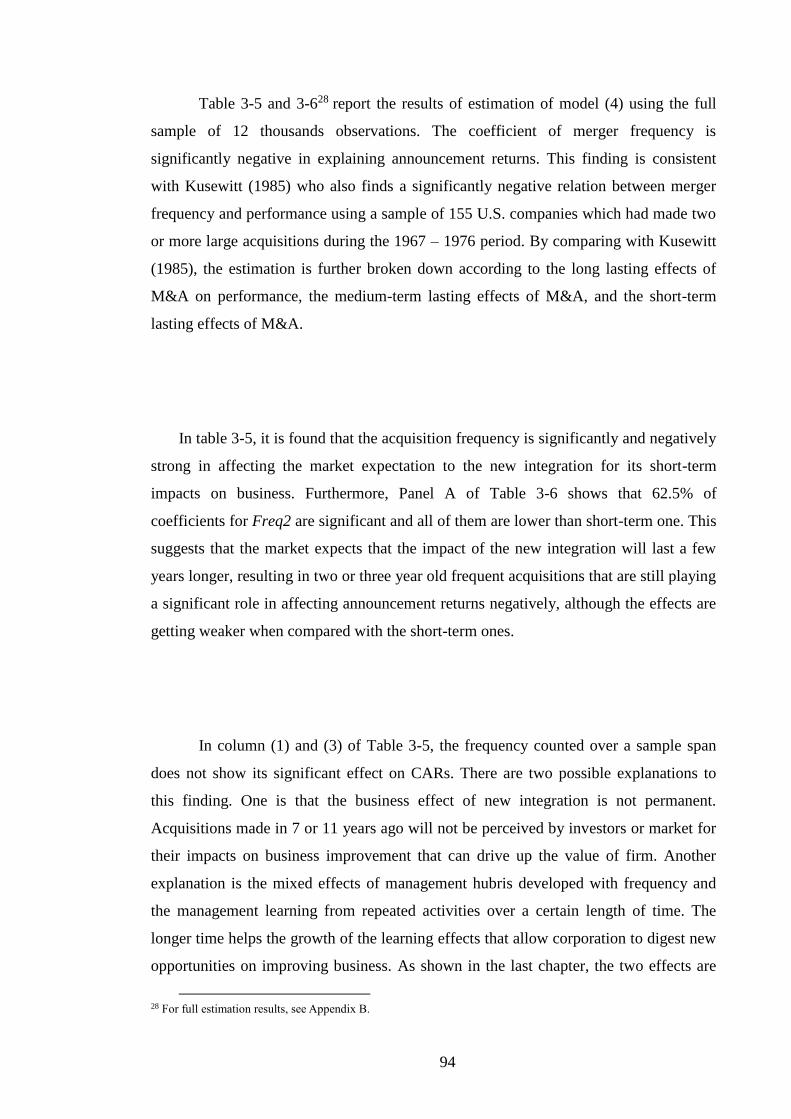
94
Table 3-5 and 3-628 report the results of estimation of model (4) using the full
sample of 12 thousands observations. The coefficient of merger frequency is
significantly negative in explaining announcement returns. This finding is consistent
with Kusewitt (1985) who also finds a significantly negative relation between merger
frequency and performance using a sample of 155 U.S. companies which had made two
or more large acquisitions during the 1967 – 1976 period. By comparing with Kusewitt
(1985), the estimation is further broken down according to the long lasting effects of
M&A on performance, the medium-term lasting effects of M&A, and the short-term
lasting effects of M&A.
In table 3-5, it is found that the acquisition frequency is significantly and negatively
strong in affecting the market expectation to the new integration for its short-term
impacts on business. Furthermore, Panel A of Table 3-6 shows that 62.5% of
coefficients for Freq2 are significant and all of them are lower than short-term one. This
suggests that the market expects that the impact of the new integration will last a few
years longer, resulting in two or three year old frequent acquisitions that are still playing
a significant role in affecting announcement returns negatively, although the effects are
getting weaker when compared with the short-term ones.
In column (1) and (3) of Table 3-5, the frequency counted over a sample span
does not show its significant effect on CARs. There are two possible explanations to
this finding. One is that the business effect of new integration is not permanent.
Acquisitions made in 7 or 11 years ago will not be perceived by investors or market for
their impacts on business improvement that can drive up the value of firm. Another
explanation is the mixed effects of management hubris developed with frequency and
the management learning from repeated activities over a certain length of time. The
longer time helps the growth of the learning effects that allow corporation to digest new
opportunities on improving business. As shown in the last chapter, the two effects are
28 For full estimation results, see Appendix B.

95
opposite for business improvement after new integration and so the expectation of
firm’s value. The learning takes time to come effective, which can offset the
disadvantage brought by managerial hubris. Therefore, in the long run, the M&A
frequency can be unclear for its overall significant effects on performance when neither
the hubris nor the learning becomes dominant over each other. This argument is
consistent with the finding of the last chapter.
3.7.2. The impact of control variables
It is found that the relative size of acquisition matters for performance in the last
chapter. The findings from the multivariate analysis are consistent with the findings
from the univariate analysis shown in Tables 3-5 and 3-6. The variable of relative
acquisition size, measured as the ratio of the deal transaction value to acquirer’s market
value 4 weeks prior to the announcement, appears significantly positive in affecting
announcement returns. This finding is consistent with Asquith et al. (1983) who were
the first researchers to incorporate relative size effects, stating that the larger the size of
acquisition relatively to acquiring firm in an acquisition results in the greater cumulative
abnormal returns for acquirer’s shareholders.
One explanation is that acquirers will be more careful about dealing with a large
acquisition as they can expose the firm to a high risk of devastating the business if the
integration fails, which creates a risk pressure on management.Increasing acquisitions
size can increase “the risk-driven pressure” on the acquiring firm’s management or
decision makers. If the size of a merger deal is large relative to the scale of the acquiring
firm’s business, the acquiring firm will be more exposed to the risk of the acquisition.
Any failure of the large acquisition may cause a difficulty for the acquiring firms in
using its existing resources to absorb or digest the large acquisition.
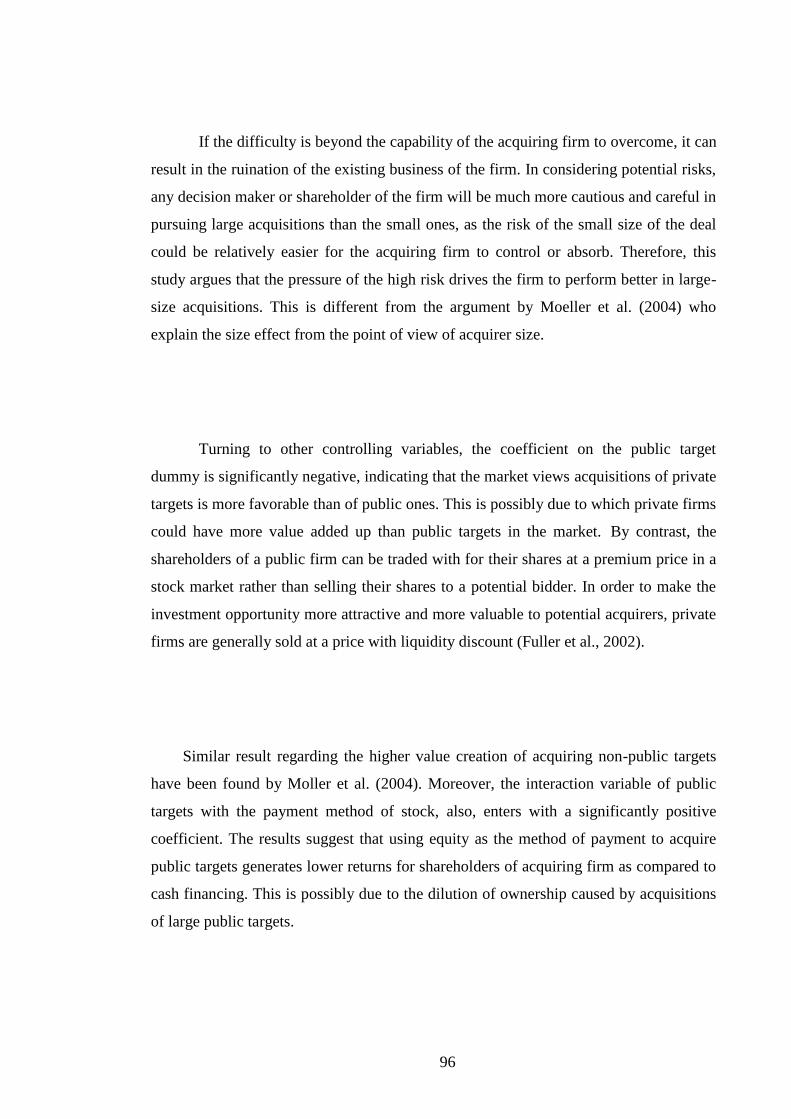
96
If the difficulty is beyond the capability of the acquiring firm to overcome, it can
result in the ruination of the existing business of the firm. In considering potential risks,
any decision maker or shareholder of the firm will be much more cautious and careful in
pursuing large acquisitions than the small ones, as the risk of the small size of the deal
could be relatively easier for the acquiring firm to control or absorb. Therefore, this
study argues that the pressure of the high risk drives the firm to perform better in large-
size acquisitions. This is different from the argument by Moeller et al. (2004) who
explain the size effect from the point of view of acquirer size.
Turning to other controlling variables, the coefficient on the public target
dummy is significantly negative, indicating that the market views acquisitions of private
targets is more favorable than of public ones. This is possibly due to which private firms
could have more value added up than public targets in the market. By contrast, the
shareholders of a public firm can be traded with for their shares at a premium price in a
stock market rather than selling their shares to a potential bidder. In order to make the
investment opportunity more attractive and more valuable to potential acquirers, private
firms are generally sold at a price with liquidity discount (Fuller et al., 2002).
Similar result regarding the higher value creation of acquiring non-public targets
have been found by Moller et al. (2004). Moreover, the interaction variable of public
targets with the payment method of stock, also, enters with a significantly positive
coefficient. The results suggest that using equity as the method of payment to acquire
public targets generates lower returns for shareholders of acquiring firm as compared to
cash financing. This is possibly due to the dilution of ownership caused by acquisitions
of large public targets.
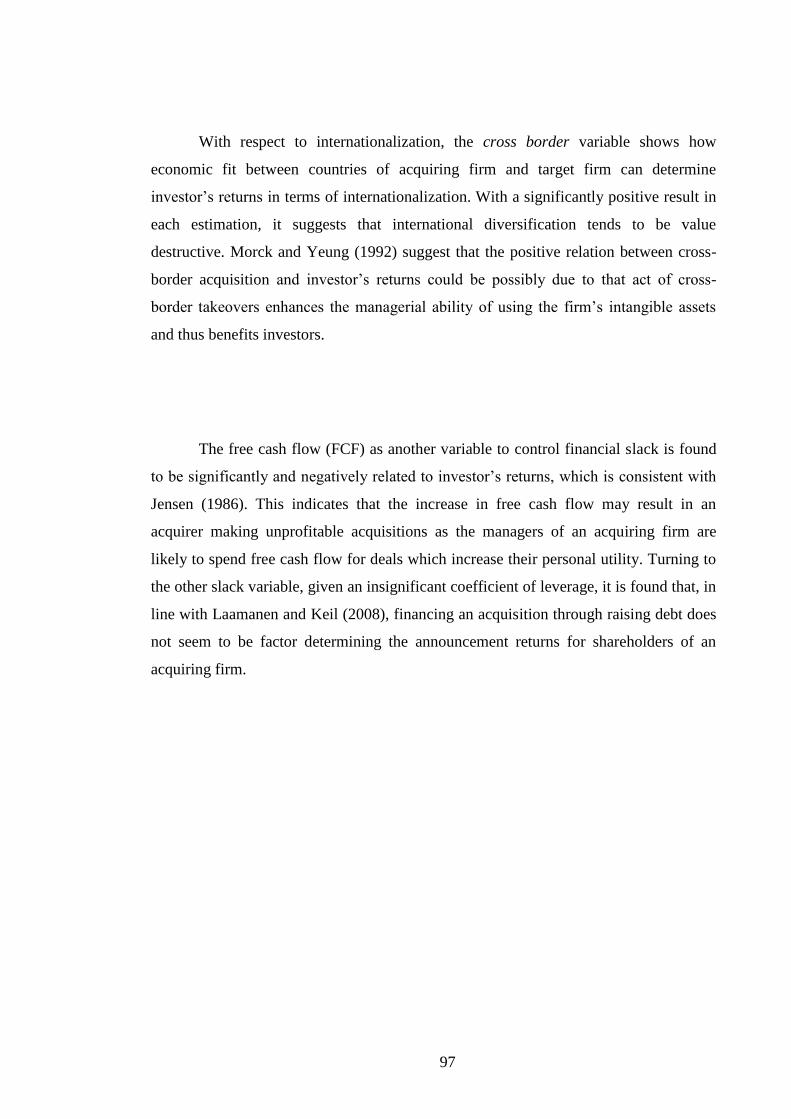
97
With respect to internationalization, the cross border variable shows how
economic fit between countries of acquiring firm and target firm can determine
investor’s returns in terms of internationalization. With a significantly positive result in
each estimation, it suggests that international diversification tends to be value
destructive. Morck and Yeung (1992) suggest that the positive relation between cross-
border acquisition and investor’s returns could be possibly due to that act of cross-
border takeovers enhances the managerial ability of using the firm’s intangible assets
and thus benefits investors.
The free cash flow (FCF) as another variable to control financial slack is found
to be significantly and negatively related to investor’s returns, which is consistent with
Jensen (1986). This indicates that the increase in free cash flow may result in an
acquirer making unprofitable acquisitions as the managers of an acquiring firm are
likely to spend free cash flow for deals which increase their personal utility. Turning to
the other slack variable, given an insignificant coefficient of leverage, it is found that, in
line with Laamanen and Keil (2008), financing an acquisition through raising debt does
not seem to be factor determining the announcement returns for shareholders of an
acquiring firm.
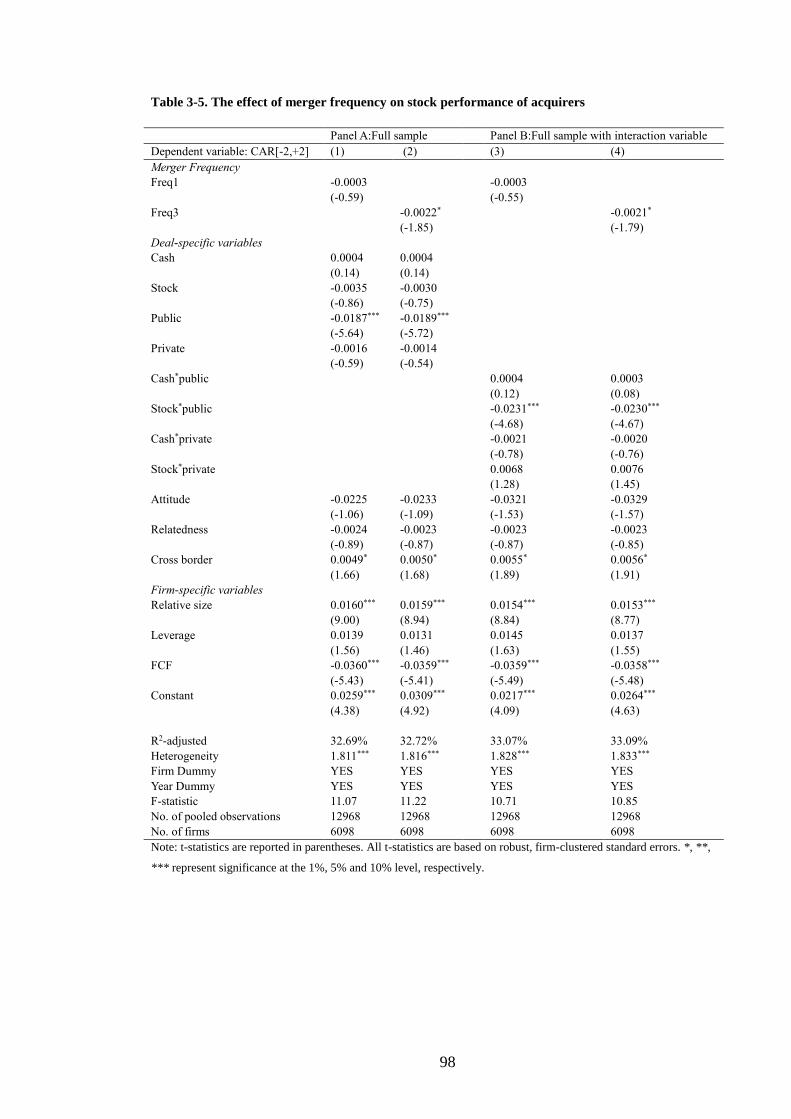
98
Table 3-5. The effect of merger frequency on stock performance of acquirers
Panel A:Full sample Panel B:Full sample with interaction variable
Dependent variable: CAR[-2,+2] (1) (2)
(3) (4)
Merger Frequency
Freq1 -0.0003
-0.0003
(-0.59)
(-0.55)
Freq3
-0.0022*
-0.0021*
(-1.85)
(-1.79)
Deal-specific variables
Cash 0.0004 0.0004
(0.14) (0.14)
Stock -0.0035 -0.0030
(-0.86) (-0.75)
Public -0.0187*** -0.0189***
(-5.64) (-5.72)
Private -0.0016 -0.0014
(-0.59) (-0.54)
Cash*public
0.0004 0.0003
(0.12) (0.08)
Stock*public
-0.0231*** -0.0230***
(-4.68) (-4.67)
Cash*private
-0.0021 -0.0020
(-0.78) (-0.76)
Stock*private
0.0068 0.0076
(1.28) (1.45)
Attitude -0.0225 -0.0233
-0.0321 -0.0329
(-1.06) (-1.09)
(-1.53) (-1.57)
Relatedness -0.0024 -0.0023
-0.0023 -0.0023
(-0.89) (-0.87)
(-0.87) (-0.85)
Cross border 0.0049* 0.0050*
0.0055* 0.0056*
(1.66) (1.68)
(1.89) (1.91)
Firm-specific variables
Relative size 0.0160*** 0.0159***
0.0154*** 0.0153***
(9.00) (8.94)
(8.84) (8.77)
Leverage 0.0139 0.0131
0.0145 0.0137
(1.56) (1.46)
(1.63) (1.55)
FCF -0.0360*** -0.0359***
-0.0359*** -0.0358***
(-5.43) (-5.41)
(-5.49) (-5.48)
Constant 0.0259*** 0.0309***
0.0217*** 0.0264***
(4.38) (4.92)
(4.09) (4.63)
R2-adjusted 32.69% 32.72%
33.07% 33.09%
Heterogeneity 1.811*** 1.816***
1.828*** 1.833***
Firm Dummy YES YES
YES YES
Year Dummy YES YES
YES YES
F-statistic 11.07 11.22
10.71 10.85
No. of pooled observations 12968 12968
12968 12968
No. of firms 6098 6098
6098 6098
Note: t-statistics are reported in parentheses. All t-statistics are based on robust, firm-clustered standard errors. *, **,
*** represent significance at the 1%, 5% and 10% level, respectively.
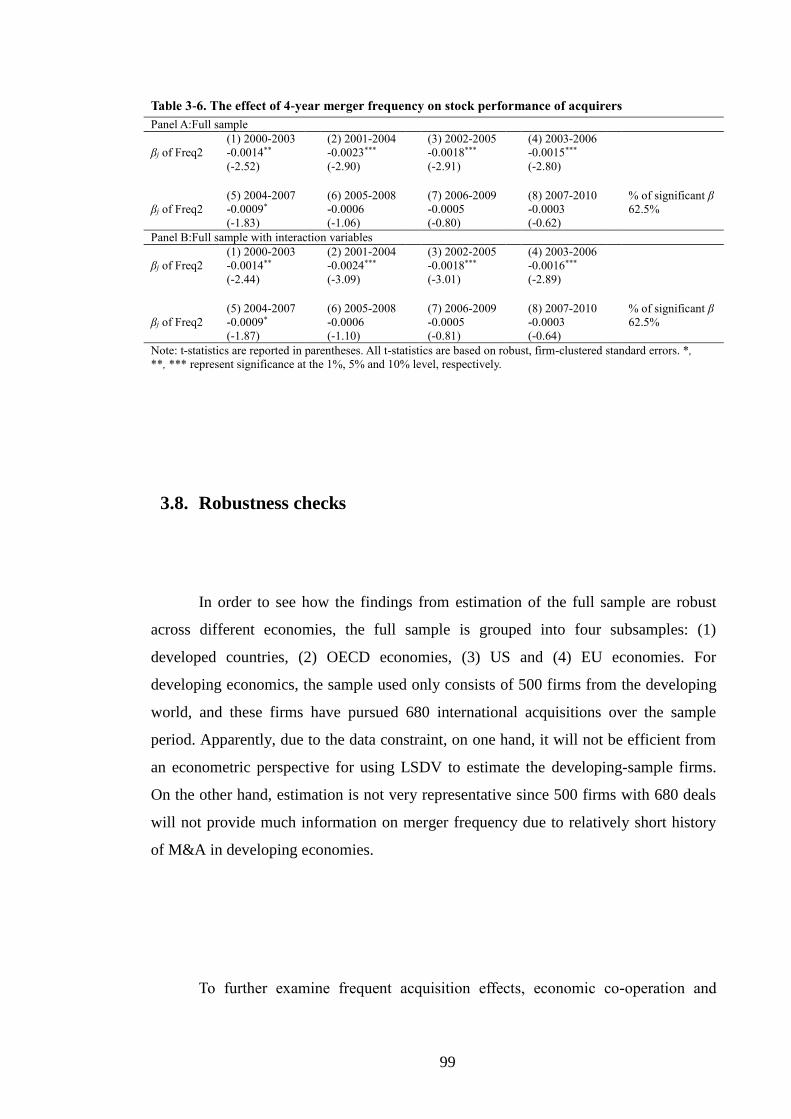
99
Table 3-6. The effect of 4-year merger frequency on stock performance of acquirers
Panel A:Full sample
(1) 2000-2003 (2) 2001-2004 (3) 2002-2005 (4) 2003-2006
βj of Freq2 -0.0014** -0.0023*** -0.0018*** -0.0015***
(-2.52) (-2.90) (-2.91) (-2.80)
(5) 2004-2007 (6) 2005-2008 (7) 2006-2009 (8) 2007-2010 % of significant β
βj of Freq2 -0.0009* -0.0006 -0.0005 -0.0003 62.5%
(-1.83) (-1.06) (-0.80) (-0.62)
Panel B:Full sample with interaction variables
(1) 2000-2003 (2) 2001-2004 (3) 2002-2005 (4) 2003-2006
βj of Freq2 -0.0014** -0.0024*** -0.0018*** -0.0016***
(-2.44) (-3.09) (-3.01) (-2.89)
(5) 2004-2007 (6) 2005-2008 (7) 2006-2009 (8) 2007-2010 % of significant β
βj of Freq2 -0.0009* -0.0006 -0.0005 -0.0003 62.5%
(-1.87) (-1.10) (-0.81) (-0.64)
Note: t-statistics are reported in parentheses. All t-statistics are based on robust, firm-clustered standard errors. *,
**, *** represent significance at the 1%, 5% and 10% level, respectively.
3.8. Robustness checks
In order to see how the findings from estimation of the full sample are robust
across different economies, the full sample is grouped into four subsamples: (1)
developed countries, (2) OECD economies, (3) US and (4) EU economies. For
developing economics, the sample used only consists of 500 firms from the developing
world, and these firms have pursued 680 international acquisitions over the sample
period. Apparently, due to the data constraint, on one hand, it will not be efficient from
an econometric perspective for using LSDV to estimate the developing-sample firms.
On the other hand, estimation is not very representative since 500 firms with 680 deals
will not provide much information on merger frequency due to relatively short history
of M&A in developing economies.
To further examine frequent acquisition effects, economic co-operation and
100
development (OECD) 29countries are extracted from the full sample for a variety of
reasons. Firstly, at the firm-level, the acquirers from developed and developing
economies belonging to OECD could be relatively more capable in terms of firm
operations, corporate governance and structures than others in the world. Secondly, in
terms of M&A activity, acquirers of OECD members play a pivotal role in the global
M&A market by performing 12,815 acquisitions during the period 2000-2010,
accounting for 92.65% of the total deals.
The researches of M&A effects in US and EU are well documented in previous
studies. With respect to merger activity, the US has been historically the most active
country in M&A activity in the world. Among OECD countries the U.S. and EU stand
in the top two position. The US had 5,619 acquisitions and the EU had 2,552
acquisitions, which accounted for 46.77% and 21.24% of OECD acquisitions,
respectively. In terms of regulation, the merger regulation of the European
Commission30 is relatively lenient, and tolerates acquisitions that would be unlawful in
the United States (Kauper, 2000). According to anti-trust law, the EU rarely brings
actions against mergers that tend to create or enhance oligopolies, while the US actively
enforced against oligopolies (Bergman et al., 2010). Also, for illustrative purposes that
provide a better comparison with prior literature, the US and the EU acquirers are
therefore separately tested in this section.
Table 3-7 shows estimation results for developed countries and OECD
economies, which is consistent with findings in Table 3-5. Frequency counted for a year
interval and frequency counted for a 4-year interval are negatively and significantly
related to announcement returns. This finding is also shown in the estimation of firms
29 The OECD was established in 1948, including 34 member countries, contributing 80% of trade and investment to
world economy. In the study, acquirers from 33 OECD countries except those from Mexico are included. 30 The European Commission is the EU agency charged with enforcing antitrust regulations.
101
from EU economies (see Table 3-8). Moreover, the US sample also shows a consistent
result for the 4-year or medium-term lasting effect of frequency on CARs that is
negative and significant. Interestingly, the longer lasting effect of new integration seems
stronger in the US evidenced by the significant negative relationship between CARs and
the long-term frequency (see Table 3-8). The result for the US implies that managerial
hubris grows with merger frequency and it dominates other effects, particularly, the
learning effects.
The US finding is consistent with Boubakri et al. (2012) who find that acquirers
experience significant loss from frequent acquisition, using a sample of 4,215
acquisitions by 397 US acquirers from 1999 to 2010. The EU results are in line with
Martynova and Renneboog (2006) who examine 2,419 EU acquisitions made across 28
EU countries and document that the wealth of acquirer’s shareholders reduces as merger
frequency increases. However, these studies have not looked at the different lasting
effects of merger frequency, and the unobserved heterogeneity of acquirers is not
controlled in the estimation. Given insignificant coefficient, the variable of short-term
measure of frequency is not related to announcement returns in the US sample. In
contrast to the EU sample, the estimating results indicate that acquirers take much
stronger negative effects from frequent acquisition in the short-run, suggesting that the
European acquirers may suffer from more serious corporate indigestion of past merger
experience in the short-run. Further, the results of medium-term frequency measures
show that more than 65% of coefficients are significantly negative for US and EU.
Overall, both results for the US and the EU robustly exhibit that frequent
acquisition is value-destructive regardless of the differences in culture, anti-trust law,
investor protection, competition of the M&A market and economic system. The
different lasting effects of mergers is also re-examined in the EU and US samples. For

102
the EU, the key mechanism allowing an acquiring firm to be able to create acquisitive
capabilities in frequent acquisitions may need more time to enhance learning effects,
such as drawing adaptive inference from prior experience on subsequent acquisitions.
Yet, for the U.S., the negative effect of frequent acquisition could possibly be attributed
to agency issues due to the significant long-lasting effect of the frequency.
Among the controls, the effect of deal size is robustly consistent across different
samples for its positive relation to announcement returns. Also the estimated effects of
acquiring public targets and free cash flow are robustly and significantly negative. It is
noticed that for US acquirers, there is no significant difference in CARs when acquiring
foreign or domestic targets. This finding is in line with that of Hayward (2002) who
finds that acquisitions of foreign target are not prone to be different to domestic targets
for over 100 US domiciled companies during 1985-1995. Although the effect of cross-
border acquisition is insignificant, the experience gained through foreign acquisitions or
the complementarities of resources and capabilities of the foreign target firms still make
these transactions at least partially worth the effort (Bertrand and Betschinger, 2012).
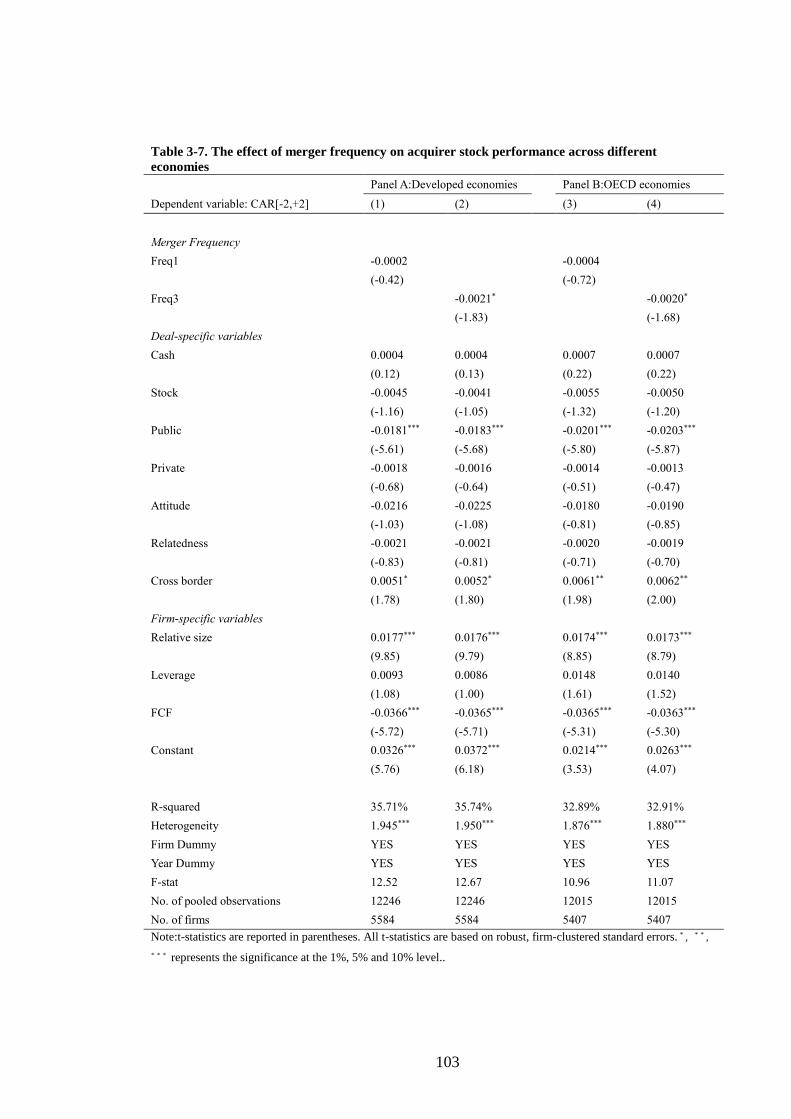
103
Table 3-7. The effect of merger frequency on acquirer stock performance across different
economies
Panel A:Developed economies
Panel B:OECD economies
Dependent variable: CAR[-2,+2] (1) (2)
(3) (4)
Merger Frequency
Freq1 -0.0002
-0.0004
(-0.42)
(-0.72)
Freq3
-0.0021*
-0.0020*
(-1.83)
(-1.68)
Deal-specific variables
Cash 0.0004 0.0004
0.0007 0.0007
(0.12) (0.13)
(0.22) (0.22)
Stock -0.0045 -0.0041
-0.0055 -0.0050
(-1.16) (-1.05)
(-1.32) (-1.20)
Public -0.0181*** -0.0183***
-0.0201*** -0.0203***
(-5.61) (-5.68)
(-5.80) (-5.87)
Private -0.0018 -0.0016
-0.0014 -0.0013
(-0.68) (-0.64)
(-0.51) (-0.47)
Attitude -0.0216 -0.0225
-0.0180 -0.0190
(-1.03) (-1.08)
(-0.81) (-0.85)
Relatedness -0.0021 -0.0021
-0.0020 -0.0019
(-0.83) (-0.81)
(-0.71) (-0.70)
Cross border 0.0051* 0.0052*
0.0061** 0.0062**
(1.78) (1.80)
(1.98) (2.00)
Firm-specific variables
Relative size 0.0177*** 0.0176***
0.0174*** 0.0173***
(9.85) (9.79)
(8.85) (8.79)
Leverage 0.0093 0.0086
0.0148 0.0140
(1.08) (1.00)
(1.61) (1.52)
FCF -0.0366*** -0.0365***
-0.0365*** -0.0363***
(-5.72) (-5.71)
(-5.31) (-5.30)
Constant 0.0326*** 0.0372***
0.0214*** 0.0263***
(5.76) (6.18)
(3.53) (4.07)
R-squared 35.71% 35.74%
32.89% 32.91%
Heterogeneity 1.945*** 1.950***
1.876*** 1.880***
Firm Dummy YES YES
YES YES
Year Dummy YES YES
YES YES
F-stat 12.52 12.67
10.96 11.07
No. of pooled observations 12246 12246
12015 12015
No. of firms 5584 5584
5407 5407
Note:t-statistics are reported in parentheses. All t-statistics are based on robust, firm-clustered standard errors. * , * * ,
* * * represents the significance at the 1%, 5% and 10% level..
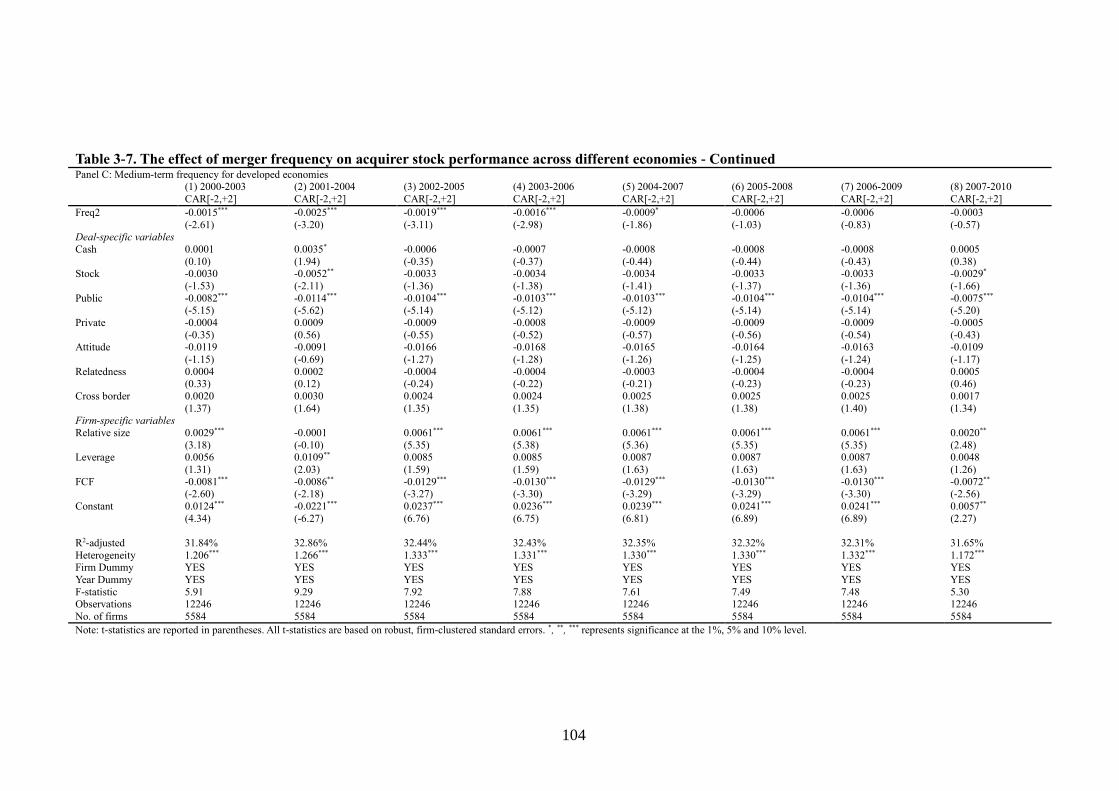
104
Table 3-7. The effect of merger frequency on acquirer stock performance across different economies - Continued
Panel C: Medium-term frequency for developed economies (1) 2000-2003 (2) 2001-2004 (3) 2002-2005 (4) 2003-2006 (5) 2004-2007 (6) 2005-2008 (7) 2006-2009 (8) 2007-2010
CAR[-2,+2] CAR[-2,+2] CAR[-2,+2] CAR[-2,+2] CAR[-2,+2] CAR[-2,+2] CAR[-2,+2] CAR[-2,+2]
Freq2 -0.0015*** -0.0025*** -0.0019*** -0.0016*** -0.0009* -0.0006 -0.0006 -0.0003
(-2.61) (-3.20) (-3.11) (-2.98) (-1.86) (-1.03) (-0.83) (-0.57)
Deal-specific variables
Cash 0.0001 0.0035* -0.0006 -0.0007 -0.0008 -0.0008 -0.0008 0.0005
(0.10) (1.94) (-0.35) (-0.37) (-0.44) (-0.44) (-0.43) (0.38) Stock -0.0030 -0.0052** -0.0033 -0.0034 -0.0034 -0.0033 -0.0033 -0.0029*
(-1.53) (-2.11) (-1.36) (-1.38) (-1.41) (-1.37) (-1.36) (-1.66)
Public -0.0082*** -0.0114*** -0.0104*** -0.0103*** -0.0103*** -0.0104*** -0.0104*** -0.0075*** (-5.15) (-5.62) (-5.14) (-5.12) (-5.12) (-5.14) (-5.14) (-5.20)
Private -0.0004 0.0009 -0.0009 -0.0008 -0.0009 -0.0009 -0.0009 -0.0005
(-0.35) (0.56) (-0.55) (-0.52) (-0.57) (-0.56) (-0.54) (-0.43) Attitude -0.0119 -0.0091 -0.0166 -0.0168 -0.0165 -0.0164 -0.0163 -0.0109
(-1.15) (-0.69) (-1.27) (-1.28) (-1.26) (-1.25) (-1.24) (-1.17)
Relatedness 0.0004 0.0002 -0.0004 -0.0004 -0.0003 -0.0004 -0.0004 0.0005 (0.33) (0.12) (-0.24) (-0.22) (-0.21) (-0.23) (-0.23) (0.46)
Cross border 0.0020 0.0030 0.0024 0.0024 0.0025 0.0025 0.0025 0.0017
(1.37) (1.64) (1.35) (1.35) (1.38) (1.38) (1.40) (1.34) Firm-specific variables
Relative size 0.0029*** -0.0001 0.0061*** 0.0061*** 0.0061*** 0.0061*** 0.0061*** 0.0020**
(3.18) (-0.10) (5.35) (5.38) (5.36) (5.35) (5.35) (2.48) Leverage 0.0056 0.0109** 0.0085 0.0085 0.0087 0.0087 0.0087 0.0048
(1.31) (2.03) (1.59) (1.59) (1.63) (1.63) (1.63) (1.26)
FCF -0.0081*** -0.0086** -0.0129*** -0.0130*** -0.0129*** -0.0130*** -0.0130*** -0.0072** (-2.60) (-2.18) (-3.27) (-3.30) (-3.29) (-3.29) (-3.30) (-2.56)
Constant 0.0124*** -0.0221*** 0.0237*** 0.0236*** 0.0239*** 0.0241*** 0.0241*** 0.0057**
(4.34) (-6.27) (6.76) (6.75) (6.81) (6.89) (6.89) (2.27)
R2-adjusted 31.84% 32.86% 32.44% 32.43% 32.35% 32.32% 32.31% 31.65%
Heterogeneity 1.206*** 1.266*** 1.333*** 1.331*** 1.330*** 1.330*** 1.332*** 1.172*** Firm Dummy YES YES YES YES YES YES YES YES
Year Dummy YES YES YES YES YES YES YES YES
F-statistic 5.91 9.29 7.92 7.88 7.61 7.49 7.48 5.30 Observations 12246 12246 12246 12246 12246 12246 12246 12246
No. of firms 5584 5584 5584 5584 5584 5584 5584 5584
Note: t-statistics are reported in parentheses. All t-statistics are based on robust, firm-clustered standard errors. *, **, *** represents significance at the 1%, 5% and 10% level.
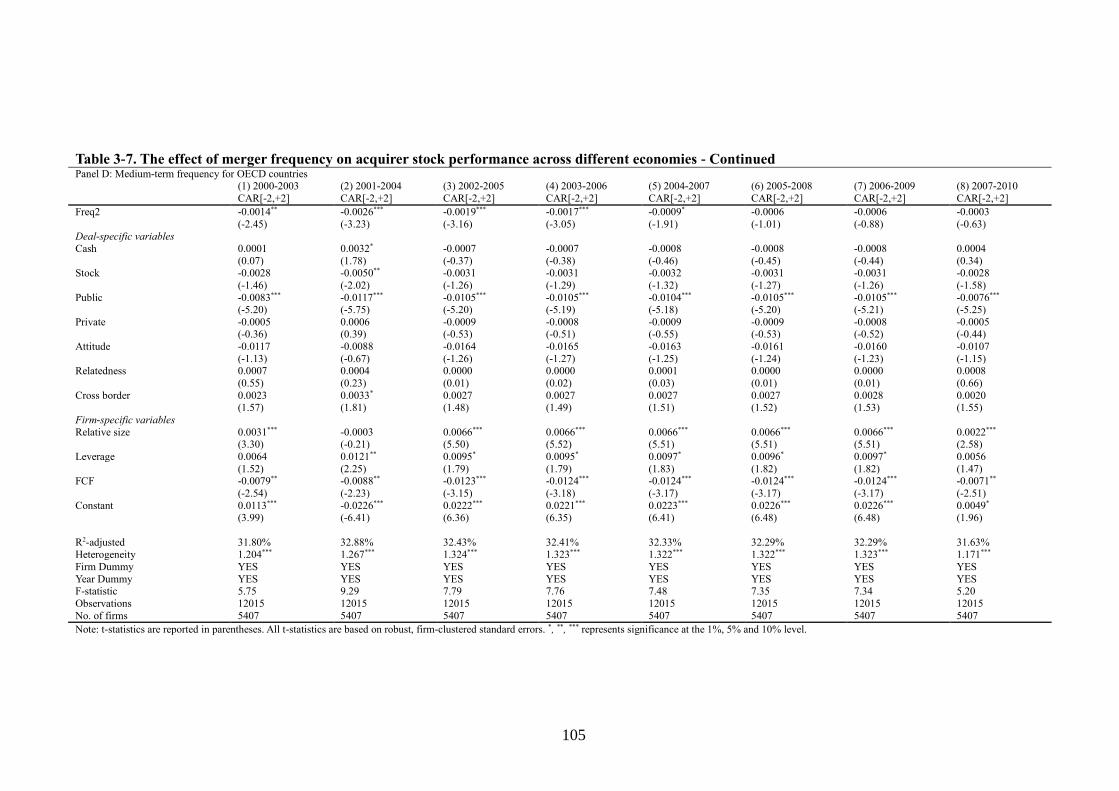
105
Table 3-7. The effect of merger frequency on acquirer stock performance across different economies - Continued
Panel D: Medium-term frequency for OECD countries (1) 2000-2003 (2) 2001-2004 (3) 2002-2005 (4) 2003-2006 (5) 2004-2007 (6) 2005-2008 (7) 2006-2009 (8) 2007-2010
CAR[-2,+2] CAR[-2,+2] CAR[-2,+2] CAR[-2,+2] CAR[-2,+2] CAR[-2,+2] CAR[-2,+2] CAR[-2,+2]
Freq2 -0.0014** -0.0026*** -0.0019*** -0.0017*** -0.0009* -0.0006 -0.0006 -0.0003
(-2.45) (-3.23) (-3.16) (-3.05) (-1.91) (-1.01) (-0.88) (-0.63)
Deal-specific variables
Cash 0.0001 0.0032* -0.0007 -0.0007 -0.0008 -0.0008 -0.0008 0.0004
(0.07) (1.78) (-0.37) (-0.38) (-0.46) (-0.45) (-0.44) (0.34) Stock -0.0028 -0.0050** -0.0031 -0.0031 -0.0032 -0.0031 -0.0031 -0.0028
(-1.46) (-2.02) (-1.26) (-1.29) (-1.32) (-1.27) (-1.26) (-1.58)
Public -0.0083*** -0.0117*** -0.0105*** -0.0105*** -0.0104*** -0.0105*** -0.0105*** -0.0076*** (-5.20) (-5.75) (-5.20) (-5.19) (-5.18) (-5.20) (-5.21) (-5.25)
Private -0.0005 0.0006 -0.0009 -0.0008 -0.0009 -0.0009 -0.0008 -0.0005 (-0.36) (0.39) (-0.53) (-0.51) (-0.55) (-0.53) (-0.52) (-0.44)
Attitude -0.0117 -0.0088 -0.0164 -0.0165 -0.0163 -0.0161 -0.0160 -0.0107
(-1.13) (-0.67) (-1.26) (-1.27) (-1.25) (-1.24) (-1.23) (-1.15) Relatedness 0.0007 0.0004 0.0000 0.0000 0.0001 0.0000 0.0000 0.0008
(0.55) (0.23) (0.01) (0.02) (0.03) (0.01) (0.01) (0.66)
Cross border 0.0023 0.0033* 0.0027 0.0027 0.0027 0.0027 0.0028 0.0020 (1.57) (1.81) (1.48) (1.49) (1.51) (1.52) (1.53) (1.55)
Firm-specific variables
Relative size 0.0031*** -0.0003 0.0066*** 0.0066*** 0.0066*** 0.0066*** 0.0066*** 0.0022*** (3.30) (-0.21) (5.50) (5.52) (5.51) (5.51) (5.51) (2.58)
Leverage 0.0064 0.0121** 0.0095* 0.0095* 0.0097* 0.0096* 0.0097* 0.0056
(1.52) (2.25) (1.79) (1.79) (1.83) (1.82) (1.82) (1.47) FCF -0.0079** -0.0088** -0.0123*** -0.0124*** -0.0124*** -0.0124*** -0.0124*** -0.0071**
(-2.54) (-2.23) (-3.15) (-3.18) (-3.17) (-3.17) (-3.17) (-2.51)
Constant 0.0113*** -0.0226*** 0.0222*** 0.0221*** 0.0223*** 0.0226*** 0.0226*** 0.0049* (3.99) (-6.41) (6.36) (6.35) (6.41) (6.48) (6.48) (1.96)
R2-adjusted 31.80% 32.88% 32.43% 32.41% 32.33% 32.29% 32.29% 31.63%
Heterogeneity 1.204*** 1.267*** 1.324*** 1.323*** 1.322*** 1.322*** 1.323*** 1.171***
Firm Dummy YES YES YES YES YES YES YES YES
Year Dummy YES YES YES YES YES YES YES YES F-statistic 5.75 9.29 7.79 7.76 7.48 7.35 7.34 5.20
Observations 12015 12015 12015 12015 12015 12015 12015 12015
No. of firms 5407 5407 5407 5407 5407 5407 5407 5407
Note: t-statistics are reported in parentheses. All t-statistics are based on robust, firm-clustered standard errors. *, **, *** represents significance at the 1%, 5% and 10% level.
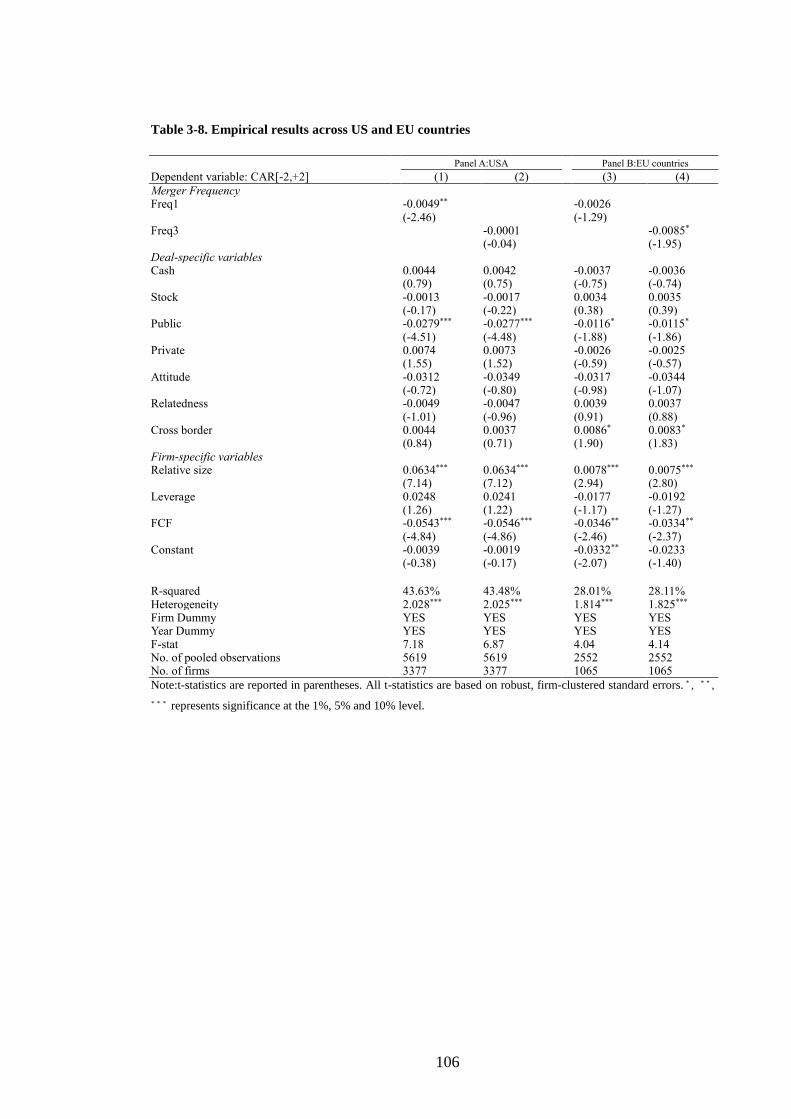
106
Table 3-8. Empirical results across US and EU countries
Panel A:USA
Panel B:EU countries
Dependent variable: CAR[-2,+2]
(1) (2)
(3) (4)
Merger Frequency Freq1
-0.0049**
-0.0026
(-2.46)
(-1.29) Freq3
-0.0001
-0.0085*
(-0.04)
(-1.95)
Deal-specific variables Cash
0.0044 0.0042
-0.0037 -0.0036
(0.79) (0.75)
(-0.75) (-0.74)
Stock
-0.0013 -0.0017
0.0034 0.0035
(-0.17) (-0.22)
(0.38) (0.39)
Public
-0.0279*** -0.0277***
-0.0116* -0.0115*
(-4.51) (-4.48)
(-1.88) (-1.86)
Private
0.0074 0.0073
-0.0026 -0.0025
(1.55) (1.52)
(-0.59) (-0.57)
Attitude
-0.0312 -0.0349
-0.0317 -0.0344
(-0.72) (-0.80)
(-0.98) (-1.07)
Relatedness
-0.0049 -0.0047
0.0039 0.0037
(-1.01) (-0.96)
(0.91) (0.88)
Cross border
0.0044 0.0037
0.0086* 0.0083*
(0.84) (0.71)
(1.90) (1.83)
Firm-specific variables Relative size
0.0634*** 0.0634***
0.0078*** 0.0075***
(7.14) (7.12)
(2.94) (2.80)
Leverage
0.0248 0.0241
-0.0177 -0.0192
(1.26) (1.22)
(-1.17) (-1.27)
FCF
-0.0543*** -0.0546***
-0.0346** -0.0334**
(-4.84) (-4.86)
(-2.46) (-2.37)
Constant
-0.0039 -0.0019
-0.0332** -0.0233
(-0.38) (-0.17)
(-2.07) (-1.40)
R-squared
43.63% 43.48%
28.01% 28.11%
Heterogeneity
2.028*** 2.025***
1.814*** 1.825*** Firm Dummy
YES YES
YES YES
Year Dummy
YES YES
YES YES F-stat
7.18 6.87
4.04 4.14
No. of pooled observations
5619 5619
2552 2552 No. of firms 3377 3377 1065 1065
Note:t-statistics are reported in parentheses. All t-statistics are based on robust, firm-clustered standard errors. * , * * ,
* * * represents significance at the 1%, 5% and 10% level.

107
Table 3-8. Empirical results across US and EU countries - Continued
Panel C: Medium-term frequency for US
(1) 2000-2003 (2) 2001-2004 (3) 2002-2005 (4) 2003-2006 (5) 2004-2007 (6) 2005-2008 (7) 2006-2009 (8) 2007-2010
CAR[-2,+2] CAR[-2,+2] CAR[-2,+2] CAR[-2,+2] CAR[-2,+2] CAR[-2,+2] CAR[-2,+2] CAR[-2,+2]
Freq2 -0.0019** -0.0019** -0.0014*** -0.0008* -0.0001 -0.0016*** 0.0002 -0.0008
(-2.04) (-2.38) (-2.83) (-1.79) (-0.15) (-3.21) (0.26) (-0.96)
Deal-specific variables
Cash 0.0013 -0.0005 -0.0007 -0.0008 -0.0009 -0.0008 -0.0006 -0.0003 (0.45) (-0.24) (-0.40) (-0.45) (-0.48) (-0.47) (-0.24) (-0.15)
Stock -0.0023 0.0006 0.0016 0.0016 0.0018 0.0020 -0.0001 -0.0008
(-0.57) (0.18) (0.64) (0.63) (0.71) (0.79) (-0.02) (-0.25) Public -0.0149*** -0.0093*** -0.0064*** -0.0065*** -0.0066*** -0.0066*** -0.0110*** -0.0103***
(-4.73) (-3.79) (-3.27) (-3.29) (-3.31) (-3.35) (-4.08) (-4.22) Private 0.0021 -0.0001 -0.0004 -0.0003 -0.0003 -0.0003 -0.0001 -0.0004
(0.83) (-0.06) (-0.23) (-0.20) (-0.20) (-0.21) (-0.03) (-0.21)
Attitude -0.0021 -0.0167 -0.0167 -0.0170 -0.0172 -0.0173 -0.0144 -0.0114 (-0.10) (-0.95) (-1.19) (-1.21) (-1.23) (-1.23) (-0.75) (-0.66)
Relatedness -0.0002 0.0005 0.0002 0.0003 0.0003 0.0003 0.0006 0.0008
(-0.09) (0.27) (0.12) (0.18) (0.18) (0.17) (0.27) (0.40) Cross border 0.0009 0.0013 0.0010 0.0010 0.0012 0.0011 0.0012 0.0009
(0.31) (0.62) (0.61) (0.60) (0.68) (0.67) (0.51) (0.41)
Firm-specific variables Relative size -0.0018 0.0024 0.0030** 0.0030** 0.0030** 0.0030** 0.0019 0.0007
(-0.91) (1.59) (2.49) (2.48) (2.49) (2.51) (1.17) (0.46)
Leverage -0.0084 -0.0027 -0.0012 -0.0013 -0.0012 -0.0012 -0.0036 -0.0032 (-1.40) (-0.57) (-0.33) (-0.36) (-0.32) (-0.32) (-0.71) (-0.69)
FCF -0.0325*** -0.0214*** -0.0135** -0.0137** -0.0139** -0.0136** -0.0258*** -0.0242***
(-3.56) (-3.01) (-2.37) (-2.40) (-2.43) (-2.37) (-3.31) (-3.44) Constant -0.0244*** 0.0046 0.0164*** 0.0166*** 0.0169*** 0.0172*** -0.0001 -0.0037
(-4.43) (1.10) (4.89) (4.95) (5.03) (5.12) (-0.02) (-0.89)
R2-adjusted 35.24% 32.90% 32.90% 32.69% 32.55% 32.61% 32.93% 33.04%
Heterogeneity 1.292*** 1.252*** 1.277*** 1.273*** 1.272*** 1.275*** 1.250*** 1.207***
Firm Dummy YES YES YES YES YES YES YES YES Year Dummy YES YES YES YES YES YES YES YES
F-statistic 5.84 3.16 3.15 2.92 2.76 2.83 3.19 3.31
Observations 5619 5619 5619 5619 5619 5619 5619 5619 No. of firms 3377 3377 3377 3377 3377 3377 3377 3377
Note: t-statistics are reported in parentheses. All t-statistics are based on robust, firm-clustered standard errors. *, **, *** represents significance at the 1%, 5% and 10% level.

108
Table 3-8. Empirical results across US and EU countries - Continued
Panel D: Medium-term frequency for EU (1) 2000-2003 (2) 2001-2004 (3) 2002-2005 (4) 2003-2006 (5) 2004-2007 (6) 2005-2008 (7) 2006-2009 (8) 2007-2010
CAR[-2,+2] CAR[-2,+2] CAR[-2,+2] CAR[-2,+2] CAR[-2,+2] CAR[-2,+2] CAR[-2,+2] CAR[-2,+2]
Freq2 -0.0030** -0.0025* -0.0021*** -0.0013** -0.0001 -0.0017** 0.0000 0.0001
(-2.14) (-1.94) (-2.99) (-2.04) (-0.21) (-2.17) (0.05) (0.15)
Deal-specific variables
Cash -0.0036 -0.0036 -0.0035* -0.0036* -0.0035* -0.0035* -0.0033 -0.0025
(-1.56) (-1.57) (-1.84) (-1.87) (-1.86) (-1.84) (-1.35) (-1.13) Stock -0.0012 -0.0013 -0.0000 0.0001 0.0001 0.0001 -0.0012 -0.0012
(-0.30) (-0.31) (-0.01) (0.03) (0.03) (0.04) (-0.28) (-0.31)
Public -0.0053* -0.0055* -0.0042* -0.0040* -0.0040* -0.0041* -0.0064** -0.0059** (-1.85) (-1.91) (-1.77) (-1.72) (-1.72) (-1.75) (-2.06) (-2.12)
Private -0.0019 -0.0019 -0.0019 -0.0019 -0.0020 -0.0020 -0.0020 -0.0015 (-0.95) (-0.94) (-1.16) (-1.15) (-1.22) (-1.23) (-0.95) (-0.78)
Attitude -0.0227 -0.0234 -0.0181 -0.0176 -0.0168 -0.0166 -0.0260 -0.0256*
(-1.51) (-1.56) (-1.47) (-1.43) (-1.36) (-1.35) (-1.61) (-1.76) Relatedness 0.0020 0.0019 0.0015 0.0015 0.0017 0.0017 0.0021 0.0021
(1.00) (0.95) (0.90) (0.93) (1.03) (1.02) (1.01) (1.12)
Cross border 0.0027** 0.0028** 0.0025** 0.0025** 0.0027 0.0028 0.0028 0.0023 (2.16) (2.11) (2.14) (2.17) (1.55) (1.59) (1.22) (1.11)
Firm-specific variables
Relative size 0.0025* 0.0026* 0.0023* 0.0024* 0.0024* 0.0024** 0.0027* 0.0020 (1.66) (1.72) (1.92) (1.94) (1.96) (1.99) (1.71) (1.40)
Leverage -0.0158 -0.0153 -0.0099 -0.0104 -0.0110 -0.0109 -0.0186 -0.0176*
(-1.44) (-1.40) (-1.10) (-1.15) (-1.22) (-1.22) (-1.58) (-1.66) FCF -0.0005 -0.0013 0.0007 -0.0002 0.0002 0.0008 -0.0025 -0.0038
(-0.05) (-0.12) (0.08) (-0.03) (0.03) (0.10) (-0.23) (-0.39)
Constant -0.0125 0.0005 0.0109* 0.0107* 0.0108* 0.0109* -0.0035 -0.0061 (-0.99) (0.07) (1.72) (1.70) (1.71) (1.73) (-0.42) (-0.81)
R2-adjusted 34.15% 33.93% 34.34% 34.03% 33.76% 33.85% 33.72% 33.61%
Heterogeneity 1.315*** 1.231*** 1.247*** 1.241*** 1.240*** 1.252*** 1.231*** 1.201***
Firm Dummy YES YES YES YES YES YES YES YES
Year Dummy YES YES YES YES YES YES YES YES F-statistic 3.02 2.85 3.17 2.93 2.73 2.79 2.70 2.61
Observations 2552 2552 2552 2552 2552 2552 2552 2552
No. of firms 1065 1065 1065 1065 1065 1065 1065 1065
Note: t-statistics are reported in parentheses. All t-statistics are based on robust, firm-clustered standard errors. *, **, *** represents significance at the 1%, 5% and 10% level,.

109
3.9. Conclusions
Does merger frequency affect stock performance? It is evident from this study
that short-term frequency and medium-term frequency are negatively related to CARs.
However, long-term frequency is not significantly related to the market expectation of
performance improvement. This suggests that the effect of merger frequency does not
last permanently. A distinctive contribution to the literature made by this study is to
examine the merger frequency impacts on market expectation in both the temporal and
the quantitative dimensions.
This chapter examines the interaction of the number of takeover events with the
time of their lasting effect after the event occurrence in order to explore the impact of
merger frequency on market expectation about the future performance of an acquiring
firm. The interaction provides the advantage of assessing an argument about which kind
of managerial behaviour caused by repeated events such as merger frequency are
stronger or dominant in affecting performance: management hubris or management
learning?
Firstly, if the number of merger repetitions presents “hubris”, then it is expected
that the frequency is negatively related to the market performance of acquiring firms.
Secondly for a given number of mergers, if the length of time after the event occurrence
reflects the amount of learning time which the management needs to digest
opportunities and changes from new integrated business for more learning, then the
longer time of an event repeating is expected to be positively related to performance.
However, the estimation in this chapter of the interaction of frequency with time shows

110
that the two managerial behaviours co-exist. It is evident that the negative effect of the
short term and medium term merger frequency decreases over time and may become
insignificant.
In addition, the study shows that the larger size of a merger has a positive effect
on performance. This supports the argument about “risk pressure” on management of
the acquiring firm. The estimation results are robust in two senses: firstly, controlled
firm fixed effects in estimation, and secondly, a larger sample provides the consistency
of estimation across different economies.
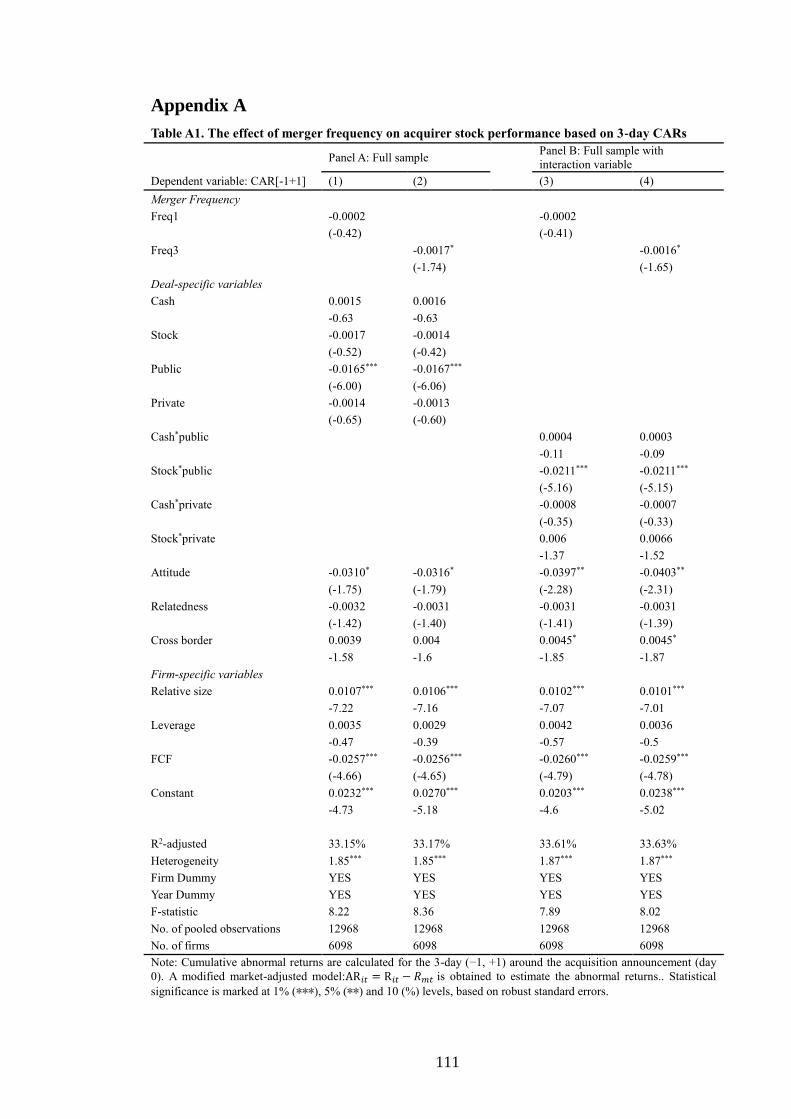
111
Appendix A
Table A1. The effect of merger frequency on acquirer stock performance based on 3-day CARs
Panel A: Full sample
Panel B: Full sample with
interaction variable
Dependent variable: CAR[-1+1] (1) (2)
(3) (4)
Merger Frequency
Freq1 -0.0002
-0.0002
(-0.42)
(-0.41)
Freq3
-0.0017*
-0.0016*
(-1.74)
(-1.65)
Deal-specific variables
Cash 0.0015 0.0016
-0.63 -0.63
Stock -0.0017 -0.0014
(-0.52) (-0.42)
Public -0.0165*** -0.0167***
(-6.00) (-6.06)
Private -0.0014 -0.0013
(-0.65) (-0.60)
Cash*public
0.0004 0.0003
-0.11 -0.09
Stock*public
-0.0211*** -0.0211***
(-5.16) (-5.15)
Cash*private
-0.0008 -0.0007
(-0.35) (-0.33)
Stock*private
0.006 0.0066
-1.37 -1.52
Attitude -0.0310* -0.0316*
-0.0397** -0.0403**
(-1.75) (-1.79)
(-2.28) (-2.31)
Relatedness -0.0032 -0.0031
-0.0031 -0.0031
(-1.42) (-1.40)
(-1.41) (-1.39)
Cross border 0.0039 0.004
0.0045* 0.0045*
-1.58 -1.6
-1.85 -1.87
Firm-specific variables
Relative size 0.0107*** 0.0106***
0.0102*** 0.0101***
-7.22 -7.16
-7.07 -7.01
Leverage 0.0035 0.0029
0.0042 0.0036
-0.47 -0.39
-0.57 -0.5
FCF -0.0257*** -0.0256***
-0.0260*** -0.0259***
(-4.66) (-4.65)
(-4.79) (-4.78)
Constant 0.0232*** 0.0270***
0.0203*** 0.0238***
-4.73 -5.18
-4.6 -5.02
R2-adjusted 33.15% 33.17%
33.61% 33.63%
Heterogeneity 1.85*** 1.85***
1.87*** 1.87***
Firm Dummy YES YES
YES YES
Year Dummy YES YES
YES YES
F-statistic 8.22 8.36
7.89 8.02
No. of pooled observations 12968 12968
12968 12968
No. of firms 6098 6098
6098 6098
Note: Cumulative abnormal returns are calculated for the 3-day (−1, +1) around the acquisition announcement (day
0). A modified market-adjusted model:AR𝑖𝑡 = R𝑖𝑡 − 𝑅𝑚𝑡 is obtained to estimate the abnormal returns.. Statistical
significance is marked at 1% (∗∗∗), 5% (∗∗) and 10 (%) levels, based on robust standard errors.
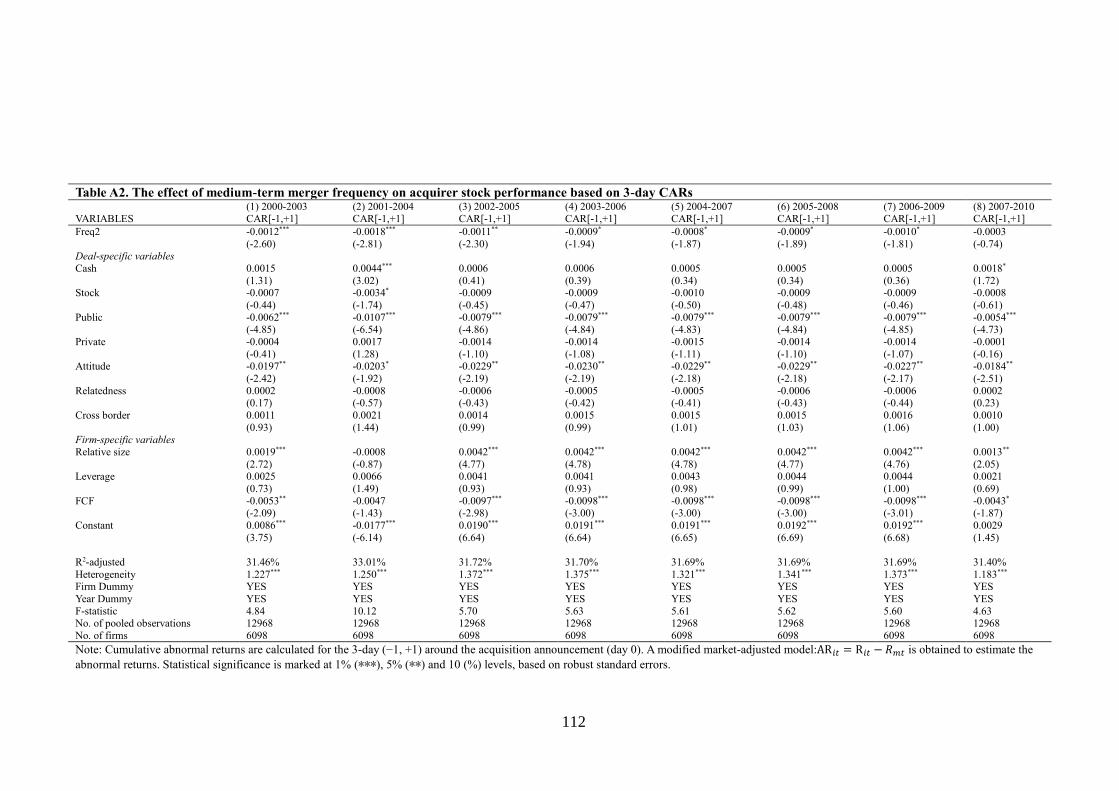
112
Table A2. The effect of medium-term merger frequency on acquirer stock performance based on 3-day CARs
(1) 2000-2003 (2) 2001-2004 (3) 2002-2005 (4) 2003-2006 (5) 2004-2007 (6) 2005-2008 (7) 2006-2009 (8) 2007-2010 VARIABLES CAR[-1,+1] CAR[-1,+1] CAR[-1,+1] CAR[-1,+1] CAR[-1,+1] CAR[-1,+1] CAR[-1,+1] CAR[-1,+1]
Freq2 -0.0012*** -0.0018*** -0.0011** -0.0009* -0.0008* -0.0009* -0.0010* -0.0003
(-2.60) (-2.81) (-2.30) (-1.94) (-1.87) (-1.89) (-1.81) (-0.74)
Deal-specific variables
Cash 0.0015 0.0044*** 0.0006 0.0006 0.0005 0.0005 0.0005 0.0018*
(1.31) (3.02) (0.41) (0.39) (0.34) (0.34) (0.36) (1.72) Stock -0.0007 -0.0034* -0.0009 -0.0009 -0.0010 -0.0009 -0.0009 -0.0008
(-0.44) (-1.74) (-0.45) (-0.47) (-0.50) (-0.48) (-0.46) (-0.61)
Public -0.0062*** -0.0107*** -0.0079*** -0.0079*** -0.0079*** -0.0079*** -0.0079*** -0.0054*** (-4.85) (-6.54) (-4.86) (-4.84) (-4.83) (-4.84) (-4.85) (-4.73)
Private -0.0004 0.0017 -0.0014 -0.0014 -0.0015 -0.0014 -0.0014 -0.0001
(-0.41) (1.28) (-1.10) (-1.08) (-1.11) (-1.10) (-1.07) (-0.16) Attitude -0.0197** -0.0203* -0.0229** -0.0230** -0.0229** -0.0229** -0.0227** -0.0184**
(-2.42) (-1.92) (-2.19) (-2.19) (-2.18) (-2.18) (-2.17) (-2.51)
Relatedness 0.0002 -0.0008 -0.0006 -0.0005 -0.0005 -0.0006 -0.0006 0.0002 (0.17) (-0.57) (-0.43) (-0.42) (-0.41) (-0.43) (-0.44) (0.23)
Cross border 0.0011 0.0021 0.0014 0.0015 0.0015 0.0015 0.0016 0.0010
(0.93) (1.44) (0.99) (0.99) (1.01) (1.03) (1.06) (1.00) Firm-specific variables
Relative size 0.0019*** -0.0008 0.0042*** 0.0042*** 0.0042*** 0.0042*** 0.0042*** 0.0013**
(2.72) (-0.87) (4.77) (4.78) (4.78) (4.77) (4.76) (2.05) Leverage 0.0025 0.0066 0.0041 0.0041 0.0043 0.0044 0.0044 0.0021
(0.73) (1.49) (0.93) (0.93) (0.98) (0.99) (1.00) (0.69)
FCF -0.0053** -0.0047 -0.0097*** -0.0098*** -0.0098*** -0.0098*** -0.0098*** -0.0043* (-2.09) (-1.43) (-2.98) (-3.00) (-3.00) (-3.00) (-3.01) (-1.87)
Constant 0.0086*** -0.0177*** 0.0190*** 0.0191*** 0.0191*** 0.0192*** 0.0192*** 0.0029
(3.75) (-6.14) (6.64) (6.64) (6.65) (6.69) (6.68) (1.45)
R2-adjusted 31.46% 33.01% 31.72% 31.70% 31.69% 31.69% 31.69% 31.40%
Heterogeneity 1.227*** 1.250*** 1.372*** 1.375*** 1.321*** 1.341*** 1.373*** 1.183*** Firm Dummy YES YES YES YES YES YES YES YES
Year Dummy YES YES YES YES YES YES YES YES
F-statistic 4.84 10.12 5.70 5.63 5.61 5.62 5.60 4.63 No. of pooled observations 12968 12968 12968 12968 12968 12968 12968 12968
No. of firms 6098 6098 6098 6098 6098 6098 6098 6098
Note: Cumulative abnormal returns are calculated for the 3-day (−1, +1) around the acquisition announcement (day 0). A modified market-adjusted model:AR𝑖𝑡 = R𝑖𝑡 − 𝑅𝑚𝑡 is obtained to estimate the
abnormal returns. Statistical significance is marked at 1% (∗∗∗), 5% (∗∗) and 10 (%) levels, based on robust standard errors.
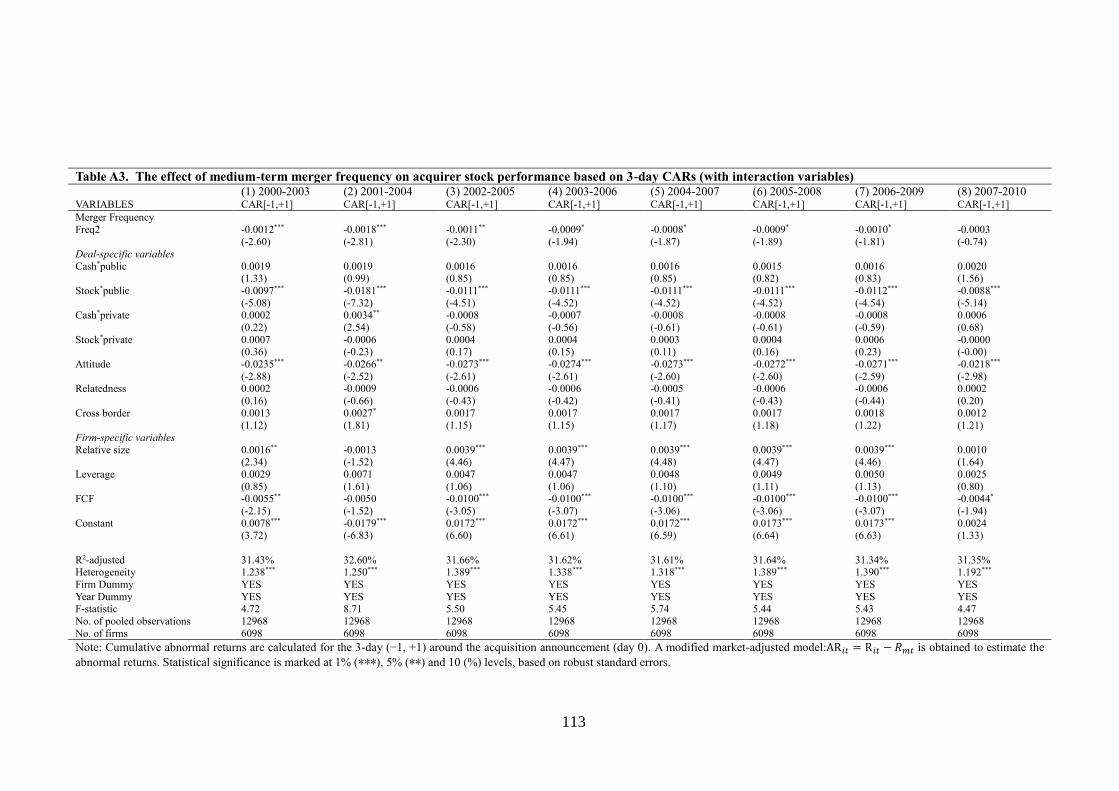
113
Table A3. The effect of medium-term merger frequency on acquirer stock performance based on 3-day CARs (with interaction variables)
(1) 2000-2003 (2) 2001-2004 (3) 2002-2005 (4) 2003-2006 (5) 2004-2007 (6) 2005-2008 (7) 2006-2009 (8) 2007-2010
VARIABLES CAR[-1,+1] CAR[-1,+1] CAR[-1,+1] CAR[-1,+1] CAR[-1,+1] CAR[-1,+1] CAR[-1,+1] CAR[-1,+1]
Merger Frequency
Freq2 -0.0012*** -0.0018*** -0.0011** -0.0009* -0.0008* -0.0009* -0.0010* -0.0003
(-2.60) (-2.81) (-2.30) (-1.94) (-1.87) (-1.89) (-1.81) (-0.74)
Deal-specific variables
Cash*public 0.0019 0.0019 0.0016 0.0016 0.0016 0.0015 0.0016 0.0020 (1.33) (0.99) (0.85) (0.85) (0.85) (0.82) (0.83) (1.56)
Stock*public -0.0097*** -0.0181*** -0.0111*** -0.0111*** -0.0111*** -0.0111*** -0.0112*** -0.0088***
(-5.08) (-7.32) (-4.51) (-4.52) (-4.52) (-4.52) (-4.54) (-5.14) Cash*private 0.0002 0.0034** -0.0008 -0.0007 -0.0008 -0.0008 -0.0008 0.0006
(0.22) (2.54) (-0.58) (-0.56) (-0.61) (-0.61) (-0.59) (0.68)
Stock*private 0.0007 -0.0006 0.0004 0.0004 0.0003 0.0004 0.0006 -0.0000 (0.36) (-0.23) (0.17) (0.15) (0.11) (0.16) (0.23) (-0.00)
Attitude -0.0235*** -0.0266** -0.0273*** -0.0274*** -0.0273*** -0.0272*** -0.0271*** -0.0218***
(-2.88) (-2.52) (-2.61) (-2.61) (-2.60) (-2.60) (-2.59) (-2.98) Relatedness 0.0002 -0.0009 -0.0006 -0.0006 -0.0005 -0.0006 -0.0006 0.0002
(0.16) (-0.66) (-0.43) (-0.42) (-0.41) (-0.43) (-0.44) (0.20)
Cross border 0.0013 0.0027* 0.0017 0.0017 0.0017 0.0017 0.0018 0.0012 (1.12) (1.81) (1.15) (1.15) (1.17) (1.18) (1.22) (1.21)
Firm-specific variables
Relative size 0.0016** -0.0013 0.0039*** 0.0039*** 0.0039*** 0.0039*** 0.0039*** 0.0010 (2.34) (-1.52) (4.46) (4.47) (4.48) (4.47) (4.46) (1.64)
Leverage 0.0029 0.0071 0.0047 0.0047 0.0048 0.0049 0.0050 0.0025
(0.85) (1.61) (1.06) (1.06) (1.10) (1.11) (1.13) (0.80) FCF -0.0055** -0.0050 -0.0100*** -0.0100*** -0.0100*** -0.0100*** -0.0100*** -0.0044*
(-2.15) (-1.52) (-3.05) (-3.07) (-3.06) (-3.06) (-3.07) (-1.94)
Constant 0.0078*** -0.0179*** 0.0172*** 0.0172*** 0.0172*** 0.0173*** 0.0173*** 0.0024 (3.72) (-6.83) (6.60) (6.61) (6.59) (6.64) (6.63) (1.33)
R2-adjusted 31.43% 32.60% 31.66% 31.62% 31.61% 31.64% 31.34% 31.35% Heterogeneity 1.238*** 1.250*** 1.389*** 1.338*** 1.318*** 1.389*** 1.390*** 1.192***
Firm Dummy YES YES YES YES YES YES YES YES
Year Dummy YES YES YES YES YES YES YES YES F-statistic 4.72 8.71 5.50 5.45 5.74 5.44 5.43 4.47
No. of pooled observations 12968 12968 12968 12968 12968 12968 12968 12968
No. of firms 6098 6098 6098 6098 6098 6098 6098 6098
Note: Cumulative abnormal returns are calculated for the 3-day (−1, +1) around the acquisition announcement (day 0). A modified market-adjusted model:AR𝑖𝑡 = R𝑖𝑡 − 𝑅𝑚𝑡 is obtained to estimate the
abnormal returns. Statistical significance is marked at 1% (∗∗∗), 5% (∗∗) and 10 (%) levels, based on robust standard errors.
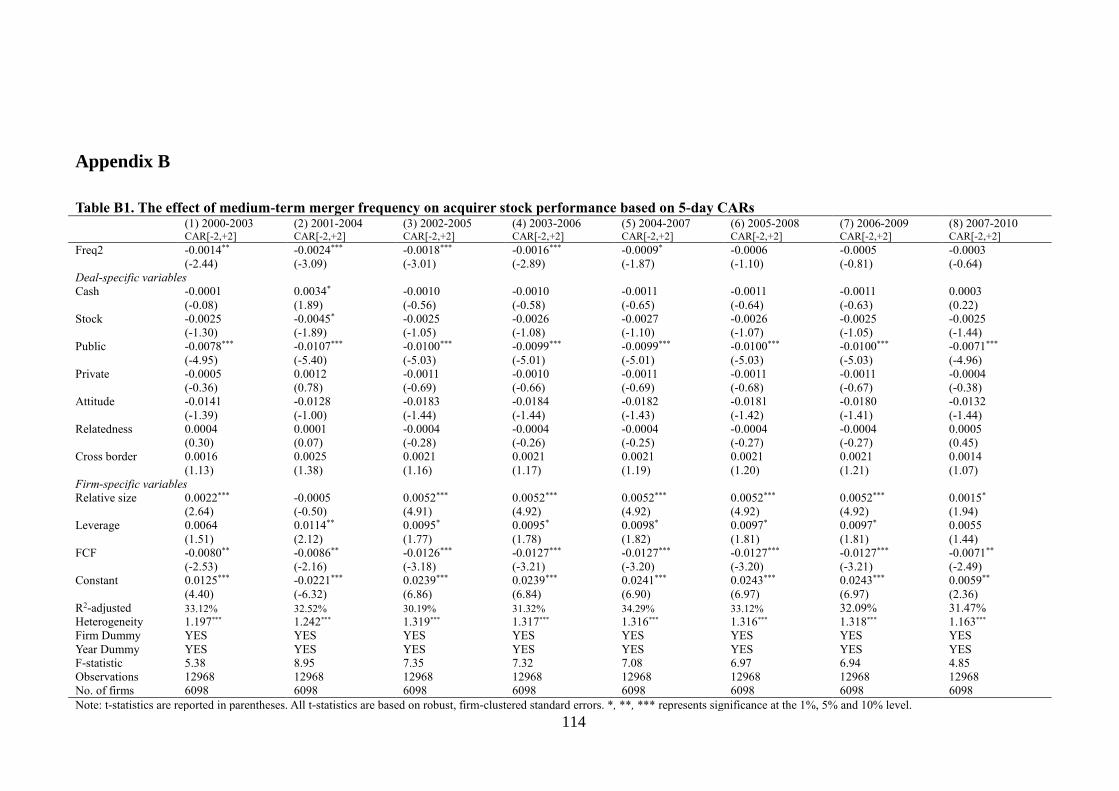
114
Appendix B
Table B1. The effect of medium-term merger frequency on acquirer stock performance based on 5-day CARs
(1) 2000-2003 (2) 2001-2004 (3) 2002-2005 (4) 2003-2006 (5) 2004-2007 (6) 2005-2008 (7) 2006-2009 (8) 2007-2010
CAR[-2,+2] CAR[-2,+2] CAR[-2,+2] CAR[-2,+2] CAR[-2,+2] CAR[-2,+2] CAR[-2,+2] CAR[-2,+2]
Freq2 -0.0014** -0.0024*** -0.0018*** -0.0016*** -0.0009* -0.0006 -0.0005 -0.0003
(-2.44) (-3.09) (-3.01) (-2.89) (-1.87) (-1.10) (-0.81) (-0.64)
Deal-specific variables
Cash -0.0001 0.0034* -0.0010 -0.0010 -0.0011 -0.0011 -0.0011 0.0003
(-0.08) (1.89) (-0.56) (-0.58) (-0.65) (-0.64) (-0.63) (0.22)
Stock -0.0025 -0.0045* -0.0025 -0.0026 -0.0027 -0.0026 -0.0025 -0.0025
(-1.30) (-1.89) (-1.05) (-1.08) (-1.10) (-1.07) (-1.05) (-1.44)
Public -0.0078*** -0.0107*** -0.0100*** -0.0099*** -0.0099*** -0.0100*** -0.0100*** -0.0071***
(-4.95) (-5.40) (-5.03) (-5.01) (-5.01) (-5.03) (-5.03) (-4.96)
Private -0.0005 0.0012 -0.0011 -0.0010 -0.0011 -0.0011 -0.0011 -0.0004
(-0.36) (0.78) (-0.69) (-0.66) (-0.69) (-0.68) (-0.67) (-0.38)
Attitude -0.0141 -0.0128 -0.0183 -0.0184 -0.0182 -0.0181 -0.0180 -0.0132
(-1.39) (-1.00) (-1.44) (-1.44) (-1.43) (-1.42) (-1.41) (-1.44)
Relatedness 0.0004 0.0001 -0.0004 -0.0004 -0.0004 -0.0004 -0.0004 0.0005
(0.30) (0.07) (-0.28) (-0.26) (-0.25) (-0.27) (-0.27) (0.45)
Cross border 0.0016 0.0025 0.0021 0.0021 0.0021 0.0021 0.0021 0.0014
(1.13) (1.38) (1.16) (1.17) (1.19) (1.20) (1.21) (1.07)
Firm-specific variables
Relative size 0.0022*** -0.0005 0.0052*** 0.0052*** 0.0052*** 0.0052*** 0.0052*** 0.0015*
(2.64) (-0.50) (4.91) (4.92) (4.92) (4.92) (4.92) (1.94)
Leverage 0.0064 0.0114** 0.0095* 0.0095* 0.0098* 0.0097* 0.0097* 0.0055
(1.51) (2.12) (1.77) (1.78) (1.82) (1.81) (1.81) (1.44)
FCF -0.0080** -0.0086** -0.0126*** -0.0127*** -0.0127*** -0.0127*** -0.0127*** -0.0071**
(-2.53) (-2.16) (-3.18) (-3.21) (-3.20) (-3.20) (-3.21) (-2.49)
Constant 0.0125*** -0.0221*** 0.0239*** 0.0239*** 0.0241*** 0.0243*** 0.0243*** 0.0059**
(4.40) (-6.32) (6.86) (6.84) (6.90) (6.97) (6.97) (2.36)
R2-adjusted 33.12% 32.52% 30.19% 31.32% 34.29% 33.12% 32.09% 31.47%
Heterogeneity 1.197*** 1.242*** 1.319*** 1.317*** 1.316*** 1.316*** 1.318*** 1.163***
Firm Dummy YES YES YES YES YES YES YES YES
Year Dummy YES YES YES YES YES YES YES YES
F-statistic 5.38 8.95 7.35 7.32 7.08 6.97 6.94 4.85
Observations 12968 12968 12968 12968 12968 12968 12968 12968
No. of firms 6098 6098 6098 6098 6098 6098 6098 6098
Note: t-statistics are reported in parentheses. All t-statistics are based on robust, firm-clustered standard errors. *, **, *** represents significance at the 1%, 5% and 10% level.
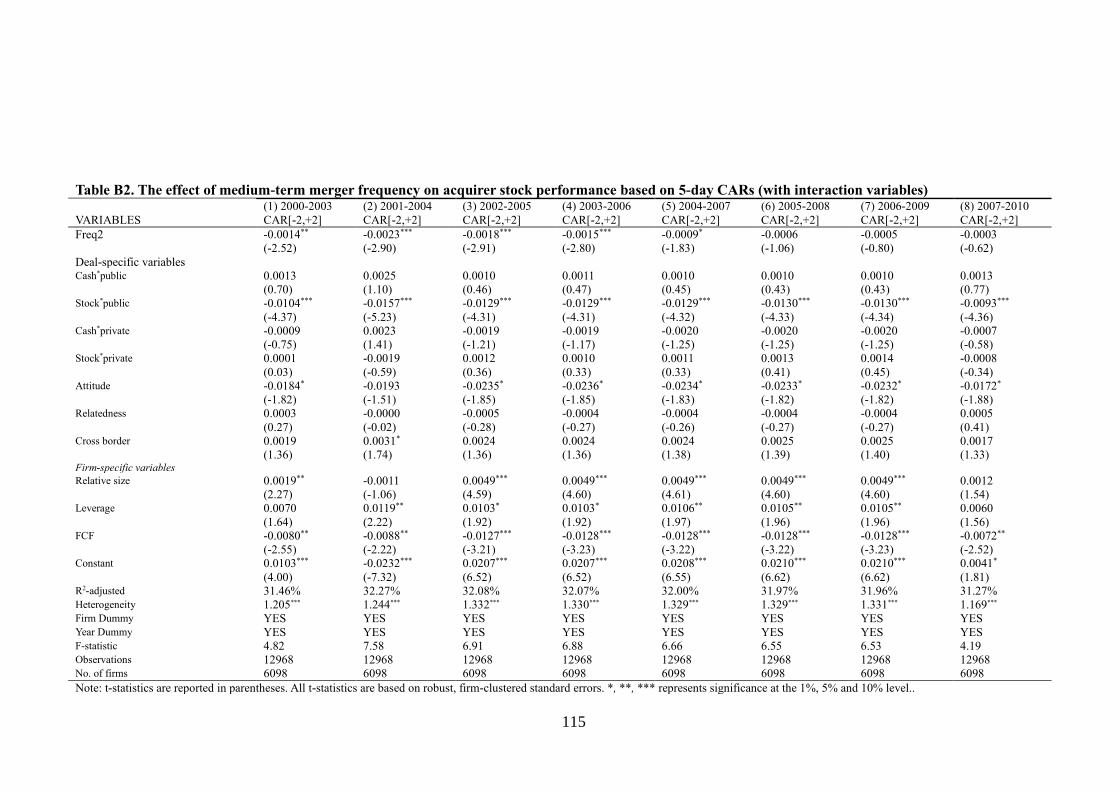
115
Table B2. The effect of medium-term merger frequency on acquirer stock performance based on 5-day CARs (with interaction variables)
(1) 2000-2003 (2) 2001-2004 (3) 2002-2005 (4) 2003-2006 (5) 2004-2007 (6) 2005-2008 (7) 2006-2009 (8) 2007-2010
VARIABLES CAR[-2,+2] CAR[-2,+2] CAR[-2,+2] CAR[-2,+2] CAR[-2,+2] CAR[-2,+2] CAR[-2,+2] CAR[-2,+2]
Freq2 -0.0014** -0.0023*** -0.0018*** -0.0015*** -0.0009* -0.0006 -0.0005 -0.0003
(-2.52) (-2.90) (-2.91) (-2.80) (-1.83) (-1.06) (-0.80) (-0.62)
Deal-specific variables
Cash*public 0.0013 0.0025 0.0010 0.0011 0.0010 0.0010 0.0010 0.0013
(0.70) (1.10) (0.46) (0.47) (0.45) (0.43) (0.43) (0.77) Stock*public -0.0104*** -0.0157*** -0.0129*** -0.0129*** -0.0129*** -0.0130*** -0.0130*** -0.0093***
(-4.37) (-5.23) (-4.31) (-4.31) (-4.32) (-4.33) (-4.34) (-4.36) Cash*private -0.0009 0.0023 -0.0019 -0.0019 -0.0020 -0.0020 -0.0020 -0.0007
(-0.75) (1.41) (-1.21) (-1.17) (-1.25) (-1.25) (-1.25) (-0.58) Stock*private 0.0001 -0.0019 0.0012 0.0010 0.0011 0.0013 0.0014 -0.0008
(0.03) (-0.59) (0.36) (0.33) (0.33) (0.41) (0.45) (-0.34) Attitude -0.0184* -0.0193 -0.0235* -0.0236* -0.0234* -0.0233* -0.0232* -0.0172*
(-1.82) (-1.51) (-1.85) (-1.85) (-1.83) (-1.82) (-1.82) (-1.88) Relatedness 0.0003 -0.0000 -0.0005 -0.0004 -0.0004 -0.0004 -0.0004 0.0005
(0.27) (-0.02) (-0.28) (-0.27) (-0.26) (-0.27) (-0.27) (0.41) Cross border 0.0019 0.0031* 0.0024 0.0024 0.0024 0.0025 0.0025 0.0017
(1.36) (1.74) (1.36) (1.36) (1.38) (1.39) (1.40) (1.33) Firm-specific variables
Relative size 0.0019** -0.0011 0.0049*** 0.0049*** 0.0049*** 0.0049*** 0.0049*** 0.0012
(2.27) (-1.06) (4.59) (4.60) (4.61) (4.60) (4.60) (1.54) Leverage 0.0070 0.0119** 0.0103* 0.0103* 0.0106** 0.0105** 0.0105** 0.0060
(1.64) (2.22) (1.92) (1.92) (1.97) (1.96) (1.96) (1.56) FCF -0.0080** -0.0088** -0.0127*** -0.0128*** -0.0128*** -0.0128*** -0.0128*** -0.0072**
(-2.55) (-2.22) (-3.21) (-3.23) (-3.22) (-3.22) (-3.23) (-2.52) Constant 0.0103*** -0.0232*** 0.0207*** 0.0207*** 0.0208*** 0.0210*** 0.0210*** 0.0041*
(4.00) (-7.32) (6.52) (6.52) (6.55) (6.62) (6.62) (1.81) R2-adjusted 31.46% 32.27% 32.08% 32.07% 32.00% 31.97% 31.96% 31.27% Heterogeneity 1.205*** 1.244*** 1.332*** 1.330*** 1.329*** 1.329*** 1.331*** 1.169*** Firm Dummy YES YES YES YES YES YES YES YES Year Dummy YES YES YES YES YES YES YES YES F-statistic 4.82 7.58 6.91 6.88 6.66 6.55 6.53 4.19 Observations 12968 12968 12968 12968 12968 12968 12968 12968 No. of firms 6098 6098 6098 6098 6098 6098 6098 6098
Note: t-statistics are reported in parentheses. All t-statistics are based on robust, firm-clustered standard errors. *, **, *** represents significance at the 1%, 5% and 10% level..
116
4. The effect of merger shocks on firm fundamentals: a
dynamic estimation
4.1. Introduction
Chapters 2 and 3 discussed how a greater merger frequency for an acquiring
firm results in lower stock returns for investors. However, the announcement returns
may tell us more about how the stock market or investors reassess the acquiring firm
than it does about the actual influence on the operation of bidder’s business (Grinblatt
and Titman, 2002). This raises a question: Is there any consistency between the market
reaction to an announcement of takeover and how the takeover affects an acquirer’s
fundamentals afterwards? This chapter seeks the answer to this question.
Existing research is limited because much of it focuses on the effects of
acquisitions on the shareholders of acquiring firms (e.g. Haleblian and Finkelstein, 1999;
Fuller et al., 2002; Billett and Qian, 2008). Other extensive empirical studies (e.g. Healy
et al., 1992; Clark and Ofek, 1994) attempted to explain the causes and effects of
takeovers on the fundamentals of acquiring firms. They often ignored a fact that a large
body of acquirers performs frequent acquisitions during a specific period, some of them
even within the same year. Consequently, scholars know much less about the effect of
the frequent acquisition activity on the operational performance of acquiring firm. Also,
the distinction of effects on operational performance between infrequent and frequent
acquisition has been under-examined in the existing empirical research.
117
This chapter responds to the limitations in the existing research from an
operational perspective in a specific research setting: the relation between merger
frequency or shock, and operational performance. It focuses on how the operational
performance changes as an acquirer makes a different frequency of acquisition in a
different time interval. If the acquiring firm can properly digest acquired assets and
absorb “nutrition” from those assets, then the profitability of the acquiring firm will be
improved, or at least, not damaged.
Generalized method of moments (GMM) estimator is applied to the dynamic
panel data in order to deal with endogeneity (Arellano and Bover, 1995, and Blundell
and Bond, 1998). By controlling for the firm time-invariant specific effects and general
market conditions, a large dataset which consists of 2,172 unique worldwide acquiring
firms undertaking 3,488 acquisitions during a 10-year period from 1st January 2000 to
31st December 2009, is analyzed. Among 2,172 acquirers, 887 carried out more than
one acquisition across the sample span. The study then includes accounting data from
2000 to 2012 to ensure the availability of accounting information about acquiring firms
for at least three years after acquisition.
Five main findings stand out from estimations. Firstly, the merger frequency is
significantly and negatively related to acquirer’s operational performance. Secondly, the
strength of the negative effect is reduced with time. Thirdly, single acquirers outperform
frequent acquirers. More specifically, the effect of merger frequency on a firm’s
fundamentals becomes positive in a long-term process: improving profitability of single
acquiring firms. However, for multi-acquirers, it appears that the performance effect of
merger frequency becomes weaker over time. Fourthly, the effect of a merger shock
generally lasts a couple of years after acquisition and therefore the effect of a merger
118
shock is not permanent. Fifthly, Jenson’s agent hypothesis, which predicts a negative
change that can last in the long run after the merger, is rejected.
The research design developed in this chapter enables four new contributions to
the literature. Firstly, this chapter is innovative because it systematically analyzes the
operational performance implications of the frequent acquisition by employing a large
global sample of acquiring companies. Secondly, this chapter introduces a new
argument that the number and time of merger shock matter simultaneously for the
performance effects of merger shocks or frequency. Thirdly, it contributes to the
literature by distinguishing effects between frequent acquirers and single acquirers – an
area neglected in the literature. Fourthly, it extends the existing digesting theory
(McCarthy, 1963) and the chewing theory (Kusewitt, 1985) into a dynamic context. It
argues that the effect of merger shocks or frequency changes with time.
As a result the existing process “Need to Chew” needs to be followed by a new
process “Chew to Change”. McCarthy suggests that the presence of the clash of cultures
and conflicts of objectives between the acquirer and the acquire leads to inefficiency in
digestion and absorption of the “nutrition”. Kusewitt refers to this indigestion issue as
“biting off more than you can chew”. Both of these arguments suggest that the negative
effect of merger frequency is attributable to the number of acquisitions. However, when
time is taken into account in the process of digestion, the longer process helps the firm
to gradually absorb the shocks of frequent acquisition, and then allows it to gain more
corporate synergies for business operation.
The rest of the paper is organized as follows. Section 4.2, discusses related
literature and develops hypotheses. Section 4.3 builds estimation model and lays out the
119
theoretical basis for the biases that may arise in commonly used techniques for
estimating the relation between merger strategy and performance. The data for empirical
applications is described in Section 4.4. Section 3.5 provides an empirical analysis of
the relation between merger frequency and firm performance. Section 3.6 discusses
robustness checks. Section 3.7concludes.
4.2. Literature review
4.2.1. Theoretical background
There is much discussion in economics and finance studies about the driver
behind the positive economic impact of takeovers on acquirer’s operating performance.
Generally it has concerned the creation of synergy. For example, the empirical results of
Bradley et al. (1983) suggest the positive effects of the synergy motive on the acquiring
firms’ operating performance. Based on positive findings drawn from M&A literature,
scholars developed synergy theory to explain the enhanced performance of acquirers
after acquisitions. In general, synergy exists when the newly consolidated firm runs
more efficiently and more effectively than two separate firms that are combined
(Lubatkin, 1983; Seth et al., 2000). If this was the case, then the entirely new integrated
firm would be more profitable than the sum of two individual entities (Gaughan, 2005).
The existing literature suggests that takeovers are able to improve the operating
performance of the acquiring firm through various sources of synergy. One major
source of acquisition synergy is cost saving (Berger and Ofeck, 1995; Gaughan, 2010)
which results from economies of scale and scope (Brealey et al., 2006). Economies of
scale arise for the acquiring firm if the quantity of production increases with reduction
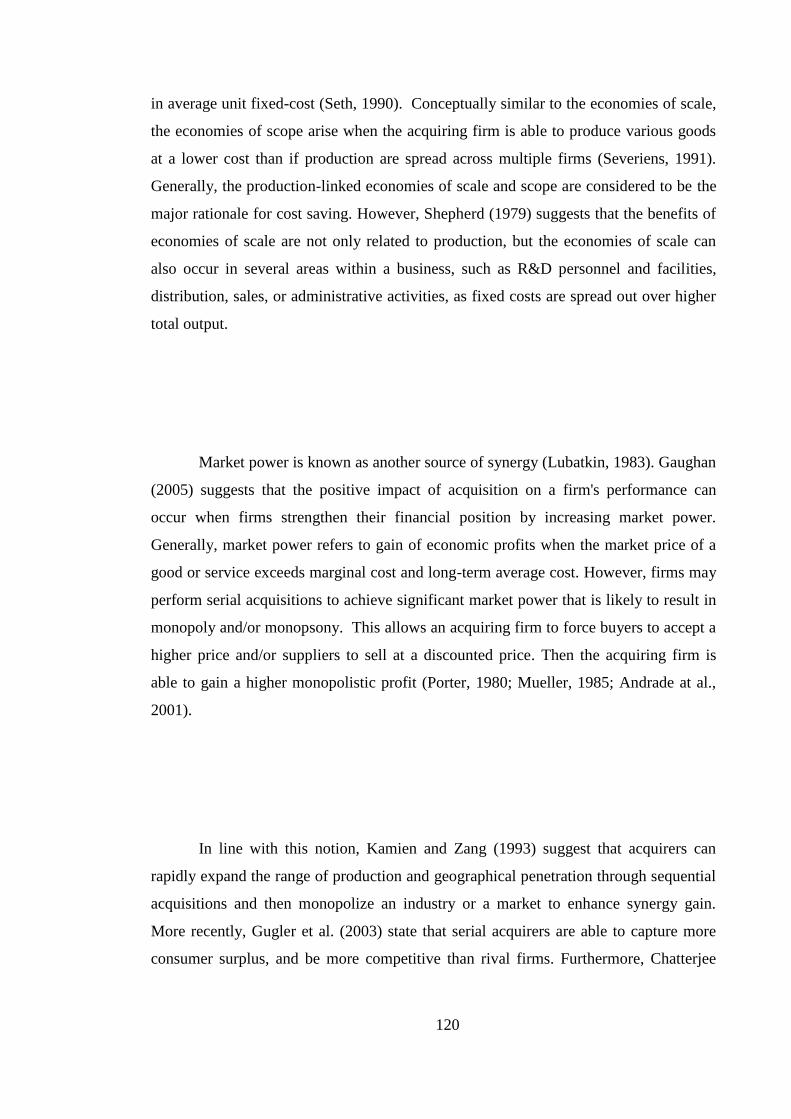
120
in average unit fixed-cost (Seth, 1990). Conceptually similar to the economies of scale,
the economies of scope arise when the acquiring firm is able to produce various goods
at a lower cost than if production are spread across multiple firms (Severiens, 1991).
Generally, the production-linked economies of scale and scope are considered to be the
major rationale for cost saving. However, Shepherd (1979) suggests that the benefits of
economies of scale are not only related to production, but the economies of scale can
also occur in several areas within a business, such as R&D personnel and facilities,
distribution, sales, or administrative activities, as fixed costs are spread out over higher
total output.
Market power is known as another source of synergy (Lubatkin, 1983). Gaughan
(2005) suggests that the positive impact of acquisition on a firm's performance can
occur when firms strengthen their financial position by increasing market power.
Generally, market power refers to gain of economic profits when the market price of a
good or service exceeds marginal cost and long-term average cost. However, firms may
perform serial acquisitions to achieve significant market power that is likely to result in
monopoly and/or monopsony. This allows an acquiring firm to force buyers to accept a
higher price and/or suppliers to sell at a discounted price. Then the acquiring firm is
able to gain a higher monopolistic profit (Porter, 1980; Mueller, 1985; Andrade at al.,
2001).
In line with this notion, Kamien and Zang (1993) suggest that acquirers can
rapidly expand the range of production and geographical penetration through sequential
acquisitions and then monopolize an industry or a market to enhance synergy gain.
More recently, Gugler et al. (2003) state that serial acquirers are able to capture more
consumer surplus, and be more competitive than rival firms. Furthermore, Chatterjee
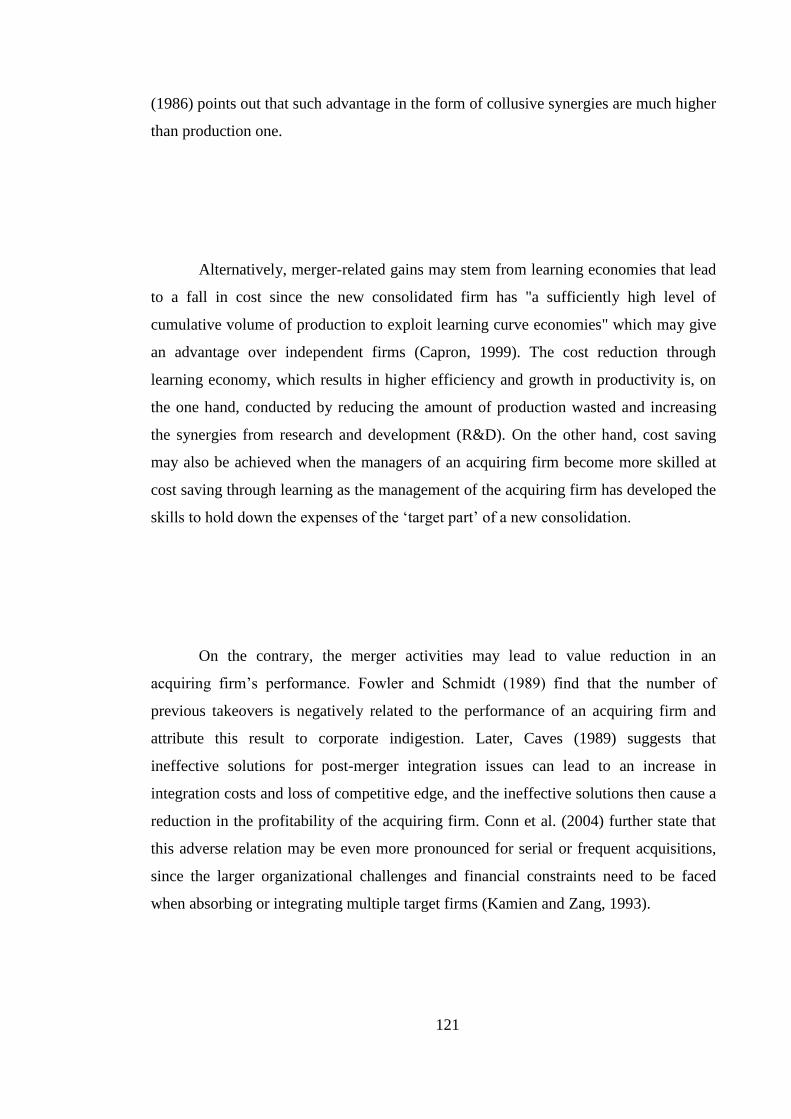
121
(1986) points out that such advantage in the form of collusive synergies are much higher
than production one.
Alternatively, merger-related gains may stem from learning economies that lead
to a fall in cost since the new consolidated firm has "a sufficiently high level of
cumulative volume of production to exploit learning curve economies" which may give
an advantage over independent firms (Capron, 1999). The cost reduction through
learning economy, which results in higher efficiency and growth in productivity is, on
the one hand, conducted by reducing the amount of production wasted and increasing
the synergies from research and development (R&D). On the other hand, cost saving
may also be achieved when the managers of an acquiring firm become more skilled at
cost saving through learning as the management of the acquiring firm has developed the
skills to hold down the expenses of the ‘target part’ of a new consolidation.
On the contrary, the merger activities may lead to value reduction in an
acquiring firm’s performance. Fowler and Schmidt (1989) find that the number of
previous takeovers is negatively related to the performance of an acquiring firm and
attribute this result to corporate indigestion. Later, Caves (1989) suggests that
ineffective solutions for post-merger integration issues can lead to an increase in
integration costs and loss of competitive edge, and the ineffective solutions then cause a
reduction in the profitability of the acquiring firm. Conn et al. (2004) further state that
this adverse relation may be even more pronounced for serial or frequent acquisitions,
since the larger organizational challenges and financial constraints need to be faced
when absorbing or integrating multiple target firms (Kamien and Zang, 1993).

122
Some of the existing literature considers integration deficiency, which is a major
concern for frequent acquisition makers, to be attributable to indigestion theory
(McCarthy, 1963; Terry, 1982; Shrivastava, 1986). The corporate indigestion theory
predicts that in a short time period, a substantial number of targets are unable to be
successfully integrated or digested by an acquiring firm and this ultimately brings a
negative impact on the acquiring firm’s operating performance.
Corporate indigestion may arise from three major sources. Firstly, the clash of
cultures between the acquiree and the acquirer will be stronger as the number of target
firms increases. Jemison and Sitkin (1986) suggest that culture is an integral part of the
merger process. Further, other authors state that a bigger culture gap would result in
lower commitment to the job for acquired employees (Sales & Mirvis, 1984; Buono et
al,. 1985), and greater diminishment of relative standing among the acquired executives
(Hambrick and Cannella, 1993; Lubatkin et al., 1998). This implies that the
effectiveness of the integration would be reduced when integrating a great number of
subordinate cultures.
Secondly, the contradiction of strategic objectives among different businesses
will be intensified when the acquiring firm absorbs and integrates multiple target firms.
It causes more difficulties in the decision-making for business operation, and finally
leads to a decrease in the acquirer’s operational performance. Some researchers argue
that the activities of strategic integration are more long-term in different aspects:
relationship building, joint development activities, and sharing of cost and capability
information (Narasimhan and Kim, 2002; Swink et al., 2007).
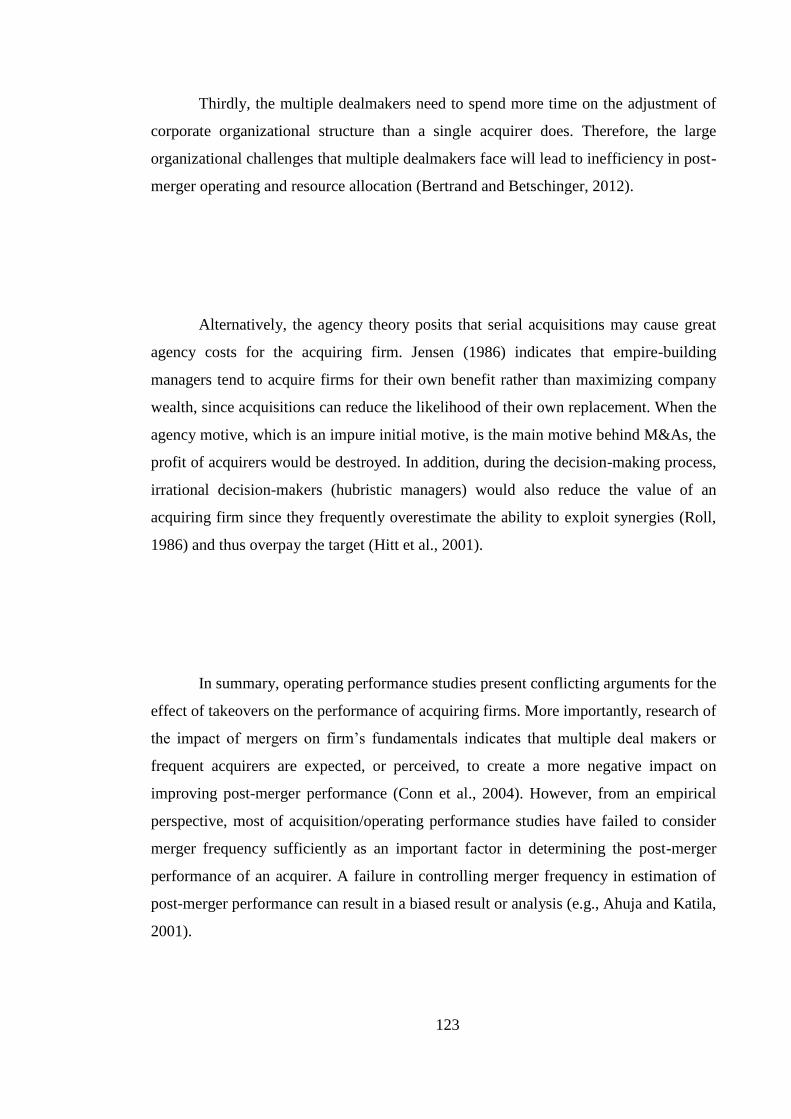
123
Thirdly, the multiple dealmakers need to spend more time on the adjustment of
corporate organizational structure than a single acquirer does. Therefore, the large
organizational challenges that multiple dealmakers face will lead to inefficiency in post-
merger operating and resource allocation (Bertrand and Betschinger, 2012).
Alternatively, the agency theory posits that serial acquisitions may cause great
agency costs for the acquiring firm. Jensen (1986) indicates that empire-building
managers tend to acquire firms for their own benefit rather than maximizing company
wealth, since acquisitions can reduce the likelihood of their own replacement. When the
agency motive, which is an impure initial motive, is the main motive behind M&As, the
profit of acquirers would be destroyed. In addition, during the decision-making process,
irrational decision-makers (hubristic managers) would also reduce the value of an
acquiring firm since they frequently overestimate the ability to exploit synergies (Roll,
1986) and thus overpay the target (Hitt et al., 2001).
In summary, operating performance studies present conflicting arguments for the
effect of takeovers on the performance of acquiring firms. More importantly, research of
the impact of mergers on firm’s fundamentals indicates that multiple deal makers or
frequent acquirers are expected, or perceived, to create a more negative impact on
improving post-merger performance (Conn et al., 2004). However, from an empirical
perspective, most of acquisition/operating performance studies have failed to consider
merger frequency sufficiently as an important factor in determining the post-merger
performance of an acquirer. A failure in controlling merger frequency in estimation of
post-merger performance can result in a biased result or analysis (e.g., Ahuja and Katila,
2001).
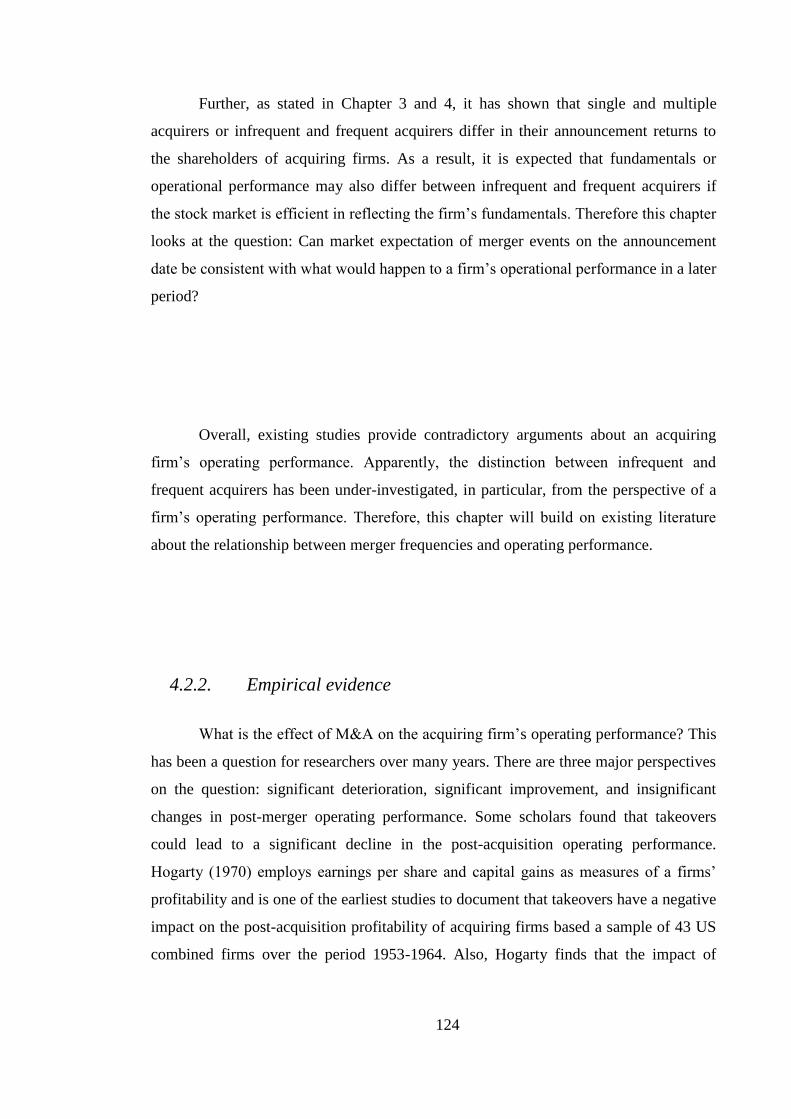
124
Further, as stated in Chapter 3 and 4, it has shown that single and multiple
acquirers or infrequent and frequent acquirers differ in their announcement returns to
the shareholders of acquiring firms. As a result, it is expected that fundamentals or
operational performance may also differ between infrequent and frequent acquirers if
the stock market is efficient in reflecting the firm’s fundamentals. Therefore this chapter
looks at the question: Can market expectation of merger events on the announcement
date be consistent with what would happen to a firm’s operational performance in a later
period?
Overall, existing studies provide contradictory arguments about an acquiring
firm’s operating performance. Apparently, the distinction between infrequent and
frequent acquirers has been under-investigated, in particular, from the perspective of a
firm’s operating performance. Therefore, this chapter will build on existing literature
about the relationship between merger frequencies and operating performance.
4.2.2. Empirical evidence
What is the effect of M&A on the acquiring firm’s operating performance? This
has been a question for researchers over many years. There are three major perspectives
on the question: significant deterioration, significant improvement, and insignificant
changes in post-merger operating performance. Some scholars found that takeovers
could lead to a significant decline in the post-acquisition operating performance.
Hogarty (1970) employs earnings per share and capital gains as measures of a firms’
profitability and is one of the earliest studies to document that takeovers have a negative
impact on the post-acquisition profitability of acquiring firms based a sample of 43 US
combined firms over the period 1953-1964. Also, Hogarty finds that the impact of

125
acquisitions on a firm’s profitability becomes neutral when the target firms are included
in the analysis.
Clark and Ofek (1994) examine the effect of acquisitions and mergers by
comparing three years pre and post-merger performance. They find that the operating
performance declines over following acquisitions during the period of 1981-1988 and
explain that the declining trend is mainly caused by industry factors. They also give
some other factors associated with poor post-merger performance: the overpayment of
bidders and high levels of post-merger leverage. Furthermore, Clark and Ofek (1994)
suggest that the acquiring firms of financially distressed targets are frequently in the
same industry. Similarly, Kruse et al. (2002) document significant reduction in the post-
acquisition operating performance of 46 combined firms, and Yeh and Hoshino (2002)
in 86 combined firms. However, due to the limitation created by a small sample size, the
finding cannot be generalized to the broader community.
By examining changes of return on assets (ROA) for a sample of 233 UK
takeovers over the period 1964-1972, Meeks (1977) finds that the post-merger
profitability of acquirers significantly deteriorates in the post-merger years. It is worth
noting that in their sample, about two-thirds of acquirers' performances are lower than
the industry average standard. Following Meek (1977), Dickerson et al. (1997) explore
merger effects based on a larger sample of 4430 UK acquisitions over the period 1948-
1977. Consistent with Meeks (1977), Dickerson et al. find significant deterioration in
the operating performance in the five years following the focal merger, whilst the
coefficient for acquisition growth is much lower than internal growth. This evidence
shows that takeovers have a "systematically detrimental" effect on a firm’s performance.
In addition, they report that the performance of non-acquiring firms significantly
outperform acquiring firms by 2.4% per annum.

126
In contrast, some researchers’ findings suggest significant improvement in post-
merger operating performance. Healy et al. published a study in 1992 which is
considered to be one of the most influential empirical studies in the literature of
operating performance. They examine the impact of takeovers on the operating
performance of 50 largest U.S. acquisitions over the period 1979-1984. The study states
that various sources can give rise to a 2.8% improvement in industry-adjusted cash flow
returns on all tangible assets (IACRTA). For instance, the higher productivity of assets,
and the lower cost of labour and operating margin are improved. They also disclose that
there is no evidence for the linkage between cash flow performance and payment
method, as well as a friendly or hostile deal atmosphere. Later, Healy et al. (1997) re-
investigate the same sample of takeovers and find a significantly positive relation
between takeovers and the asset productivity of acquiring firms. Healy et al. do not find
significant improvement in industry-adjusted cash-flow return on all assets.
Using the same performance measure (IACRTA) and industry median control as
in Healy et al. (1992), Ramaswamy and Waegelein (2003) investigate the relation
between acquisition and post-acquisition performance based on 162 Hong Kong
takeovers over the period 1975-1990. They find that mergers significantly improve the
operating performance of acquiring firms, which is broadly consistent with both the
expectation of efficient market theory and empirical evidence suggested by the findings
of Healy et al. (1992). Further, the sample is divided into those acquisitions which
occurred before and after 1982. This evidence shows that the improvement in operating
performance is significant prior to 1982, but insignificant afterwards.
Ramaswamy and Waegelein (2003) argue that the findings of Healy et al (1992)
are subject to the period selected. Another influential scholar in operating performance
127
research, Switzer (1996) also argues that the findings of Healy et al (1992) are not
sensitive to sample size and sample period. By examining 324 pairs of US target and
acquiring firms over the period 1967-1987, Switzer suggests that the median industry
adjusted operating performance improves over the five years following the merger,
which is mainly due to the expected synergies of takeovers.
To avoid the impact of country factors, Gugler et al. (2003) analyse the effects
of mergers by using a sample of 2,753 worldwide acquisitions over the period 1981-
1998. Their results demonstrate that acquirer's profits increase significantly after the
merger. However, it is found that sales significantly decline in the post-merger period.
One possible explanation is that the increasing market power suggests the ability to
raise the price of its products. Unlike the results for sales, they find that the increasing
market power could result in the improvement of acquirer's profit. Overall, they find
that the patterns of post-acquisitions are similar across countries. In addition, the study
does not consider the effects of industry changes before merger.
Unlike the studies above, other authors do not find any significant change in
post-merger operating performance. Ravenscraft & Scherer (1987) and Herman &
Lowenstein (1988) are considered to be the first two papers reporting non-significant
findings in early studies. However, the investigations of Ravenscraft & Scherer (1987)
have been criticized for a fault in the research design. The merger period of twenty-
seven years from 1950-1977, is not aligned with the investigation of performance
change in a single three year period from 1974 to 1977. This results in the comparison
of acquirers' performance focusing exclusively on the acquired firm’s lines of business
(Bruner, 2002). The empirical results found by Herman & Lowenstein (1988) have also
been questioned. Healy et al. (1992) argue that a large portion of post-merger data is
missing for acquisitions after 1979 (the sample period is 1975-1983) and the authors fail

128
to control the differences in industry shocks. Therefore, the limitations of these studies
make their findings hard to interpret.
To address the limitations of existing studies, following Healy et al. (1992),
Ghosh (2001) examines 315 worldwide acquisitions completed over the period 1981-
1995. By comparing the realized performance following a takeover with benchmark
performance of a sample of non-merging companies, Ghosh finds no evidence that a
firm’s operating performances are improved in following acquisitions. Using a sample
of 36 Australian acquisitions over the period between 1986 and 1991, Sharma and Ho
(2002) compare various accounting measures of acquirer's operating performance and
do not to find consistent results: cash flow and profit margin show non-significant
changes between pre- and post-acquisitions, yet return on assets and return on equity
show a significant decline with following acquisitions.
Furthermore, scholars document that the firm and its deal characteristics have an
important impact upon determination of merger outcomes (Capron, 1999; Ishii and
Xuan, 2011; Bertrand and Betschinger, 2013). Switzer and Linn (2000) examine a
sample of 413 takeovers over the period 1967-1987, and develop explanations for "why
cash offers are sometimes selected over stock offers" instead of testing "why cash offers
outperform stock offers" (Switzer, 2000, Pg 1134). The results suggest that the cash
offers are significantly associated with the positive improvements in operating
performance, while there are no significant changes for stock offers. Further, they find
that changes made in the operating performance of target firms are significantly larger
when the acquirer offers cash payment instead of stock offers.
129
Similarly, Ghosh (2001) finds that the operating cash flow significantly increases
after the cash is made for paying acquisitions, but decreases after the stocks are used as
payment. Sharma and Ho (2002) state that industry relatedness and size of firms are
insignificantly related to acquirer’s operating performance, and significantly related to
the declining operating performance of target firms. Ramaswamy and Waegelein (2003)
document that a smaller acquirer outperforms a bigger acquirer. Further, they report that
payment method is not associated with changes in post-merger performance, and
diversified takeovers exhibit more positive operating performance than industry-related
acquisitions. In contrast, Powell and Stark (2005) report non-significant results in
industry relatedness.
Disparities in the operating performance of acquirers may also show up via
cross-border and domestic acquisitions. Some existing empirical studies, for example
Markides and Ittner (1994) document that acquirers derive more benefits from acquiring
domestic targets than foreign ones, but others find the opposite results, for example
Morck and Yeung (1992). Other studies of firm and deal characteristics also show
mixed results about their effects on the operating performance of acquirers, for instance,
Moeller et al., 2004 about size, Linn and Switzer (2001) about leverage, Martynova et al,
2006) about industry relatedness, and Burkart and Panunzi (2006) about deal
atmosphere.
4.3. Model specification
This section first demonstrates a theoretical basis relating to the specific effect of
endogeneity which may arise from the estimation of the dynamic relation between
merger frequency and firm performance when using OLS or fixed-effects estimator and
130
illustrate the need of appropriate econometric procedures. Then the system generalized
method of moments (GMM) for a dynamic panel analysis which makes those biases less
severe, is discussed.
4.3.1. A dynamic panel model for firm operating performance
Theoretical argument made by Shaver (1998) and Bertrand and Betschinger
(2013) models show that an acquisition strategy is a choice variable that arises from a
process that firms systematically make a strategic choice of acquiring or not acquiring,
where this choosing process is affected by past performance and their expectation on
outcomes of the acquisitions. This means that if a firm strategically decides to undertake
frequent acquisitions today, then the subsequently unanticipated shocks on future
performance will be related to the historical realization of merger frequency or
performance.
Therefore, in the examination of frequent acquisition effects on operating
performance of an acquiring firm, an important factor has to be taken into account: an
acquisition strategy. As similar as many aspects of a firm's corporate strategies, for
instance the board size, the acquisition strategy is dynamically endogenous to firm’s
performance. A choice of a merger strategy depends on expectation of performance
improvement brought by the intended mergers. Once the merger and merger strategy is
successfully implemented, then this drives up performance. The interaction of merger
strategy and performance implies that the strategy of mergers and performance are inter-
related endogenously and dynamically.
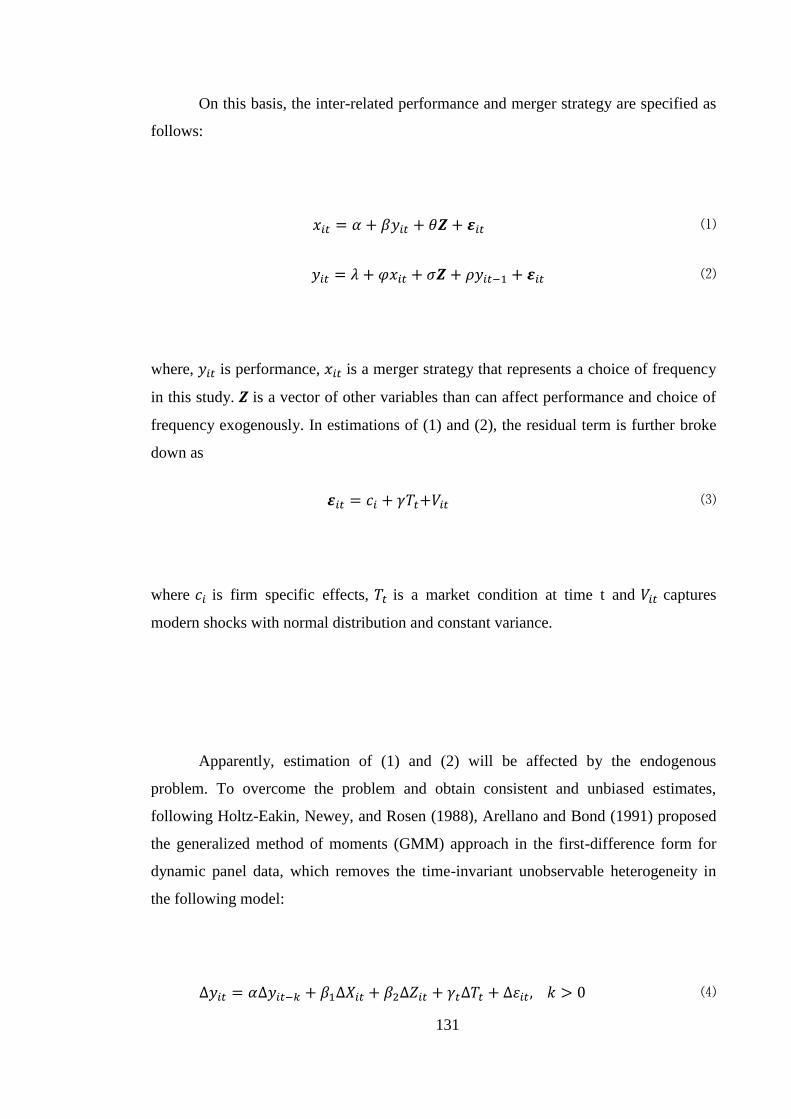
131
On this basis, the inter-related performance and merger strategy are specified as
follows:
𝑥𝑖𝑡 = 𝛼 + 𝛽𝑦𝑖𝑡 + 𝜃𝒁 + 𝜺𝑖𝑡 ⑴
𝑦𝑖𝑡 = 𝜆 + 𝜑𝑥𝑖𝑡 + 𝜎𝒁 + 𝜌𝑦𝑖𝑡−1 + 𝜺𝑖𝑡 ⑵
where, 𝑦𝑖𝑡 is performance, 𝑥𝑖𝑡 is a merger strategy that represents a choice of frequency
in this study. 𝒁 is a vector of other variables than can affect performance and choice of
frequency exogenously. In estimations of (1) and (2), the residual term is further broke
down as
𝜺𝑖𝑡 = 𝑐𝑖 + 𝛾𝑇𝑡+𝑉𝑖𝑡 ⑶
where 𝑐𝑖 is firm specific effects, 𝑇𝑡 is a market condition at time t and 𝑉𝑖𝑡 captures
modern shocks with normal distribution and constant variance.
Apparently, estimation of (1) and (2) will be affected by the endogenous
problem. To overcome the problem and obtain consistent and unbiased estimates,
following Holtz-Eakin, Newey, and Rosen (1988), Arellano and Bond (1991) proposed
the generalized method of moments (GMM) approach in the first-difference form for
dynamic panel data, which removes the time-invariant unobservable heterogeneity in
the following model:
∆𝑦𝑖𝑡 = 𝛼∆𝑦𝑖𝑡−𝑘 + 𝛽1∆𝑋𝑖𝑡 + 𝛽2∆𝑍𝑖𝑡 + 𝛾𝑡∆𝑇𝑡 + ∆𝜀𝑖𝑡, 𝑘 > 0 ⑷
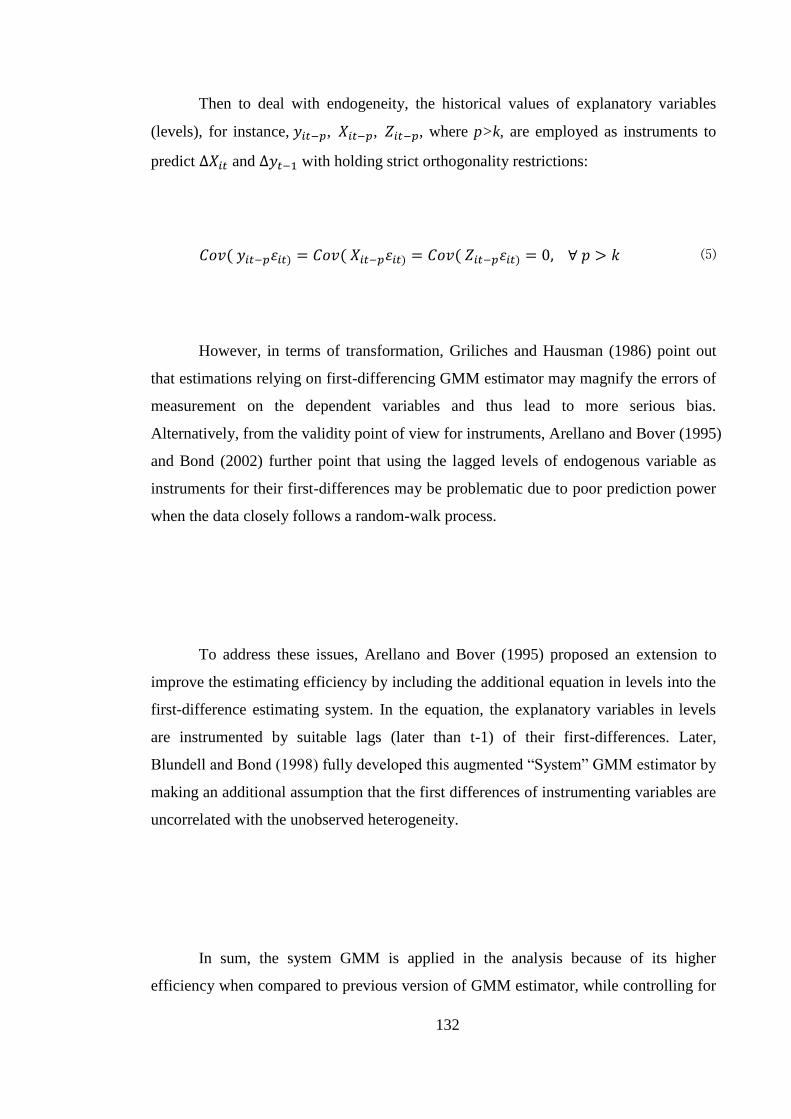
132
Then to deal with endogeneity, the historical values of explanatory variables
(levels), for instance, 𝑦𝑖𝑡−𝑝, 𝑋𝑖𝑡−𝑝, 𝑍𝑖𝑡−𝑝, where p>k, are employed as instruments to
predict ∆𝑋𝑖𝑡 and ∆𝑦𝑡−1 with holding strict orthogonality restrictions:
𝐶𝑜𝑣( 𝑦𝑖𝑡−𝑝𝜀𝑖𝑡) = 𝐶𝑜𝑣( 𝑋𝑖𝑡−𝑝𝜀𝑖𝑡) = 𝐶𝑜𝑣( 𝑍𝑖𝑡−𝑝𝜀𝑖𝑡) = 0, ∀ 𝑝 > 𝑘 ⑸
However, in terms of transformation, Griliches and Hausman (1986) point out
that estimations relying on first-differencing GMM estimator may magnify the errors of
measurement on the dependent variables and thus lead to more serious bias.
Alternatively, from the validity point of view for instruments, Arellano and Bover (1995)
and Bond (2002) further point that using the lagged levels of endogenous variable as
instruments for their first-differences may be problematic due to poor prediction power
when the data closely follows a random-walk process.
To address these issues, Arellano and Bover (1995) proposed an extension to
improve the estimating efficiency by including the additional equation in levels into the
first-difference estimating system. In the equation, the explanatory variables in levels
are instrumented by suitable lags (later than t-1) of their first-differences. Later,
Blundell and Bond (1998) fully developed this augmented “System” GMM estimator by
making an additional assumption that the first differences of instrumenting variables are
uncorrelated with the unobserved heterogeneity.
In sum, the system GMM is applied in the analysis because of its higher
efficiency when compared to previous version of GMM estimator, while controlling for

133
endogeneity arising from time-invariant unobservable heterogeneity, simultaneity and
correlation between current values of the explanatory variables and the past realization
of the dependent variable. As suggested in Roodman (2009), all possible lags later than
t-2 of endogenous variable can be used as instruments for the estimation of model (2)
where the highest lag of dependent variable is t-1.
Further, the key exogeneity assumption for approach in this study is that the
firm's past performance and characteristics are exogenous to current shocks in
performance. Two different tests are carred out for validity of instruments and the key
assumption required. First, Arellano and Bond (1991) tests are applied to identify first -
(AR (1)) and second-order (AR (2)) serial correlation of residuals. For GMM estimates,
the valid instruments should theoretically be incorporated to the first-order
autocorrelation and the absence of the second-order autocorrelation in the first-
differenced idiosyncratic residuals. Second, the Hansen-J statistic is calculated which is
distributed 𝜒2, for the validity of over-identifying restrictions for each regression under
the null hypothesis of the validity of instruments. Failure to reject the null hypothesis
suggests the invalidity of the instruments. With a two-step estimation of system GMM,
the Windmeijer (2005) correction is applied to correct for downward bias of standard
errors. Overall, application tests listed above, exhibit that the system-GMM method is
an appropriate approach in estimating the effect of frequency as a merger strategy on
post-merger performance in a dynamic context.
4.4. Variable construction, data source and sample
In this section, variables employed in the estimation of model (2) are discussed.
Apart from the concerning variable of merger frequency, this study classifies other
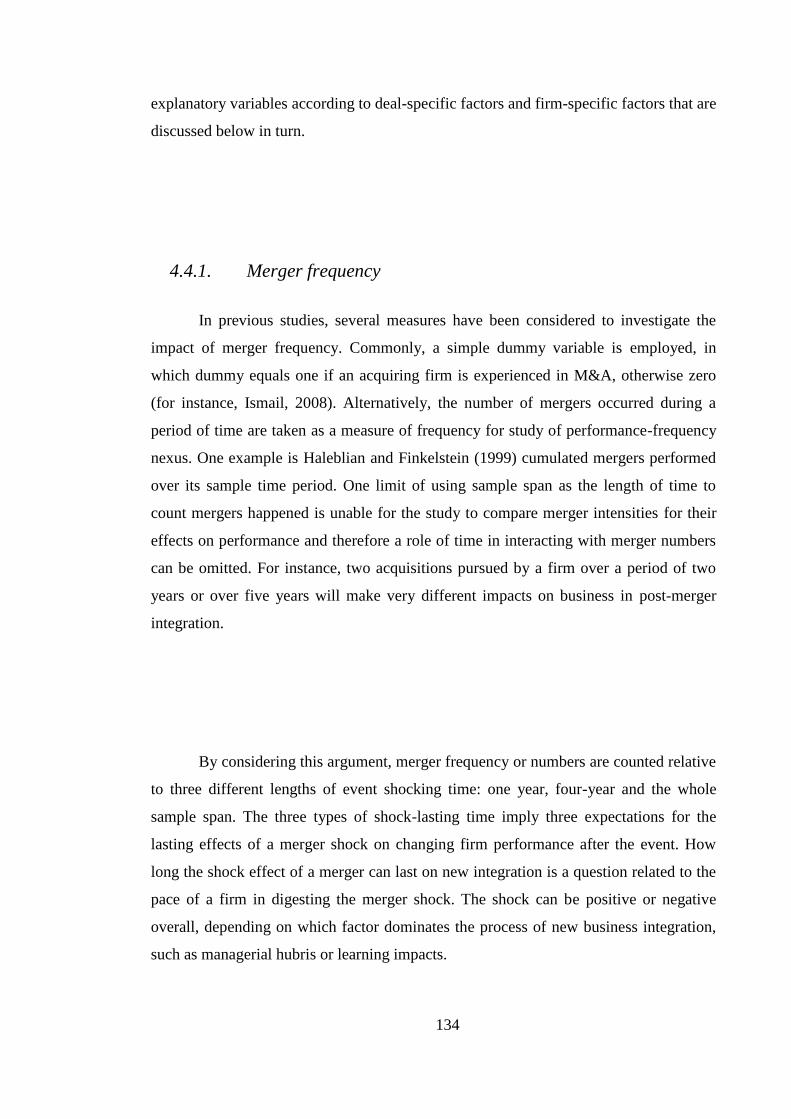
134
explanatory variables according to deal-specific factors and firm-specific factors that are
discussed below in turn.
4.4.1. Merger frequency
In previous studies, several measures have been considered to investigate the
impact of merger frequency. Commonly, a simple dummy variable is employed, in
which dummy equals one if an acquiring firm is experienced in M&A, otherwise zero
(for instance, Ismail, 2008). Alternatively, the number of mergers occurred during a
period of time are taken as a measure of frequency for study of performance-frequency
nexus. One example is Haleblian and Finkelstein (1999) cumulated mergers performed
over its sample time period. One limit of using sample span as the length of time to
count mergers happened is unable for the study to compare merger intensities for their
effects on performance and therefore a role of time in interacting with merger numbers
can be omitted. For instance, two acquisitions pursued by a firm over a period of two
years or over five years will make very different impacts on business in post-merger
integration.
By considering this argument, merger frequency or numbers are counted relative
to three different lengths of event shocking time: one year, four-year and the whole
sample span. The three types of shock-lasting time imply three expectations for the
lasting effects of a merger shock on changing firm performance after the event. How
long the shock effect of a merger can last on new integration is a question related to the
pace of a firm in digesting the merger shock. The shock can be positive or negative
overall, depending on which factor dominates the process of new business integration,
such as managerial hubris or learning impacts.
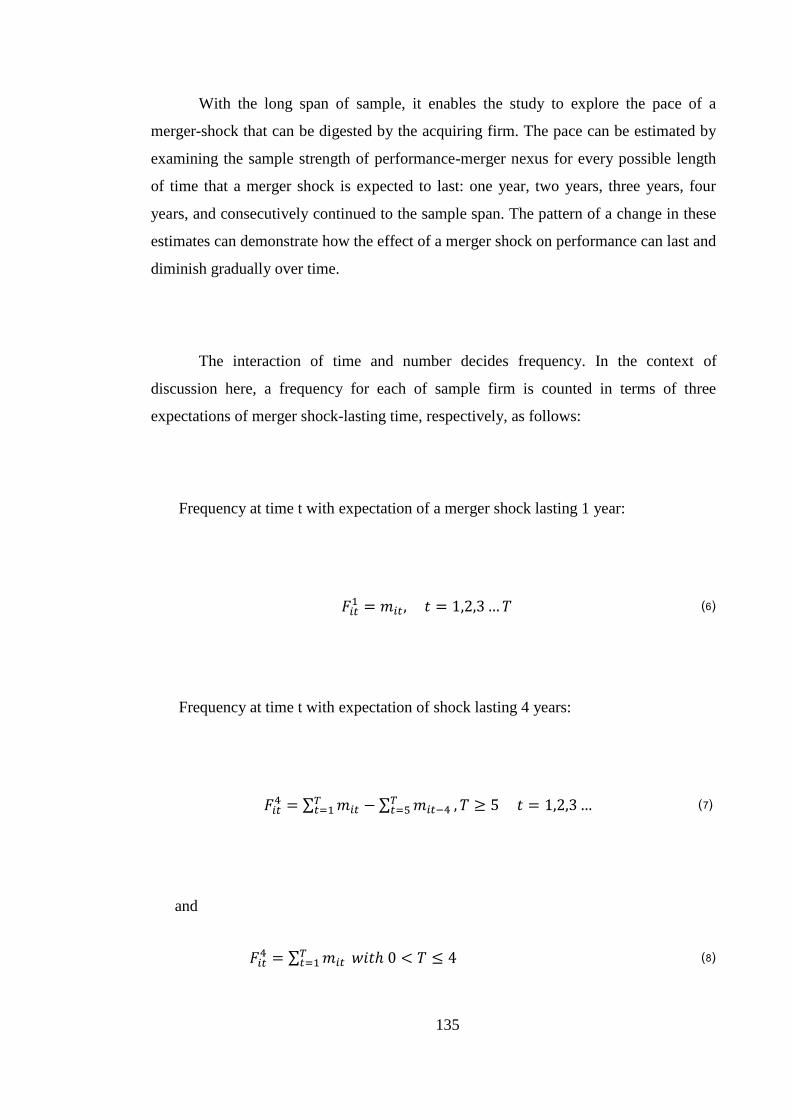
135
With the long span of sample, it enables the study to explore the pace of a
merger-shock that can be digested by the acquiring firm. The pace can be estimated by
examining the sample strength of performance-merger nexus for every possible length
of time that a merger shock is expected to last: one year, two years, three years, four
years, and consecutively continued to the sample span. The pattern of a change in these
estimates can demonstrate how the effect of a merger shock on performance can last and
diminish gradually over time.
The interaction of time and number decides frequency. In the context of
discussion here, a frequency for each of sample firm is counted in terms of three
expectations of merger shock-lasting time, respectively, as follows:
Frequency at time t with expectation of a merger shock lasting 1 year:
𝐹𝑖𝑡1 = 𝑚𝑖𝑡, 𝑡 = 1,2,3 … 𝑇 ⑹
Frequency at time t with expectation of shock lasting 4 years:
𝐹𝑖𝑡4 = ∑ 𝑚𝑖𝑡 − ∑ 𝑚𝑖𝑡−4
𝑇𝑡=5
𝑇𝑡=1 , 𝑇 ≥ 5 𝑡 = 1,2,3 … ⑺
and
𝐹𝑖𝑡4 = ∑ 𝑚𝑖𝑡
𝑇𝑡=1 𝑤𝑖𝑡ℎ 0 < 𝑇 ≤ 4 ⑻

136
Frequency at time t with expectation of a merger shock lasting 10 years:
𝐹𝑖𝑡10 = ∑ 𝑚𝑖𝑡
10𝑡=1 ⑼
where, 𝐹𝑖𝑡𝑁 is a merger frequency of firm i at time t with expectation that a merger shock
can last N years on the firm’s integration after the merger event. 𝑚𝑖𝑡 is a number of
mergers completed by the firm i at time t with a range of value from 0 without any
merger activity to an indefinite number. Application of (6), (8) and (9) to compute 𝐹𝑖𝑡1 ,
𝐹𝑖𝑡4 and 𝐹𝑖𝑡
10 respectively can be illustrated in Table 4-1 below.
Table 4-1. Illustration of computing merger frequency under different shock-lasting time
Year 2000 2001 2002 2003 2004 2005 2006 2007 2008 2009
Number of mergers : . : .
𝐹𝑖𝑡1(shock lasts a year) 2 0 1 0 2 0 0 1 0 0
𝐹𝑖𝑡4(shock lasts 4 years) 2 2 3 3 3 3 2 3 1 1
𝐹𝑖𝑡10(shock lasts 10 years) 2 2 3 3 5 5 5 6 6 6
Note: One dot presents one acquisition completed during one year.
Table 4-1 shows the frequency of merger shocks at each year for firm i. If the
shock lasts longer, for instance 10 years, then the frequency of merger shocks is
accumulatively higher and higher over time. In contrast, if the shock lasts only a year,
then the frequency of merger shocks is lower and has no accumulative effects.
Frequencies with any shock time longer than a year, but shorter than the sample span
are dynamically defined. The different measures of frequency according to the time a
merger shock lasts, enable the study to compare frequency impacts on firm performance
and so find out a frequency at which its shock can last longest.

137
4.4.2. Dependent variable
For performance, Return on Assets (ROA) is used as a measure of a firm’s
performance because this measure has been widely applied for the study of merger and
firm fundamentals in many studies, such as Healy et al. (1992), Ramaswamy (1997) and
Porrini (2004). As argued by Hitt et al., (1998), ROA is one of the powerful accounting
metrics that can best reflect the effect of synergies obtained from an acquisition. The
ROA indicates how efficient the management of an acquiring firm is at using the firm’s
available assets to generate earnings. To calculate ROA, operating income before
depreciation and amortization rather than the earnings before interest and taxes (EBIT)
is used. One reason is that by excluding depreciation and amortization it could be
problematic for comparison across firms since it is hard to assume that all sample firms
face the similar accounting standards, policies and business situations.
For the deflator, the book value of total assets is used. Market value is not used
for the reason that the market value of an acquiring firm declines systematically over
three to five years after acquisition, which may lead to upward bias (Agrawal et al.,
1992). Alternatively, the market values are a forward-looking measure relying on the
assumption of efficient markets that the market can correctly react to the benefits
brought by acquisitions. This suggests that investor or the market is likely to
overestimate the expected returns of takeovers (Jensen and Ruback, 1983; Barber and
Lyon, 1996).
4.4.3. Control variables
Five controlling variables are considered for the estimation of model (2) and
robustness check. These five variables are assumed exogenously and therefore
employed as “investment” in estimation. Firstly, “LogSIZE”, represents the size of
acquiring firm, measured as the nature logarithm of firm’s book value of total assets,
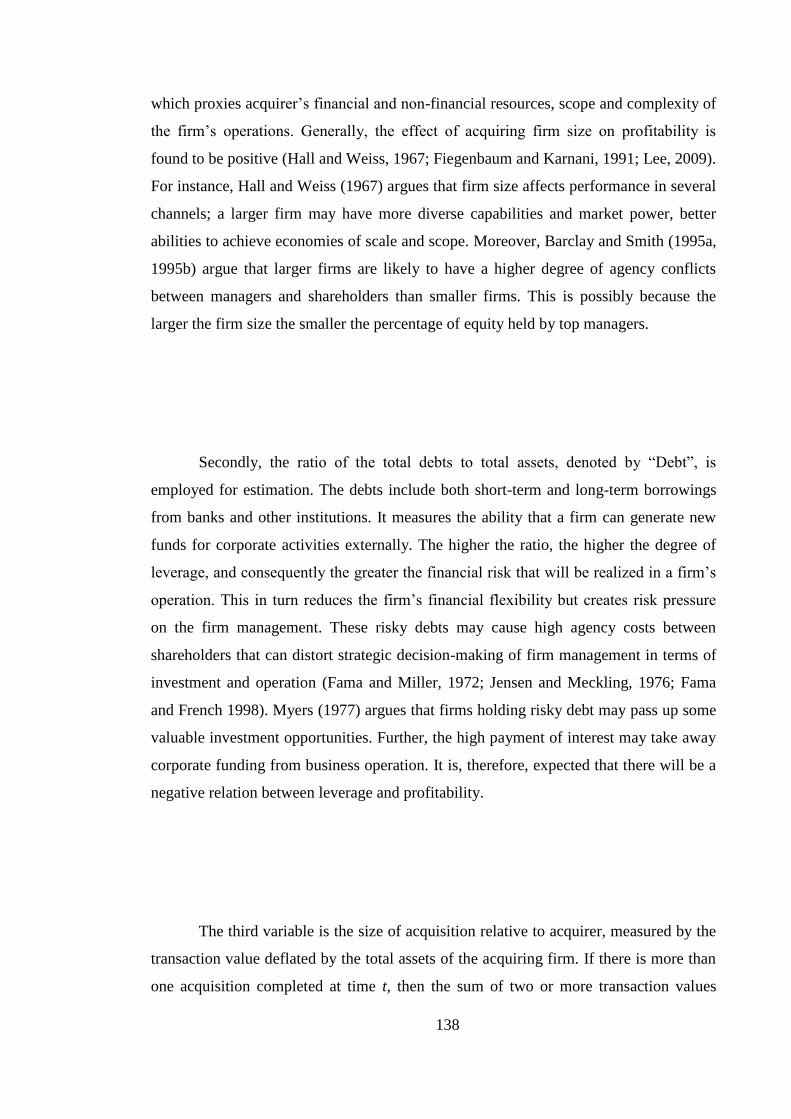
138
which proxies acquirer’s financial and non-financial resources, scope and complexity of
the firm’s operations. Generally, the effect of acquiring firm size on profitability is
found to be positive (Hall and Weiss, 1967; Fiegenbaum and Karnani, 1991; Lee, 2009).
For instance, Hall and Weiss (1967) argues that firm size affects performance in several
channels; a larger firm may have more diverse capabilities and market power, better
abilities to achieve economies of scale and scope. Moreover, Barclay and Smith (1995a,
1995b) argue that larger firms are likely to have a higher degree of agency conflicts
between managers and shareholders than smaller firms. This is possibly because the
larger the firm size the smaller the percentage of equity held by top managers.
Secondly, the ratio of the total debts to total assets, denoted by “Debt”, is
employed for estimation. The debts include both short-term and long-term borrowings
from banks and other institutions. It measures the ability that a firm can generate new
funds for corporate activities externally. The higher the ratio, the higher the degree of
leverage, and consequently the greater the financial risk that will be realized in a firm’s
operation. This in turn reduces the firm’s financial flexibility but creates risk pressure
on the firm management. These risky debts may cause high agency costs between
shareholders that can distort strategic decision-making of firm management in terms of
investment and operation (Fama and Miller, 1972; Jensen and Meckling, 1976; Fama
and French 1998). Myers (1977) argues that firms holding risky debt may pass up some
valuable investment opportunities. Further, the high payment of interest may take away
corporate funding from business operation. It is, therefore, expected that there will be a
negative relation between leverage and profitability.
The third variable is the size of acquisition relative to acquirer, measured by the
transaction value deflated by the total assets of the acquiring firm. If there is more than
one acquisition completed at time t, then the sum of two or more transaction values
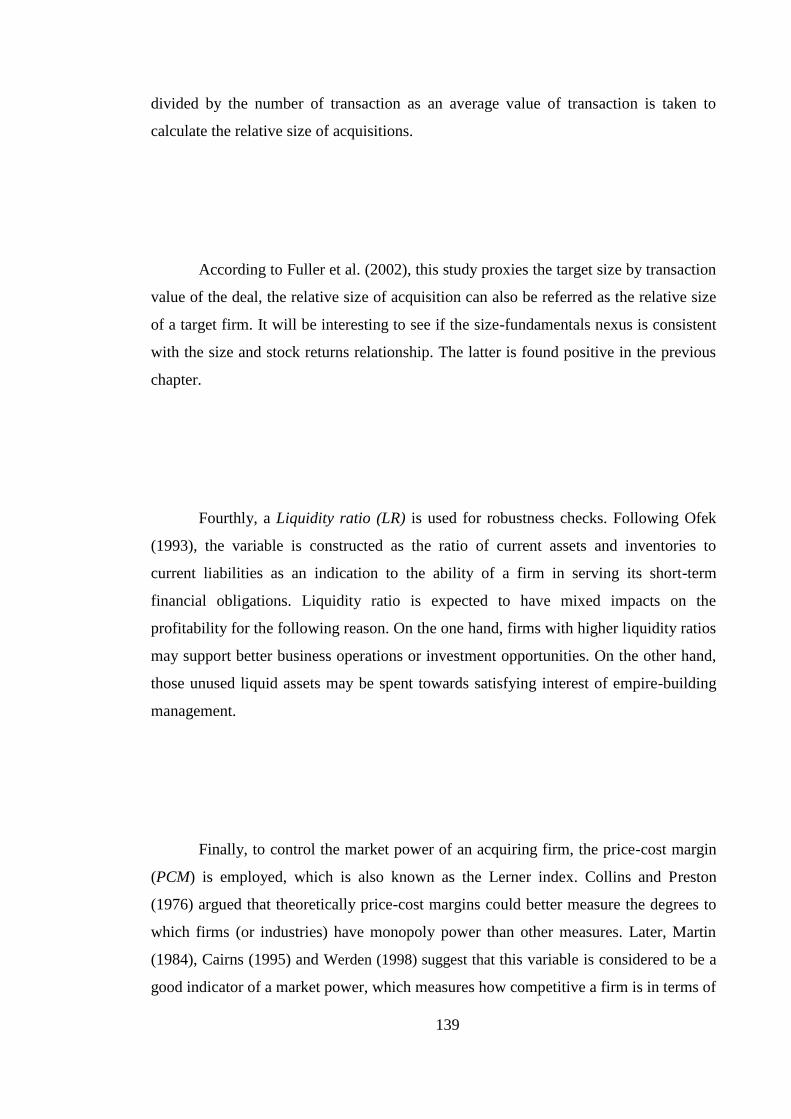
139
divided by the number of transaction as an average value of transaction is taken to
calculate the relative size of acquisitions.
According to Fuller et al. (2002), this study proxies the target size by transaction
value of the deal, the relative size of acquisition can also be referred as the relative size
of a target firm. It will be interesting to see if the size-fundamentals nexus is consistent
with the size and stock returns relationship. The latter is found positive in the previous
chapter.
Fourthly, a Liquidity ratio (LR) is used for robustness checks. Following Ofek
(1993), the variable is constructed as the ratio of current assets and inventories to
current liabilities as an indication to the ability of a firm in serving its short-term
financial obligations. Liquidity ratio is expected to have mixed impacts on the
profitability for the following reason. On the one hand, firms with higher liquidity ratios
may support better business operations or investment opportunities. On the other hand,
those unused liquid assets may be spent towards satisfying interest of empire-building
management.
Finally, to control the market power of an acquiring firm, the price-cost margin
(PCM) is employed, which is also known as the Lerner index. Collins and Preston
(1976) argued that theoretically price-cost margins could better measure the degrees to
which firms (or industries) have monopoly power than other measures. Later, Martin
(1984), Cairns (1995) and Werden (1998) suggest that this variable is considered to be a
good indicator of a market power, which measures how competitive a firm is in terms of
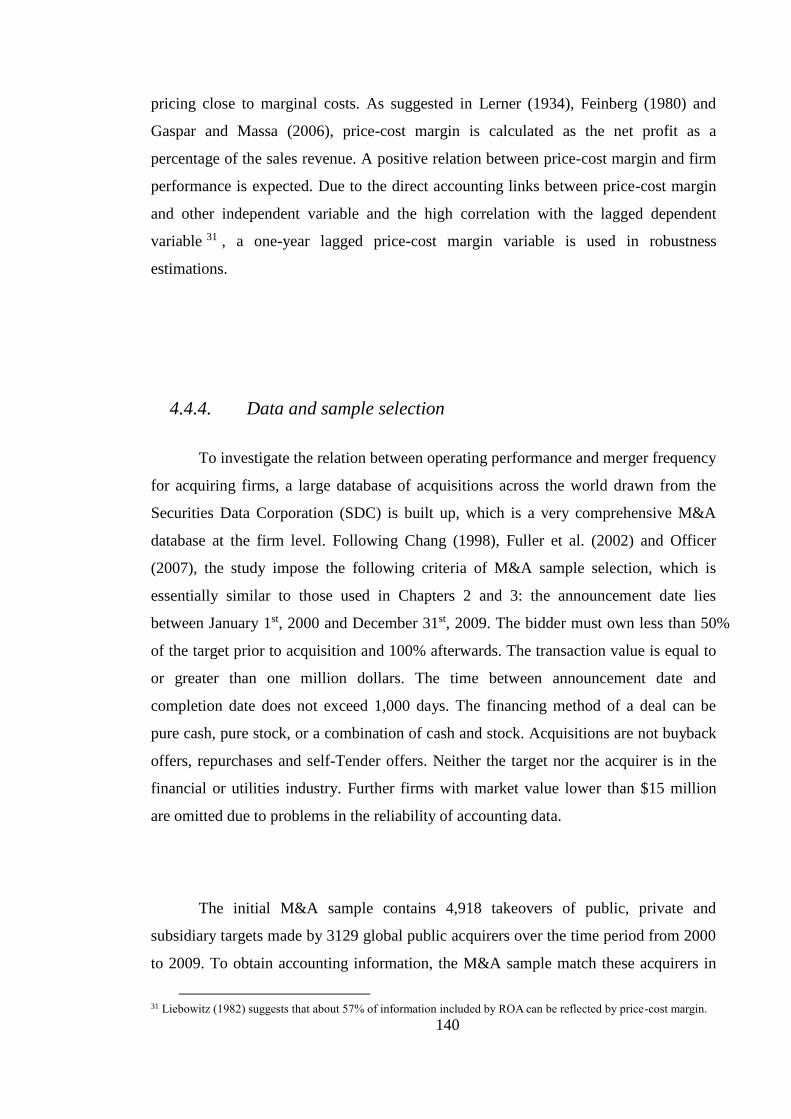
140
pricing close to marginal costs. As suggested in Lerner (1934), Feinberg (1980) and
Gaspar and Massa (2006), price-cost margin is calculated as the net profit as a
percentage of the sales revenue. A positive relation between price-cost margin and firm
performance is expected. Due to the direct accounting links between price-cost margin
and other independent variable and the high correlation with the lagged dependent
variable 31 , a one-year lagged price-cost margin variable is used in robustness
estimations.
4.4.4. Data and sample selection
To investigate the relation between operating performance and merger frequency
for acquiring firms, a large database of acquisitions across the world drawn from the
Securities Data Corporation (SDC) is built up, which is a very comprehensive M&A
database at the firm level. Following Chang (1998), Fuller et al. (2002) and Officer
(2007), the study impose the following criteria of M&A sample selection, which is
essentially similar to those used in Chapters 2 and 3: the announcement date lies
between January 1st, 2000 and December 31st, 2009. The bidder must own less than 50%
of the target prior to acquisition and 100% afterwards. The transaction value is equal to
or greater than one million dollars. The time between announcement date and
completion date does not exceed 1,000 days. The financing method of a deal can be
pure cash, pure stock, or a combination of cash and stock. Acquisitions are not buyback
offers, repurchases and self-Tender offers. Neither the target nor the acquirer is in the
financial or utilities industry. Further firms with market value lower than $15 million
are omitted due to problems in the reliability of accounting data.
The initial M&A sample contains 4,918 takeovers of public, private and
subsidiary targets made by 3129 global public acquirers over the time period from 2000
to 2009. To obtain accounting information, the M&A sample match these acquirers in
31 Liebowitz (1982) suggests that about 57% of information included by ROA can be reflected by price-cost margin.

141
the Thomson financials and Worldscope database. Due to some firms exited from
business or being acquired32 , the sample acquirers are reduced by 1,430. This leaves
3,488 acquisitions undertaken by 2,172 acquirers which constitute the main sample used
in this chapter. Following Hitt et al. (1992) and Ghosh (2001), accounting data from
2000 to 2012 are included into present sample to ensure accounting information to be
available for acquiring firms at least three-year after acquisitions. Table 4-2 reports the
summary distribution for the acquiring firms across countries. For each of the following
country, a particular bidder is represented only once per year, but may be represented
multiple times over a 10-year period.
Table 4-3 presents the cross-sectional summary statistics of the acquiring firms
engaged in the takeover for frequency, operating performance and other controlling
variables in Panel A, B and C, respectively. It is found that for most of years, the 4-year
merger frequencies (𝐹𝑖𝑡4) have a mean around 0.6, and reaches a maximum of 0.74 in
2008. This could be possibly explained as acquirers could easily borrow at low interest
rate due to over liquidity of the financial market between 2005 and 2007. By comparing
the merger frequency between single and multiple acquirers, wider variations are
observed. The multiple acquirers perform 1.3 to 3 merger frequency higher than those
of single acquirers in terms of either 4-year or the sample span measure.
Table 4-4 shows a correlation matrix for all measures. With the independent
variables, the maximum correlation is at 0.31 found for firm size (13, Log of Firm size).
This suggests that there is neither excessive statistic correlation, nor the multi-potential
multicollinearity problem among selected variables.
32 If a firm is dead/inactive or acquired, its past accounting information will be not available in Thomson Financials
and Worldscope.
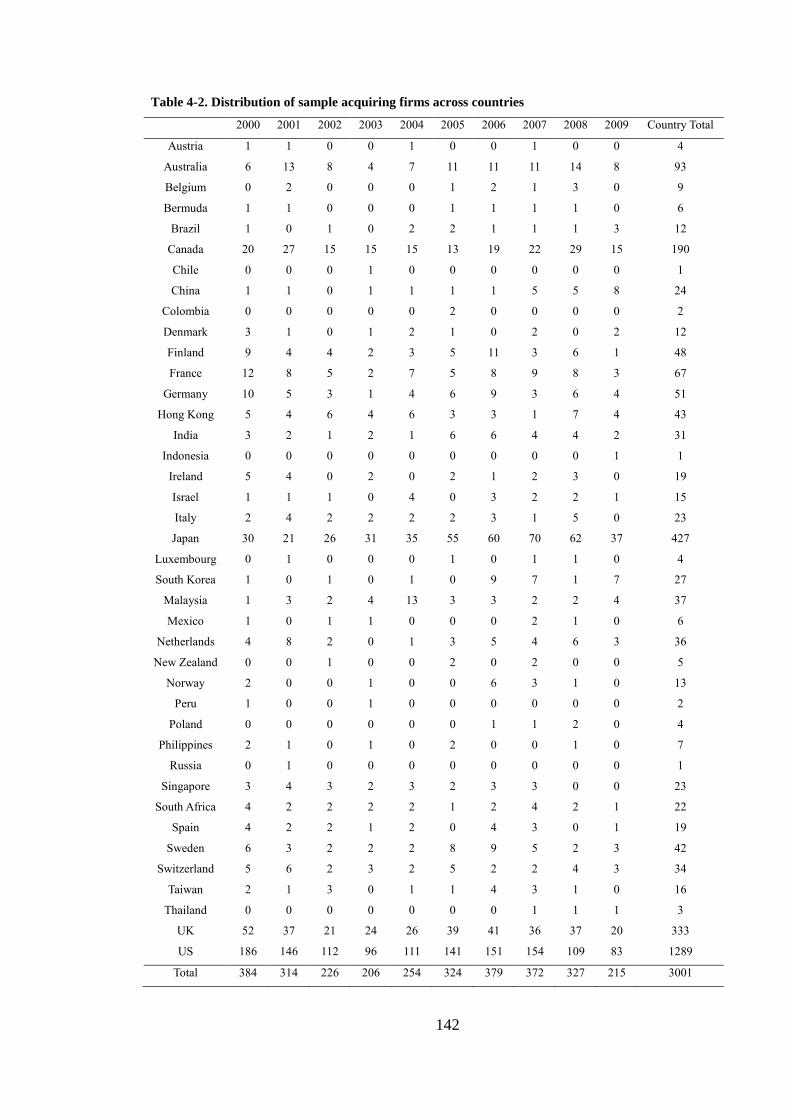
142
Table 4-2. Distribution of sample acquiring firms across countries
2000 2001 2002 2003 2004 2005 2006 2007 2008 2009 Country Total
Austria 1 1 0 0 1 0 0 1 0 0 4
Australia 6 13 8 4 7 11 11 11 14 8 93
Belgium 0 2 0 0 0 1 2 1 3 0 9
Bermuda 1 1 0 0 0 1 1 1 1 0 6
Brazil 1 0 1 0 2 2 1 1 1 3 12
Canada 20 27 15 15 15 13 19 22 29 15 190
Chile 0 0 0 1 0 0 0 0 0 0 1
China 1 1 0 1 1 1 1 5 5 8 24
Colombia 0 0 0 0 0 2 0 0 0 0 2
Denmark 3 1 0 1 2 1 0 2 0 2 12
Finland 9 4 4 2 3 5 11 3 6 1 48
France 12 8 5 2 7 5 8 9 8 3 67
Germany 10 5 3 1 4 6 9 3 6 4 51
Hong Kong 5 4 6 4 6 3 3 1 7 4 43
India 3 2 1 2 1 6 6 4 4 2 31
Indonesia 0 0 0 0 0 0 0 0 0 1 1
Ireland 5 4 0 2 0 2 1 2 3 0 19
Israel 1 1 1 0 4 0 3 2 2 1 15
Italy 2 4 2 2 2 2 3 1 5 0 23
Japan 30 21 26 31 35 55 60 70 62 37 427
Luxembourg 0 1 0 0 0 1 0 1 1 0 4
South Korea 1 0 1 0 1 0 9 7 1 7 27
Malaysia 1 3 2 4 13 3 3 2 2 4 37
Mexico 1 0 1 1 0 0 0 2 1 0 6
Netherlands 4 8 2 0 1 3 5 4 6 3 36
New Zealand 0 0 1 0 0 2 0 2 0 0 5
Norway 2 0 0 1 0 0 6 3 1 0 13
Peru 1 0 0 1 0 0 0 0 0 0 2
Poland 0 0 0 0 0 0 1 1 2 0 4
Philippines 2 1 0 1 0 2 0 0 1 0 7
Russia 0 1 0 0 0 0 0 0 0 0 1
Singapore 3 4 3 2 3 2 3 3 0 0 23
South Africa 4 2 2 2 2 1 2 4 2 1 22
Spain 4 2 2 1 2 0 4 3 0 1 19
Sweden 6 3 2 2 2 8 9 5 2 3 42
Switzerland 5 6 2 3 2 5 2 2 4 3 34
Taiwan 2 1 3 0 1 1 4 3 1 0 16
Thailand 0 0 0 0 0 0 0 1 1 1 3
UK 52 37 21 24 26 39 41 36 37 20 333
US 186 146 112 96 111 141 151 154 109 83 1289
Total 384 314 226 206 254 324 379 372 327 215 3001
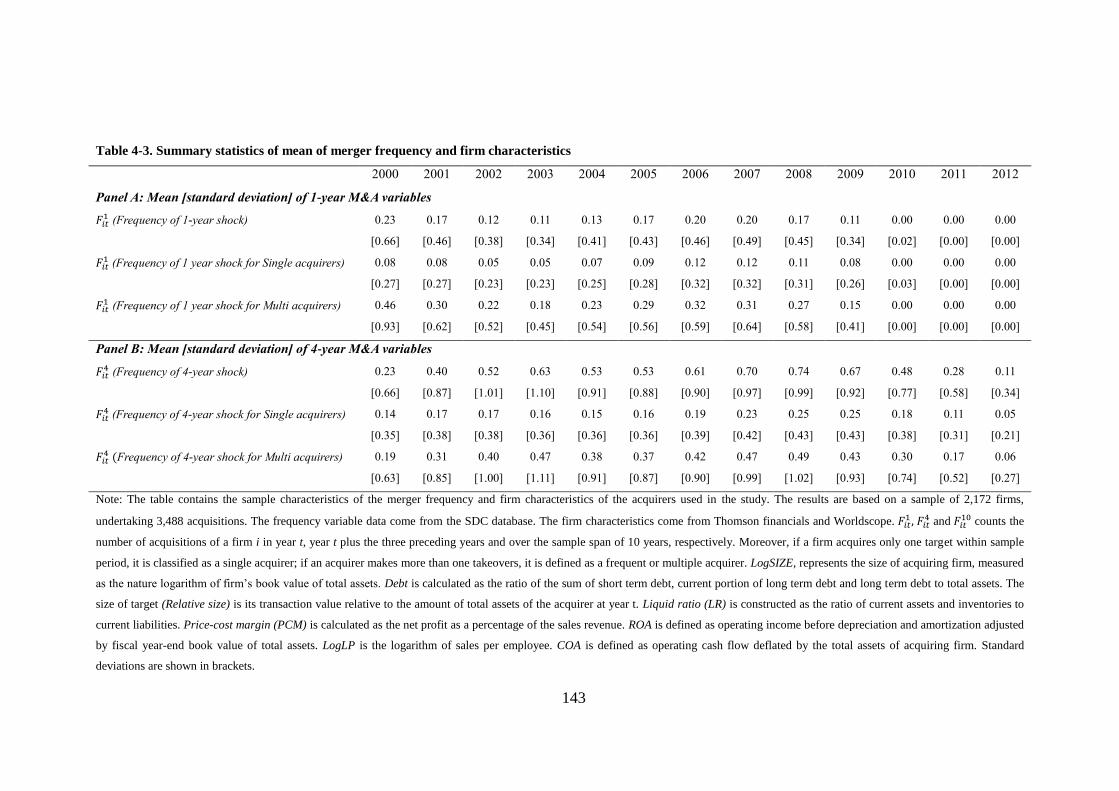
143
Table 4-3. Summary statistics of mean of merger frequency and firm characteristics
2000 2001 2002 2003 2004 2005 2006 2007 2008 2009 2010 2011 2012
Panel A: Mean [standard deviation] of 1-year M&A variables
𝐹𝑖𝑡1 (Frequency of 1-year shock) 0.23 0.17 0.12 0.11 0.13 0.17 0.20 0.20 0.17 0.11 0.00 0.00 0.00
[0.66] [0.46] [0.38] [0.34] [0.41] [0.43] [0.46] [0.49] [0.45] [0.34] [0.02] [0.00] [0.00]
𝐹𝑖𝑡1 (Frequency of 1 year shock for Single acquirers) 0.08 0.08 0.05 0.05 0.07 0.09 0.12 0.12 0.11 0.08 0.00 0.00 0.00
[0.27] [0.27] [0.23] [0.23] [0.25] [0.28] [0.32] [0.32] [0.31] [0.26] [0.03] [0.00] [0.00]
𝐹𝑖𝑡1 (Frequency of 1 year shock for Multi acquirers) 0.46 0.30 0.22 0.18 0.23 0.29 0.32 0.31 0.27 0.15 0.00 0.00 0.00
[0.93] [0.62] [0.52] [0.45] [0.54] [0.56] [0.59] [0.64] [0.58] [0.41] [0.00] [0.00] [0.00]
Panel B: Mean [standard deviation] of 4-year M&A variables
𝐹𝑖𝑡4 (Frequency of 4-year shock) 0.23 0.40 0.52 0.63 0.53 0.53 0.61 0.70 0.74 0.67 0.48 0.28 0.11
[0.66] [0.87] [1.01] [1.10] [0.91] [0.88] [0.90] [0.97] [0.99] [0.92] [0.77] [0.58] [0.34]
𝐹𝑖𝑡4 (Frequency of 4-year shock for Single acquirers) 0.14 0.17 0.17 0.16 0.15 0.16 0.19 0.23 0.25 0.25 0.18 0.11 0.05
[0.35] [0.38] [0.38] [0.36] [0.36] [0.36] [0.39] [0.42] [0.43] [0.43] [0.38] [0.31] [0.21]
𝐹𝑖𝑡4 (Frequency of 4-year shock for Multi acquirers) 0.19 0.31 0.40 0.47 0.38 0.37 0.42 0.47 0.49 0.43 0.30 0.17 0.06
[0.63] [0.85] [1.00] [1.11] [0.91] [0.87] [0.90] [0.99] [1.02] [0.93] [0.74] [0.52] [0.27]
Note: The table contains the sample characteristics of the merger frequency and firm characteristics of the acquirers used in the study. The results are based on a sample of 2,172 firms,
undertaking 3,488 acquisitions. The frequency variable data come from the SDC database. The firm characteristics come from Thomson financials and Worldscope. 𝐹𝑖𝑡1 , 𝐹𝑖𝑡
4 and 𝐹𝑖𝑡10 counts the
number of acquisitions of a firm i in year t, year t plus the three preceding years and over the sample span of 10 years, respectively. Moreover, if a firm acquires only one target within sample
period, it is classified as a single acquirer; if an acquirer makes more than one takeovers, it is defined as a frequent or multiple acquirer. LogSIZE, represents the size of acquiring firm, measured
as the nature logarithm of firm’s book value of total assets. Debt is calculated as the ratio of the sum of short term debt, current portion of long term debt and long term debt to total assets. The
size of target (Relative size) is its transaction value relative to the amount of total assets of the acquirer at year t. Liquid ratio (LR) is constructed as the ratio of current assets and inventories to
current liabilities. Price-cost margin (PCM) is calculated as the net profit as a percentage of the sales revenue. ROA is defined as operating income before depreciation and amortization adjusted
by fiscal year-end book value of total assets. LogLP is the logarithm of sales per employee. COA is defined as operating cash flow deflated by the total assets of acquiring firm. Standard
deviations are shown in brackets.

144
Table 4-3. Summary statistics of merger frequency and firm characteristics- Continued
2000 2001 2002 2003 2004 2005 2006 2007 2008 2009 2010 2011 2012 Panel C Mean [standard deviation] of accumulative(10-years) M&A variables
𝐹𝑖𝑡10 (Frequency of 10-year shock) 0.23 0.40 0.52 0.63 0.76 0.93 1.13 1.33 1.50 1.61 1.61 1.61 1.61
[0.66] [0.87] [1.01] [1.10] [1.25] [1.37] [1.47] [1.58] [1.67] [1.72] [1.72] [1.72] [1.72]
𝐹𝑖𝑡10Frequency of 4-year shock for Single acquirers) 0.14 0.17 0.17 0.16 0.20 0.25 0.32 0.39 0.45 0.49 0.50 0.50 0.50
[0.35] [0.38] [0.38] [0.36] [0.40] [0.43] [0.47] [0.49] [0.50] [0.50] [0.50] [0.50] [0.50]
𝐹𝑖𝑡10Frequency of 4-year shock for Multi acquirers) 0.19 0.31 0.40 0.47 0.56 0.68 0.81 0.94 1.05 1.11 1.11 1.11 1.11
[0.63] [0.85] [1.00] [1.11] [1.28] [1.42] [1.57] [1.73] [1.87] [1.95] [1.95] [1.95] [1.95]
Panel D: Mean [standard deviation] of firm characteristics Relative size (Relative size of target) 0.11 0.13 0.15 0.15 0.07 0.07 0.07 0.09 0.10 0.09 0.06 0.03 0.02
[0.45] [0.40] [0.59] [0.81] [0.27] [0.31] [0.17] [0.27] [0.25] [0.22] [0.18] [0.13] [0.31]
LogSIZE (Total assets of acquirer) 429.80 451.20 469.30 520.80 577.50 597.40 683.60 774.70 794.80 806.30 863.50 91520 952.80
[11713] [12202] [12340] [13115] [13855] [14059] [15187] [16228] [16566] [16946] [17671] [18155] [18646]
Debt (Debt in total assets) 0.25 0.26 0.25 0.24 0.23 0.22 0.22 0.23 0.24 0.24 0.22 0.22 0.23
[0.40] [0.39] [0.21] [0.21] [0.24] [0.22] [0.22] [0.22] [0.25] [0.33] [0.20] [0.20] [0.19]
LR (Liquidity ratio) 2.66 2.49 2.40 2.36 2.41 2.27 2.21 2.19 2.09 2.16 2.14 2.21 2.21
[4.74] [3.68] [3.18] [3.17] [3.28] [2.51] [2.43] [2.62] [2.12] [1.98] [1.96] [3.37] [2.45]
PCM (Profit-cost margin) 0.02 0.03 0.06 0.09 0.10 0.10 0.12 0.12 0.12 0.11 0.13 0.13 0.12
[0.60] [0.50] [0.36] [0.28] [0.28] [0.29] [0.24] [0.22] [0.20] [0.20] [0.16] [0.18] [0.20]
ROA 0.09 0.08 0.08 0.09 0.10 0.10 0.11 0.10 0.10 0.09 0.10 0.10 0.09
[0.21] [0.20] [0.18] [0.17] [0.14] [0.15] [0.16] [0.17] [0.20] [0.15] [0.13] [0.15] [0.15]
LogLP 0.35 0.34 0.33 0.38 0.44 0.44 0.45 0.70 0.88 0.70 0.73 0.71 0.52
[0.95] [0.84] [0.74] [0.94] [1.28] [1.16] [1.11] [7.56] [9.04] [7.19] [7.12] [5.19] [0.92]
COA 0.06 0.06 0.05 0.07 0.08 0.08 0.08 0.08 0.08 0.05 0.08 0.08 0.08
[0.26] [0.17] [0.17] [0.16] [0.13] [0.14] [0.15] [0.18] [0.20] [0.75] [0.13] [0.13] [0.15]
Number of observations 2,169 2,172 2,172 2,171 2,172 2,170 2,171 2,171 2,168 2,170 2,169 2,171 2,170
Note: The table contains the sample characteristics of the merger frequency and firm characteristics of the acquirers used in the study. The results are based on a sample of 2,172 firms,
undertaking 3,488 acquisitions. The firm characteristics come from Thomson financials and Worldscope. 𝐹𝑖𝑡1 , 𝐹𝑖𝑡
4 and 𝐹𝑖𝑡10 counts the number of acquisitions of a firm i in year t, year t plus the
three preceding years and over the sample span of 10 years, respectively. Moreover, if a firm acquires only one target within sample period, it is classified as a single acquirer; if an acquirer
makes more than one takeovers, it is defined as a frequent or multiple acquirer. LogSIZE, represents the size of acquiring firm, measured as the nature logarithm of firm’s book value of total
assets. Debt is calculated as the ratio of the sum of short term debt, current portion of long term debt and long term debt to total assets. The size of target (Relative size) is its transaction value
relative to the amount of total assets of the acquirer at year t. Liquid ratio (LR) is constructed as the ratio of current assets and inventories to current liabilities. Price-cost margin (PCM) is
calculated as the net profit as a percentage of the sales revenue. ROA is defined as operating income before depreciation and amortization adjusted by fiscal year-end book value of total assets.
LogLP is the logarithm of sales per employee. COA is defined as operating cash flow deflated by the total assets of acquiring firm. Standard deviations are shown in brackets.

145
Table 4-4. Correlations between measures
ROAt-1 LogLPt-1 COAt-1 (1) (2) (3) (4) (5) (6) (7) (8)
(1) 𝐹𝑖𝑡1 (Frequency of 1-year shock) 0.04*** 0.01 0.01* 1.00
(2) 𝐹𝑖𝑡4 (Frequency of 4-year shock) 0.03*** 0.02** 0.01* 0.53*** 1.00
(3) 𝐹𝑖𝑡10 (Frequency of 10-year shock) 0.04*** 0.09*** 0.01** 0.28*** 0.55*** 1.00
(4) Relative size -0.12*** -0.05*** -0.02*** 0.09*** 0.17*** 0.06*** 1.00
(5) LogSIZE 0.31*** 0.29*** 0.07*** 0.06*** 0.16*** 0.23*** -0.08*** 1.00
(6) Debt -0.09*** -0.01** -0.03*** -0.02*** -0.02*** -0.05*** -0.00 0.12*** 1.00
(7) LR -0.15*** -0.08*** -0.02*** -0.00 -0.02*** -0.03*** 0.03*** -0.21*** -0.19*** 1.00
(8) PCMt-1 0.10*** 0.18*** 0.02*** 0.00 0.01 0.01 -0.00 0.05*** 0.00 -0.05*** 1.00
Note: 𝐹𝑖𝑡1 , 𝐹𝑖𝑡
4 and 𝐹𝑖𝑡10 counts the number of acquisitions of a firm i in year t, year t plus the three preceding years and over the sample span of 10 years, respectively. Moreover, if a firm acquires
only one target within sample period, it is classified as a single acquirer; if an acquirer makes more than one takeovers, it is defined as a frequent or multiple acquirer. LogSIZE, represents the
size of acquiring firm, measured as the nature logarithm of firm’s book value of total assets. Debt is calculated as the ratio of the sum of short term debt, current portion of long term debt and
long term debt to total assets. The size pf target is its transaction value relative to the amount of total assets of the acquirer at year t. Liquid ratio (LR) is constructed as the ratio of current assets
and inventories to current liabilities. Price-cost margin (PCM) is calculated as the net profit as a percentage of the sales revenue. ROA is defined as operating income before depreciation and
amortization adjusted by fiscal year-end book value of total assets. LogLP is the logarithm of sales per employee. COA is defined as operating cash flow deflated by the total assets of acquiring
firm.
⁎⁎⁎,⁎⁎,⁎ denotes significance at the 1%, 5% and 10% level, respectively.
146
4.5. Estimation results: from “need to chew” to “chew to change”
4.5.1. Effects of merger shocks and frequency on profitability
To estimate the model of (2), the system GMM approach is employed for control
of both firm and year dummies that capture the firm time-invariant specific effects and
general market condition at each year. The models are estimated dynamically with
control of the lagged dependent variable of operating performance − returns on assets
(ROA). As it can be seen in Table 4-5 and 4-6, both the second order autocorrelation
statistic and Hansen J statistic show statistical legitimacy and validity in using two-year
(or further)-lagged explanatory or controlled variables as instruments to address the
problem of endogeneity shocks in estimation.
With the control of endogeneity problems in estimation of more than 20,000
observations, Table 4-5 and 4-6 identifies how much ROA can drop by adding one extra
new firm into the existing business of the acquirer. The amount of the drop depends on
time of a merger shock that can last. The marginal reduction of profitability with respect
to merger frequency is high immediately after the shock, then the reduction becomes
lower in subsequent years after the shocks.
However, the shock cannot last forever as shown by 𝐹𝑡10 in Table 4-5 and Table
4-6 where the 10-year-lasting impact of the frequency on ROA does not appear. In
contrast to the long-term impact, the short-term impact of frequency is significant, and
in the shorter period the impact becomes stronger and higher, see 𝐹𝑡4 and 𝐹𝑡
1 in the
Table 4-5 and Table 4-6. A key message of these findings is clear: the accumulation of
merger shocks diverts effort from profitable activities in the short term, and the shorter
147
the accumulation period is, the more the demand is for diverting attention to digest the
shocks. This message implies that merger shocks impacts profitability adversely and
dynamically: it is stronger in the short run then it is weakened gradually over time, and
eventually it disappears or even it turns oppositely in the long run when the synergy
effects generated by the merger become dominant.
The findings in Table 4-5 and Table 4-6 raise an argument that has two parts.
The first part is consistent with digesting theory (McCarthy, 1963) and the chewing
theory (Kusewitt, 1985). McCarthy explains a negative performance impact of merger
frequency as the firm cannot efficiently and effectively digest and absorb a lot of new
integrations in a short time period due to the clash of cultures and conflict of objectives
between the acquirer and the acquired firm. Kusewitt (1985) regards this digesting
problem or difficulty as “biting off more than you can chew”.
The second part of the argument arises when time is taken into account in the
process of digestion, the long or longer process helps the firm to gradually absorb the
merger shocks, and then enables it to release more merger synergies for business
improvement. Therefore, time matters for changing performance effects of merger
shocks or frequency, “time helping chew” is important. This part extends the existing
digesting theory and the chewing theory into a dynamic context in arguing merger
shocks and frequency: the effect changes with time. Evidence in Table 4-5 and 4-6
support this dynamic argument. Particularly, in Table 4-6, the first three columns are
estimation for firms that had only one merger over the sample span. The merger shock
in the first year of the event affects the acquiring firm negatively, see 𝐹𝑡1 in column (1)
of Table 4-6. The negative effect of the merger shock becomes weaker to non-
significant in subsequent years of the occurrence, see 𝐹𝑡4 in column (2) of Table 4-6.
148
Further, in the long-term process, the shock effect turns to an opposite direction:
significantly positive on profitability improvement, see 𝐹𝑡10 in column (3) of Table 4-6.
Clearly, the change of the shock effect with time for the single acquirers
illustrates the point of the dynamic argument for merger shocks. For multi-acquirers, a
similar pattern of the change in the performance effect of the shocks and frequency
appears: from the stronger to the weaker over time, see Column (4), (5) and (6) of Table
4-6. The different paces of the change between the single and the multi-acquirers reflect
a number or quantity that matters for the impact of merger shocks on business.
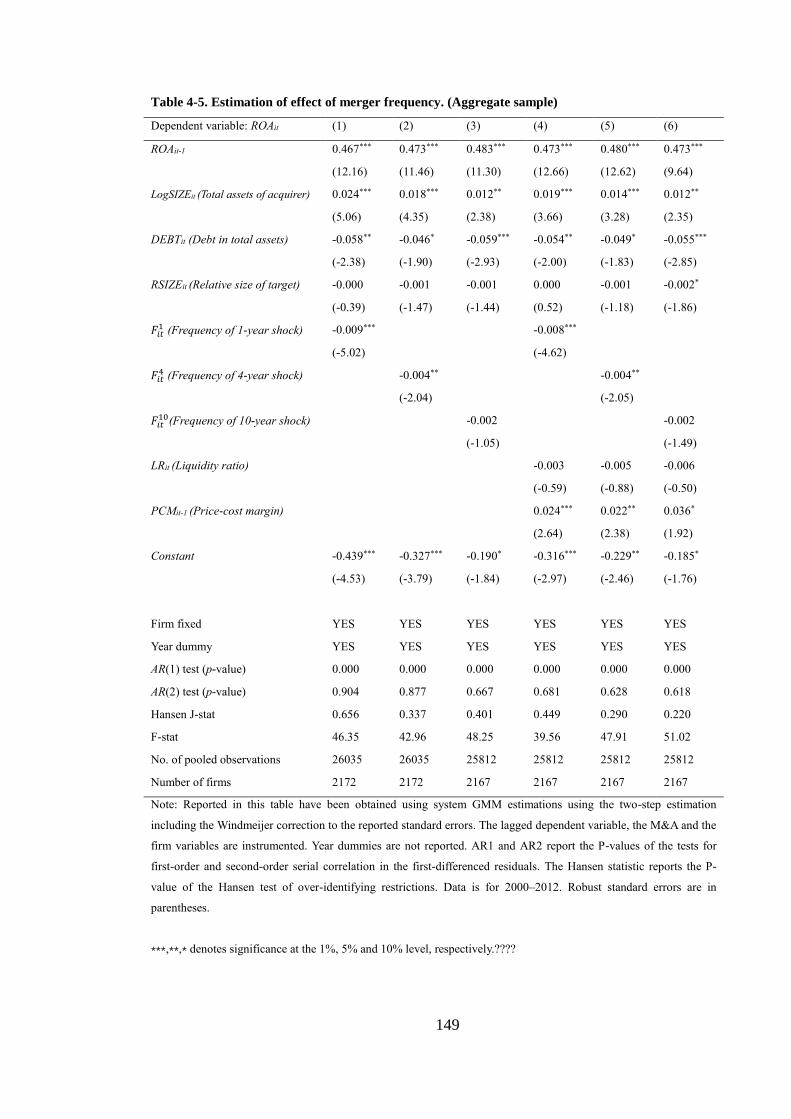
149
Table 4-5. Estimation of effect of merger frequency. (Aggregate sample)
Dependent variable: ROAit (1) (2) (3) (4) (5) (6)
ROAit-1 0.467*** 0.473*** 0.483*** 0.473*** 0.480*** 0.473***
(12.16) (11.46) (11.30) (12.66) (12.62) (9.64)
LogSIZEit (Total assets of acquirer) 0.024*** 0.018*** 0.012** 0.019*** 0.014*** 0.012**
(5.06) (4.35) (2.38) (3.66) (3.28) (2.35)
DEBTit (Debt in total assets) -0.058** -0.046* -0.059*** -0.054** -0.049* -0.055***
(-2.38) (-1.90) (-2.93) (-2.00) (-1.83) (-2.85)
RSIZEit (Relative size of target) -0.000 -0.001 -0.001 0.000 -0.001 -0.002*
(-0.39) (-1.47) (-1.44) (0.52) (-1.18) (-1.86)
𝐹𝑖𝑡1 (Frequency of 1-year shock) -0.009***
-0.008***
(-5.02)
(-4.62)
𝐹𝑖𝑡
4 (Frequency of 4-year shock)
-0.004**
-0.004**
(-2.04)
(-2.05)
𝐹𝑖𝑡
10(Frequency of 10-year shock)
-0.002
-0.002
(-1.05)
(-1.49)
LRit (Liquidity ratio)
-0.003 -0.005 -0.006
(-0.59) (-0.88) (-0.50)
PCMit-1 (Price-cost margin)
0.024*** 0.022** 0.036*
(2.64) (2.38) (1.92)
Constant -0.439*** -0.327*** -0.190* -0.316*** -0.229** -0.185*
(-4.53) (-3.79) (-1.84) (-2.97) (-2.46) (-1.76)
Firm fixed YES YES YES YES YES YES
Year dummy YES YES YES YES YES YES
AR(1) test (p-value) 0.000 0.000 0.000 0.000 0.000 0.000
AR(2) test (p-value) 0.904 0.877 0.667 0.681 0.628 0.618
Hansen J-stat 0.656 0.337 0.401 0.449 0.290 0.220
F-stat 46.35 42.96 48.25 39.56 47.91 51.02
No. of pooled observations 26035 26035 25812 25812 25812 25812
Number of firms 2172 2172 2167 2167 2167 2167
Note: Reported in this table have been obtained using system GMM estimations using the two-step estimation
including the Windmeijer correction to the reported standard errors. The lagged dependent variable, the M&A and the
firm variables are instrumented. Year dummies are not reported. AR1 and AR2 report the P-values of the tests for
first-order and second-order serial correlation in the first-differenced residuals. The Hansen statistic reports the P-
value of the Hansen test of over-identifying restrictions. Data is for 2000–2012. Robust standard errors are in
parentheses.
⁎⁎⁎,⁎⁎,⁎ denotes significance at the 1%, 5% and 10% level, respectively.????
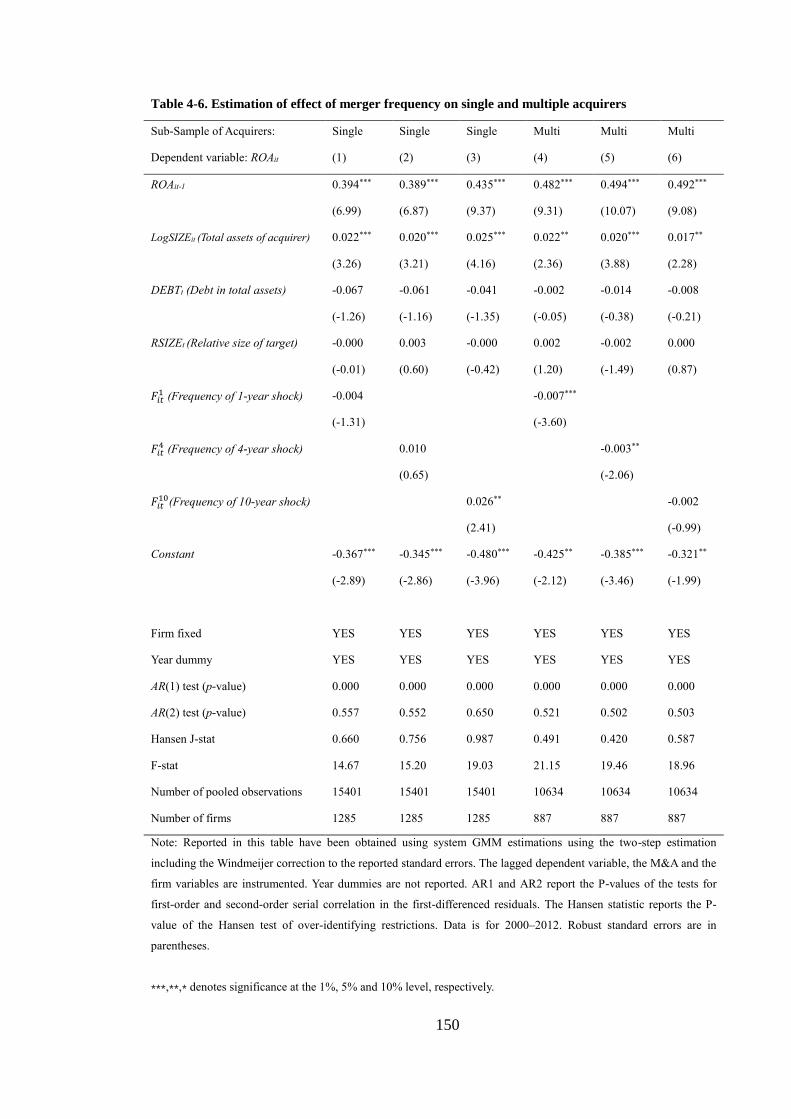
150
Table 4-6. Estimation of effect of merger frequency on single and multiple acquirers
Sub-Sample of Acquirers: Single Single Single Multi Multi Multi
Dependent variable: ROAit (1) (2) (3) (4) (5) (6)
ROAit-1 0.394*** 0.389*** 0.435*** 0.482*** 0.494*** 0.492***
(6.99) (6.87) (9.37) (9.31) (10.07) (9.08)
LogSIZEit (Total assets of acquirer) 0.022*** 0.020*** 0.025*** 0.022** 0.020*** 0.017**
(3.26) (3.21) (4.16) (2.36) (3.88) (2.28)
DEBTt (Debt in total assets) -0.067 -0.061 -0.041 -0.002 -0.014 -0.008
(-1.26) (-1.16) (-1.35) (-0.05) (-0.38) (-0.21)
RSIZEt (Relative size of target) -0.000 0.003 -0.000 0.002 -0.002 0.000
(-0.01) (0.60) (-0.42) (1.20) (-1.49) (0.87)
𝐹𝑖𝑡1 (Frequency of 1-year shock) -0.004
-0.007***
(-1.31)
(-3.60)
𝐹𝑖𝑡4 (Frequency of 4-year shock)
0.010
-0.003**
(0.65)
(-2.06)
𝐹𝑖𝑡10(Frequency of 10-year shock)
0.026**
-0.002
(2.41)
(-0.99)
Constant -0.367*** -0.345*** -0.480*** -0.425** -0.385*** -0.321**
(-2.89) (-2.86) (-3.96) (-2.12) (-3.46) (-1.99)
Firm fixed YES YES YES YES YES YES
Year dummy YES YES YES YES YES YES
AR(1) test (p-value) 0.000 0.000 0.000 0.000 0.000 0.000
AR(2) test (p-value) 0.557 0.552 0.650 0.521 0.502 0.503
Hansen J-stat 0.660 0.756 0.987 0.491 0.420 0.587
F-stat 14.67 15.20 19.03 21.15 19.46 18.96
Number of pooled observations 15401 15401 15401 10634 10634 10634
Number of firms 1285 1285 1285 887 887 887
Note: Reported in this table have been obtained using system GMM estimations using the two-step estimation
including the Windmeijer correction to the reported standard errors. The lagged dependent variable, the M&A and the
firm variables are instrumented. Year dummies are not reported. AR1 and AR2 report the P-values of the tests for
first-order and second-order serial correlation in the first-differenced residuals. The Hansen statistic reports the P-
value of the Hansen test of over-identifying restrictions. Data is for 2000–2012. Robust standard errors are in
parentheses.
⁎⁎⁎,⁎⁎,⁎ denotes significance at the 1%, 5% and 10% level, respectively.
151
The dynamic chewing theory developed in this chapter is different from Jensen
(1986)’s agent theory in predicting the effect of merger shocks on performance. The
agent theory regards profit reduction after merger shocks as a result of acquisitions
made by management for its own utility maximization at expense of shareholder value
and the firm’s profitability. If the agent theory is valid, the performance effect of merger
shocks will be downward permanently or at least in the long run since the merger is
intended to maximize management’s personal utility rather than firm’s profitability. In
contrast, the chewing argument regards the short-run deterioration of profitability after
merger shocks as “digesting constraint” rather than “management’s intention”. The
“digesting constraint” expects to change performance once the constraint is removed or
weakened, but the “management’s intention” expects a difficult to change the intended
change unless the management is changed.
4.5.2. Effects of controls
As shown in Table 4-5 and 4-7, the control variables mostly follow the
expectations made in Section 4.4.3. Firm size (LogSIZE) leads to a significantly positive
impact on acquirer’s profitability, suggesting that larger firms have a higher rate of
returns. This positive relation could be explained by scale and scope efficiencies in large
firms, which is consistent with Hall and Weiss (1967), Fiegenbaum and Karnani (1991)
and Lee (2009), but contradictory to Shepherd (1972) who documents economies of
scale and scope for smaller firms, and diseconomies of scale for larger consolidations.
The coefficient on the debt ratio (DEBT) is statistically highly significant. With a
negative sign, it is associated with poorer operating performance which could possibly
be due to agency issues stemming from risky debt (Fama and Miller, 1972; Jensen and
Meckling, 1976; Fama and French 1998) and consistent with Taub (1975) and Booth et
al. (2001).
The market power of acquiring firms (or price-cost margin, PCM) is calculated
as the percentage of net profits in firm’s sales revenues. The price-cost margin is
significantly positive, consistent with Gugler et al. (2003) who state that the increasing
152
market power can lead to the improvement in acquirer's profits. This could possibly be
explained by the market price of a good or service in excess of marginal cost and long-
term average cost. In the case of liquidity (LR), the impact associated with the
availability of liquid resources, which can be used for either firm or managerial
purposes, is ruled out. Finally, RSIZE is insignificantly related to return on assets of
acquiring firm, which is different from its positive effect on capital market for stock
returns.
Further, Table 4-5 and Table 4-6 also report the statistical validity of estimations
on the basis of the SYS-GMM. The results suggest that there is first-order correlation
but residuals in second differences (AR (2)) are uncorrelated. The specification tests
reported also include a Hansen test for over-identifying restrictions (J-statistic) which
validates the adequacy of the instruments used in the system GMM. The results reported
in both tables indicate that the null hypothesis of valid GMM instruments for both the
exploratory and control variables, cannot be rejected. Therefore, it can be concluded
that GMM is econometrically legitimate for instruments and estimations.
4.5.3. Effect of merger shocks on profitability for different expected
merger shock-lasting time
To further show that shock effects on the business changes with time, the model
(2) is re-estimated by following the same logic to define merger frequency in section
4.4.1. The estimated coefficients are sorted by expected merger shock-lasting time, for
instance 1-year, 2-year, 3-year, 4-year and consecutively continued to the sample span.
The pattern of these estimates in Table 4-7 shows how the effects of merger shocks on
performance gradually change over time. To provide more clearly visual evidence of
findings, coefficients of estimations from Table 4-7 are plotted in figure 4-1. This shows
supportive evidence of the “chew to change” argument developed by this study, but
Jenson’s agent theory which expects a negative change that can last in the long run in
the merger context.

153
Table 4-7. Estimation of effect of merger frequency over different lengths of expected merger shock-lasting time
Dependent variable: ROAit (1) (2) (3) (4) (5) (6) (7) (8) (9) (10)
ROAit-1 0.4666*** 0.5399*** 0.4676*** 0.4734*** 0.4648*** 0.4661*** 0.4702*** 0.4825*** 0.4635*** 0.4830***
(12.16) (9.85) (12.11) (11.46) (12.49) (12.46) (12.52) (12.82) (12.73) (11.30)
LogSIZEit (Total assets of acquirer) 0.0238*** 0.0176*** 0.0229*** 0.0183*** 0.0245*** 0.0251*** 0.0301*** 0.0219*** 0.0305*** 0.0121**
(5.06) (3.93) (4.93) (4.35) (5.34) (5.40) (5.38) (4.77) (5.35) (2.38)
DEBTt (Debt in total assets) -0.0575** -0.0493** -0.0530** -0.0458* -0.0533** -0.0551** -0.0527** -0.0569** -0.0481** -0.0588***
(-2.38) (-2.01) (-2.18) (-1.90) (-2.21) (-2.29) (-2.17) (-2.41) (-1.99) (-2.93)
RSIZEt (Relative size of target) -0.0003 -0.0032*** -0.0022* -0.0015 -0.0015 -0.0004 -0.0024** 0.0005 0.0037 -0.0015
(-0.39) (-2.88) (-1.88) (-1.47) (-1.35) (-0.48) (-2.14) (0.73) (1.47) (-1.44)
𝐹𝑖𝑡1 (Frequency of 1-year shock) -0.0085***
-0.008***
(-5.02)
(-4.62)
𝐹𝑖𝑡
2 (Frequency of 2-year shock)
-0.0073***
-0.004**
(-4.51)
(-2.05)
𝐹𝑖𝑡
3(Frequency of 3-year shock)
-0.0055**
-0.002
(-2.13)
(-1.49)
𝐹𝑖𝑡
4 (Frequency of 4-year shock)
-0.0041**
(-2.04)
𝐹𝑖𝑡
5 (Frequency of 5-year shock)
-0.0036*
(-1.85)
𝐹𝑖𝑡
6(Frequency of 6-year shock)
-0.0029*
(-1.80)
Note: Reported in this table have been obtained using system GMM estimations using the two-step estimation including the Windmeijer correction to the reported standard errors. The lagged dependent variable, the
M&A and the firm variables are instrumented. Year dummies are not reported. AR1 and AR2 report the P-values of the tests for first-order and second-order serial correlation in the first-differenced residuals. The
Hansen statistic reports the P-value of the Hansen test of over-identifying restrictions. Data is for 2000–2012. Robust standard errors are in parentheses.⁎⁎⁎,⁎⁎,⁎ denotes significance at the 1%, 5% and 10% level,
respectively.
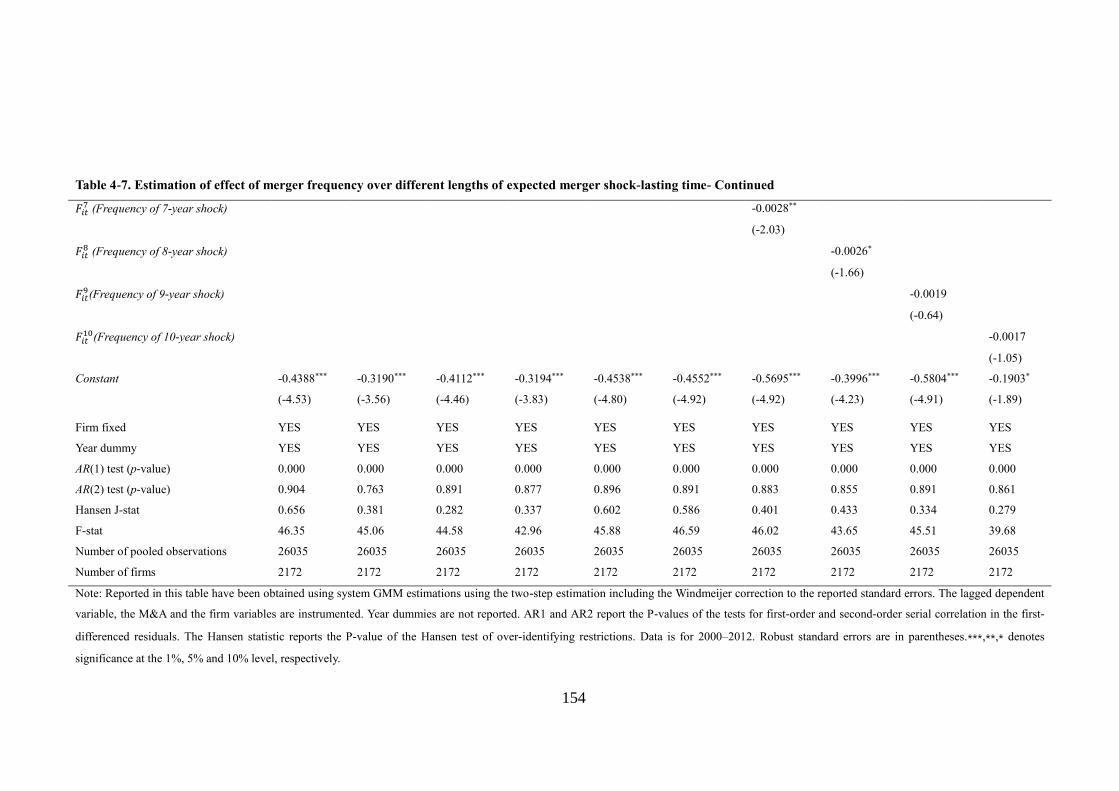
154
Table 4-7. Estimation of effect of merger frequency over different lengths of expected merger shock-lasting time- Continued
𝐹𝑖𝑡7 (Frequency of 7-year shock)
-0.0028**
(-2.03)
𝐹𝑖𝑡
8 (Frequency of 8-year shock)
-0.0026*
(-1.66)
𝐹𝑖𝑡
9(Frequency of 9-year shock)
-0.0019
(-0.64)
𝐹𝑖𝑡
10(Frequency of 10-year shock)
-0.0017
(-1.05)
Constant -0.4388*** -0.3190*** -0.4112*** -0.3194*** -0.4538*** -0.4552*** -0.5695*** -0.3996*** -0.5804*** -0.1903*
(-4.53) (-3.56) (-4.46) (-3.83) (-4.80) (-4.92) (-4.92) (-4.23) (-4.91) (-1.89)
Firm fixed YES YES YES YES YES YES YES YES YES YES
Year dummy YES YES YES YES YES YES YES YES YES YES
AR(1) test (p-value) 0.000 0.000 0.000 0.000 0.000 0.000 0.000 0.000 0.000 0.000
AR(2) test (p-value) 0.904 0.763 0.891 0.877 0.896 0.891 0.883 0.855 0.891 0.861
Hansen J-stat 0.656 0.381 0.282 0.337 0.602 0.586 0.401 0.433 0.334 0.279
F-stat 46.35 45.06 44.58 42.96 45.88 46.59 46.02 43.65 45.51 39.68
Number of pooled observations 26035 26035 26035 26035 26035 26035 26035 26035 26035 26035
Number of firms 2172 2172 2172 2172 2172 2172 2172 2172 2172 2172
Note: Reported in this table have been obtained using system GMM estimations using the two-step estimation including the Windmeijer correction to the reported standard errors. The lagged dependent
variable, the M&A and the firm variables are instrumented. Year dummies are not reported. AR1 and AR2 report the P-values of the tests for first-order and second-order serial correlation in the first-
differenced residuals. The Hansen statistic reports the P-value of the Hansen test of over-identifying restrictions. Data is for 2000–2012. Robust standard errors are in parentheses.⁎⁎⁎,⁎⁎,⁎ denotes
significance at the 1%, 5% and 10% level, respectively.

155
Figure 4-1. How the effects of merger shocks on performance gradually change over the
lengths of expected merger shock-lasting time
4.6. Robustness checks
4.6.1. How long will the shock last?
Based on findings discussed above, the lasting effect of acquisitions is examined
based on the argument of lasting effect made in Chapter 3, which shows that merger
strategy is partly a function of accumulation process between the time and the quantity
and that therefore the impact of an acquisition to acquiring firm may not only appear in
the current year, but also continue for a period of time. Thus, the lasting effect could be
seen as a dynamically continuous and declining process. Following earlier papers by
Healy et al. (1992) and Switzer (1996), the change of a lasting effect is tracked for
different points of time, the acquisition year, 1, 2, 3, 4 and 5 years later through fixed
effects distributed-lag model of the form:
𝑦𝑖𝑡 = 𝛽0 + 𝛼 ∑ 𝑥𝑡−𝑠50 + 𝜃𝒁 + 𝑐𝑖 + 𝜀𝑖𝑡, ⑽
where y is firm performance; x is frequency measured by Number of mergers, which
counts the number of acquisitions that a firm undertakes in year t. and it is lagged from
t-1 to t-5 in order to see how long a merger shock can last.
-0.009
-0.008
-0.007
-0.006
-0.005
-0.004
-0.003
-0.002
-0.001
0
1-year 2-year 3-year 4-year 5-year 6-year 7-year 8-year 9-year 10-year
Para
met
er (
Str
eng
rth
of
shock
)
Length of expected merger shock-lasting time
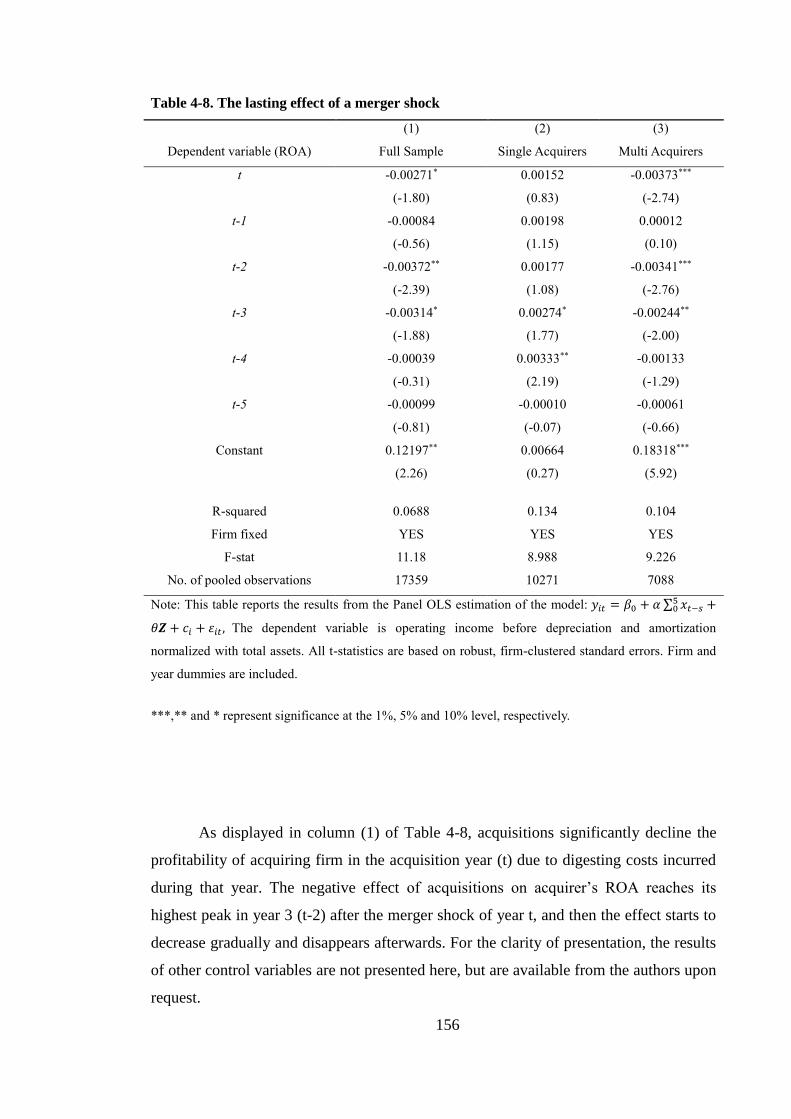
156
Table 4-8. The lasting effect of a merger shock
(1) (2) (3)
Dependent variable (ROA) Full Sample Single Acquirers Multi Acquirers
t -0.00271* 0.00152 -0.00373***
(-1.80) (0.83) (-2.74)
t-1 -0.00084 0.00198 0.00012
(-0.56) (1.15) (0.10)
t-2 -0.00372** 0.00177 -0.00341***
(-2.39) (1.08) (-2.76)
t-3 -0.00314* 0.00274* -0.00244**
(-1.88) (1.77) (-2.00)
t-4 -0.00039 0.00333** -0.00133
(-0.31) (2.19) (-1.29)
t-5 -0.00099 -0.00010 -0.00061
(-0.81) (-0.07) (-0.66)
Constant 0.12197** 0.00664 0.18318***
(2.26) (0.27) (5.92)
R-squared 0.0688 0.134 0.104
Firm fixed YES YES YES
F-stat 11.18 8.988 9.226
No. of pooled observations 17359 10271 7088
Note: This table reports the results from the Panel OLS estimation of the model: 𝑦𝑖𝑡 = 𝛽0 + 𝛼 ∑ 𝑥𝑡−𝑠50 +
𝜃𝒁 + 𝑐𝑖 + 𝜀𝑖𝑡 , The dependent variable is operating income before depreciation and amortization
normalized with total assets. All t-statistics are based on robust, firm-clustered standard errors. Firm and
year dummies are included.
***,** and * represent significance at the 1%, 5% and 10% level, respectively.
As displayed in column (1) of Table 4-8, acquisitions significantly decline the
profitability of acquiring firm in the acquisition year (t) due to digesting costs incurred
during that year. The negative effect of acquisitions on acquirer’s ROA reaches its
highest peak in year 3 (t-2) after the merger shock of year t, and then the effect starts to
decrease gradually and disappears afterwards. For the clarity of presentation, the results
of other control variables are not presented here, but are available from the authors upon
request.
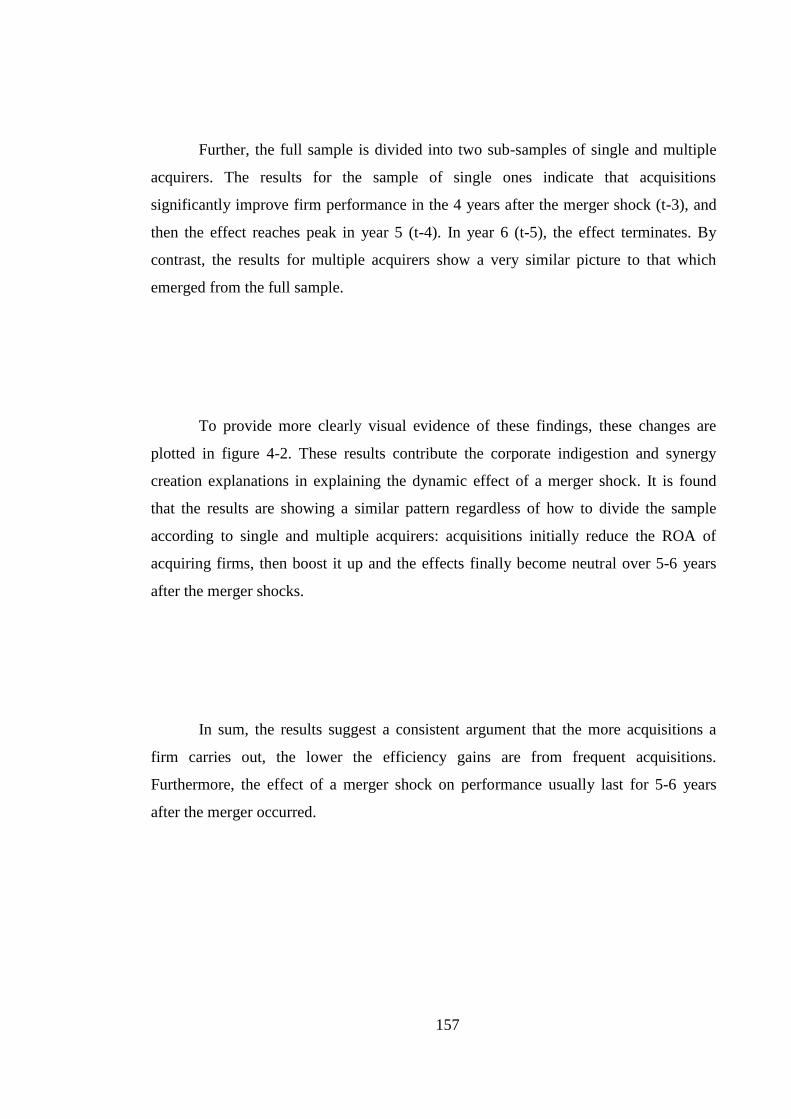
157
Further, the full sample is divided into two sub-samples of single and multiple
acquirers. The results for the sample of single ones indicate that acquisitions
significantly improve firm performance in the 4 years after the merger shock (t-3), and
then the effect reaches peak in year 5 (t-4). In year 6 (t-5), the effect terminates. By
contrast, the results for multiple acquirers show a very similar picture to that which
emerged from the full sample.
To provide more clearly visual evidence of these findings, these changes are
plotted in figure 4-2. These results contribute the corporate indigestion and synergy
creation explanations in explaining the dynamic effect of a merger shock. It is found
that the results are showing a similar pattern regardless of how to divide the sample
according to single and multiple acquirers: acquisitions initially reduce the ROA of
acquiring firms, then boost it up and the effects finally become neutral over 5-6 years
after the merger shocks.
In sum, the results suggest a consistent argument that the more acquisitions a
firm carries out, the lower the efficiency gains are from frequent acquisitions.
Furthermore, the effect of a merger shock on performance usually last for 5-6 years
after the merger occurred.

158
Figure 4-2. How long does the performance effect of a merger shock last?
0.12197
0.116
0.117
0.118
0.119
0.120
0.121
0.122
0.123
t(year of
acquisition)
t-1 t-2 t-3 t-4 t-5Ma
rgin
al
effe
ct
of
mer
ger
sh
ock
Year after the merger shock
Full Sample
0
0.000
0.001
0.001
0.002
0.002
0.003
0.003
0.004
t
(year of
acquisition)
t-1 t-2 t-3 t-4 t-5
Ma
rgin
al
effe
ct
of
mer
ger
sh
ock
Year after the merger shock
Single acquirers
0.18318
0.177
0.178
0.179
0.180
0.181
0.182
0.183
0.184
t
(year of
acquisition)
t-1 t-2 t-3 t-4 t-5Ma
rgin
al
effe
ct
of
mer
ger
sh
ock
Year after the merger shock
Multiple acquirers
0
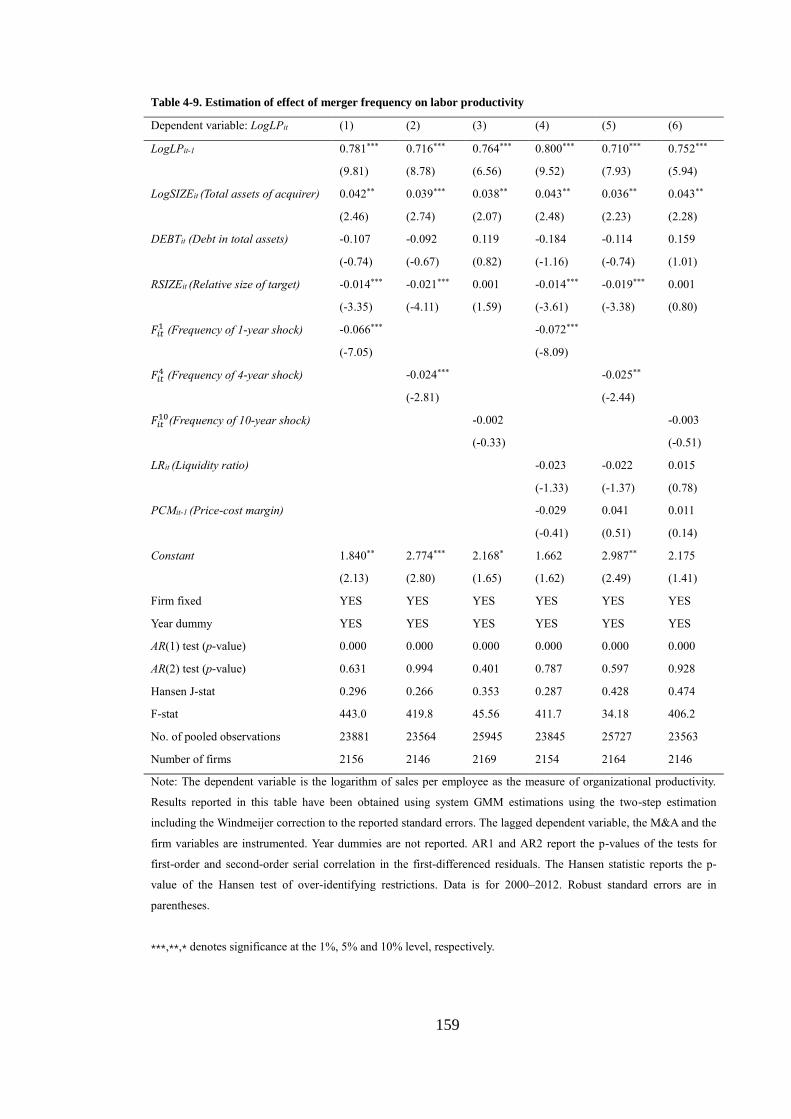
159
Table 4-9. Estimation of effect of merger frequency on labor productivity
Dependent variable: LogLPit (1) (2) (3) (4) (5) (6)
LogLPit-1 0.781*** 0.716*** 0.764*** 0.800*** 0.710*** 0.752***
(9.81) (8.78) (6.56) (9.52) (7.93) (5.94)
LogSIZEit (Total assets of acquirer) 0.042** 0.039*** 0.038** 0.043** 0.036** 0.043**
(2.46) (2.74) (2.07) (2.48) (2.23) (2.28)
DEBTit (Debt in total assets) -0.107 -0.092 0.119 -0.184 -0.114 0.159
(-0.74) (-0.67) (0.82) (-1.16) (-0.74) (1.01)
RSIZEit (Relative size of target) -0.014*** -0.021*** 0.001 -0.014*** -0.019*** 0.001
(-3.35) (-4.11) (1.59) (-3.61) (-3.38) (0.80)
𝐹𝑖𝑡1 (Frequency of 1-year shock) -0.066***
-0.072***
(-7.05)
(-8.09)
𝐹𝑖𝑡
4 (Frequency of 4-year shock)
-0.024***
-0.025**
(-2.81)
(-2.44)
𝐹𝑖𝑡
10(Frequency of 10-year shock)
-0.002
-0.003
(-0.33)
(-0.51)
LRit (Liquidity ratio)
-0.023 -0.022 0.015
(-1.33) (-1.37) (0.78)
PCMit-1 (Price-cost margin) -0.029 0.041 0.011
(-0.41) (0.51) (0.14)
Constant 1.840** 2.774*** 2.168* 1.662 2.987** 2.175
(2.13) (2.80) (1.65) (1.62) (2.49) (1.41)
Firm fixed YES YES YES YES YES YES
Year dummy YES YES YES YES YES YES
AR(1) test (p-value) 0.000 0.000 0.000 0.000 0.000 0.000
AR(2) test (p-value) 0.631 0.994 0.401 0.787 0.597 0.928
Hansen J-stat 0.296 0.266 0.353 0.287 0.428 0.474
F-stat 443.0 419.8 45.56 411.7 34.18 406.2
No. of pooled observations 23881 23564 25945 23845 25727 23563
Number of firms 2156 2146 2169 2154 2164 2146
Note: The dependent variable is the logarithm of sales per employee as the measure of organizational productivity.
Results reported in this table have been obtained using system GMM estimations using the two-step estimation
including the Windmeijer correction to the reported standard errors. The lagged dependent variable, the M&A and the
firm variables are instrumented. Year dummies are not reported. AR1 and AR2 report the p-values of the tests for
first-order and second-order serial correlation in the first-differenced residuals. The Hansen statistic reports the p-
value of the Hansen test of over-identifying restrictions. Data is for 2000–2012. Robust standard errors are in
parentheses.
⁎⁎⁎,⁎⁎,⁎ denotes significance at the 1%, 5% and 10% level, respectively.
160
Table 4-10. Estimation of effect of merger frequency on firm labor productivity for single and multiple
acquirers
Sub-sample of acquirers Single Single Single Multi Multi Multi
Dependent variable: LogLPit (1) (2) (3) (4) (5) (6)
LogLPit-1 0.770*** 0.807*** 0.902*** 0.859*** 0.838*** 0.859***
(9.33) (10.85) (14.73) (4.95) (5.05) (6.55)
LogSIZEit (Total assets of acquirer) 0.038* 0.025 0.029 0.040 0.046 0.035
(1.85) (1.35) (1.53) (1.23) (1.36) (1.31)
DEBTit (Debt in total assets) -0.048 -0.022 -0.021 -0.180 -0.127 -0.188
(-0.26) (-0.12) (-0.12) (-0.85) (-0.60) (-0.98)
RSIZEit (Relative size of target) -0.008 -0.002 -0.001 -0.016** -0.024*** 0.001
(-1.28) (-0.10) (-0.97) (-2.42) (-2.79) (1.62)
𝐹𝑖𝑡1 (Frequency of 1-year shock) -0.002
-0.060***
(-0.01)
(-6.08)
𝐹𝑖𝑡
4 (Frequency of 4-year shock)
0.031
-0.023**
(0.54)
(-2.11)
𝐹𝑖𝑡
10(Frequency of 10-year shock)
0.040**
-0.002
(2.02)
(-0.36)
Constant 2.039** 1.830** 0.607 0.966 1.056 1.092
(2.25) (2.01) (0.84) (0.50) (0.65) (0.71)
Firm fixed YES YES YES YES YES YES
Year dummy YES YES YES YES YES YES
AR(1) test (p-value) 0.000 0.000 0.000 0.000 0.000 0.000
AR(2) test (p-value) 0.379 0.375 0.400 0.823 0.795 0.817
Hansen J-stat 0.339 0.234 0.321 0.337 0.338 0.653
F-stat 244.3 274.3 395.5 227.2 203.9 248.7
No. of pooled observations 13931 13931 13931 9950 9950 9950
Number of firms 1275 1275 1275 881 881 881
Note: The dependent variable is the logarithm of sales per employee as the measure of organizational productivity.
Results reported in this table have been obtained using system GMM estimations using the two-step estimation
including the Windmeijer correction to the reported standard errors. The lagged dependent variable, the M&A and the
firm variables are instrumented. Year dummies are not reported. AR1 and AR2 report the p-values of the tests for
first-order and second-order serial correlation in the first-differenced residuals. The Hansen statistic reports the p-
value of the Hansen test of over-identifying restrictions. Data is for 2000–2012. Robust standard errors are in
parentheses.
⁎⁎⁎,⁎⁎,⁎ denotes significance at the 1%, 5% and 10% level, respectively.
161
4.6.1. Labour productivity
For further robustness tests, the logarithm of sales per employee is adopted as
the measure of firm productivity to see if there is a consistent conclusion.
Table 4-9 reports panel regression results for productivity. The estimation results
are consistent with findings of Table 4-5. For example, a significantly negative
relationship between 4-year merger frequency and acquiring firm labour productivity is
found for the full sample in column (2) of Table 4-9 (-0.024, t= -2.81). However, when
focusing on the results of 10-year merger shock (Column (3) of Table 4-9), the negative
effect disappears. Turning to the estimation of merger shock on the productivity for
single acquirers and multiple acquires (Table 4-10), there is still no change in the
conclusions.
4.6.2. Cash-based measure
Several studies on takeover performance suggest that in measuring the
performance of an acquiring firm after a merger event, the earning-based measurements
could be problematic due to the susceptibility of accounting information to managerial
manipulation through earnings management and change of accounting policies (Stanton,
1987; Erickson and Wang, 1999; Powell and Stark 2005). In terms of measurement
selection, Barber and Lyon (1996) suggest that the use of operating cash flow is good
alternative.
Therefore, a cash-based variable which is widely accepted by existing studies, is
introduced in later robustness tests: operating cash flow returns. Following Healy et al.
(1990), operating cash flow is defined as sales, minus cost of goods sold, and selling
and administrative expense, plus depreciation, goodwill expense and deferred tax, and
adjusted for changes in working capital. This value is then deflated by the total assets of
the acquiring firm. The performance measure is therefore less affected by the method of

162
accounting for the merger such as the recognition of bad debts or the accounting
policies adopted on the valuation of inventories and/or the method of financing the
takeover (Healy et al., 1990; Powell and Stark, 2005).
Table 4-11 suggests that the results are still consistently robust. For example: The
relation between 4-year merger frequency and cash flow returns is significantly negative
(-0.004, t=-1.99). However, when turning to a 10-year measure of merger shock, the
effect disappears (-0.003, t=-1.63). For single and multiple acquirers in Table 4-12, the
results are still similar to those found in section 4.5.
4.6.3. Additional sensitive checks
The findings are also robust in a wider range of alternative regressions, notably
in three areas: firstly, following the same logic as Section 4.4.1 to count the merger
frequency by deal characteristics, namely, payment method, target listing status,
geographic scope (See, Appendix A.). Secondly, estimating the relation between
different measure of firm performance and merger frequency with a lag by the
following model, which reduces the impact of simultaneity since past merger frequency
and current performance are not determined in the same period33 (See Appendix B):
𝑦𝑖𝑡 = 𝛽0 + 𝛼𝑦𝑖𝑡−1 + 𝛽1𝑋𝑖𝑡−1 + 𝛽2𝑍𝑖𝑡−1 + 𝛾𝑡𝑇𝑡 + 𝑐𝑖 + 𝜀𝑖𝑡, ⑾
where X presents the merger frequency variables and Z includes the control variable.
Overall, it is found that none of these alternative approaches yielded significantly
different results, and the inference of the effect of merger frequency on firm
performance remains unchanged. Thirdly, reexamining the argument on two sub-
samples of US and EU acquirer. The conclusion of the study remains unchanged. In
addition, it is found that the negative effects of merger shocks for EU and Asian
acquirers are stronger than the US ones. (See, Appendix C.)
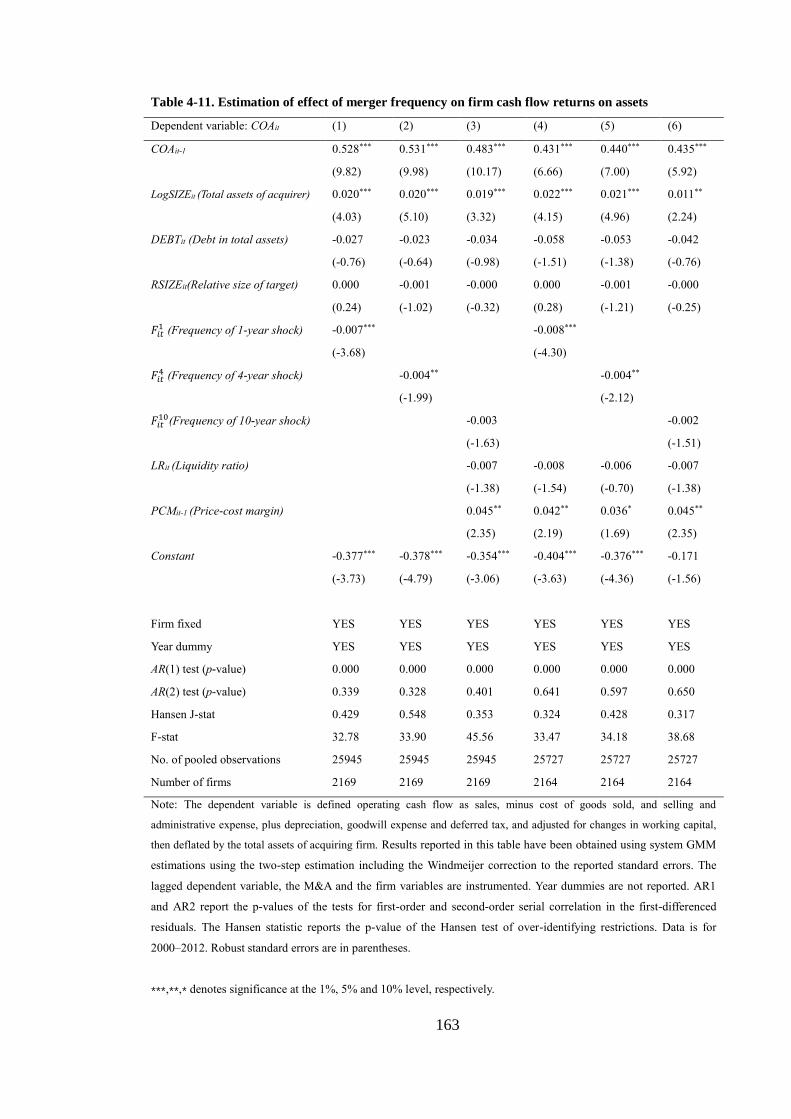
163
Table 4-11. Estimation of effect of merger frequency on firm cash flow returns on assets
Dependent variable: COAit (1) (2) (3) (4) (5) (6)
COAit-1 0.528*** 0.531*** 0.483*** 0.431*** 0.440*** 0.435***
(9.82) (9.98) (10.17) (6.66) (7.00) (5.92)
LogSIZEit (Total assets of acquirer) 0.020*** 0.020*** 0.019*** 0.022*** 0.021*** 0.011**
(4.03) (5.10) (3.32) (4.15) (4.96) (2.24)
DEBTit (Debt in total assets) -0.027 -0.023 -0.034 -0.058 -0.053 -0.042
(-0.76) (-0.64) (-0.98) (-1.51) (-1.38) (-0.76)
RSIZEit(Relative size of target) 0.000 -0.001 -0.000 0.000 -0.001 -0.000
(0.24) (-1.02) (-0.32) (0.28) (-1.21) (-0.25)
𝐹𝑖𝑡1 (Frequency of 1-year shock) -0.007***
-0.008***
(-3.68)
(-4.30)
𝐹𝑖𝑡
4 (Frequency of 4-year shock)
-0.004**
-0.004**
(-1.99)
(-2.12)
𝐹𝑖𝑡
10(Frequency of 10-year shock)
-0.003
-0.002
(-1.63)
(-1.51)
LRit (Liquidity ratio) -0.007 -0.008 -0.006 -0.007
(-1.38) (-1.54) (-0.70) (-1.38)
PCMit-1 (Price-cost margin) 0.045** 0.042** 0.036* 0.045**
(2.35) (2.19) (1.69) (2.35)
Constant -0.377*** -0.378*** -0.354*** -0.404*** -0.376*** -0.171
(-3.73) (-4.79) (-3.06) (-3.63) (-4.36) (-1.56)
Firm fixed YES YES YES YES YES YES
Year dummy YES YES YES YES YES YES
AR(1) test (p-value) 0.000 0.000 0.000 0.000 0.000 0.000
AR(2) test (p-value) 0.339 0.328 0.401 0.641 0.597 0.650
Hansen J-stat 0.429 0.548 0.353 0.324 0.428 0.317
F-stat 32.78 33.90 45.56 33.47 34.18 38.68
No. of pooled observations 25945 25945 25945 25727 25727 25727
Number of firms 2169 2169 2169 2164 2164 2164
Note: The dependent variable is defined operating cash flow as sales, minus cost of goods sold, and selling and
administrative expense, plus depreciation, goodwill expense and deferred tax, and adjusted for changes in working capital,
then deflated by the total assets of acquiring firm. Results reported in this table have been obtained using system GMM
estimations using the two-step estimation including the Windmeijer correction to the reported standard errors. The
lagged dependent variable, the M&A and the firm variables are instrumented. Year dummies are not reported. AR1
and AR2 report the p-values of the tests for first-order and second-order serial correlation in the first-differenced
residuals. The Hansen statistic reports the p-value of the Hansen test of over-identifying restrictions. Data is for
2000–2012. Robust standard errors are in parentheses.
⁎⁎⁎,⁎⁎,⁎ denotes significance at the 1%, 5% and 10% level, respectively.

164
Table 4-12. Estimation of effect of merger frequency on cash flow returns on assets for single and
multiple acquirers
Sub-sample of acquirers Single Single Single Multi Multi Multi
Dependent variable: COAit (1) (2) (3) (4) (5) (6)
COAit-1 0.496*** 0.532*** 0.525*** 0.434*** 0.421*** 0.405***
(7.25) (7.54) (7.78) (5.07) (11.30) (4.10)
LogSIZEit (Total assets of acquirer) 0.020*** 0.020*** 0.027*** 0.029*** 0.026*** 0.013***
(2.68) (3.03) (3.75) (2.72) (4.10) (2.77)
DEBTit (Debt in total assets) -0.023 -0.005 -0.008 -0.047 -0.057 -0.018
(-0.40) (-0.10) (-0.16) (-1.14) (-1.22) (-0.87)
RSIZEit(Relative size of target) 0.001 0.002 -0.005 -0.001 -0.003* 0.000
(0.64) (0.31) (-0.81) (-0.99) (-1.80) (0.39)
𝐹𝑖𝑡1 (Frequency of 1-year shock) -0.005
-0.007***
(-1.61)
(-3.09)
𝐹𝑖𝑡
4 (Frequency of 4-year shock)
0.003
-0.005**
(0.16)
(-2.41)
𝐹𝑖𝑡
10(Frequency of 10-year shock)
0.024***
-0.001
(2.77)
(-1.16)
Constant -0.363*** -0.361*** -0.537*** -0.147 -0.498*** -0.235**
(-2.59) (-2.96) (-3.73) (-1.18) (-3.85) (-2.53)
Firm fixed YES YES YES YES YES YES
Year dummy YES YES YES YES YES YES
AR(1) test (p-value) 0.000 0.000 0.000 0.000 0.000 0.000
AR(2) test (p-value) 0.556 0.483 0.504 0.647 0.567 0.681
Hansen J-stat 0.242 0.437 0.670 0.243 0.318 0.260
F-stat 25.68 19.23 20.05 12.37 21.30 20.50
No. of pooled observations 15336 15336 15336 10609 10609 10609
Number of firms 1283 1283 1283 886 886 886
Note: The dependent variable is defined operating cash flow as sales, minus cost of goods sold, and selling and
administrative expense, plus depreciation, goodwill expense and deferred tax, and adjusted for changes in working capital,
then deflated by the total assets of acquiring firm. Results reported in this table have been obtained using system GMM
estimations using the two-step estimation including the Windmeijer correction to the reported standard errors. The
lagged dependent variable, the M&A and the firm variables are instrumented. Year dummies are not reported. AR1
and AR2 report the p-values of the tests for first-order and second-order serial correlation in the first-differenced
residuals. The Hansen statistic reports the p-value of the Hansen test of over-identifying restrictions. Data is for
2000–2012. Robust standard errors are in parentheses.
⁎⁎⁎,⁎⁎,⁎ denotes significance at the 1%, 5% and 10% level, respectively.
165
4.7. Conclusions
Is a market response to a merger announcement consistent with what actually
happens to the fundamentals of the firm after the announcement? Notably, the market
expectation about a merger effect on changing firm performance is quite consistently
related to what has been actually changed in the firm after the merger shock.
In previous chapter, it is found that the investors perceive a lower value if the
acquiring firm is involved in frequent mergers. This is because more mergers are
expected to attract a considerable amount of management attention away from
profitable activities in order to digest the challenges of new business integration at least
in the short run. This “digesting constraint” argument is evident in the estimations
reported in this chapter. Firms becomes less profitable in the short run after a merger
shock, and this adverse effect can be more severe if a firm is involved in more frequent
mergers.
Further evidence shows that, the effect of merger shocks is not static and
persistent, and it changes with time. The shock adversely affects profitability in the
short run, usually lasting a couple of years, and then the negative effect on performance
could be turned either oppositely, if the firm digests the shock successfully, or
continuously but diminishing over time if the digestion takes longer such as for frequent
acquisition. This finding implies that the pace of firm resilience to a merger shock can
be affected by its merger strategies. The pace can be slow if the firm pursues frequent
mergers aggressively. Overall, the performance effect of a merger shock is dynamic and
it changes with time. This dynamic view of merger shocks in this study opens a new
vision for research on mergers.

166
Appendix A
Table A1. The effect of 1-year merger shock on returns on assets by deal-level characteristics.
Dependent variable: ROAit (1) (2) (3) (4) (5)
ROAit-1 0.467*** 0.478*** 0.465*** 0.458*** 0.466***
(12.35) (12.50) (12.41) (11.55) (12.36)
LogSIZEit (Total assets of acquirer) 0.027*** 0.027*** 0.027*** 0.026*** 0.027***
(5.08) (4.85) (5.08) (4.71) (5.07)
DEBTit (Debt in total assets) -0.059** -0.069** -0.059** -0.072*** -0.059**
(-2.43) (-2.26) (-2.45) (-2.78) (-2.41)
RSIZEit (Relative size of target) -0.000 0.000 -0.000 0.000 -0.000
(-0.07) (0.11) (-0.11) (0.20) (-0.11)
Target listing status
𝐹𝑖𝑡1:Public targets -0.026***
(-7.61)
𝐹𝑖𝑡1:Private targets 0.001
(0.33)
Payment method
𝐹𝑖𝑡1:Pure cash deals
-0.094
(-0.97)
𝐹𝑖𝑡1:Pure stock deals
0.021
(0.16)
𝐹𝑖𝑡1:Foreign targets
-0.019***
(-5.18)
𝐹𝑖𝑡1:Domestic targets
-0.008***
(-3.87)
𝐹𝑖𝑡1:Related targets
-0.010***
(-4.32)
𝐹𝑖𝑡1:Diversified targets
-0.010***
(-3.88)
Interactions
𝐹𝑖𝑡1:Cash-public
-0.019***
(-5.09)
𝐹𝑖𝑡1:Stock-public
-0.025***
(-5.85)
𝐹𝑖𝑡1:Cash-private
0.002
(0.83)
𝐹𝑖𝑡1:Stock-private
-0.005
(-1.01)
Constant -0.495*** -0.488*** -0.494*** -0.460*** -0.489***
(-4.65) (-4.54) (-4.65) (-4.27) (-4.64)
Firm fixed YES YES YES YES YES
Year dummy YES YES YES YES YES
AR(1) test (p-value) 0.000 0.000 0.000 0.000 0.000
AR(2) test (p-value) 0.898 0.908 0.909 0.925 0.896
Hansen J-stat 0.466 0.435 0.475 0.893 0.469
F-stat 44.54 44.26 44.43 42.33 44.54
Number of pooled observations 26035 26035 26035 26035 26035
Number of firms 2172 2172 2172 2172 2172
Note: Results reported in this table have been obtained using system GMM estimations using the two-step estimation
including the Windmeijer correction to the reported standard errors. The lagged dependent variable, the M&A and the
firm variables are instrumented. Year dummies are not reported. AR1 and AR2 report the p-values of the tests for
first-order and second-order serial correlation in the first-differenced residuals. The Hansen statistic reports the p-
value of the Hansen test of over-identifying restrictions. Data is for 2000–2012. Robust standard errors are in
parentheses.
⁎⁎⁎,⁎⁎,⁎ denotes significance at the 1%, 5% and 10% level, respectively.

167
Table A2. The effect of 4-year merger shock on returns on assets by deal-level characteristics.
Dependent variable: ROAit (1) (2) (3) (4) (5)
ROAit-1 0.472*** 0.460*** 0.466*** 0.466*** 0.478***
(10.53) (10.19) (10.37) (10.25) (10.29)
LogSIZEit (Total assets of acquirer) 0.020*** 0.021*** 0.021*** 0.020*** 0.017***
(7.62) (6.19) (6.06) (5.90) (5.67)
DEBTit (Debt in total assets) -0.049** -0.047** -0.046** -0.046** -0.047**
(-2.27) (-2.14) (-2.08) (-2.11) (-2.15)
RSIZEit (Relative size of target) -0.004*** -0.003*** -0.004*** -0.004*** -0.003***
(-4.49) (-4.01) (-4.93) (-4.44) (-3.51)
Target listing status
𝐹𝑖𝑡4:Public targets -0.009***
(-4.37)
𝐹𝑖𝑡4:Private targets -0.007***
(-3.07)
Payment method
𝐹𝑖𝑡4:Pure cash deals
-0.005**
(-2.26)
𝐹𝑖𝑡4:Pure stock deals
-0.010***
(-3.82)
𝐹𝑖𝑡4:Foreign targets
-0.007***
(-3.17)
𝐹𝑖𝑡4:Domestic targets
-0.008***
(-4.09)
𝐹𝑖𝑡4:Related targets
-0.008***
(-3.09)
𝐹𝑖𝑡4:Diversified targets
-0.007***
(-3.63)
Interactions
𝐹𝑖𝑡4:Cash-public
-0.005*
(-1.86)
𝐹𝑖𝑡4:Stock-public
-0.012***
(-2.83)
𝐹𝑖𝑡4:Cash-private
-0.000
(-0.14)
𝐹𝑖𝑡4:Stock-private
-0.009**
(-2.06)
Constant -0.359*** -0.379*** -0.375*** -0.360*** -0.295***
(-6.86) (-5.54) (-5.40) (-5.20) (-4.96)
Firm fixed YES YES YES YES YES
Year dummy YES YES YES YES YES
AR(1) test (p-value) 0.000 0.000 0.000 0.000 0.000
AR(2) test (p-value) 0.887 0.911 0.903 0.903 0.869
Hansen J-stat 0.544 0.455 0.367 0.461 0.242
F-stat 45.10 44.44 43.18 41.70 37.85
Number of pooled observations 26035 26035 26035 26035 26035
Number of firms 2172 2172 2172 2172 2172
Note: Results reported in this table have been obtained using system GMM estimations using the two-step estimation
including the Windmeijer correction to the reported standard errors. The lagged dependent variable, the M&A and the
firm variables are instrumented. Year dummies are not reported. AR1 and AR2 report the p-values of the tests for
first-order and second-order serial correlation in the first-differenced residuals. The Hansen statistic reports the p-
value of the Hansen test of over-identifying restrictions. Data is for 2000–2012. Robust standard errors are in
parentheses.
⁎⁎⁎,⁎⁎,⁎ denotes significance at the 1%, 5% and 10% level, respectively.
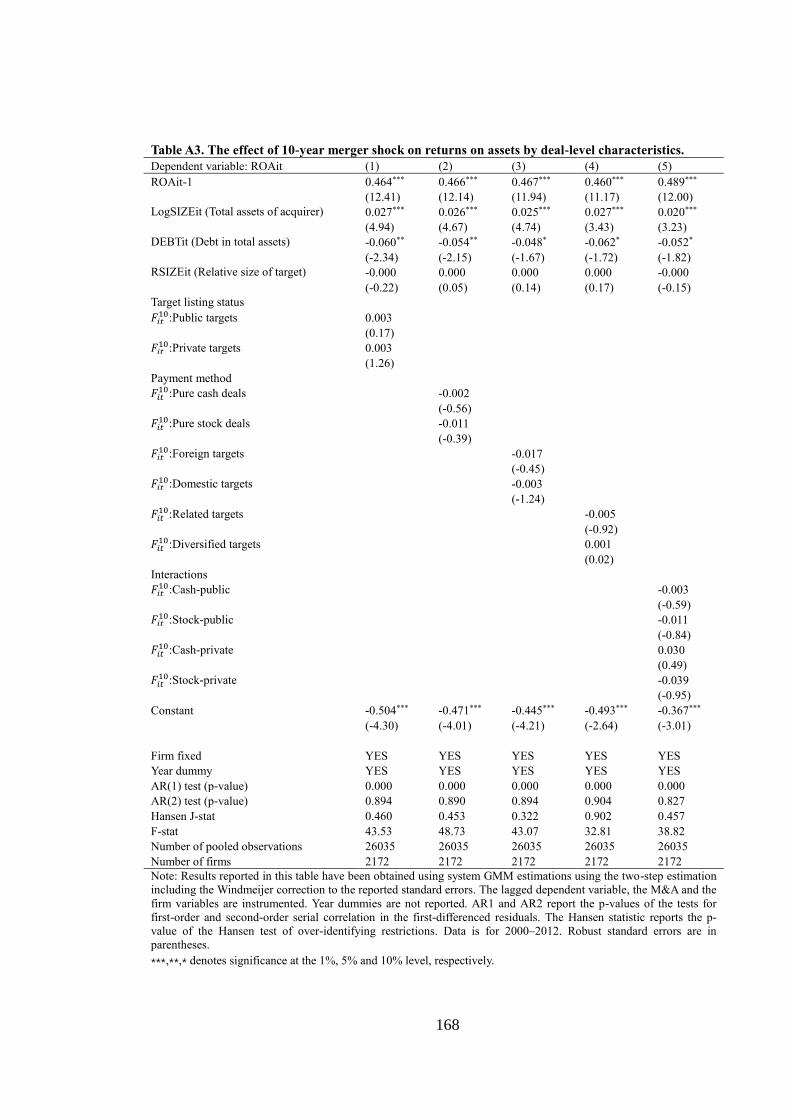
168
Table A3. The effect of 10-year merger shock on returns on assets by deal-level characteristics.
Dependent variable: ROAit (1) (2) (3) (4) (5)
ROAit-1 0.464*** 0.466*** 0.467*** 0.460*** 0.489***
(12.41) (12.14) (11.94) (11.17) (12.00)
LogSIZEit (Total assets of acquirer) 0.027*** 0.026*** 0.025*** 0.027*** 0.020***
(4.94) (4.67) (4.74) (3.43) (3.23)
DEBTit (Debt in total assets) -0.060** -0.054** -0.048* -0.062* -0.052*
(-2.34) (-2.15) (-1.67) (-1.72) (-1.82)
RSIZEit (Relative size of target) -0.000 0.000 0.000 0.000 -0.000
(-0.22) (0.05) (0.14) (0.17) (-0.15)
Target listing status
𝐹𝑖𝑡10:Public targets 0.003
(0.17)
𝐹𝑖𝑡10:Private targets 0.003
(1.26)
Payment method
𝐹𝑖𝑡10:Pure cash deals
-0.002
(-0.56)
𝐹𝑖𝑡10:Pure stock deals
-0.011
(-0.39)
𝐹𝑖𝑡10:Foreign targets
-0.017
(-0.45)
𝐹𝑖𝑡10:Domestic targets
-0.003
(-1.24)
𝐹𝑖𝑡10:Related targets
-0.005
(-0.92)
𝐹𝑖𝑡10:Diversified targets
0.001
(0.02)
Interactions
𝐹𝑖𝑡10:Cash-public
-0.003
(-0.59)
𝐹𝑖𝑡10:Stock-public
-0.011
(-0.84)
𝐹𝑖𝑡10:Cash-private
0.030
(0.49)
𝐹𝑖𝑡10:Stock-private
-0.039
(-0.95)
Constant -0.504*** -0.471*** -0.445*** -0.493*** -0.367***
(-4.30) (-4.01) (-4.21) (-2.64) (-3.01)
Firm fixed YES YES YES YES YES
Year dummy YES YES YES YES YES
AR(1) test (p-value) 0.000 0.000 0.000 0.000 0.000
AR(2) test (p-value) 0.894 0.890 0.894 0.904 0.827
Hansen J-stat 0.460 0.453 0.322 0.902 0.457
F-stat 43.53 48.73 43.07 32.81 38.82
Number of pooled observations 26035 26035 26035 26035 26035
Number of firms 2172 2172 2172 2172 2172
Note: Results reported in this table have been obtained using system GMM estimations using the two-step estimation
including the Windmeijer correction to the reported standard errors. The lagged dependent variable, the M&A and the
firm variables are instrumented. Year dummies are not reported. AR1 and AR2 report the p-values of the tests for
first-order and second-order serial correlation in the first-differenced residuals. The Hansen statistic reports the p-
value of the Hansen test of over-identifying restrictions. Data is for 2000–2012. Robust standard errors are in
parentheses.
⁎⁎⁎,⁎⁎,⁎ denotes significance at the 1%, 5% and 10% level, respectively.

169
Appendix B
Table B1. The effect of 1-year lagged merger frequency on current firm performance.
(1) (2) (3) (4) (5) (6) (7) (8) (9)
Dependent variable: ROAit ROAit ROAit LPit LPit LPit COAit COAit COAit
Dependent variableit-1 0.471*** 0.483*** 0.491*** 0.700*** 0.707*** 0.737*** 0.530*** 0.534*** 0.495***
(12.31) -11.81 -11.26 (9.12) -9.04 -6.38 (9.52) -9.69 -10.63
LogSIZEit-1 (Total assets of acquirer) 0.022*** 0.016*** 0.009* 0.046*** 0.038*** 0.042** 0.020*** 0.021*** 0.019***
(4.51) -4.1 -1.86 (2.73) -2.63 -2.4 (3.86) -4.94 -3.4
DEBTit-1 (Debt in total assets) -0.047*** -0.039** -0.041** -0.065 -0.068 0.040 -0.025 -0.021 -0.027
(-2.66) (-2.30) (-2.52) (-1.56) (-0.73) -0.37 (-0.94) (-0.81) (-1.02)
RSIZEit-1 (Relative size of target) -0.002** -0.002* -0.001 -0.033*** -0.018*** 0.001 -0.002* -0.002 0.000
(-2.04) (-1.69) (-1.18) (-3.05) (-4.27) -1.36 (-1.71) (-1.46) (-0.33)
𝐹𝑖𝑡−11 (Frequency of 1-year shock) -0.006***
-0.069*
-0.006***
(-2.68)
(-1.84)
(-2.74)
𝐹𝑖𝑡−14 (Frequency of 4-year shock)
-0.004**
-0.017**
-0.005**
(-2.26)
(-2.54)
(-2.35)
𝐹𝑖𝑡−110 (Frequency of 10-year shock) -0.001 -0.002 -0.003
(-0.57) (-0.44) (-1.63)
Constant -0.389*** -0.287*** -0.124 3.116*** 2.908*** 2.448* -0.386*** -0.393*** -0.356***
(-4.08) (-3.52) (-1.30) (3.69) -2.98 -1.84 (-3.56) (-4.64) (-3.13)
Firm fixed YES YES YES YES YES YES YES YES YES
Year dummy YES YES YES YES YES YES YES YES YES
AR(1) test (p-value) 0.000 0.000 0.000 0.000 0.000 0.000 0.000 0.000 0.000
AR(2) test (p-value) 0.995 0.955 0.841 0.486 0.864 0.959 0.341 0.356 0.404
Hansen J-stat 0.547 0.316 0.330 0.205 0.304 0.200 0.491 0.537 0.458
F-stat 43.62 41.74 36.25 384.6 411.2 498.0 29.46 30.64 43.16
Number of pooled observations 26034 26034 26034 23880 23563 23563 25944 25944 25944
Number of firms 2172 2172 2172 2156 2146 2146 2169 2169 2169
Note: Results reported in this table have been obtained using system GMM estimations using the two-step estimation including the Windmeijer correction to the reported standard errors. The
lagged dependent variable, the M&A and the firm variables are instrumented. Year dummies are not reported. AR1 and AR2 report the p-values of the tests for first-order and second-order serial
correlation in the first-differenced residuals. The Hansen statistic reports the p-value of the Hansen test of over-identifying restrictions. Data is for 2000–2012. Robust standard errors are in
parentheses.⁎⁎⁎,⁎⁎,⁎ denotes significance at the 1%, 5% and 10% level, respectively.
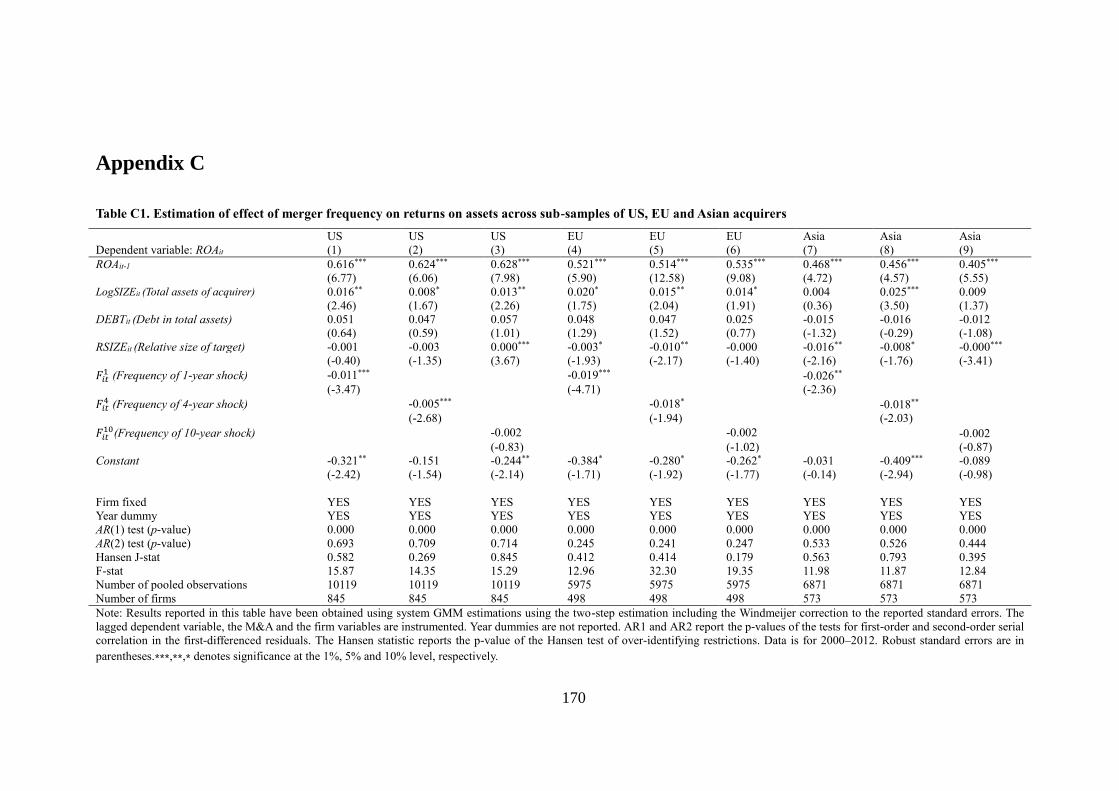
170
Appendix C
Table C1. Estimation of effect of merger frequency on returns on assets across sub-samples of US, EU and Asian acquirers
US US US EU EU EU Asia Asia Asia
Dependent variable: ROAit (1) (2) (3) (4) (5) (6) (7) (8) (9)
ROAit-1 0.616*** 0.624*** 0.628*** 0.521*** 0.514*** 0.535*** 0.468*** 0.456*** 0.405***
(6.77) (6.06) (7.98) (5.90) (12.58) (9.08) (4.72) (4.57) (5.55)
LogSIZEit (Total assets of acquirer) 0.016** 0.008* 0.013** 0.020* 0.015** 0.014* 0.004 0.025*** 0.009
(2.46) (1.67) (2.26) (1.75) (2.04) (1.91) (0.36) (3.50) (1.37)
DEBTit (Debt in total assets) 0.051 0.047 0.057 0.048 0.047 0.025 -0.015 -0.016 -0.012
(0.64) (0.59) (1.01) (1.29) (1.52) (0.77) (-1.32) (-0.29) (-1.08)
RSIZEit (Relative size of target) -0.001 -0.003 0.000*** -0.003* -0.010** -0.000 -0.016** -0.008* -0.000***
(-0.40) (-1.35) (3.67) (-1.93) (-2.17) (-1.40) (-2.16) (-1.76) (-3.41)
𝐹𝑖𝑡1 (Frequency of 1-year shock) -0.011***
-0.019***
-0.026**
(-3.47)
(-4.71)
(-2.36)
𝐹𝑖𝑡4 (Frequency of 4-year shock)
-0.005***
-0.018*
-0.018**
(-2.68)
(-1.94)
(-2.03)
𝐹𝑖𝑡10(Frequency of 10-year shock)
-0.002
-0.002 -0.002
(-0.83)
(-1.02) (-0.87)
Constant -0.321** -0.151 -0.244** -0.384* -0.280* -0.262* -0.031 -0.409*** -0.089
(-2.42) (-1.54) (-2.14) (-1.71) (-1.92) (-1.77) (-0.14) (-2.94) (-0.98)
Firm fixed YES YES YES YES YES YES YES YES YES
Year dummy YES YES YES YES YES YES YES YES YES
AR(1) test (p-value) 0.000 0.000 0.000 0.000 0.000 0.000 0.000 0.000 0.000
AR(2) test (p-value) 0.693 0.709 0.714 0.245 0.241 0.247 0.533 0.526 0.444
Hansen J-stat 0.582 0.269 0.845 0.412 0.414 0.179 0.563 0.793 0.395
F-stat 15.87 14.35 15.29 12.96 32.30 19.35 11.98 11.87 12.84
Number of pooled observations 10119 10119 10119 5975 5975 5975 6871 6871 6871
Number of firms 845 845 845 498 498 498 573 573 573
Note: Results reported in this table have been obtained using system GMM estimations using the two-step estimation including the Windmeijer correction to the reported standard errors. The
lagged dependent variable, the M&A and the firm variables are instrumented. Year dummies are not reported. AR1 and AR2 report the p-values of the tests for first-order and second-order serial
correlation in the first-differenced residuals. The Hansen statistic reports the p-value of the Hansen test of over-identifying restrictions. Data is for 2000–2012. Robust standard errors are in
parentheses.⁎⁎⁎,⁎⁎,⁎ denotes significance at the 1%, 5% and 10% level, respectively.

171
5. Conclusions
5.1. Findings and contributions
Many empirical studies have attempted to identify the impacts of mergers and
merger frequency on the acquiring firm’s performance (e.g. Fuller et al., 2002; Ismail,
2008; Billett and Qian; 2008). Most of these studies found that M&A activities have a
negative effect on a firm’s performance. If this result is true, why do firms still pursue
takeovers? Why have M&A activities been prevalent all over the world? The
contradiction between research findings and business activities in the real world
motivates our study.
The results of this thesis paint a different picture of the effect of acquisitions,
particularly frequent acquisition, on the performance of acquiring firms in the
worldwide framework of corporate finance. Merger strategy or merger frequency
doubtlessly played an increasingly important role in business growth and the success of
corporations from both the investor and the decision maker’s perspective. Unlike earlier
studies, the empirical analysis in this thesis shows that mergers and acquisitions have
not only created wealth but also business failure.
This thesis examined merger effect taking into account the impact of merger
frequency on the acquiring firm’s performance from both short-term and long-term
perspectives. It conducts short term univariate and multivariate analysis of the effect of
merger frequencies on the expectation of investors have about the integration of a new
business and its effect on performance in the future. Findings from the univariate
analysis in the Chapter 2 emphasize the distinction of the creation of synergy, and
division of gains between acquirers with different merger frequencies from an investor

172
perspective. Based on comparative results of announcement returns, acquiring firms
with a higher merger frequency are found to perform worse than ones with a lower
merger frequency. This finding is consistent and robust across different time lengths,
different regions, different time periods, different ownerships of target firms, different
size of deals and different payment methods made by the acquirers. The chapter also
shows that announcement returns for acquiring firms decline after the first deal,
indicating that the market reacts more strongly to the first deal.
These significant findings provide clear evidence of how the acquiring
managements or firms may develop hubris from their previously successful experiences
on mergers and acquisitions. The development of hubris with more mergers drives
down the expectation of investors for better performance in the future of the new
integration, thus lowering the value of the firm. This result also suggests that although it
is expected that the performance of acquiring firms will decline after their first deal or
second deals of mergers due to growing hubris in M&A, this does not mean that the
management learning effect shall be rejected.
Chapter 3 is about the short-run multivariate analysis extends the research of
frequent acquisition by examining how frequency affects stock performance in two
dimensions: number and time. This chapter develops a new method of defining the
merger frequency that interacts the number of mergers with the time that a merger effect
may last after the event occurrence. It employs a more internationally representative
sample with control of firm specific fixed effects.
Based on these research settings, it is found that the negative effect of the short
term and medium term merger frequency decreases over time and may become
insignificant. This suggests that two managerial behaviours co-exist. More specifically,
173
the negative effects of hubris on performance of acquiring firm may be offset or
weakened by positive effects developed from increasingly managerial learning which
drives up the market expectation for the future improvement of new integration. If the
time interval between the two mergers pursued by the firm is longer, the learning effect
is expected to be stronger. These findings also imply that due to the joint effect of
managerial behaviours the shock of a merger to announcement returns may not last
permanently. In addition, it is found that the larger size of a merger has a positive effect
on performance. This suggests that acquirers will be more careful about dealing with a
larger acquisition as they may expose the firm to a high risk of devastating the business
if the integration fails. This creates a risk pressure on management because any failure
of a large acquisition may cause a difficulty for the acquiring firms in using its existing
resources to absorb or digest the large acquisition.
If the difficulty is beyond the capability of the acquiring firm to overcome, it can
result in the ruination of the existing business of the firm. In considering potential risks,
any decision maker or shareholder of the firm will be much more cautious and careful in
pursuing large acquisitions than the small ones, as the risk of the small size of the deal
could be relatively easier for the acquiring firm to control or absorb. Therefore, this
study argues that the pressure of the high risk drives the firm to perform better in large-
size acquisitions. This is different from the argument by Moeller et al. (2004) who
explain the size effect from the perspective of acquirer size.
The thesis also looks at the merger impacts from a fundamental perspective in
the long term. Findings from the last chapter show the relation between merger
frequency and acquirer’s operational performance is both negative and significant. The
strength of the negative effect diminishes over time. More importantly, the effect of
merger frequency reverses in a long-term process: improving firm profitability for
single acquirers. However, for multi-acquirers, it appears that the performance effect of
frequency changes from stronger to weaker over time. Based on these findings, this
174
chapter extends the existing digesting theory (McCarthy, 1963) and the chewing theory
(Kusewitt, 1985) into a dynamic context in arguing merger shocks and frequency: the
effect changes with time.
Part of this dynamic argument is consistent with both existing digesting theory
(McCarthy, 1963) and chewing theory (Kusewitt, 1985) that the negative effect of
merger frequency relates to the number of acquisitions. It is so called “biting off more
than you can chew”. However, when time is taken into account in the process of
digestion, it is found that the longer process helps the firm gradually absorb the shocks
of frequent acquisition, and then allows it to create more corporate synergies for
business operation. This is, “time helping chew”. In addition, these findings also have
important implications for management strategies related to M&A. To maximize the
wealth of investors, and companies’ performance, it is optimal or more appropriate to
consider not only merger quantity of targets but also the time length between
acquisitions. All in all, a key message of this dynamic argument for merger effects is
that both merger quantity and time play a role in affecting post-merger performance.
5.2. Recommendations for future research
The findings of this thesis pose a great and complex challenge to researchers in
the field of M&A studies for a need to continue studying in depth and breadth. Several
areas of future research are in demand. Firstly, a larger sample is needed to validate the
findings. For example, the thesis limited the research sample to public companies. It
would be useful to explain greater variation in performance of frequent acquisition by
repetition of the research using a sample of M&A deals by private companies. In
addition, it would be useful to assess the effect of M&A deals with lower value
comparing to those used in the thesis.
175
Secondly, the thesis limited the merger dataset to a span from 2000 to 2010. The
future research could usefully extend this time period because there may be a more
complex relation between merger actives and firm performance in the longer term.
When a longer sample period is used, a relation that this thesis has not revealed may be
found, for instance a U-shaped relationship.
Thirdly, additional research studies should directly examine the relation between
announcement returns and fundamental performance. This thesis has shown that both
CARs and operational performance decrease with more mergers. Based on this
consistent movement, it will be better to develop a more focused and extensive
investigation of the nexus between cumulative abnormal returns and the fundamentals
of acquiring firms.
5.3. An exception in practice
For the last twenty years many scholars have attempted to examine the link
between frequent acquisitions and acquirer’s performance. However, this relation is still
unclear. Most of researchers and practitioners in various disciplines have stated that
frequent acquisitions are value destructive. It is interesting to question if more mergers
really do drive down the performance of acquiring firms in reality. The understanding
that the world is complex with many and unknown variables should not discourage
scientific endeavour. Although, the findings of the thesis have found that acquirers are
generally suffering losses or at best only breakeven when making frequent acquisitions,
there are still some frequent acquirers that are exceptions in practice. For instance,
Mittal Steel, the world largest steel company.

176
To illustrate this point some performance measures for Mittal Steel are plotted
(See Appendix A). It is found that there are a number of consistent variations for those
measures along with number of M&As over the time. This suggests that frequent
acquisitions could be able to drive significant growth for a business. However, based on
the findings of this thesis, it is clear that the view drawn from this single case study
cannot be generalized to other cases.
5.4. Implications
Taken together, findings of the thesis suggest clear implications for business
development. Firstly, acquisition facilitates growth of business but more or frequent
acquisitions can lead to grow at a higher cost or expense more profits. Secondly,
acquiring firms should not rush aggressively to acquire their next targets. Thirdly, firms
should carefully evaluate and select which of merger strategies will provide them with
the expected growth.
Overall, the thesis highlights the mergers and acquisitions can help and support
the firm but also can create adverse effect on firm’s performance. It contributes to the
literature on studies of merger and acquisition and develops new understanding about
acquisition strategy in relation to firm performance.
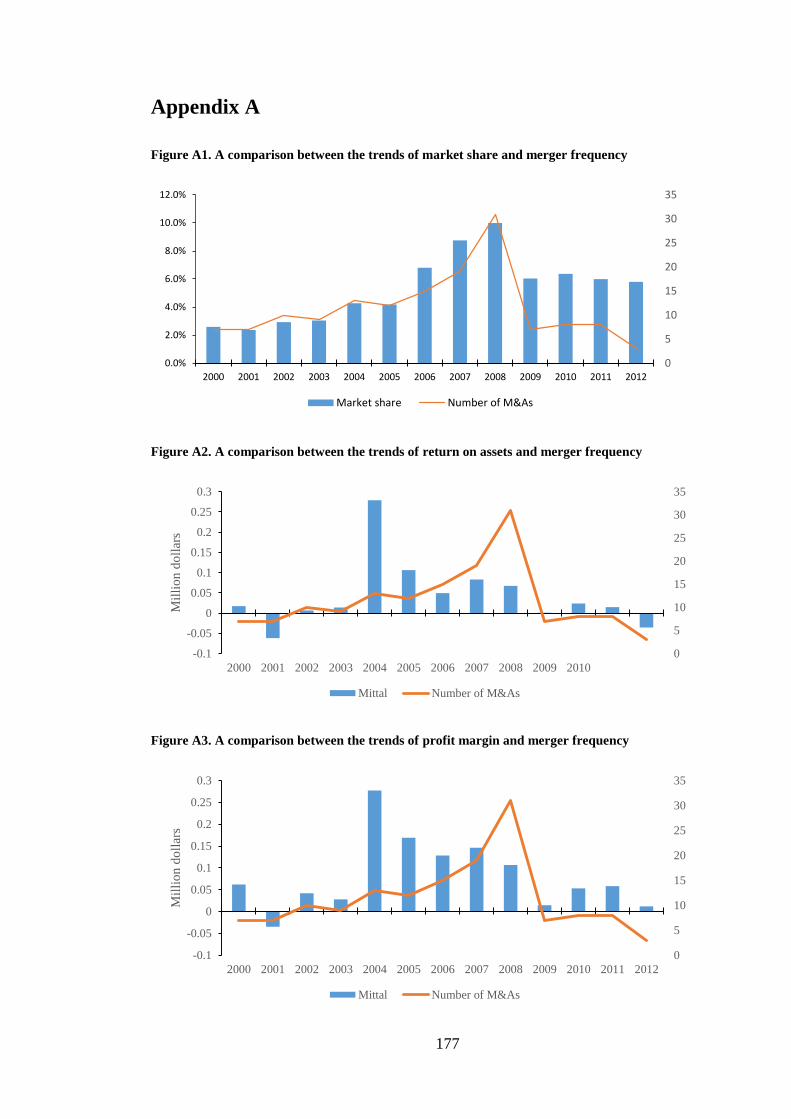
177
Appendix A
Figure A1. A comparison between the trends of market share and merger frequency
Figure A2. A comparison between the trends of return on assets and merger frequency
Figure A3. A comparison between the trends of profit margin and merger frequency
0
5
10
15
20
25
30
35
0.0%
2.0%
4.0%
6.0%
8.0%
10.0%
12.0%
2000 2001 2002 2003 2004 2005 2006 2007 2008 2009 2010 2011 2012
Market share Number of M&As
0
5
10
15
20
25
30
35
-0.1
-0.05
0
0.05
0.1
0.15
0.2
0.25
0.3
2000 2001 2002 2003 2004 2005 2006 2007 2008 2009 2010
Mil
lio
n d
oll
ars
Mittal Number of M&As
0
5
10
15
20
25
30
35
-0.1
-0.05
0
0.05
0.1
0.15
0.2
0.25
0.3
2000 2001 2002 2003 2004 2005 2006 2007 2008 2009 2010 2011 2012
Mil
lio
n d
oll
ars
Mittal Number of M&As
178
References
A Fiegenbaum, A Karnani. “Output flexibility-a competitive advantage for small firms.”
Strategic Management Journal, 1991.
A Ginsberg, JAC Baum. “The value of learning by doing: acquisition experience and
profitability.” Working paper,New York University, 1998.
A Ismail, A Krause. “Determinants of the method of payment in mergers and
acquisitions.” The Quarterly Review of Economics and Finance, 2010.
A, Singh. “Takeovers, economic natural selection and the theory of the firm: Evidence
from the post-war United Kingdom experience.” The Economic Journal 85,
1975: 497–515.
A. Seth, K.P. Song, R. Pettit. “Synergy, managerialism or hubris? An empirical
examination of motives for foreign acquisitions of U.S. firms.” Journal of
International Business Studies, 2000: 387–405.
Agrawal, A., Jaffe, J. F., & Mandelker, G. N. “The post-merger performance of
acquiring firms: A reexamination of an anomaly.” Journal of Finance, 47, 1992:
pp.1605-1621.
Akerlof, George A. “The Market for “Lemons”: Quality Uncertainty and the Market
Mechanism.” Quarterly Journal of Economics, 1970: 488-500.
AL, Pablo. “Determinants of acquisition integration level: a decision-making
perspective.” Academy of Management Journal, 1994: 803–836.
179
Amburger T.L., Miner A.S. “Strategic momentum: The effects of repetitive, positional,
and contextual momentum on merger activity.” Strategic Management Journal,
1992: 13-15.
Andrade, G., Mitchell, M., Stafford, E. “New evidence and perspectives on mergers.”
Journal of Economic Perspectives 15, 2001: 103-120.
AP Dickerson, HD Gibson and E Tsakalotos. “The impact of acquisitions on company
performance: Evidence from a large panel of UK firms.” Oxford Economic
Papers, 1997: 344-361.
Ashkenas, R. N., DeMonaco, L. J., & Francis, S. C. “Making the deal real: How GE
Capital integrates acquisitions.” Harvard Business Review 76, 1998: 165-178.
Asquith, P., Bruner, R., Mullins, D.,. “The gains to bidding firms from merger.” Journal
of Financial Economics 11 (April), 1983: 121-39.
Atul Gupta1, and Lalatendu Misra. “Deal Size, Bid Premium, and Gains in Bank
Mergers: The Impact of Managerial Motivations.” Financial Review, 2007: 373–
400.
B.Espen Eckbo, Vojislav Maksimovic, Joseph Williams. “Consistent estimation of
cross-sectional models in event-studies.” Review of Financial Studies, 3, 1990:
343–366.
Ball, R. and P. Brown,. “An Empincai Evaluation of Accounting Income Numbers.”
Journal of Accounting Research 6, 1968: 159-178.
Bargeron, Leonce L., Frederik P. Schlingemann, Rene ́ M. Stulz, and Chad J. Zutter.
“Why do private acquirers pay so little compared to public acquirers?” Journal
of Financial Economics, 2008: 375–390.
180
Barkema, H. G., Bell, J. H. J., & Pennings, J. M. “Foreign entry, cultural barriers, and
learning.” Strategic Management Journal, 17, 1996: 151-166.
BC Ayers, CE Lefanowicz, JR Robinson. “The effect of shareholder-level capital gains
taxes on acquisition structure.” The Accounting Review, 2004.
Berg, B. L. Qualitative research methods for the social sciences (7th ed.). Boston:
Allyn & Bacon, 2009.
Berger, PG , Ofeck. “Diversification’s effect on firm value.” Journal of Financial
Economics Vol. 37, 1995: 39-65.
Bertrand, O.; Betschinger, M. “Performance of domestic and cross-border acquisitions:
Empirical evidence from Russian acquirers.” Journal of Comparative
Economics, 40, 2012: 413-437.
Betton S., Espen Eckbo B. ,Thorburn K.S. “Corporate takeoversHandbook.” Handbook
of Corporate Finance, 2008.
Billett, M.T. and Y. Qian. “Are Overconfident CEOs Born or Made? Evidence of Self-
Attribution Bias from Frequent Acquirers.” Management Science 54, 2008:
1037-1051.
BM Barber, JD Lyon . “Detecting abnormal operating performance: The empirical
power and specification of test statistics.” Journal of financial Economics, 1996.
Bond, SR. “Dynamic panel data models: a guide to micro data methods and practice.”
Portuguese economic journal, 2002.
Booth, L.,Aivazian, V., Demirguc-Kunt, A.E. and Maksimovic, V. “Capital structure in
developing countries.” Journal of Finance 56, 2001: 87-130.
181
Boubakri, N., J.-C.Cosset, and Saffar, W. “The role of state and foreign owners in
corporate risk-taking: Evidence from privatization.” Journal of Financial
Economics, 2012.
Bower, Gordon H and Hilgard, Ernest R. Theories of learning. Englewood Cliffs:
Prentice-Hall, 1981.
Bremner, B. Zachary, S. “The age of consolidation.” Business Week, 1991: 86–94.
Brown, David T., and Michael D. Ryngaert. “The mode of acquisition in takeovers:
Taxes and asymmetric information, .” Journal of Finance 46, 1991: 653–669.
Brown, S., and J. Warner. “Measuring security price performance.” Journal of
Financial Economics 8, 1980: 205-258.
Brown, S., and J. Warner. “Using daily stock returns: The case of event studies.”
Journal of Financial Economics 14, 1985: 3-31.
Bruner, RF. “Does M&A pay? A survey of evidence for the decision-maker.” Journal of
Applied Finance, 2002.
Bruton, G. D., Oviatt, B. M., & White, M. A. “Performance of acquisitions of distressed
firms.” Academy of Management Journal 37, 1994: 972-989.
Buono,A.F.; J.L. Bowditch; J.W. Lewis. “When cultures collide:The anatomy of a
merger.” Human Relations,38, 1985: pp. 477-500.
C Higson, J Elliott. “Post-takeover returns: The UK evidence.” Journal of Empirical
Finance, 1998: 27–46.
C Tuch, N O'Sullivan . “The impact of acquisitions on firm performance: A review of
the evidence.” International Journal of Management Reviews, 2007.
182
Cairns, RD. “Reflections on Learner's index of monopoly power.” Review of Industrial
Organization, 1995: 83-96.
Capron, L. “The long-term performance of horizontal acquisitions.” Strategic
Management Journal, 1999: 987–1018.
Capron, L. & Shen, J. “Acquisitions of private versus public firms: Private information,
target.” Strategic Management Journal 28, 2007: 891-911.
Carline NF, Linn SC, Yadav V. “The Influence of Managerial Ownership on the Real
Gains in Corporate Mergers and Market Revaluation of Merger Partners:
Empirical Evidence.” Working paper, 2002.
Cartwright, S. “‘Mergers and Acquisitions: An Update.” International Review of
Industrial and Organizational Psychology, 2005: 1–38.
Caves, RE. “Mergers, takeovers, and economic efficiency: Foresight vs. hindsight.”
International Journal of Industrial Organization, 1989.
CC Markides, CD Ittner. “Shareholder benefits from corporate international
diversification: Evidence from US international acquisitions.” Journal of
International Business Studies, 1994.
Chang, S. “Takeovers of privately held targets, method of payment, and bidder returns.”
Journal of Finance, 1998: 773−784.
Chatterjee, S. “Types of synergy and economic value: The impact of acquisitions on
merging and rival firms.” Strategic Management Journal, 1986.
Clark, K; Ofek, E. “Mergers as a means of restructuring distressed firms: an empirical
investigation.” Journal of Financial and Quantitative Analysis, 1994: 541-565.

183
Cohen, W. M. & Levinthal, D. A. “Absorptive capacity: A new perspective on learning
and innovation.” Administrative Science Quarterly, 35, 1990: 128-152.
Cox, A. J., Portes, J. “Mergers in Regulated Industries: the Uses and Abuses of Event
Studies.” Journal of Regulatory Economics 14, 1998: 281-304.
Croci, Ettore. “Why do managers make serial acquisitions? An investigation of
performance predictability in serial acquisitions.” working papers, 2005.
D, Kuehn. Takeovers and the Theory of the Firm. London: Macmillan, 1975.
Daniel, Kent D., David Hirshleifer, and Avanidhar Subrahmanyam. “Investor
psychology and security market under- and over-reactions.” Journal of Finance
53, 1998: 1839–1886.
DB Jemison, SB Sitkin . “Corporate acquisitions: A process perspective.” Academy of
Management Review, 1986.
DC Hambrick, AA Cannella. “Relative standing: A framework for understanding
departures of acquired executives.” Academy of Management Journal, 1993.
Deeds, D. L., DeCarolis, D. and Coombs, J. “Dynamic capabilities and new product
development in high technology ventures: An empirical analysis of new
biotechnology firms.” Journal of Business Venturing, 1999: 211-229.
Deng, P. “Outward investment by Chinese MNCs: Motivations and implications.”
Business Horizons, 2004: 8–16.
Dirk Hackbarth, Erwan Morellec. “Stock Returns in Mergers and Acquisitions.” The
Journal of Finance, 2008: 1213–1252.

184
DJ Ravenscraft, FM Scherer. “Life after takeover.” The Journal of Industrial Economics,
1987: pp 147-156.
DK Oler, JS Harrison, MR Allen. “The danger of misinterpreting short-window event
study findings in strategic management research: an empirical illustration using
horizontal acquisitions.” Strategic Organization, 2008: 151-184.
Dodd, P. “The market for corporate control and stockholder wealth.” 1980.
Dolley, James Clay. “Characteristics and Procedure of Common Stock Split-Ups.”
Harvard Bus. Rev, 1933: 316–26.
Draper, P. and Paudyal, K. “Acquisitions: Private versus public.” European Financial
Management, 12, 2006: 57-80.
DS Sharma, J Ho. “The impact of acquisitions on operating performance: some
Australian evidence.” Journal of Business Finance & Accounting, 2002: 155-
200.
E Herman, L Lowenstein. The efficiency effects of hostile takeovers. Oxford University
Press, 1988.
E, Dietrich JK and Sorensen. “An application of logit analysis to prediction of merger
targets.” Journal of Business Research 12, 1984: 393–402.
E.F. Fama, M.H. Miller. The theory of finance. New York: Holt, Rinehart and Winston,
1972.
E.Kauper, Thomas. St. John's Law Review Vol. 74: Iss. 2, Article 2., 2000.
EF Fama, KR French. “Value versus growth: The international evidence.” The Journal
of Finance, 1998.

185
Eisenhardt, KM. “Agency theory: An assessment and review.” Academy of management
review, 1989.
Elton, Edwin J and Gruber, Martin J. Modern portfolio theory and investment analysis.
John Wiley & Sons, 1987.
Faccio, M., and Masulis, R.W.,. “The choice of payment method in European mergers
and acquisitions.” Journal of Finance 60, 2005: 1345–1388.
Faccio, M., McConnell, J. J, and Stolin, D.,. “Returns to Acquirers of Listed and
Unlisted Targets.” Journal of Financial and Quantitative Analysis 41, 2006:
197‐220.
Faccio, Mara, and Larry H. P. Lang. “The ultimate ownership of western European
corporations,.” Journal of Financial Economics, 65, 2002: 365–395.
Fama, E. “Ecient capital markets: a review of theory and empirical work.” Journal of
Finance 25, 1969: 383-417.
Fama, E., and K. French. “Common risk factors in the returns on stocks and bonds.”
Journal of Financial Economics 33, 1992: 3-56.
Feinberg, R. M. “Sales-at-risk: A test of the mutual forbearance theory of conglomerate
behavior.” Journal of Business, 58, 1985: pp. 225-241.
Firth, M. “Perceptions of Auditor Independence and Official Ethical Guidelines.”
Accounting review, 1980: 451-466/http://www.jstor.org/stable/246407.
Fishman, Michael J.,. “Preemptive bidding and the role of the medium of exchange in
acquisitions.” Journal of Finance 44, 1989: 41-57.
186
Fowler, K. L. & Schmidt, D. R. “Determinants of tender offer post-acquisition financial
performance.” Strategic Management Journal 10, 1989: 339-350.
Franks, N. R., Gomez, N., Goss, S. & Deneubourg, J.-L. “The blind leading the blind in
army ant raid patterns: testing a model of self-organisation.” J.Insect Behav,
1991: 583–607.
Fuller, K.P., Netter, J. and M. Stegemoller. “What do returns to acquiring firms tell us?
Evidence from firms that make many acquisitions.” Journal of Finance 57, 2002:
1763–1794.
Fumagalli, E. and Vasconcelos, H. “Sequential Cross-border Mergers.” International
Journal of Industrial Organization, 2009: 175–187.
G Ahuja, R Katila. “Technological acquisitions and the innovation performance of
acquiring firms: A longitudinal study.” Strategic management journal, 2001.
G DeLong, R DeYoung . “Learning by observing: Information spillovers in the
execution and valuation of commercial bank M&As.” The Journal of Finance,
2007.
G. Alexandridis, D. Petmezas andN.G. Travlos. “Gains from Mergers and Acquisitions
Around the World: New Evidence.” Financial Management, 2010: 1671–1695.
Gaspar, J., Massa, M.,. “Idiosyncratic volatility and product market competititon.”
Journal of Business, 79, 2006: pp.3125-3152.
Gaughan, PA. Mergers: what can go wrong and how to prevent it. John Wiley& Sons,
Inc, 2005.
Gaughan, Patrick A. Mergers, Acquisitions, and Corporate Restructurings. John
Wiley& Sons, Inc., 2010.

187
Gaur, A., Malhotra, S., Zhu, P. “Acquisition announcement and stock market valuation
of rivals: A test of growth probability hypothesis.” Strategic Management
Journal, 34, 2013: 215-232.
Gervais, Simon, and Terance Odean. “Learning to be overconfident.” Review of
Financial 14, 2001: 1-27.
Ghosh, A. “Does operating performance really improve following corporate
acquisitions?” Journal of Corporate Finance 7, 2001: 151-178.
Grinblatt, M; Titman, S. Financial markets and corporate strategy. McGraw-Hill, 2002.
Haleblian, J. and Finkelstein, S. “The influence of organization acquisition experience
on acquisition performance: A behavioral learning theory perspective.”
Administrative Science Quarterly, 44, 1999: 29-56.
Hansen, Robert G.,. “A theory for the choice of exchange medium in mergers and
acquisitions.” Journal of Business 60, 1987: 75-95.
Hayward, Mathew L. A. “When do firms learn from their acquisition experience?
Evidence from 1990 to 1995.” Strategic Management Journal, 2002: 21-39.
Healy, P.M., Palepu, K.G. and R.S Ruback. “Does Corporate Performance Improve
After Mergers?” Journal of Financial Economics 31, 1992: 135-175.
Hietala, P., S. Kaplan and D. Robinson. “What is the Price of Hubris? Using Takeover
Battles to Infer Overpayments and Synergies.” Financial Management, 2003: 5-
31.
Hitt, M. A., Harrison, J., Ireland, R. D., & Best, A. “Attributes of successful and
unsuccessful acquisitions of US firms.” British Journal of Management, 9, 1998:
91-114.

188
Hogarty, TF. “The profitability of corporate mergers.” Journal of Business, 1970.
Holtz-Eakin, W. Newey, H. Rosen. “Estimating vector autoregressions with panel data.”
Econometrica, 56, 1988: 1371-1395.
Hoskisson, R., Hitt, M., & Hill, C. “Managerial incentives and investment in R&D in
large multiproduct multiproduct.” Organization Science, 1993: 325–341.
Huber, GP. “Organizational learning: The contributing processes and the literatures.”
Organization science, 1991: 88-115.
Huselid, Mark A. “The Impact of Human Resource Management Practices on Turnover,
Productivity, and Corporate Financial Performance.” The Academy of
Management Journal, 1995: 635-672.
Ichniowski, C. “Manufacturing businesses.” NBER working paper series no. 3449, Na-
tional Bureau of Economic Research, 1990: Cambridge, MA.
Ismail, Ahmad. “Which acquirers gain more, single or multiple? Recent evidence from
the USA market.” Global Finance Journal 19, 2008: 72-84.
J Harrison, PC Godfrey. “Do event studies predict acquisition success? An empirical
test.” Annual Academy of Management Conference, 1997.
J Ishii, Y Xuan. “Acquirer-target social ties and merger outcomes.” Journal of
Financial Economics, 2014.
J Ma, JA Pagan, Y Chu. “Abnormal Returns to Mergers and Acquisitions in Ten Asian
Stock Markets.” International Journal of Business, 2009.
JA Doukas, D Petmezas. “Acquisitions, Overconfident Managers and Self‐attribution
Bias.” European Financial Management, 2007.

189
Jabbour, A.R., A. Jalilvand, and J.A. Switzer. “Pre-Bid Price Run-Ups and Insider
Trading Activity: Evidence from Canadian Acquisitions.” International Review
of Financial Analysis 9, 2000: 21-43.
Jane Linder, Dwight Crane. “Bank mergers: Integration and profitability.” Harvard
Business School, Boston,Working paper, 1991.
Jensen, M. “Agency cost of free cash flow, corporate finance and takeovers.” American
Economic Review Papers and Proceedings, 1986: 323-329.
Jensen, M. C., & Ruback, R. S. “The market for corporate control: The scientific
evidence.” Journal of Financial Economics, 11, 1983: 5-50.
Jensen, Michael C. “Takeovers: Their Causes and Consequences.” The Journal of
Economic Perspectives, 1988: 21-48.
JH Mulherin, AL Boone. “Comparing acquisitions and divestitures.” Journal of
Corporate Finance, 2000: 117–139.
JM Campa, I Hernando. “Shareholder Value Creation in European M&As.” European
Financial Management, 2004: 47-81.
John, K., Freund, S., Nguyen, D., Vasudevan, G.K.,. “Investor protection and cross-
border acquisitions of private and public targets.” Journal of Corporate Finance,
2010: 259-275.
K Gugler, DC Mueller, BB Yurtoglu, C Zulehner. “The effects of mergers: an
international comparison.” International Journal of Industrial Organization,
2003: 625-653.
Kaplan, S. N., and Weisbach, M. S. “The success of acquisitions: Evidence from
divestitures.” Journal of Finance 47, 1992: 107–138.
190
Karen E. Lahey, Robert L. Conn. “Sensitivity of Acquiring Firms' Returns to
Alternative Model Specifications and Disaggregation.” Journal of Business
Finance & Accounting, 1990: 421–439.
KG, Palepu. “Predicting takeover targets: A methodological and empirical analysis.”
Journal of Accounting and Economics 8, 1986: 3-35.
Koeplin J, Sarin A, Shapiro AC. “The private company discount.” Journal of applied
corporate finance 12, 2000: 94-101.
Kooli, M., Kortas, M., and L’Her, J. F. “A new examination of the private company
discount.” Journal of Private Equity, 2003: 48-55.
KP Ramaswamy; JF Waegelein. “Firm financial performance following mergers.”
Review of Quantitative Finance and Accounting, 2003: 115-126.
Kroll, M. and S. Caples. “Application of the arbitrage pricing model to the strategic
business unit acquisition process.” Academy of Management Review, 1987.
Kruse, T.A., Park, H.Y., Park, K., Suzuki, K.I. The value of corporate diversification:
evidence from post-merger performance in Japan. AFA 2003 Washington, 2002.
Kusewitt, J. B. “An exploratory study of strategic acquisition factors relating to
performance.” Strategic Management Journal, 6, 1985: 151-169.
L Bengtsson, R Larsson. “Researching Mergers & Acquisitions with the Case Study
Method: Idiographic Understanding of Longitudinal Integration Processes.”
Handbook of Research on Mergers and Acquisitions, 2012.
L, Sirower Mark. The synergy trap: How companies lose the acquisition game. The
Free Press, 1997.
191
Larry Lang, Rene M. Stulz, Ralph Walking. “Managerial performance, Tobin's q and
the gains from successful tender offers.” Journal of Financial Economics, 1989:
137–154.
Lee, J. “Does Size Matter in Firm Performance? Evidence from US Public Firms.”
International Journal of the Economics of Business, 2009.
Lerner, A. “The Concept of Monopoly and the Measurement of Market Power.” Review
of Economic Studies 1, 1934: 157-175.
Linda Argote, Sara L. Beckman and Dennis Epple. “The persistence and transfer of
learning in industrial settings.” Management Science, 1990: 140–154.
Linn, S., and Switzer, J. “Are cash acquisitions associated with better post combination
operating performance than stock acquisitions?” Journal of Banking and
Finance, vol, 2000: 1113-1138.
Loderer and Martin. “Corporate Acquisitions by Listed Firms: The Experience of a
Comprehensive Sample.” Financial Management 19, 1990: 17-33.
M Arellano; O Bover. “Another look at the instrumental variable estimation of error-
components models.” Journal of econometrics, 1995: 29–51.
M Bradley, A Desai, H Kim. “The rationale behind interfirm tender offers: Information
or synergy?” Journal of Financial Economics, 1983: 183–206.
M Burkart, F Panunzi. “Takeovers.” ECGI-Finance working paper, 2006.
M Hall, L Weiss. “Firm size and profitability.” The Review of Economics and Statistics,
1967.
M Harris, A Raviv. “The theory of capital structure.” The Journal of Finance, 1991.
192
M Swink, R Narasimhan, C Wang. “Managing beyond the factory walls: effects of four
types of strategic integration on manufacturing plant performance.” Journal of
Operations Management, 2007.
M, Alcade N and Espitia. “The characteristics of takeover targets: The Spanish
experience 1991-1997.” Journal of Management and Governance 7, 2003: 1-26.
M. Arellano, S.R. Bond. “Some tests of specification for panel data: Monte Carlo
evidence and an application to employment equations.” Review of Economic
Studies, 58, 1991: 277-297.
M. Barclay, C. Smith. “The maturity structure of debt.” Journal of Finance, 50, 1995a:
609–631.
M. Barclay, C. Smith. “The priority structure of corporate liabilities.” Journal of
Finance, 50, 1995b: 899–918.
M. Erickson, S. Wang. “Earnings management by acquiring firms in stock for stock
mergers.” Journal of Accounting and Economics, 1999: 149 - 176.
M. Harris, A. Ravi. “Corporate control contests and capital structure.” Journal of
Financial Economics, 1988: 55–86.
M. Kamien, I. Zang. “Monopolization by Sequential Acquisition.” The Journal of Law,
Economics, and Organization 9, 1993: 205-229.
MA Hitt, RD Ireland, JS Harrison. “Mergers and acquisitions: A value creating or value
destroying strategy.” The Blackwell handbook of strategic management, 2001.
MacKinlay, A.C. “Event studies in economics and finance.” Journal of Economic
Literature 35, 1997: 13-39.
193
Malmendier, U., & Tate, G. “Who makes acquisitions? CEO overconfidence and the
market reaction.” Journal of Financial Economics, 89, 2008: 20-43.
Malmendier, Ulrike and Tate, Geoffrey A. “CEO overconfidence and corporate
investment.” Working Paper,, 2003.
Marks, M.L. & Mirvis, P.H. “Joining Forces: Making One Plus One Equal Three in.”
Jossey-Bass, San Francisco, CA, 1998.
Martin, J.C. “The Productivity and Wage Effects of Foreign Acquisition in the United
Kingdom.” Journal of Industrial Economics 50, 2002: 85-102.
Martin, Kenneth J. “The method of payment in corporate acquisitions, investment
opportunities, and management ownership.” Journal of Finance, 51, 1996:
1227–1246.
Martin, Stephen. “The Misuse of Accounting Rates of Return: Comment.” The
American Economic Review, 1984.
Martynova, M. & Renneboog, L.D.R.,. “The Performance of the European Market for
Corporate Control: Evidence from the 5th Takeover Wave.” Discussion Paper ,
2006.
Mats Bergman;Malcolm B. Coate;Maria Jakobsson;Shawn W. Ulrick . “Comparing
Merger Policies in the European Union and the United States.” Review of
Industrial Organization, Vol. 36, 2010 .
McCarthy, J. “Situations, actions, and causal laws.” Technical Report, Stanford
Artificial Intelligence Project: Memo 2, 1963.
McNamee, M. “Are fewer banks better?” Business Week August, 17 , 1992: pp. 92–93.
194
Meehan, J. “Banking gets leaner and meaner.” Business Week, 1989: 106–107.
—. “Banks will learn to salt it away.” Business Week, 1990: 113.
Meehan, J., Wooley, S., Hawkins, C., Schiller, Z. “If mergers were simple, banking's
troubles might be over.” Business Week, 1991: 77–79.
Meeks, G. Disappointing marriage: A study of the gains from merger. Cambridge
University Press, 1977.
Michael C. Jensen, William H. Meckling. “Theory of the firm: Managerial behavior,.”
Journal of Financial Economics, 3, 1976.
Michael Lubatkin. “Mergers and the Performance of the Acquiring Firm.” Academy of
Management Review, 1983: 218-225.
Milton Harris and Artur Raviv. “Some Results on Incentive Contracts with Applications
to Education and Employment, Health Insurance, and Law Enforcement.” The
American Economic Review, 1978.
ML Mitchell, K Lehn. “Do bad bidders become good targets?” Journal of Political
Economy, 1990: 372-398.
Moeller, S., Schlingemann, F., & Stulz, R. “Firm size and the gains from acquisitions.”
Journal of Financial Economics, 73, 2004: 201−228.
Mueller, DC. “Mergers and market share.” The Review of Economics and statistics,
1985: 259-267.
Mueller, Dennis C. “The effects of conglomerate mergers: A survey of the empirical
evidence.” Journal of Banking and Finance, 1977: 315-347.
195
Mueller, Dennis C. “Mergers and market share.” Review of Economics and Statistics, 67,
1980: 259–267.
Myers, S., Majluf, N. “Corporate financing and investment decisions when firms have
information that investors do not have.” Journal of Financial Economics, 13,
1984: 187−221.
Myers, SC. “Determinants of corporate borrowing.” Journal of financial economics,
1977.
Narjess Boubakri, Andrew Chan and Maher Kooli . “Are the Busiest Really the Best?
Further Evidence from Frequent Acquirers.” Journal of Multinational Financial
Management, 2012.
NG Travlos, A Saunders, E Strock, . “Ownership structure, deregulation, and bank risk
taking.” The Journal of Finance, 1990.
Nilssen, Tore and Lars Sorgard. “Sequential Horizontal Mergers.” European Economic
Review, 1998: 1683–1702.
Ofek, E. “Capital structure and firm response to poor performance: An empirical
analysis.” Journal of Financial Economics, 1993.
Officer, M. S., A. B. Poulsen, and M. Stegemoller. “Target-firm information asymmetry
and acquirer returns.” Review of Finance 13, 2009: 467–493.
Officer, MS. “Are performance based arbitrage effects detectable? Evidence from
merger arbitrage.” Journal of Corporate Finance, 2007.
P Cornu, D Isakov. “The Optimal Strategy of the Initial Bidder in Takeover Contests:
Theory and Empirical Evidence.” European financial management, 2000: 423-
440.
196
P Holl, D Kyriazis. “Wealth creation and bid resistance in UK takeover bids.” Strategic
Management Journal, 1997: 483–498.
P Raghavendra Rau, T Vermaelen. “Glamour, value and the post-acquisition
performance of acquiring firms.” Journal of Financial Economics, 1998: 223–
253.
Paine, F. T. and D. J. Power. “Merger Strategy: A Examination of Drucker's five rules
for Successful Acquisition.” Strategic Management Journal, Vol.5, No.2, 1984:
99-110.
Palich LE, Cardinal LB, Miller CC. “Curvilinearity in the diversification–performance
linkage: An examination over three decades of research.” Strategic Management
21, 2000: 155–174.
Porrini, P. “Can a previous alliance between an acquirer and a target affect acquisition
performance?” Journal of Management, 30, 2004: 545-562.
Porter, M. Competitive Strategy. New York: Free Press, 1980.
Powell, R. and A. Stark. “Does Operating Performance Increase Post-Takeover for UK
Takeovers? A Comparison of Performance Measures and Benchmarks.” Journal
of Corporate Finance, 2005.
Prabhala, NR. “Conditional methods in event studies and an equilibrium justification for
standard event-study procedures.” Review of Financial Studies, 1997: 1-38.
Pritchard, RD. “Organizational productivity.” Handbook of industrial and
organizational psychology, 1992.
R Blundell, S Bond. “Initial conditions and moment restrictions in dynamic panel data
models.” Journal of econometrics, 1998.
197
R Morck, B Yeung . “Internalization: an event study test.” Journal of International
Economics, 1992.
R Narasimhan, SW Kim. “Effect of supply chain integration on the relationship between
diversification and performance: evidence from Japanese and Korean firms.”
Journal of operations management, 2002.
R.A. Brealey, S.C. Myers, F. Allen. Corporate finance. McGraw-Hill Irwin, Boston,
Mass. et al, 2006.
RA, Chatterjee. “The financial performance of companies acquiring very large takeover
targets.” Applied Financial Economics 10, 2000: 185–191.
Rahahleh N. A. and Wei P. P. “The Performance of Frequent Acquirers: Evidence from
Emerging Markets.” Global Finance Journal 23, 2012: 16–33.
Rajgopal, S., Shevlin. “Empirical evidence on the relation between stock option
compensation and risk-taking.” Journal of Accounting and Economics 33, 2002:
145–171.
Ramaswamy, K. “The performance impact of strategic similarity in horizontal mergers:
Evidence from the US banking industry.” Academy of Management Journal, 40,
1997.: 697-715.
Reuer, J., &. Ragozzino, R. “Alliance Dynamics for Entrepreneurial Firms.” Journal of
Management Studies, 2008: 147-168.
Rhoades, Stephen A. “The efficiency effects of bank mergers: An overview of case
studies of nine mergers.” Journal of Banking & Finance, 1998: 273–291.
Robert L Conn , Andy Cosh , Paul M Guest and Alan Hughes. “Why must all good
things come to an end? The performance of multiple acquirers.” 2004.

198
Robert, Terry. “Ten Suggestion for Acquisition Success.” Managerial Planning, 1982:
13-16.
Roll, R. “The hypothesis of corporate takeovers.” Journal of Business 59, 1986: 197-
216.
Roll, R. “The Hubris Hypothesis of Corporate Takeovers.” Journal of Business 59,
1986.
Roodman, D. “A note on the theme of too many instruments*.” Oxford Bulletin of
Economics and Statistics, 2009.
Rovit, C. Lemire. “Your best M&A strategy: Smart deal makers methodically acquire
through good times and bad.” Harvard Business Review, 81, 2003: 16-17.
S Sudarsanam, AA Mahate. “Glamour Acquirers, Method of Payment and Post-
acquisition Performance: The UK Evidence.” Journal of Business Finance &
Accounting, 2003: 299–342.
S. Klasa, M. Stegemoller. “Takeover activity as a response to time-varying changes in
investment opportunity sets: evidence from takeover sequences.” Financial
Management, 36, 2007: 19–43.
S.R. Gubbi, P.S. Aulakh, S. Ray, M.B. Sarkar, R. Chittoor. “Do international
acquisitions by emerging-economy firms create shareholder value: The case of
Indian firms.” Journal of International Business Studies, 2010: 397–418.
Sales,A.L.; P.H. Mirvis. “Acquisition and the collision of cultures.” Managing
Organizational Transitions, 1984.
Sanders, W. G. “Behavioral responses of CEOs to stock ownership and stock option
pay.” Academy of Management Journal 44, 2001: 477–492.

199
Schipper, K. and R. Thompson. “The impact of merger-related.” Journal of Accounting,
1983: 184-221.
Schon, Argyris and. “Organizational Learning: A Theory of Action Perspective.”
Reading, MA: Addison-Wesley Publishing Company, 1978.
Servaes, H. “The value of diversification during the conglomerate merger wave.” The
Journal of Finance, 1996: 1201–1225.
Seth, A. “Value Creation in Acquisitions: A Reexamination of Performance Issues.”
Strategic Management Journal, Vol. 11, 1990: 99-115.
Severiens, JT. “Creating value through mergers and acquisitions: Some motivations.”
Managerial Finance, 1991.
Shaver, JM. “Accounting for endogeneity when assessing strategy performance: Does
entry mode choice affect FDI survival?” Management Science, 1998: 571 - 585.
Shen, J.C., and Reuer, J. . “Adverse selection in acquisitions of small manufacturing
firms: a comparison of public with private targets.” Small Business Economics
24, 2005: 393–407.
Shepherd, W. G. The economics of industrial organization. Prentice-Hall Inc., 1979.
Shleifer, A., Vishny, R.W.,. “Stock market driven acquisitions.” Journal of Financial
Economics 70, 2003: 295–311.
Shona L. Brown and Kathleen M. Eisenhardt. “The Art of Continuous Change: Linking
Complexity Theory and Time-Paced Evolution in Relentlessly Shifting
Organizations.” Administrative Science Quarterly, 1997: 1-34.
Shrivastava, P. “Post-merger Integration.” Journal of Business Strategy, 1986: 65–71.
200
Singh, H. and C. Montgomery. “Corporate Acquisition Strategies and Economic
Performance.” Strategic Management Journal 8, 1987: 377-386.
Siriopoulos C, Georgopoulos A and Tsagkanos A. “Does the market for corporate
control hypothesis explain takeover targets?” Applied Economics Letters 313,
2006: 557–561.
Smith, R.L. and J.H. Kim. “The combined effects of free cash flow and financial slack
on bidder.” Journal of Business, 1994: 281-310.
Song, M.H. and Walking, R.A. “Anticipation acquisitions and the bidder return puzzle.”
Working Paper, 2004.
Stanton, P. “Accounting Rates of Return as Measures of Post-Merger Performance.”
Australian Journal of Management, 1987.
Steiner. Mergers. University of Michigan Press, Ann Arbor, MI, 1975.
Stigler, George J. “Monopoly and Oligopoly by Merger.” American Economic Review,
1950: 23-34.
Sudarsanam, P.S. The essence of mergers and acquisitions. Prentice Hall, 1995.
Switzer, JA. “Evidence on real gains in corporate acquisitions.” Journal of Economics
and Business, 1996: 443-460.
T. Laamanen, T. Keil. “Performance of Serial Acquirers: Toward an Acquisition
Program Perspective.” Strategic Management Journal, 29, 2008: 663-672.
Taub, A.J. “Determinants of the firm's capital structure.” Review of Economics and
Statistics 57, 1975: 410-416.
201
Tischer, S. and Hildebrandt, L. . “Linking Corporate Reputation and Shareholder Value
using the Publication of Reputation Rankings.” Journal of Business Research,
2013.
Trautwein, F. “Merger motives and merger prescriptions.” Strategic Management
Journal, 1990: 283–295.
Travlos, N. “Corporate takeover bids, methods of payment and bidding firm stock
returns.” Journal of Finance, 42, 1987: 943−963.
Vermeulen, F. & Barkema,. “Learning through acquisitions.” Academy of Management
Journal, 44, 2001: 457-476.
Walker, M. Mark. “Corporate Takeovers, Strategic Objectives, and Acquiring-Firm
Shareholder Wealth.” Financial Management, 2000: 53-66.
Wansley, J., Lane, W., Yang, H. “Abnormal Returns to Acquired Firms by Type of
Acquisition and Method of Payment.” Financial Management, Vol. 12, 1983:
16-22.
Werden, G.j. “Demand Elasticities in Antitrust Analysis.” Antitrust Journal 43, 1998:
363-414.
Windmeijer, F. “A finite sample correction for the variance of linear efficient two-step
GMM estimators.” Journal of econometrics, 2005.
Wooldridge, Jeffrey M. “Inverse probability weighted M-estimators for sample
selection, attrition, and stratification.” Portuguese Economic Journal, 2002: 117-
139.
202
Wright, P., Ferris, S., Sarin, A., & Awasthi, V. “Impact of corporate insider,
blockholder, and institutional equity ownership on firm risk taking.” Academy of
Management Journal 39, 1996: 441–463.
Wright, P., Kroll, M., Krug, J., & Pettus, M. “Influence of top management team
incentives on firm risktaking.” Strategic Management Journal 28, 2007: 81–89.
Wright, P., Kroll, M., Lado, A., & Van Ness, B. “The structure of ownership and
corporate acquisition strategies.” Strategic Management Journal 23, 2002: 41–
53.
Yeh, T.M., Hoshino,Y. “Productivity and operating performance of Japanese merging
firms: Keiretsu:related and independent mergers.” Japan and the World
Economy 14, 2002: 347-366.
Z Griliches, JA Hausman. “Errors in variables in panel data.” Journal of econometrics,
1986.