Embed Size (px)
Citation preview
DMAIC – An Overview
Barry Murash MBBit
Nortel
2007
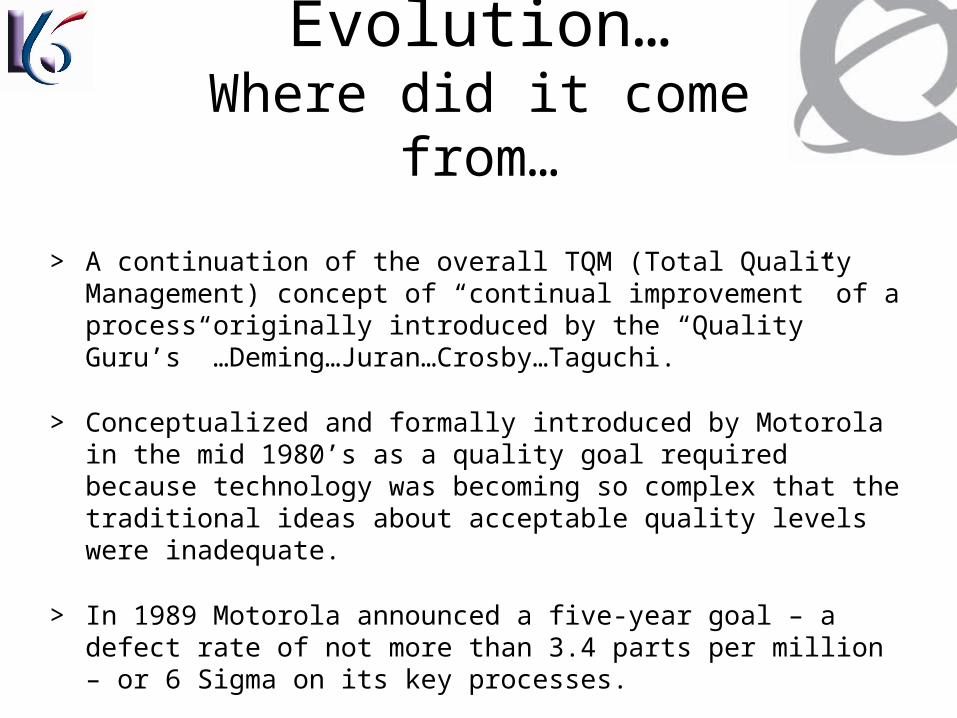
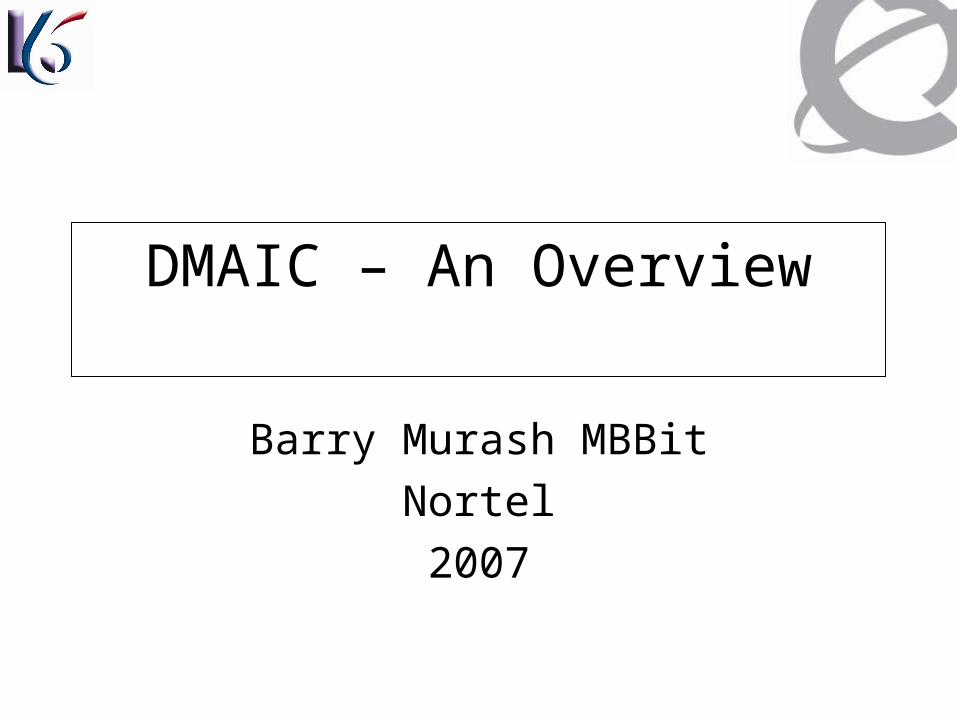
6 Sigma Evolution…Where did it come from…
> A continuation of the overall TQM (Total Quality Management) concept of “continual improvement” of a process originally introduced by the “Quality Guru’s” …Deming…Juran…Crosby…Taguchi.
> Conceptualized and formally introduced by Motorola in the mid 1980’s as a quality goal required because technology was becoming so complex that the traditional ideas about acceptable quality levels were inadequate.
> In 1989 Motorola announced a five-year goal – a defect rate of not more than 3.4 parts per million – or 6 Sigma on its key processes.
By the Numbers . . .
Fortune 500 companies doing Lean Six Sigma 100
Dollars returned compared to dollars invested 8:1
Benefits as a percent of revenue for top companies 5
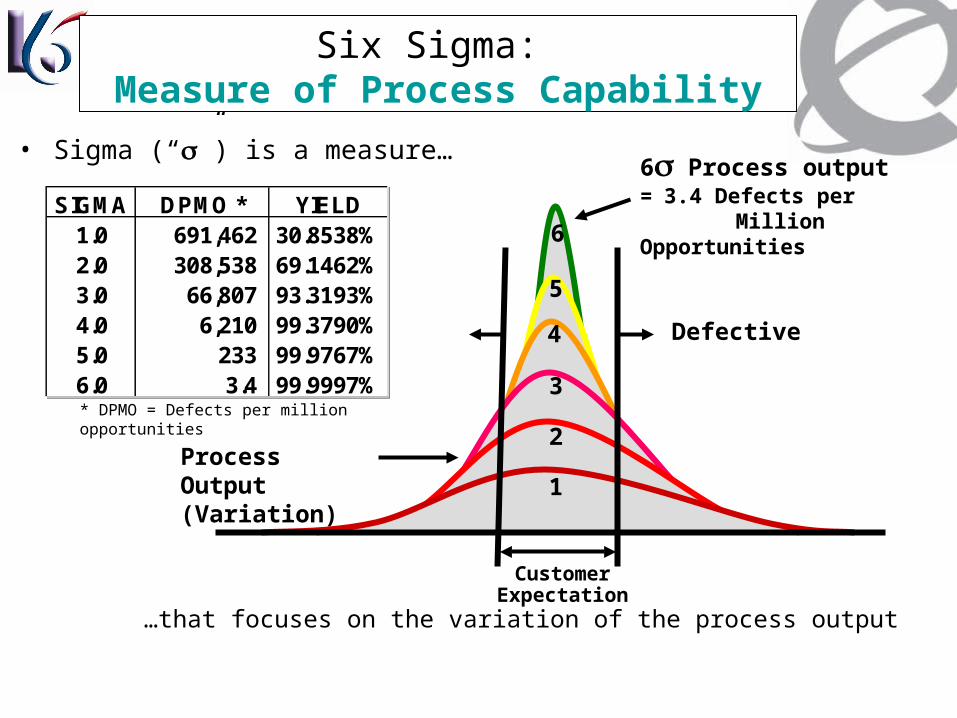
• Sigma (“”) is a measure…
Six Sigma: Measure of Process Capability
* DPMO = Defects per million opportunities
…that focuses on the variation of the process output
Customer Expectation
Defective
Process Output(Variation)
6 Process output= 3.4 Defects per
Million OpportunitiesSIGMA DPMO * YIELD
1.0 691,462 30.8538%2.0 308,538 69.1462%3.0 66,807 93.3193%4.0 6,210 99.3790%5.0 233 99.9767%6.0 3.4 99.9997%
SIGMA DPMO * YIELD1.0 691,462 30.8538%2.0 308,538 69.1462%3.0 66,807 93.3193%4.0 6,210 99.3790%5.0 233 99.9767%6.0 3.4 99.9997%
1
2
3
4
5
6
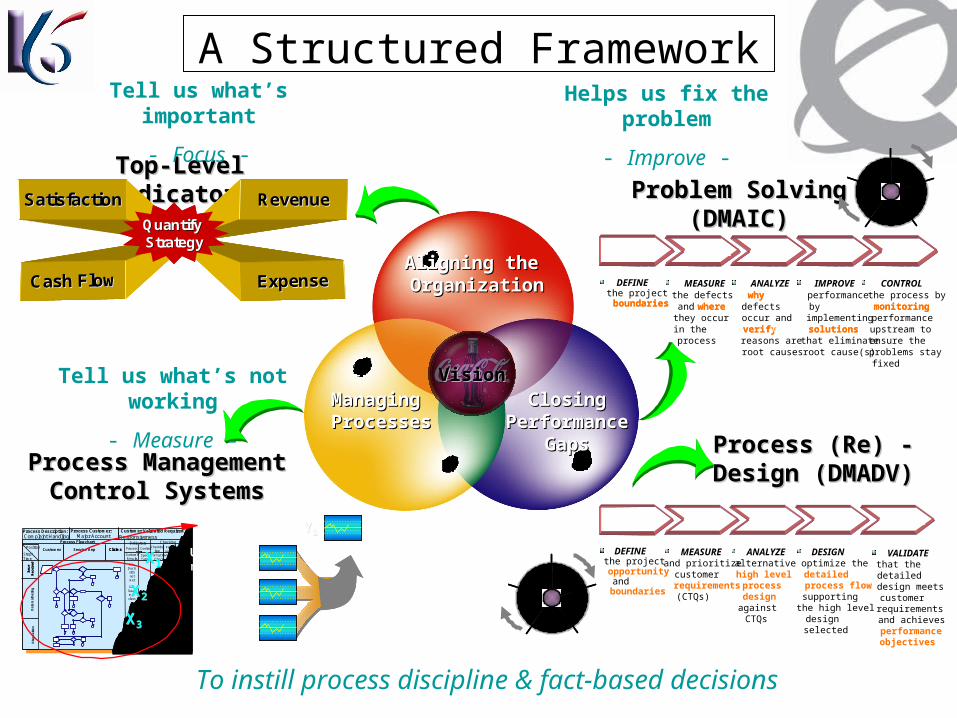
Top-Level IndicatorsTop-Level Indicators
A Structured Framework
RevenueRevenue
ExpenseExpenseCash FlowCash Flow
SatisfactionSatisfaction
Quantify Quantify StrategyStrategy
RevenueRevenue
ExpenseExpenseCash FlowCash Flow
SatisfactionSatisfaction RevenueRevenue
ExpenseExpenseCash FlowCash Flow
SatisfactionSatisfaction
Quantify Quantify StrategyStrategy
Process Management Process Management Control SystemsControl Systems
Problem Solving Problem Solving (DMAIC)(DMAIC)
Process (Re) - Design Process (Re) - Design (DMADV)(DMADV)
1
2
3
4
5DEFINE
MEASURE
ANALYZE
IMPROVE
CONTROL
1
2
3
4
5DEFINE
MEASURE
ANALYZE
IMPROVE
CONTROL
1
2
3
4
5DEFINE
MEASURE
ANALYZE
DESIGN
VALIDATE
1
2
3
4
5DEFINE
MEASURE
ANALYZE
DESIGN
VALIDATE
To instill process discipline & fact-based decisions
ClosingClosingPerformancePerformance
GapsGaps
Aligning theAligning the OrganizationOrganization
Managing Managing ProcessesProcesses
Process Description: Process Customer: Customer Validated Requirem
Process FlowchartPosition
Step/Time
Complaint Handling
Service Rep ClaimsClaimsCustomer
Issu
eR
ecei
ved
Issu
eR
ecei
ved
Dat
a G
ath
erin
gD
isp
osi
tio
n
Major Account ResponsivenessIndicators Checking
Process
OutcomeResults
CheckingItem
Control
Specs/Target
What toCheck
Freq-uencyWhen to
CheckWho
Check
ANDAND
X1= Doc’nstds not met
X2= Issuemis-class
P3= Neg’n stds not met
Q1= W/O not to stds
XX11
XX22
XX33
Upstream measure1
OutcomeIndicator
Upstream measure2
Upstream measure3
YY11
VisionVision
DEFINEthe projectopportunityandboundaries
Define Measure Analyze Design Validate
MEASUREand prioritize customerrequirements(CTQs)
ANALYZEalternativehigh level processdesignagainst CTQs
DESIGN and optimize thedetailed process flowsupporting the high level design selected
VALIDATEthat the detailed design meets customer requirements and achievesperformance objectives
DEFINEthe projectboundaries
Define Measure Analyze Improve Control
MEASUREthe defects and wherethey occur in the process
ANALYZEwhy the defects occur and verify which reasons are root causes
IMPROVEperformance by implementing solutionsthat eliminate root cause(s)
CONTROL the process by monitoringperformance upstream to ensure the problems stay fixed
Tell us what’s important
- Focus -
Tell us what’s not working
- Measure -
Helps us fix the problem
- Improve -
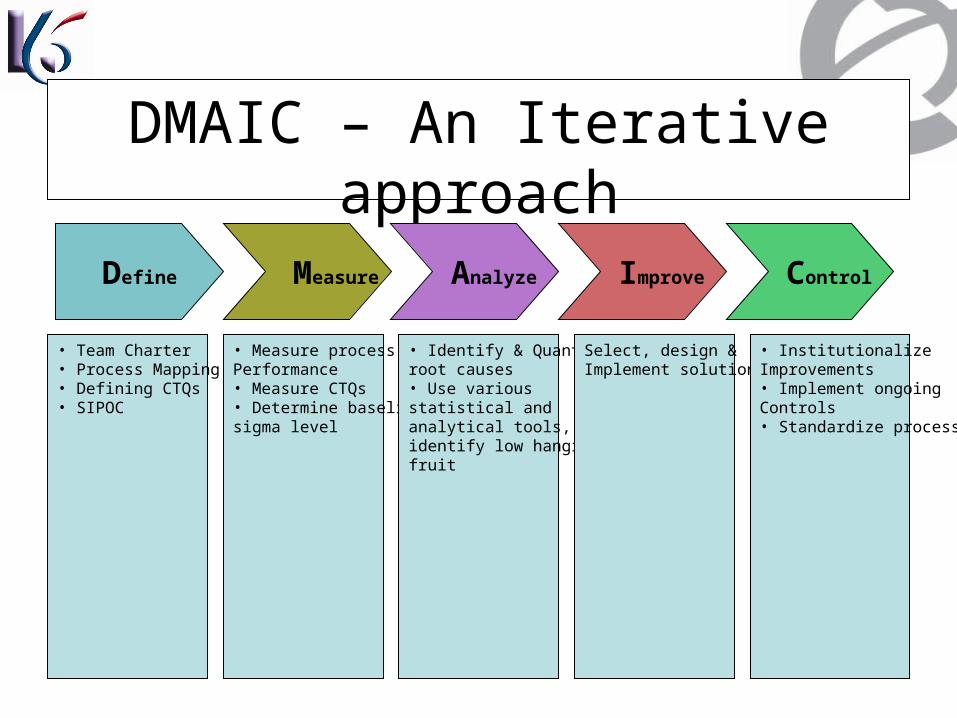
DMAIC – An Iterative approach
Define Measure Analyze Improve Control
• Team Charter• Process Mapping• Defining CTQs• SIPOC
• Measure process Performance• Measure CTQs• Determine baseline sigma level
• Identify & Quantify root causes• Use various statistical and analytical tools, identify low hanging fruit
Select, design & Implement solution
• Institutionalize Improvements• Implement ongoingControls• Standardize process
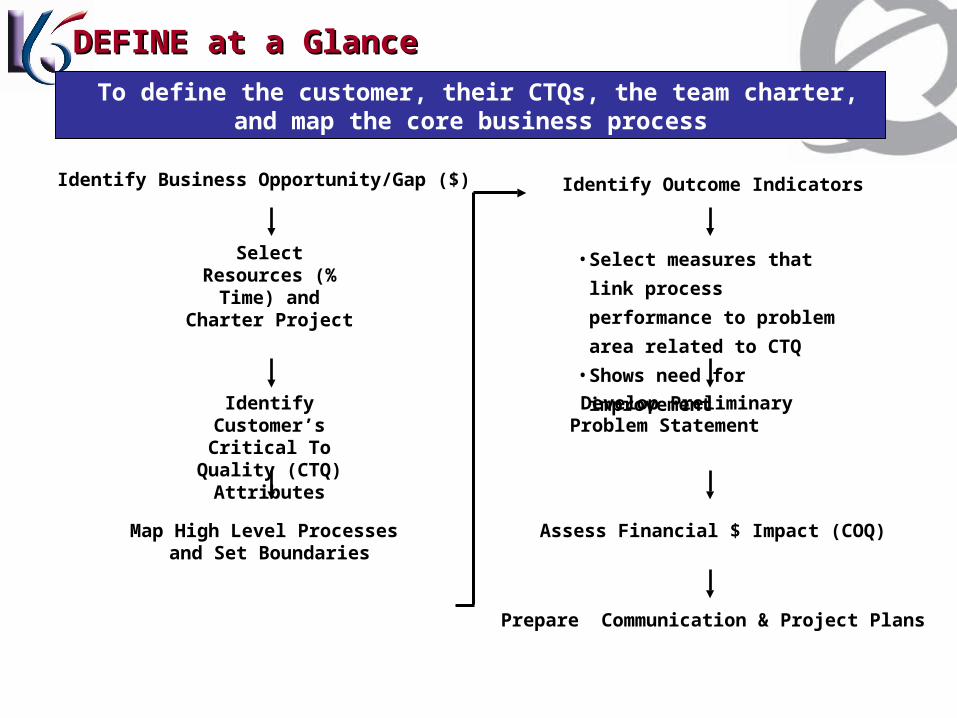
DEFINE at a GlanceDEFINE at a Glance
Identify Business Opportunity/Gap ($)
Identify Customer’s Critical To Quality (CTQ) Attributes
Map High Level Processes and Set Boundaries
• Select measures that link
process performance to
problem area related to CTQ
• Shows need for
improvement
Develop Preliminary Problem Statement
Select Resources (% Time) and
Charter Project
Prepare Communication & Project Plans
Identify Outcome Indicators
To define the customer, their CTQs, the team charter, and map the core business process
Assess Financial $ Impact (COQ)
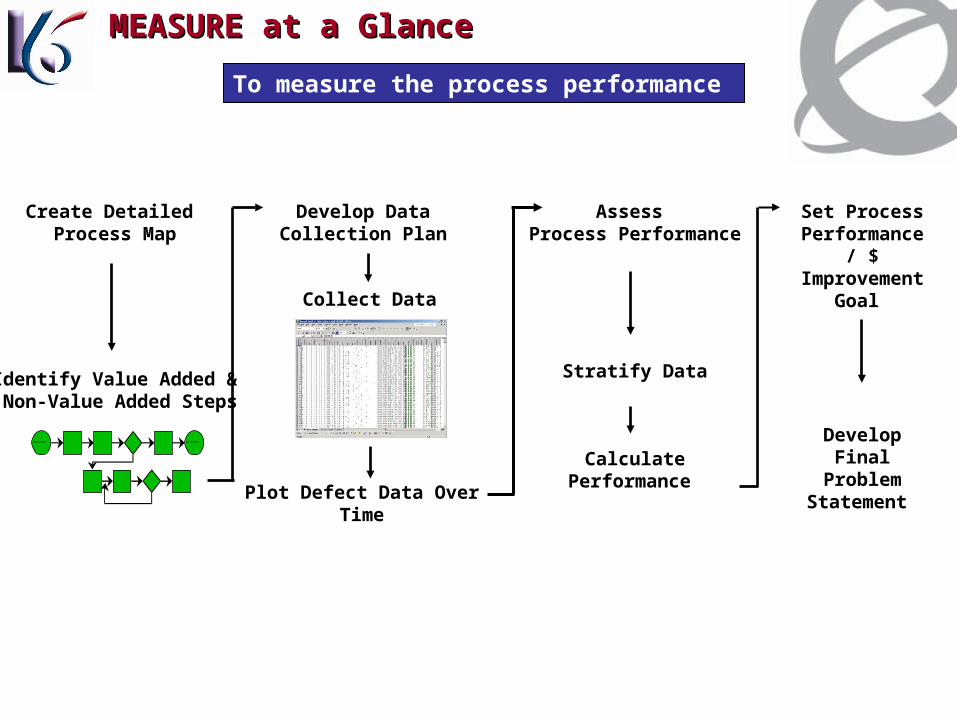
MEASURE at a GlanceMEASURE at a Glance
To measure the process performance
Calculate Performance
Stratify Data
Plot Defect Data Over Time
Develop Data Collection Plan
Create Detailed Process Map
Customer Customer
Identify Value Added & Non-Value Added Steps
Assess Process Performance
Set Process Performance / $
Improvement Goal
DevelopFinal Problem
Statement
Collect Data
Scatter Plots
Y
X
Contingency TableSub Cause
Yes No
Present
NotPresent
Def
ect
55
55
Made the Sale
Did Not Make the Sale
Time With Customer
(in minutes)
5 10 15 20 25 30 3 5 40 45 50 55 60 >60
5 10 15 20 25 30 3 5 40 45 50 55 60 >60
Made the Sale
Did Not Make the Sale
5 10 15 20 25 30 3 5 40 45 50 55 60 >60
5 10 15 20 25 30 3 5 40 45 50 55 60 >60
Time With Customer(in minutes)
5 10 15 20 25 30 3 5 40 45 50 55 60 >605 10 15 20 25 30 3 5 40 45 50 55 60 >60
5 10 15 20 25 30 3 5 40 45 50 55 60 >605 10 15 20 25 30 3 5 40 45 50 55 60 >60
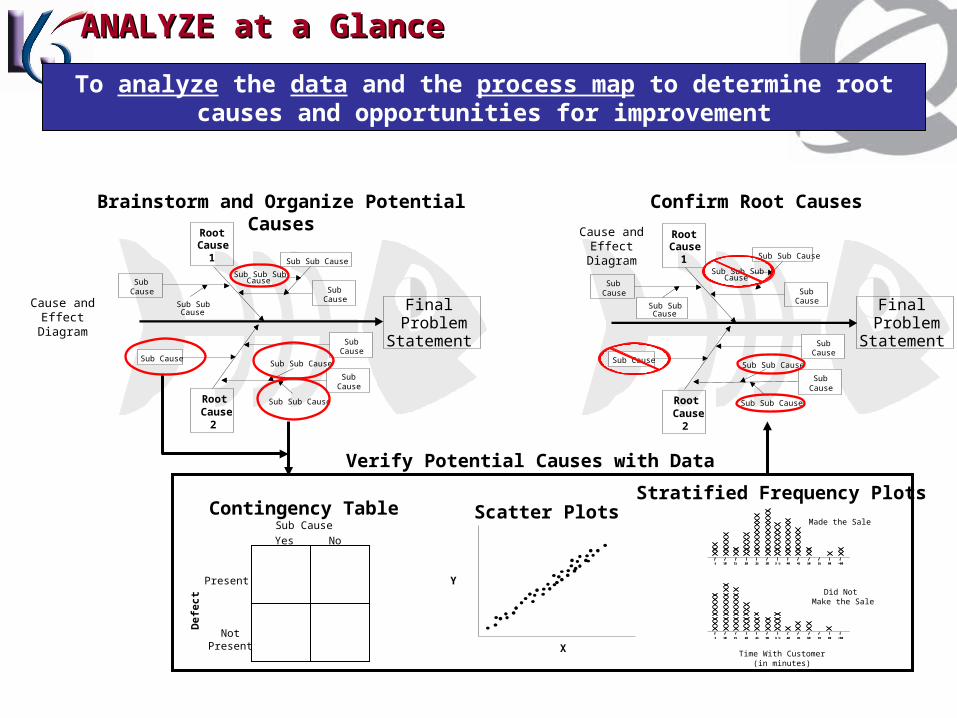
Stratified Frequency Plots
RootCause
1
RootCause
2
SubCause
Sub SubCause
SubCause
Sub Sub Cause
Sub Sub SubCause
SubCause
SubCause
Sub CauseSub Sub Cause
Sub Sub Cause
Cause and Effect
Diagram
Brainstorm and Organize Potential Causes
Verify Potential Causes with Data
Confirm Root Causes
RootCause
1
RootCause
2
SubCause
Sub SubCause
SubCause
Sub Sub Cause
Sub Sub SubCause
SubCause
SubCause
Sub CauseSub Sub Cause
Sub Sub Cause
Cause and Effect
Diagram
Final Problem
Statement
Final Problem
Statement
ANALYZE at a GlanceANALYZE at a Glance
To analyze the data and the process map to determine root causes and opportunities for improvement
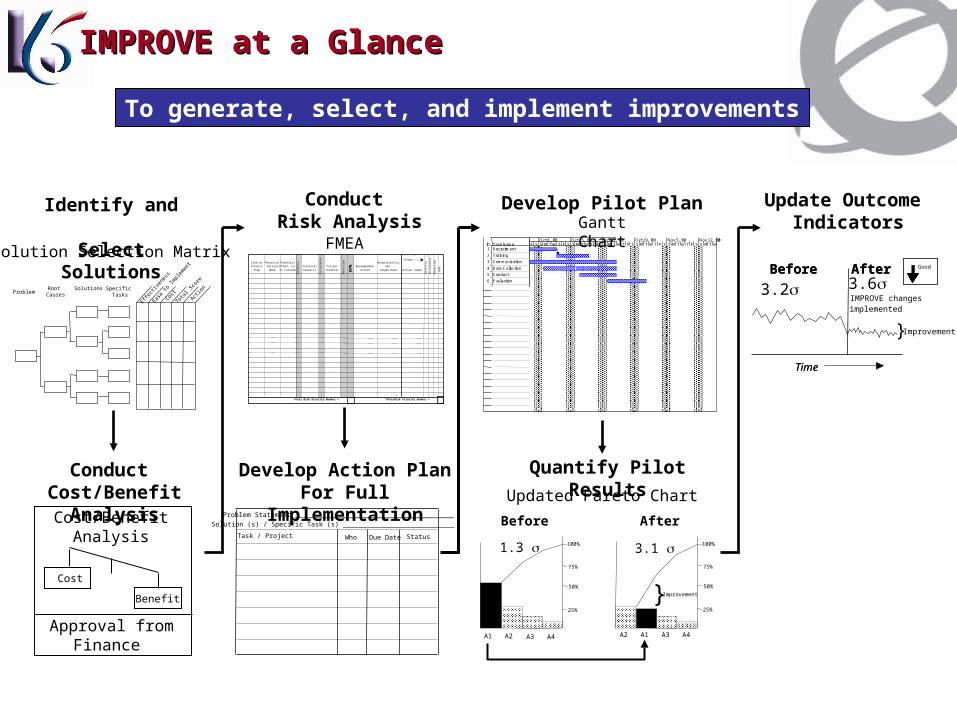
Solution Selection Matrix
Identify and Select
Solutions
Conduct Cost/Benefit Analysis
FMEA
Item or Process
Step
Potential Failure Mode
Potential Effect (s) of Failure
Potential Cause(s)
Current Controls R
PN Recommended
Action
Responsibility and
Target Date Action Taken
Sev
erity
Occ
urre
nce
Det
ectio
n
RP
N
“After”
Sev
erity
Occ
urre
nce
Det
ectio
n
Total Risk Priority Number = “After” Risk Priority Number =
Develop Action Plan For Full Implementation
Conduct Risk Analysis
Develop Pilot Plan
ID Task Name1 Recruitment
2 Training
3 Communication
4 Data Collection
5 Conduct
6 Evaluation
F S S M T W T F S S M T W T F S S M T W T F S S M T W T F S S M T W T F S S M T WOct 8, '00 Oct 15, '00 Oct 22, '00 Oct 29, '00 Nov 5, '00 Nov 12, '00
ID Task Name1 Recruitment
2 Training
3 Communication
4 Data Collection
5 Conduct
6 Evaluation
F S S M T W T F S S M T W T F S S M T W T F S S M T W T F S S M T W T F S S M T WOct 8, '00 Oct 15, '00 Oct 22, '00 Oct 29, '00 Nov 5, '00
ID Task Name1 Recruitment
2 Training
3 Communication
4 Data Collection
5 Conduct
6 Evaluation
F S S M T W T F S S M T W T F S S M T W T F S S M T W T F S S M T W T F S S M T WOct 8, '00 Oct 15, '00 Oct 22, '00 Oct 29, '00 Nov 5, '00 Nov 12, '00
Updated Pareto Chart
Before After
Quantify Pilot Results
Update Outcome Indicators
Before After
IMPROVE changes
implemented
}Improvement
Good
Time
DEFINE
Before After Good
Time
Before After
IMPROVE changes
implemented
Time
} Improvement
3.2 3.6
Cost/Benefit Analysis
Approval from Finance
Cost
Benefit
Solution (s) / Specific Task (s) ____________________________
Problem Statement ________________________________________:
Task / Project Who Due Date Status
Gantt Chart
Cost
ActionProblem
Root Causes
Solutions
Effect
ivene
ssEas
e to
Imple
men
t
Total
Score
Specific Tasks
1.3
A1 A2 A3 A4
} Improvement
A2 A1 A3 A4
3.1
50%
25%
75%
100%
50%
25%
75%
100%
IMPROVE at a GlanceIMPROVE at a Glance
To generate, select, and implement improvements
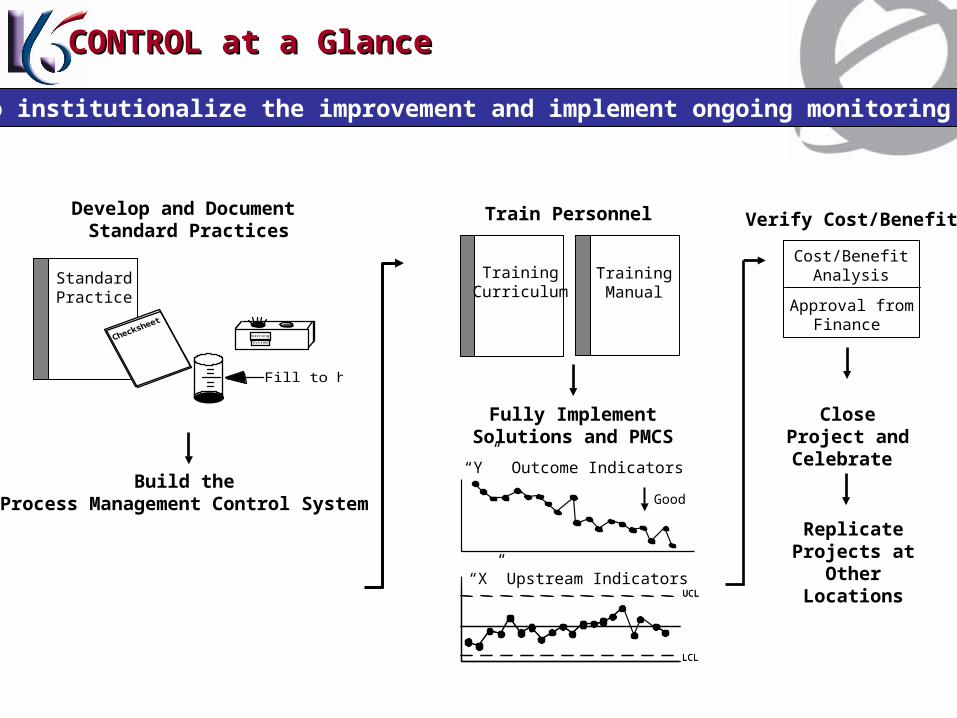
Develop and Document Standard Practices
Train Personnel
TrainingCurriculum
TrainingManual
Build theProcess Management Control System
Fully Implement Solutions and PMCS
Close Project and Celebrate
StandardPractice
Fill to here
Warn ing
Sy s tem
Replicate Projects at Other
Locations
Cost/Benefit Analysis
Approval from Finance
Verify Cost/Benefit
“X” Upstream IndicatorsUCL
LCL
UCL
LCL
“Y” Outcome Indicators
Good
CONTROL at a GlanceCONTROL at a Glance
To institutionalize the improvement and implement ongoing monitoring