Embed Size (px)
Citation preview
1
Diversifying Ethiopia’s Energy Portfolio with Geothermal Energy:
A Benefit-Cost Analysis of the Corbetti Concession’s Potential to Offset
Hydroelectric Overdependence
Energy and Energy Policy
University of Chicago
Paper by: Team 14
Cyrus Adamiyatt, Daniel Kang, Martin Montoya-Olsson,
Romain de Planta, Andrew Song, Justin Shin
2
Table of Contents I. Introduction ................................................................................................................................3
I-i. The Problem: Overdependence on Hydroelectricity ..............................................................3
Methodology.............................................................................................................................4
II. Energy and Energy Policy in Ethiopia ....................................................................................5
II-i. Policy and Trends ..................................................................................................................5
National Energy Policy.............................................................................................................6
Centralized vs. Decentralized Electrification Policy ................................................................9
II-ii. Ethiopia’s Current Energy Status .......................................................................................10
Rising Demand .......................................................................................................................12
Problem of Electrification ......................................................................................................14
Electrical Grid ........................................................................................................................17
III. Icelandic Model of Geothermal Energy ..............................................................................18
III-i. A Geothermal Success Story .............................................................................................18
III-ii. Geological Profile of Iceland and Ethiopia ......................................................................27
IV. Geothermal Prospects in Ethiopia .......................................................................................31
IV-i. Power Africa Initiative ......................................................................................................31
IV-ii. History of Geothermal Energy .........................................................................................32
IV-iii. Current Geothermal Energy and Prospects .....................................................................35
IV-iv. Geothermal Technology ..................................................................................................37
IV-v. Case Study: The Corbetti Concession ..............................................................................38
V. Cost Benefit Analysis ..............................................................................................................42
IV-i. Cost Function Analysis ......................................................................................................42
IV-ii. Geothermal vs. Hydroelectricity LCOEs .........................................................................44
IV-iii. Cost Function: Overall vs. Discounted Projection ..........................................................52
IV-i. Factors of Benefit-Cost Analysis: Geothermal vs. Hydropower .......................................53
IV-ii. Overall Benefit-Cost Analysis ..........................................................................................61
V. Conclusion................................................................................................................................64
3
I. Introduction
I-i. The Problem: Overdependence on Hydroelectricity
As we will show, there are numerous issues the Government of Ethiopia currently is and
will be dealing with regarding electricity access and supply, and there are a variety of possible
policy solutions it can take. One specific problem that resonates within Ethiopian renewables and
energy policy is the energy sector’s apparent overdependence and emphasis on hydropower for
electricity generation. Corroborating this statement, the Ethiopian Electric Power Corporation
has recognized the “risks of overdependence on hydropower, and the need to diversify the
country's energy sources to ensure a stable supply.”1 According to EEPCO’s Mulugeta Asaye,
“rainfall in Ethiopia varies considerably from year to year, therefore an overdependence on
hydropower makes the energy supply very unstable, while instability of supply creates negative
impacts on industry and the economy.”2 As droughts become an increasing phenomenon with the
onset of climate change, Ethiopia’s renewable “second priority”3, geothermal energy, has the
potential to support the existing hydropower infrastructure and provide the diversification that
the country needs. The tangible danger of droughts manifested this year as Ethiopia prepares for
El Nino and its subsequent droughts, reported by the UN weather agency as this year’s El Nino
will be “the worst in more than 15 years.”4 El Nino is a weather phenomenon that “sparks global
climate extremes,”5 and such extreme droughts will have profound adverse effects on not only
the country’s hydropower production, but also the economy as a whole. Given such perceptible
1 Matthew Newsome, “Ethiopia looks to realize its geothermal energy potential,” The Guardian, February 13, 2013,
http://www.theguardian.com/global-development/2013/feb/13/ethiopia-geothermal-energy-potential. 2 Ibid.
3 Ibid.
4 Nina Larson, “El Nino worst in over 15 years, sever impact likely: UN,” Yahoo News, November 16, 2015
https://uk.news.yahoo.com/el-nino-worst-over-15-years-severe-impact-142716273.html#OU51mRr. 5 Ibid.
4
drought risks, are there benefits to be realized if Ethiopia pivots away from hydropower
development to geothermal energy investment, and if so, what is the magnitude of these benefits
from diversification? How long will it take for Ethiopia to realize this diversification benefit?
This paper will extensively examine the varying costs and benefits attached to both technologies,
hydropower and geothermal, and hopefully provide deeper insight into future policy decisions
regarding Ethiopian renewables for the energy sector.
Methodology
We first introduce Ethiopia’s historical and current issues with respect to electricity and
energy generation. In order to provide better contextual understanding as to why Ethiopia should
pursue geothermal energy in particular and not other renewable sources, we then introduce the
country of Iceland and its success with geothermal energy. With a similar geological profile as
Ethiopia, Iceland serves as a model solution for Ethiopia to embody with respect to geothermal
energy development and application. The paper then addresses the prospects of continued
geothermal energy development in Ethiopia, largely through a deep-dive analysis of the Corbetti
project, a historic geothermal plant slated to generate 1,000 MW at its highest potential.
Intimately understanding Corbetti, a geothermal plant already in the midst of development, and
all of its implied financials, energy output, environmental robustness, and economic impact,
allows us to generate a comprehensive cost-and-benefit analysis. Laying out the costs of
geothermal and hydroelectricity in a levelized cost of energy analysis, and modeling the benefits
of diversifying Ethiopia’s energy portfolio, we analyze the potential benefits or costs to pivoting
towards geothermal energy for Ethiopia. We conclude the paper with our findings and any
recommendations for the GoE deriving from our results.
5
II. Energy and Energy Policy in Ethiopia
II-i. Policy and Trends
Ethiopia’s status as “one of the fastest growing economies in the world”6 and its unique
geographical location in the East African Rift provides for a distinct platform to grow hand-in-
hand its energy sector and economy. In academia and in governmental policies, energy
consumption and availability have been interlinked to GDP growth and higher quality of life.
Both private and public enterprises have commented on this distinct relationship. A recent
McKinsey Publication titled “Brighter Africa: The growth potential of the sub-Saharan
electricity sector” determined that “fulfilling the economic and social promise of the region, and
Africa in general, depends on the ability of government and investors to develop the continent’s
huge electricity capacity.”7 The Executive Director of the International Energy Agency, Maria
van der Hoeven, laments the dire need for energy with respect to poverty: “Overall, the energy
sector of sub-Saharan Africa is not yet able to meet the needs and aspirations of its citizens.”8
Evidently, the lack of supply and infrastructure in sub-Saharan Africa vastly outstripping
demand is a common theme for the region, and these reports corroborate the exciting potential of
African natural resources regarding renewable energy. Ethiopia is a unique case study for our
project given the government’s high interest in and commitment to energy infrastructure
6 U.S. Department of State, “Ethiopia Investment Climate Statement 2015,” 2015 Investment Climate Statement,
May 2015, 1. 7 Antonio Castellano, Adam Kendall, et al., Brighter Africa: The growth potential of the sub-Saharan electricity
sector, February 2015,
http://www.mckinsey.com/~/media/mckinsey/dotcom/insights/energy%20resources%20materials/powering%20afric
a/brighter_africa_the_growth_potential_of_the_sub-saharan_electricity_sector.ashx. 8 International Energy Agency, Africa Energy Outlook: A focus on energy prospects in sub-Saharan Africa,
accessed November 18, 2015,
https://www.iea.org/publications/freepublications/publication/WEO2014_AfricaEnergyOutlook.pdf.

6
development, substantiated by the Climate Investment Fund’s decision to “priorit[ize]”9 Ethiopia
with its Scaling up Renewable Energy Program, citing “a major driver for pursuing SREP
finance was the Ethiopian government’s desire to further develop renewable energy resources,
and thereby augment on-going energy development to meet the huge demands for power.”10
Given this contextual background, this section will evaluate and dissect past and current
Ethiopian energy and renewables governmental policy, and reveal what kind of environment our
geothermal energy project will take place in.
National Energy Policy
Established in 1994, Ethiopia’s national energy policy was first proclaimed by the
Transitional Government.11
There were two main goals: the first was “to ensure a reliable supply
of energy at affordable prices, particularly to support the agricultural led industrial development”;
the second “to ensure and encourage a gradual shift from traditional energy sources to modern
energy sources to develop and utilize local sustainable energy resources with the aim of
achieving comprehensive rural energy development.”12
There was also a specific interest in
prioritizing hydropower: “Development of modern energy shall be based on hydro-power
resource development.”13
This is most likely due to Ethiopia’s geological profile, which will be
touched upon later in this paper.
9 Neha Rai, Nanki Kaur, et al., “Scaling up Renewable Energy Programme (SREP) in Ethiopia - a status review,”
Climate Investment Funds, September 2013, http://pubs.iied.org/pdfs/10053IIED.pdf?, 11. 10
Ibid. 11
Bekele Bayissa, “A Review of the Ethiopian Energy Policy and Biofuels Strategy,” Digest of Ethiopia's National
Policies, Strategies and Programs (Addis Ababa, Ethiopia: Forum for Social Studies, 2008), 210. 12 Zereay Tessema, Brijesh Mainali, Semida Silveira, “Mainstreaming and sector-wide approaches to sustainable
energy access in Ethiopia,” Energy Strategy Reviews 2, no. 3-4 (2014): 318, February 2014, http://ac.els-
cdn.com/S2211467X13000977/1-s2.0-S2211467X13000977-main.pdf?_tid=49a40e80-8fd5-11e5-8b32-
00000aab0f27&acdnat=1448058373_0f4fd08d3eaf3bce2f77cf118ff7baf7 13
Bayissa, “A Review of the Ethiopian Energy Policy and Biofuels Strategy,” 213.
7
Utilizing energy to spur economic growth is the crux of this 1994 policy. However, there
are major critiques to this policy. Tessema et al in “Mainstreaming and sector-wide approaches
to sustainable energy access in Ethiopia” argue that the government has been pursuing “grid-
based electrification which favors mostly urban areas,” while “the implementation of the second
objective of the energy policy...was virtually left to development partners.”14
Tessema also
brings attention to the lack of commitment devices in the policy, and the passive nature of the
policy with respect to strategy and private sector involvement. The paper states, “The national
energy policy lacks policy instruments and specific directions to support new and innovative
technical and financial solutions from local and foreign actors.”15
However, perhaps Tessema’s biggest critique of Ethiopia’s current energy policy pertains
to the participation of the private sector and the underdevelopment of competition in Ethiopia.
Described as “the main hurdle to scale up and replicate sustainable energy access projects in
rural Ethiopia,”16
a host of problems exist within the private sector, including how: “The rural
energy market in Ethiopia is still small”; “Rural communities lack the capacity to pay for energy
technologies and services”; “[the] private sector is viewed as profit seeker (sic) and
conventionally also as less trustworthy.”17
Weak private enterprise should not come as a surprise
due to Ethiopia’s competition policies tilting towards “state-owned enterprises” and “ruling party
affiliated ‘endowment’ companies”.18
The U.S. Department of State’s Investment Climate
Statement of Ethiopia in 2015 states that due to the proximity and close relationship between
state-owned enterprises and the state, many private business owners “complain of the lack of a
14
Tessema, Mainali, Silveira, “Mainstreaming and sector-wide approaches to sustainable energy access in Ethiopia,”
318. 15
Ibid. 16
Ibid., 319. 17
Ibid. 18
U.S. Department of State, “Ethiopia Investment Climate Statement 2015,” 2015 Investment Climate Statement,
May 2015, 14.
8
level playing field when it comes to state-owned and party-owned businesses.”19
The privileges
of public sector companies include “priority foreign exchange allocation, preferences in
government tenders, and marketing assistance” which allow for such market dominance.20
The
restriction in private enterprise was also cited as one of the aggravating factors in determining
Ethiopia’s credit evaluation, set as “B+” by Moody’s and “B” by S&P and Fitch respectively.21
Though there have been recent efforts by the Ethiopian government to lessen their involvement
in the energy sector, highlighted by the decision to “split into two the Ethiopian Electric Power
Corporation (EEPCO), one of the state owned giant public utilities and renamed it the Ethiopian
Electric Power Office (EEPO) and Ethiopian Electric Service (EES),”22
there is still much room
to improve.
Ethiopia’s most recent energy directive is renewable-friendly and ambitious. The Growth
and Transformation Plan (GTP) is a 5 year plan enacted in 2010 designated to “to achieve 11.2 –
14.9% GDP growth annually as well as achieve the Millennium Development Goals and attain
middle-class income status by 2025.”23
The plan aims to achieve these economic milestones by
leveraging sustainable renewable energy sources, with a particular attention to hydropower,
much like the original 1994 national energy policy. The government has announced that “By
2020 it aims to reach 15,000 megawatts of electrical generating capacity, including 1,500 MW
from wind energy, 11,000 MW from hydropower, 1,200 MW from geothermal, 300 MW from
solar and 600 MW from co-generation.”24
However, financing for all renewables remains a key
barrier as “financial resources are not allocated for the development of renewable energy sources
19
Ibid. 20
Ibid. 21
Ibid., 2. 22
“Ethiopia (2014),” REEEP, October 11, 2013, https://www.reeep.org/ethiopia-2014. 23
U.S. Department of State, “Ethiopia Investment Climate Statement 2015,” 3. 24
“Ethiopia to step up as regional clean power exporter,” World Bulletin, May 13 2015,
http://www.worldbulletin.net/news/159130/ethiopia-to-step-up-as-regional-clean-power-exporter
9
other than hydro power.”25
There seems to be an unambiguous bias towards hydroelectricity in
Ethiopia’s national energy policy direction.
Ethiopia’s simultaneous pursuit of policies of exporting energy to other East African
countries under the GTP, though well-intentioned, comes to question Ethiopia’s commitment to
rural electrification.26
Tessema brings to light how these two policies, electrification and
exportation, can contradict each other, despite claims that profits from exports will go into
development: “However, there is no clear direction as to how the revenue from the regional trade
will be used in the rural energy sector development and GTP lacks clarity in balancing these two
trajectories.”27
Clearly, priority alignment is in order and elucidation necessary to drive
Ethiopia’s renewable energy production in a socially efficient, productive manner.
Centralized vs. Decentralized electrification policy
One of the key points within the supply chain of electrification is the distribution channel
- after electricity generation, how is this electricity going to flow to individual residential homes?
Renewable energy providers will need to make a decision whether to pursue a centralized grid
model, a decentralized model, or a hybrid of both. There are advantages and disadvantages to all
three, and with respect to sustainable energy, Ethiopia pursues a decentralized, “donor-driven
approach.”28
25
Tessema, Mainali, Silveira, “Mainstreaming and sector-wide approaches to sustainable energy access in Ethiopia,”
316. 26
Ibid. 27
Ibid. 28
Ibid.

10
While centralized grids need a much higher investment in capital and a bigger
distributive network, they generate energy at a much higher scale than decentralized grids.29
Under Ethiopia’s Universal Electricity Access Program, working with the World Bank and
Africa Development Bank, the EEPCO is aiming to achieve 100% penetration by 2015 via a
centralized grid.30
Projects such as these are often backed by large institutions and adequately
financed, which reflects the priority in the government’s development - generation and
presumably, exportation: “...allocation of financial resources are based on priorities in the
development plan.”31
Predictably, it is easier to pitch to a government megawatts of guaranteed
electricity generation (centralized grids) at a cost of a big distributive network, as opposed to
kilowatts in hard-to-reach areas (decentralized solutions) despite “no long supply lines, and
much smaller capital requirements for cost-effective power generation.”32
II-ii. Ethiopia’s Current Energy Status
Energy in Ethiopia can be bifurcated into traditional sources of biomass and modern
sources such as electricity and petroleum; since more than 80% of the population is involved in
agriculture in rural areas, it is reasonable that 88% of total energy is covered by biomass sources
such as wood, dung, and agricultural residues. 33
In sub-Saharan Africa, Ethiopia is one of the
largest populations with a high level of dependence on traditional use of solid biomass for
29
John Farrell, “The Challenge of Reconciling a Centralized v. Decentralized Electricity System,” Institute for
Local Self-Reliance, October 17, 2011, https://ilsr.org/challenge-reconciling-centralized-v-decentralized-electricity-
system/. 30
Tessema, Mainali, Silveira, “Mainstreaming and sector-wide approaches to sustainable energy access in Ethiopia,”
316. 31
Ibid., 317. 32
Farrell, “The Challenge of Reconciling a Centralized v. Decentralized Electricity System.” 33
Solomon Kebede, “Geothermal Exploration and Development in Ethiopia: Status and Future Plan” (paper
presented at Short Course VII on Exploration for Geothermal Resources, Kenya, October 27-November 18, 2012.
11
cooking.34
These biomass fuels, however, have increasingly become challenging to harvest in
rural areas, and are costly in urban areas.35
Extended use of biomass fuels also has severe
environmental repercussions; the depletion of such traditional resources will adversely affect
“soil moisture, recycling of soil nutrients, and conservation of water, soil, and wildlife.”36
Henceforth, it is not surprising that the Government of Ethiopia is keen on promoting
diversification of its energy portfolio.
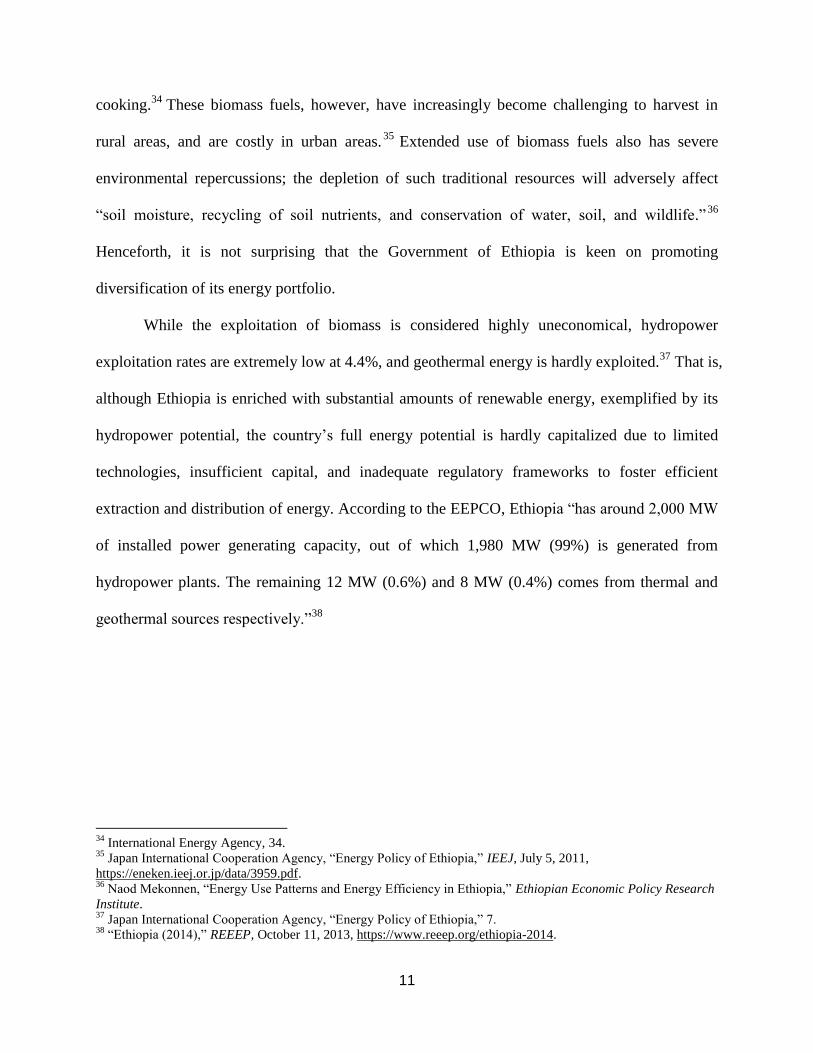
While the exploitation of biomass is considered highly uneconomical, hydropower
exploitation rates are extremely low at 4.4%, and geothermal energy is hardly exploited.37
That is,
although Ethiopia is enriched with substantial amounts of renewable energy, exemplified by its
hydropower potential, the country’s full energy potential is hardly capitalized due to limited
technologies, insufficient capital, and inadequate regulatory frameworks to foster efficient
extraction and distribution of energy. According to the EEPCO, Ethiopia “has around 2,000 MW
of installed power generating capacity, out of which 1,980 MW (99%) is generated from
hydropower plants. The remaining 12 MW (0.6%) and 8 MW (0.4%) comes from thermal and
geothermal sources respectively.”38
34
International Energy Agency, 34. 35
Japan International Cooperation Agency, “Energy Policy of Ethiopia,” IEEJ, July 5, 2011,
https://eneken.ieej.or.jp/data/3959.pdf. 36
Naod Mekonnen, “Energy Use Patterns and Energy Efficiency in Ethiopia,” Ethiopian Economic Policy Research
Institute. 37
Japan International Cooperation Agency, “Energy Policy of Ethiopia,” 7. 38
“Ethiopia (2014),” REEEP, October 11, 2013, https://www.reeep.org/ethiopia-2014.
12
Table 1: Ethiopia Energy Resource Potential
Resource Unit Exploitable Reserve
Exploited
MW GWh
Hydropower MW 45,000 2,100 <5%
Solar/day kWh/m^2 4-6 NA <1%
Wind GW; m/s 1350>7 171 <1%
Geothermal MW 7,000-10,000 7 <1%
Wood mm tons 1,120 560 50%
Agricultural waste mm tons 15-20 6 30%
Natural gas bn m^3 113 NA 0%
Coal mm tons >300 NA 0%
Oil shale mm tons 253 NA 0%
(Source: Ministry of Water and Energy) 39
Researchers argue that a successful development of renewable energy is imperative to
Ethiopia for a variety of reasons; it is suitable for a decentralized application system; its relative
availability is much higher than non-renewable sources, also considering its low contribution to
total energy use; it can potentially save hard currency that is required for importation of
petroleum and fossil fuels; it fosters energy and environment security.40
Renewable energy,
generally speaking, also faces a multitude of challenges such as high costs, unstable yield, high
up-front capital requirements, difficulties adapting to evolving technologies, and limited off-
shoot industry potential.41
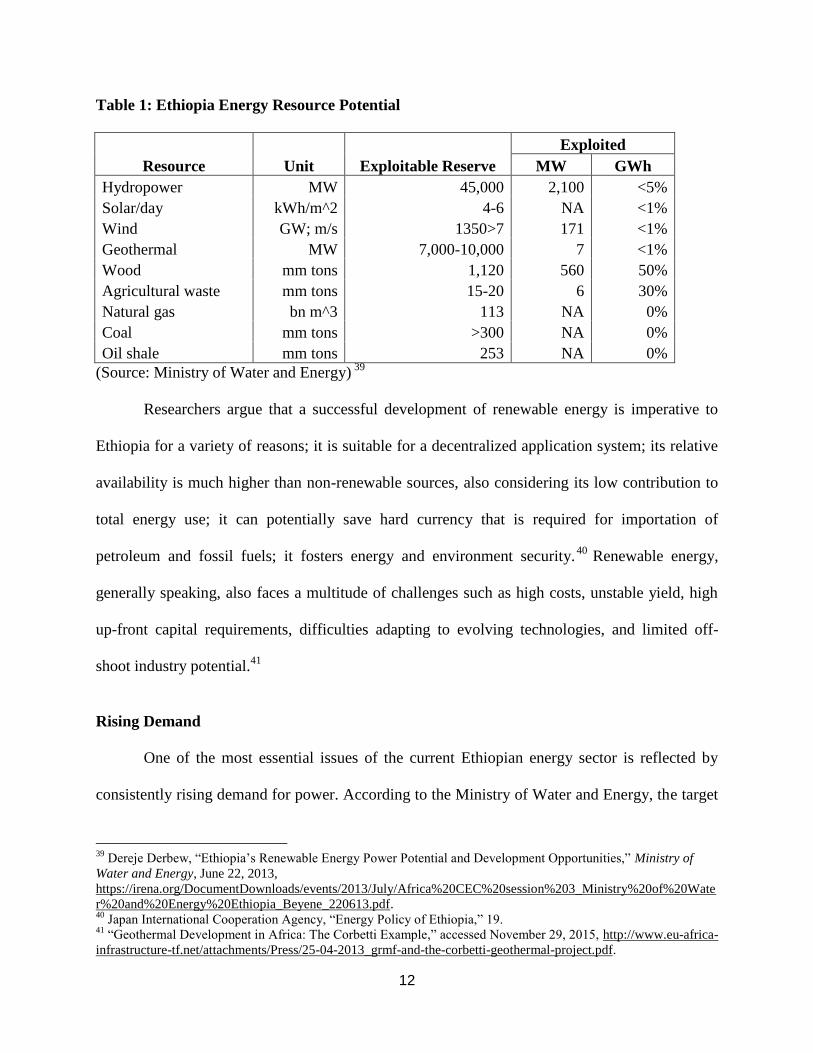
Rising Demand
One of the most essential issues of the current Ethiopian energy sector is reflected by
consistently rising demand for power. According to the Ministry of Water and Energy, the target
39
Dereje Derbew, “Ethiopia’s Renewable Energy Power Potential and Development Opportunities,” Ministry of
Water and Energy, June 22, 2013,
https://irena.org/DocumentDownloads/events/2013/July/Africa%20CEC%20session%203_Ministry%20of%20Wate
r%20and%20Energy%20Ethiopia_Beyene_220613.pdf. 40
Japan International Cooperation Agency, “Energy Policy of Ethiopia,” 19. 41
“Geothermal Development in Africa: The Corbetti Example,” accessed November 29, 2015, http://www.eu-africa-
infrastructure-tf.net/attachments/Press/25-04-2013_grmf-and-the-corbetti-geothermal-project.pdf.
13
scenario would have demand grow by 32% from 2011 to 2015.42
Such extraordinary growth in
demand can be attributed to a number of factors such as double-digit GDP growth for nine
consecutive years, steep population growth, expansion of national grid to rural areas, and
implementation of customer service reform programs.43
Ethiopia’s robust growths in demand are
met with a shortage in supply. In the past decade, “rapid population growth, low per capital
income, recent boom in the construction sector, and limited investment”44
has led to the current
energy supply crisis.
Figure 1: Target and Moderate Forecast of Power Demand
(Source: Ministry of Water and Energy 2013)
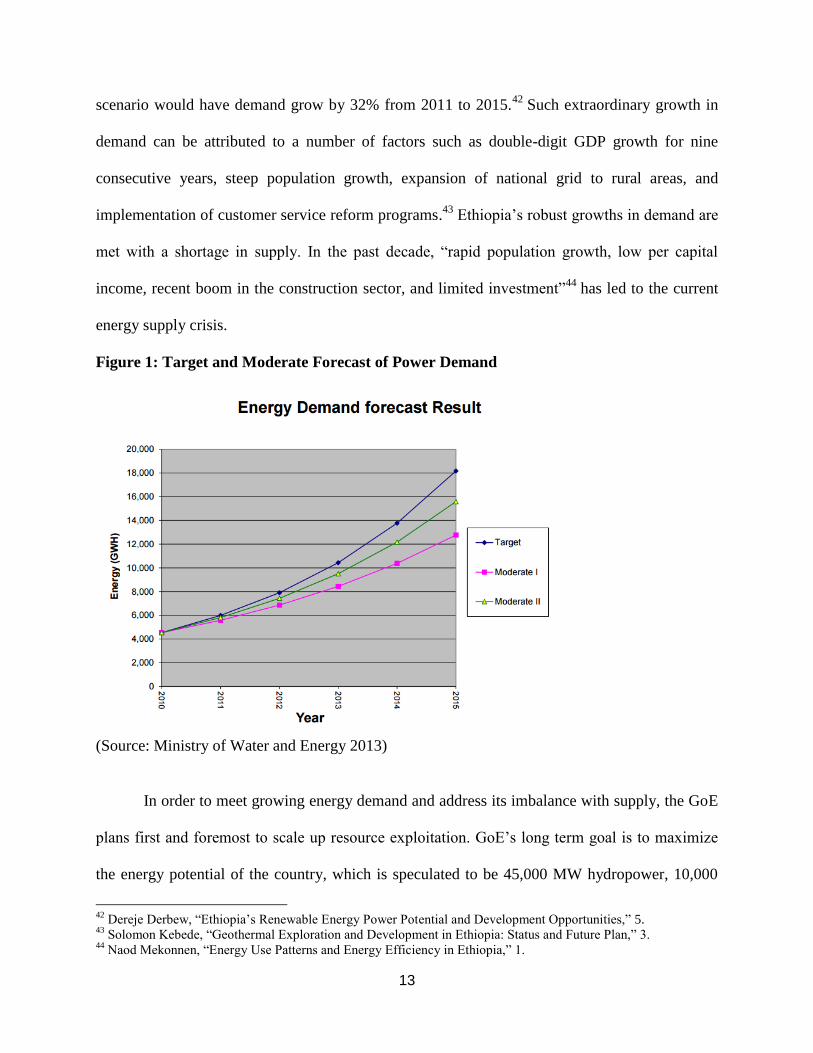
In order to meet growing energy demand and address its imbalance with supply, the GoE
plans first and foremost to scale up resource exploitation. GoE’s long term goal is to maximize
the energy potential of the country, which is speculated to be 45,000 MW hydropower, 10,000
42
Dereje Derbew, “Ethiopia’s Renewable Energy Power Potential and Development Opportunities,” 5. 43
Solomon Kebede, “Geothermal Exploration and Development in Ethiopia: Status and Future Plan,” 3. 44
Naod Mekonnen, “Energy Use Patterns and Energy Efficiency in Ethiopia,” 1.
14
MW Geothermal, and 1.03 mm MW wind power, according to EEPCO.45
At the end of the Great
Transformation Plan, it is projected that “at least 80% of households will be beneficiaries of
modern energy services from … other renewable energy sources.”46
Table 2: Current and Future Composition of Power
(Source: EEPCO, Corporate Planning Department)
Problem of Electrification
Ethiopia, even among other African countries, faces serious challenges in the generation
and distribution of electricity such as unreliability or insufficient reach of the electrical grid and
the poor quality of electricity. A lack of electricity clearly denotes impairment in the quality of
life of the citizens, but an equally serious concern emerges in the fact that “the low level access
to electricity [is] a major barrier to economic development, as well as to the provision of social
services in rural areas.”47
For example, it is argued that the limited access to electricity impedes a
viable development of the informal sector—consisting mostly of unregistered small
enterprises—which is an “important source of employment and form the main source of income
for the poor.”48
45
“Ethiopia (2014),” REEEP, October 11, 2013, https://www.reeep.org/ethiopia-2014. 46
Ministry of Water and Energy, “Scaling-up Renewable Energy Program Ethiopia Investment Plan,” Investment
Plan for Ethiopia, March 8, 2012. 47
The World Bank, “Implementation Completion and Results Report,” June 24, 2015. 48
E.J.M. Van Heesch, “Ethiopian Power Grid,” Electrical Power Engineering & Environment, March 21, 2014.
Type MW GWh % MW GWh % MW GWh %
Thermal 79 564 6.90% 79 564 1.40% 79 564 0.57%
Non-renewable total 79 564 6.90% 79 564 1.40% 79 564 0.57%
Hydro 1,851 7,574 92.50% 10,642 36,506 90.80% 22,000 86,724 87.26%
Wind NA NA 0% 773 1,928 4.80% 2,000 4,030 4.05%
Geothermal 7 49 0.60% 77 571 1.40% 1,000 7,446 7.49%
Bagass NA NA 0% 104 627 1.60% 104 627 0.63%
Renewable total 1,858 7,623 93.10% 11,595 39,632 98.60% 1,858 7,623 93.10%
Total 1,937 8,187 100% 11,674 40,196 100% 25,183 99,390 100%
Existing 2015 Existing
15
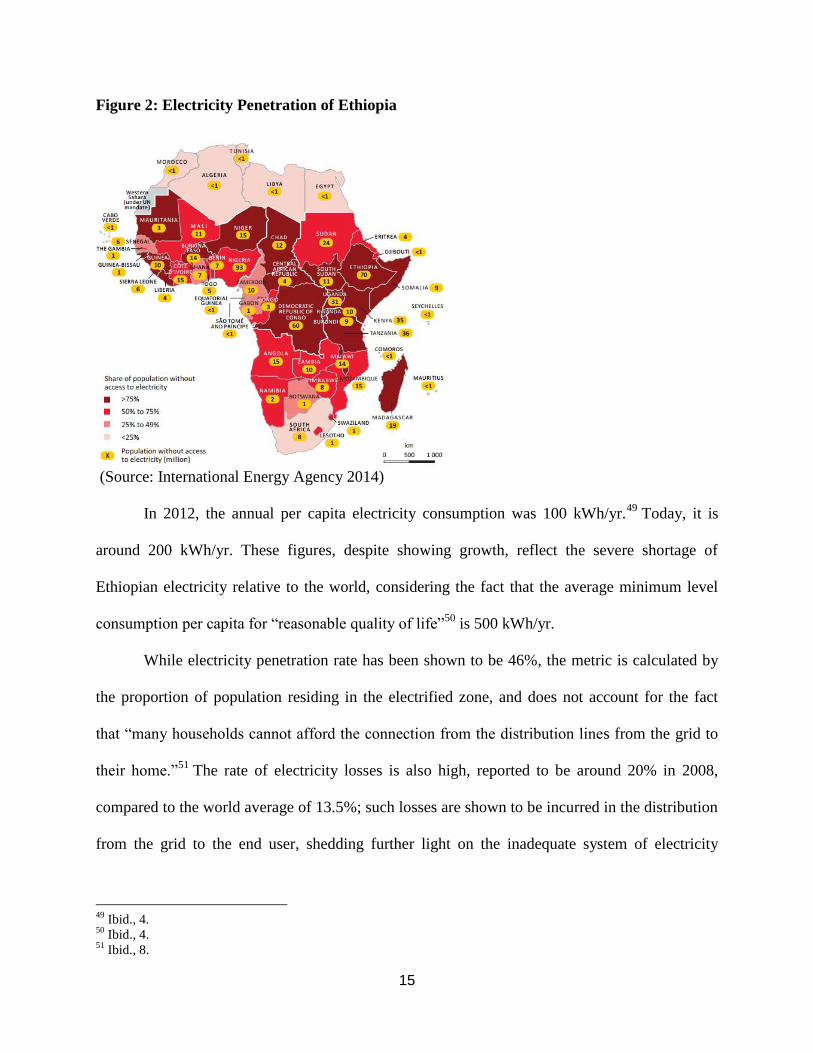
Figure 2: Electricity Penetration of Ethiopia
(Source: International Energy Agency 2014)
In 2012, the annual per capita electricity consumption was 100 kWh/yr.49
Today, it is
around 200 kWh/yr. These figures, despite showing growth, reflect the severe shortage of
Ethiopian electricity relative to the world, considering the fact that the average minimum level
consumption per capita for “reasonable quality of life”50
is 500 kWh/yr.
While electricity penetration rate has been shown to be 46%, the metric is calculated by
the proportion of population residing in the electrified zone, and does not account for the fact
that “many households cannot afford the connection from the distribution lines from the grid to
their home.”51
The rate of electricity losses is also high, reported to be around 20% in 2008,
compared to the world average of 13.5%; such losses are shown to be incurred in the distribution
from the grid to the end user, shedding further light on the inadequate system of electricity
49
Ibid., 4. 50
Ibid., 4. 51
Ibid., 8.
16
distribution.52
Whereas the shortage of electricity supply is evident, there also exists a growing
demand that exacerbates the energy situation. Not only is domestic electricity demand increasing
at a rate of 14% per year, but the growth of electricity-intensive industries, according to the
Ministry of Water and Energy, is also outpacing GDP growth at 15% per year.53
The poor quality of electrification also has consequences. It has been reported that
electric power interruption is a “daily phenomenon.”54
A project study on the service quality of
EEPCO, the state-owned utility monopoly, demonstrated that “there is a substantial gap between
customers’ expectation and that of the service received.”55
Power outages have also been shown
to significantly raise costs for businesses.56
Furthermore, electrification is applied disproportionately to urban and rural areas. In
urban areas, 75.3% of residents use electricity for lightning, while in rural areas 80.1% use
kerosene and 18.5% use firewood: the latter forms of energy are more expensive than electricity
as they are low quality fuels purchased at the end of the supply chain. 57
We find that rural areas
suffer from a vicious cycle of energy, whereby the lack of viable energy or electricity reduces the
output of machinery and thus productivity, leading to lower profits from which new energy
sources are bought.58
This is essentially a national problem as a vast majority of the Ethiopian
population (83.2% as of 2010) live in rural areas.59
Therefore, the central problem of electricity in Ethiopia is twofold: not only is there
insufficient supply of quality electricity, but there exists also an imbalance of supply such that
rural residents, which make up the majority of the population, have little or no access to the grid.
52
Ibid., 8. 53
Ibid., 9. 54
Ibid., 27. 55
Seyoum Akele. “Customer Service Quality in Ethiopian Electric Power Coorporation” (Uppsala University, 2012). 56
E.J.M. Van Heesch, “Ethiopian Power Grid,” 6. 57
Ibid., 6. 58
Ibid., 6. 59
“Ethiopia (2014),” REEEP, October 11, 2013, https://www.reeep.org/ethiopia-2014.
17
It follows that the appropriate remedies to the situation must include an augmentation of
electricity generation as well as a more effective system of distribution. As more of the country
is electrified and prices stabilize, a combination of short term and long term benefits will arise in
both the public and private sector. The World Bank expects that stable access to electricity will
“create new business opportunities … provide enhanced income-generating opportunities,
support healthcare, improve agricultural productivity … [and] support improved educational
services,” as well as enhance local security with public lightning.”60
Electrical grid
Ethiopia’s electrical grid consists of the national Interconnected System (ICS) and the
local Self-Contained System (SCS). As of 2011, the country generated approximately 2,052 MW
of power, of which 1848.75 MW came from hydropower, 142.82 MW from diesel, and 7.3 MW
in geothermal.61
The Interconnected System is responsible for urban areas, and accounts for
nearly 98% of Ethiopia’s total energy sales.62
The difficulty in supplying rural residents with electricity arises from the fact that “the
cost of extending transmission lines to remote village over large distance is much greater than
the need for electricity,”63
especially considering that rural villagers usually use alternative
source of biomass. The transmission over long distances to rural areas will incur costs are neither
viable nor profitable.64
As a result, many argue that if rural electrification is to be an economic
and social reality, the Government of Ethiopia must support a sustainable off-grid distribution
system. The desirable approach would be an efficacious harvest of renewable energy such as
60
The World Bank, “Implementation Completion and Results Report,” 19.
61
E.J.M. Van Heesch, “Ethiopian Power Grid,” 8. 62
Ministry of Water and Energy, “Scaling-up Renewable Energy Program Ethiopia Investment Plan,” Investment
Plan for Ethiopia, March 8, 2012. 63
E.J.M. Van Heesch, “Ethiopian Power Grid,” 22. 64
Ibid., 22.
18
geothermal via the Self-Contained Systems (SCS), which could potentially be integrated to the
Interconnected Systems (ICS).65
III. Icelandic Model of Geothermal Energy
One would be ill-advised to talk about the development of geothermal energy without at
least mentioning Iceland. Indeed Iceland is regarded as one of the world’s leaders in geothermal
research and development, but what is equally important is that both Ethiopia and Iceland share
geological similarities. Due to their geological similarities, Iceland and Ethiopia both have
resources at their disposal to access geothermal energy that other countries simply do not have.
To understand Ethiopia’s untapped geothermal potential, one must first look at Iceland’s
geothermal advances. Therefore, we will explore Iceland’s history of developing electricity
generation by means of geothermal energy. By doing so, we hope to give the reader a firm grasp
as to the underutilized potential Ethiopia has at their disposal to generate electricity from the
relatively clean and renewable resource that is geothermal energy.
III-i. A Geothermal Success Story
Very few nations have invested in geothermal energy as much as Iceland. From a report
in 2013, Iceland’s primary energy supply (69.2%) came from geothermal hotspots, and in 2012
30% of the total electricity production came from generating 5,210 GWh using geothermal
energy66. Iceland regards one of its own agencies as “one of the leading geothermal energy
65
E.J.M. Van Heesch, “Ethiopian Power Grid,” 22.
66
Árni Ragnarsson,, “Geothermal Energy Use, Country Update for Iceland.” Paper presented at European
Geothermal Congress 2013, Pisa, Italy, 3‐7 June 2013.
19
research institutions in the world”67
, and with good reason. The following is a short introduction
into Iceland’s history of developing its geothermal profile.
As early as 1918, when Iceland was still under the Danish Kingdom, energy was at the
forefront of national security for Iceland. During the First World War, coal prices increased to
the point where coal was rationed. As a result, when the coldest winter recorded winter in
Iceland hit in 1918, the country was greatly affected. 68
Now known as the “Great Frost Winter”,
the cold winter along with the rationing of coal resulted in two-thirds of the population becoming
ill when the Spanish Flu was introduced to Iceland in the same year. 69
What followed was the
Inland Waters Act of 1923. According to the Icelandic government agency, the National Energy
Authority, this legislation was
“…the first government initiative concerning energy… It [the Inland Waters Act] was
regarded as both a necessary and natural step for the government to take the initiative in the
utilization of domestic resources, both by carrying out exploration for potential energy resources,
and through direct participation in developing energy production and distribution facilities.”70
By 1926, the Prime Minister, Jón Þorláksson, used his engineering background to initiate
a move to increase geothermal use by developing district heating system71
. This early period in
Iceland’s marks the beginning of Iceland’s role in developing geothermal energy.
67
Sveinbjörn Björnsson, Geothermal Development And Research In Iceland, (Printing: Litróf, February 2010,
ISBN: 978-9979-68-273-8), 32.
68
“The Weather and Climate of Iceland”, Wow Air, http://wowair.us/magazine/blog/the-weather-and-climate-of-
iceland.
69
“Top Ten Historical Moments in Reykjavik”, Reykjavik Convention Bureau,
http://www.meetinreykjavik.is/whyreykjavik/top10%C2%B4s/view/toptenhistoricalmomentsinreykjavik.
70
Agusta S. Loftsdottir, and Ragnheidur I. Thorarinsdottir, Energy in Iceland: Historical Perspective, Present Status,
Future Outlook, Printing: Gudjon O, Second edition, September 2006, ISBN: 9979-68-198-5, 10
71
Jonas Ketilsson, “Geothermal Utilization in Iceland.”

20
Geothermal energy was mainly used for heating, and geothermal energy was not used to
generate electricity until 1944 when a small northern farm used a small turbine to generate
electricity using steam from a geothermal hotspot. 72
Incidentally, 1944 was also the year that
Iceland became fully an independent republic.
In 1967, the Icelandic government established the Energy Fund to further increase the use
of geothermal resources. Over its existence, the National Energy Authority claims the Energy
Fund has “granted numerous loans to companies for geothermal exploration and drilling. Where
drilling failed to yield expected results, loans were converted into grants.”73
However, the
National Energy Authority itself is an equally important government institution that was also
established in 1967. 74
Already mentioned in this paper, the National Energy Authority has
played a crucial role regarding Iceland’s development of geothermal energy for many reasons.
This is what the National Energy Authority says about its role: it considers itself a “government
administration that specializes in the energy sector;” it deals with “contracting and researching
on resource utilization,” and “accumulates and maintains databases on energy utilization”. 75
Further, the National Energy Authority “administrates funding of governmentally financed
research, surveying, and monitoring with the aim of utilizing the natural resources”. 76
We will
72
Agusta S. Loftsdottir, and Ragnheidur I. Thorarinsdottir, Energy in Iceland: Historical Perspective, Present Status,
Future Outlook, Printing: Gudjon O, Second edition, September 2006, ISBN: 9979-68-198-5, 12
73
Sveinbjörn Björnsson, Geothermal Development And Research In Iceland, Printing: Litróf, February 2010, ISBN:
978-9979-68-273-8, 18 74
Ibid., 40. 75
Helgason, Hafsteinn, “Geothermal Power in Iceland”, Presented at the Geothermal Energy Workshop, Salta,
December, 2014,
https://www.google.com/url?sa=t&rct=j&q=&esrc=s&source=web&cd=3&ved=0ahUKEwi4spqK7abJAh
WHmx4KHU7YDaEQFggqMAI&url=http%3A%2F%2Falcuenet.eu%2Fdms-
files.php%3Faction%3Ddoc%26id%3D680&usg=AFQjCNHqkhR4BecrSq8MAQRJavYgJDIa-
Q&sig2=ktsBCsWV9wrXcqn0aQQTVQ
76
Sveinbjörn Björnsson, Geothermal Development And Research In Iceland, Printing: Litróf, February 2010, ISBN:
978-9979-68-273-8, 32
21
dwell more into its supervisory and initiative responsibilities in a bit. Following the creation of
the Natural Energy Authority, the first commercial power plant to utilize geothermal energy was
established in 1969 in Bjarnarflag with an installed power of 3 MW. 77
This began the new era of
Iceland’s generation of electrical power from geothermal energy.
Meanwhile, during the 1960s, Iceland was looking to diversify their exports (which was
largely based on fishing). 78
Therefore, the Icelandic government looked to attract investors to
expand different industries. As a result, in 1966 the Icelandic government made a deal with
Alusuisse (a Swiss company) to build an aluminum plant (ISAL). Two years later in 1970, the
first ISAL plant was fully operational, and According to the National Energy Authority,
“Iceland’s power intensive industry consumed almost half of all the electricity produced”79
. As a
result, the 1960s shows how Iceland’s government played a key role in both developing domestic
energy utilization and developing their power intensive industry, which demanded a lot of
electricity. 80
This is important because of what followed: the energy crisis of the 1970s.
Following the OPEC Oil Crisis of 1973, the market price for crude oil rose by 70%, and
Iceland changed its energy policy, reducing oil use and turning to domestic energy resources.
hydropower and geothermal energy. 81
Once again, energy independence with focus on domestic
development became a national issue. However, it is of note that most of the policies from the
1970s were aimed at reducing dependency on imported oil by focusing on space heating. 82
By
promoting the expansion of the district heating utilities, the Icelandic government increased the
77
Agusta S. Loftsdottir, and Ragnheidur I. Thorarinsdottir, Energy in Iceland: Historical Perspective, Present Status,
Future Outlook, Printing: Gudjon O, Second edition, September 2006, ISBN: 9979-68-198-5, 12. 78
Ibid., 25. 79
Ibid., 26. 80
Ibid., 26. 81
Sveinbjörn Björnsson, Geothermal Development And Research In Iceland, Printing: Litróf, February 2010, ISBN:
978-9979-68-273-8, 15.
82
Agusta S. Loftsdottir, and Ragnheidur I. Thorarinsdottir, Energy in Iceland: Historical Perspective, Present Status,
Future Outlook, Printing: Gudjon O, Second edition, September 2006, ISBN: 9979-68-198-5, 12

22
proportion of space heating generated by geothermal energy from 43% in 1970 to 83% in 1984.
83 Regardless, one can assume that research for geothermal electricity generation benefited from
these policies. Whether it is for space heating or electrical production, the research used to find
geothermal hotspots helps both aims.
One of the most important legislations that strengthened the Icelandic government’s role
in developing geothermal energy is known as the Act on Survey and Utilization of Ground
Resources, No. 57/1998, of 1998. This Act defines regulations on resources within the ground. 84
According to the National Energy Authority, “the term resource applies to any element,
compound and energy that can be extracted from the Earth, whether in solid, liquid or gaseous
form, regardless of the temperature at which they may be found.”85
The Act also gives the
Minister of Industry, Energy and Tourism the power to take initiative or give instructions on
surveying and prospecting for resources in the ground anywhere in the country, and the Act gives
said Minister the power to issue licenses for those to do so in his/her place. 86
Further, the
“utilization of resources within the ground is subject to a license from the Minister of the
Industry[ and Energy and Tourism] whether it involves utilization on private or public land…”,87
according to the National Energy Authority. This is important because it establishes property
rights [or lack thereof, one could argue] of any resource below the ground, which by definition
includes geothermal energy. It results in the need for licensing for both utilizing geothermal
energy and surveying and prospecting geothermal hotspots. It sets up regulations and
government intervention for anything geothermal related.
83
Ibid., 12.
84
Sveinbjörn Björnsson, Geothermal Development And Research In Iceland, Printing: Litróf, February 2010, ISBN:
978-9979-68-273-8, 7 85
Ibid., 7. 86
Sveinbjörn Björnsson, Geothermal Development And Research In Iceland, Printing: Litróf, February 2010, ISBN:
978-9979-68-273-8, 7 87
Ibid., 8.
23
By 1999 the government created the “Framework Programme for Utilization of Hydro
and Geothermal Energy Resources” as a way to reassess the country’s potential for electricity
generation using domestic resources. 88
According to the National Energy Authority,
“The objective of the Framework Programme is to evaluate and compare various power
development proposals, and discuss their respective impacts on: the environment, natural and
cultural heritage, other resources, and regional development”89
In 2003, the first phase dealt with 24 geothermal plant proposals.90
With growing
technological advances in generating electricity via geothermal energy, this plan gave Iceland’s
already centralized geothermal industry more guidelines and structure with which to issue with
proposals to construct new geothermal power plants.
In the same year of 2003, Iceland passed the Electricity Act, No.65/2003. This act
increased regulation on licensing by requiring licenses to construct and operate a power plant
(with the exception of a power plant with the rated capacity of under 1 MW, granted said power
plant is not connected to a distribution system or national transmission grid). 91
The Act also gave
the National Energy Authority the oversight to regulate the compliance of companies operating
under said licenses. 92
In addition, partially due to the Electricity Act, the National Energy
Authority was given the power to grant licenses on behalf of the Minister of Industry, Energy
and Tourism – which was effective as of 2008.93
Further, the Act established Landsnet, a limited
liability company, to provide electrical transmission and system operation services by taking
over various companies who would trade their transmission system lines and equipment for
88
Agusta S. Loftsdottir, and Ragnheidur I. Thorarinsdottir, Energy in Iceland: Historical Perspective, Present Status,
Future Outlook, Printing: Gudjon O, Second edition, September 2006, ISBN: 9979-68-198-5, 31 89
Ibid., 31 90
Ibid, 32 91
Sveinbjörn Björnsson, Geothermal Development And Research In Iceland, Printing: Litróf, February 2010, ISBN:
978-9979-68-273-8, 8 92
Sveinbjörn Björnsson, Geothermal Development And Research In Iceland, Printing: Litróf, February 2010, ISBN:
978-9979-68-273-8, 8 93
Ibid., 8

24
equity. 94
This resulted in the transmission system to grow by 43%, and it caused equalization in
transmission costs across customers, including those from rural areas. 95
This is congruent with
Icelandic economic policies because according the National Energy Authority, “equalization of
energy prices is a decades old Icelandic policy” which is very evident with geothermal space
heating policies. 96
Further, the National Energy Authority became responsible for supervising
the transmission and distribution of electricity. 97
However, although distribution and
transmission prices are not competitive, the generation and sale of electricity is done in an open
market. 98
Therefore, the Electricity Act was very important in centralizing the State’s control
over transmission and distribution, while giving the National Energy Authority more oversight
and responsibilities.
Again, in the same important year of 2003, the Icelandic government passed legislature
that established a consulting and research institute named the Iceland GeoSurvey. 99
Research
activities previously conducted by the National Energy Authority became outsourced to the
Iceland GeoSurvey. 100
Although a government institution, the Iceland GeoSurvey receives no
direct funding from the government and is a self-financed, non-profit institution that operates on
a project and contract basis. 101
Under service contracts with Icelandic energy companies, the
Iceland GeoSurvey provides a wide range of consulting and research services relating to
94
Agusta S. Loftsdottir, and Ragnheidur I. Thorarinsdottir, Energy in Iceland: Historical Perspective, Present Status,
Future Outlook, Printing: Gudjon O, Second edition, September 2006, ISBN: 9979-68-198-5, 30 95
Ibid., 31. 96
Sveinbjörn Björnsson, Geothermal Development And Research In Iceland, Printing: Litróf, February 2010, ISBN:
978-9979-68-273-8, 17 97
Agusta S. Loftsdottir, and Ragnheidur I. Thorarinsdottir, Energy in Iceland: Historical Perspective, Present Status,
Future Outlook, Printing: Gudjon O, Second edition, September 2006, ISBN: 9979-68-198-5, 31 98
Ibid., 30. 99
“About Orkustofnun”, Accessed November 29th
, 2015, http://www.nea.is/the-national-energy-authority/about-the-
nea/.
100
Sveinbjörn Björnsson, Geothermal Development And Research In Iceland, Printing: Litróf, February 2010,
ISBN: 978-9979-68-273-8, 18 101
IBID., 33.
25
geothermal energy. 102
In addition, the Iceland GeoSurvey has provided services abroad,
including in Ethiopia. 103
This government institution is another example of how Iceland’s
policies have reflected their investment on researching geothermal energy.
The Icelandic government’s investment in developing electricity generation from
geothermal energy has been paying dividends in recent years. Nearly a fifth of the electrical
output in 2005 was generated by geothermal power plants. 104
Iceland has historically pushed
towards aluminum production; 2005 data shows that electricity consumption is primarily driven
by aluminum production, and as a result, power intensive industry consumed 62% of the
electricity produced in Iceland. 105
Further, household demands for electricity have also been
increasing. The National Energy Authority attributes the increase in household demand in
electricity to two reasons. Due to the increasing standard of living, the number of electrical
appliances has been increasing. 106
The other reason being that share of electricity relative to a
household’s budget decreased, which leads to a lower incentive to save electricity.107
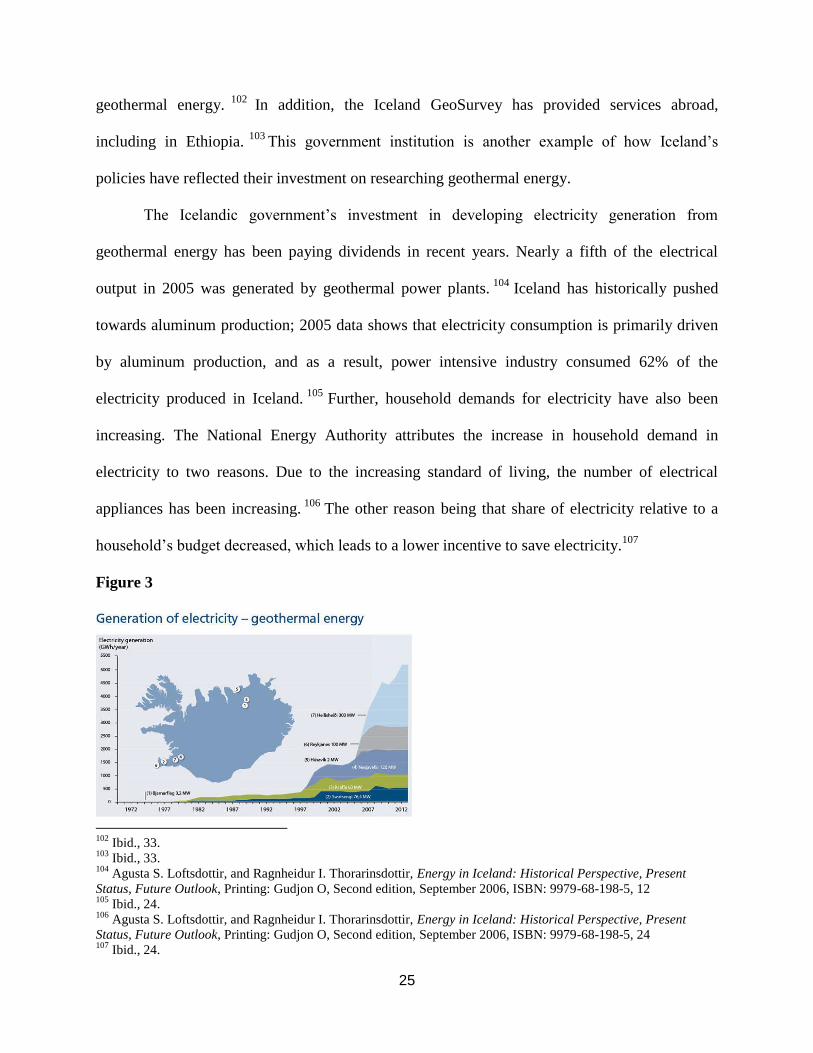
Figure 3
102
Ibid., 33. 103
Ibid., 33. 104
Agusta S. Loftsdottir, and Ragnheidur I. Thorarinsdottir, Energy in Iceland: Historical Perspective, Present
Status, Future Outlook, Printing: Gudjon O, Second edition, September 2006, ISBN: 9979-68-198-5, 12 105
Ibid., 24. 106
Agusta S. Loftsdottir, and Ragnheidur I. Thorarinsdottir, Energy in Iceland: Historical Perspective, Present
Status, Future Outlook, Printing: Gudjon O, Second edition, September 2006, ISBN: 9979-68-198-5, 24 107
Ibid., 24.
26
(Source: National Energy Authority)
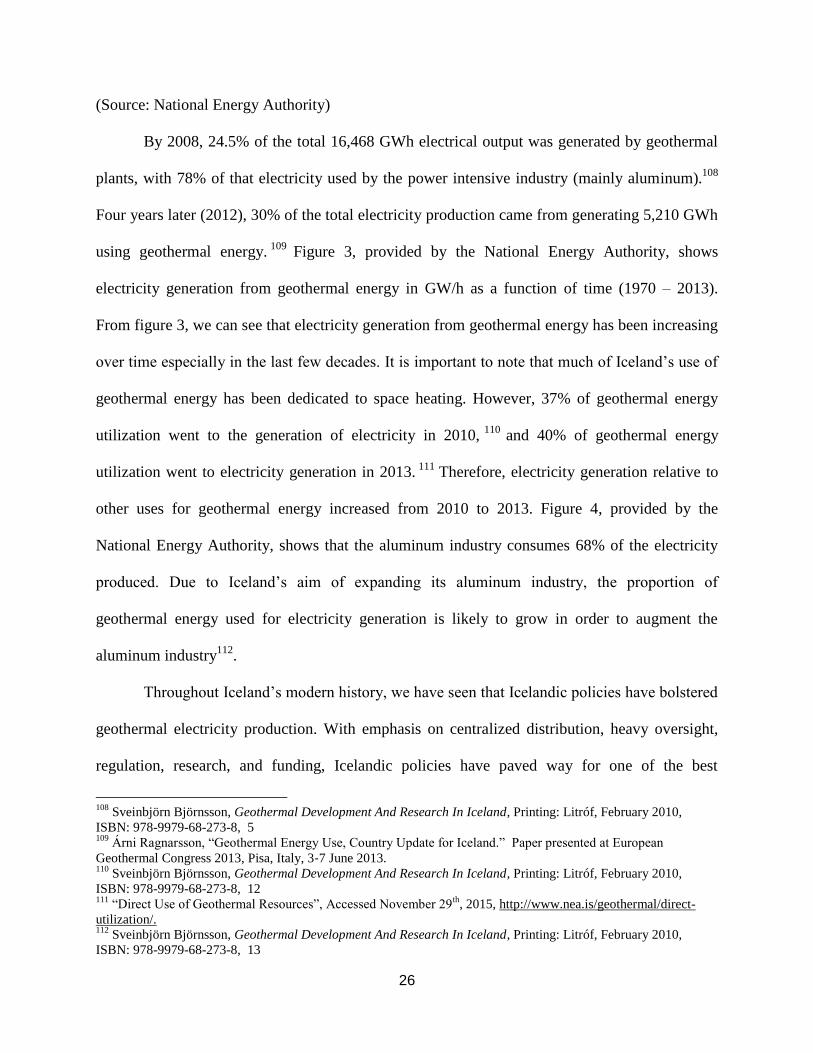
By 2008, 24.5% of the total 16,468 GWh electrical output was generated by geothermal
plants, with 78% of that electricity used by the power intensive industry (mainly aluminum).108
Four years later (2012), 30% of the total electricity production came from generating 5,210 GWh
using geothermal energy.109
Figure 3, provided by the National Energy Authority, shows
electricity generation from geothermal energy in GW/h as a function of time (1970 – 2013).
From figure 3, we can see that electricity generation from geothermal energy has been increasing
over time especially in the last few decades. It is important to note that much of Iceland’s use of
geothermal energy has been dedicated to space heating. However, 37% of geothermal energy
utilization went to the generation of electricity in 2010, 110
and 40% of geothermal energy
utilization went to electricity generation in 2013. 111
Therefore, electricity generation relative to
other uses for geothermal energy increased from 2010 to 2013. Figure 4, provided by the
National Energy Authority, shows that the aluminum industry consumes 68% of the electricity
produced. Due to Iceland’s aim of expanding its aluminum industry, the proportion of
geothermal energy used for electricity generation is likely to grow in order to augment the
aluminum industry112
.
Throughout Iceland’s modern history, we have seen that Icelandic policies have bolstered
geothermal electricity production. With emphasis on centralized distribution, heavy oversight,
regulation, research, and funding, Icelandic policies have paved way for one of the best
108
Sveinbjörn Björnsson, Geothermal Development And Research In Iceland, Printing: Litróf, February 2010,
ISBN: 978-9979-68-273-8, 5 109
Árni Ragnarsson, “Geothermal Energy Use, Country Update for Iceland.” Paper presented at European
Geothermal Congress 2013, Pisa, Italy, 3‐7 June 2013. 110
Sveinbjörn Björnsson, Geothermal Development And Research In Iceland, Printing: Litróf, February 2010,
ISBN: 978-9979-68-273-8, 12 111
“Direct Use of Geothermal Resources”, Accessed November 29th
, 2015, http://www.nea.is/geothermal/direct-
utilization/. 112
Sveinbjörn Björnsson, Geothermal Development And Research In Iceland, Printing: Litróf, February 2010,
ISBN: 978-9979-68-273-8, 13
Figure 1 (source: 16)
27
geothermal success stories of the modern era. Now we will turn our attention to Iceland’s
geological advantage regarding geothermal energy.
III-ii. Geological Profile of Iceland and Ethiopia
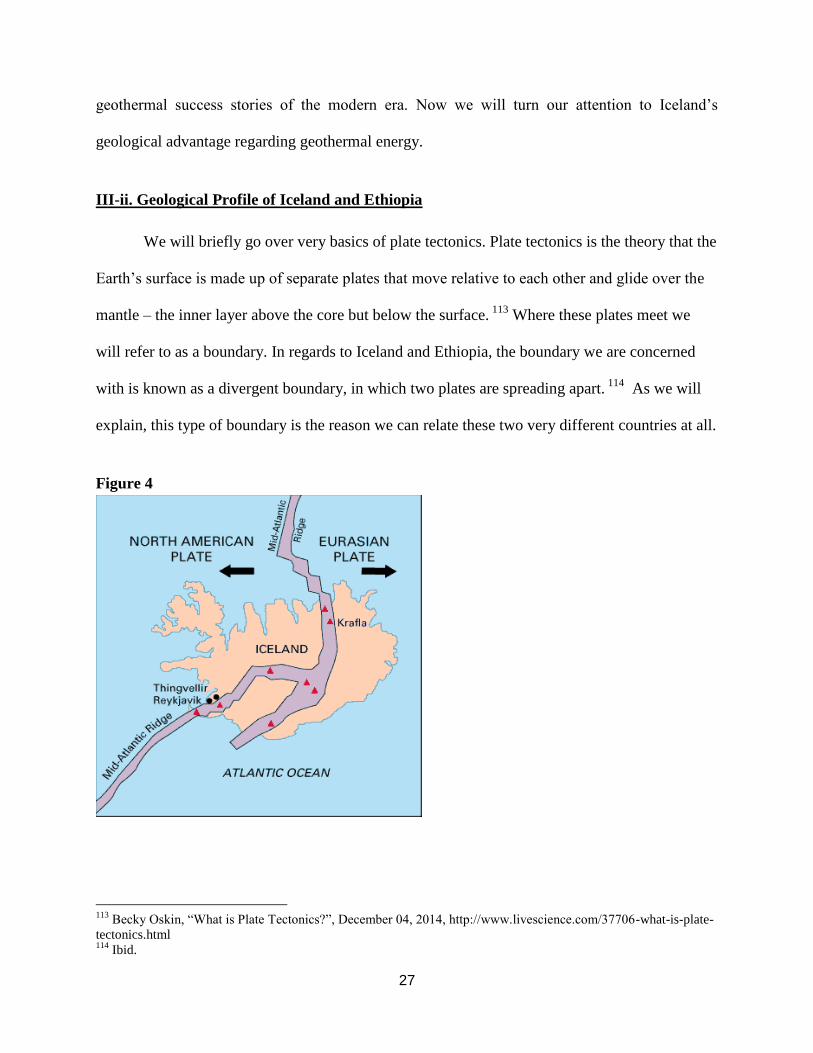
We will briefly go over very basics of plate tectonics. Plate tectonics is the theory that the
Earth’s surface is made up of separate plates that move relative to each other and glide over the
mantle – the inner layer above the core but below the surface. 113
Where these plates meet we
will refer to as a boundary. In regards to Iceland and Ethiopia, the boundary we are concerned
with is known as a divergent boundary, in which two plates are spreading apart. 114
As we will
explain, this type of boundary is the reason we can relate these two very different countries at all.
Figure 4
113
Becky Oskin, “What is Plate Tectonics?”, December 04, 2014, http://www.livescience.com/37706-what-is-plate-
tectonics.html 114
Ibid.

28
As we have learned, Iceland is located between two tectonic plates – the North American
and Eurasian tectonic plates. 115
These two plates form what is known in plate tectonics as a
divergent boundary, meaning that the two plates are moving in opposite directions. According to
the National Energy Authority, “the two plates [the North American Plate and the Eurasian Plate]
are moving apart at a rate of about 2 cm per year.”116
This divergent boundary is known as the
Mid-Atlantic Ridge, as demonstrated by Figure 4 as the purple area.
The National Energy Authority claims that Iceland’s geothermal resources are closely
associated with the country’s close proximity to the Mid-Atlantic Ridge. 117
In part this is due to
the fact that activity in the mantle is exposed as hotspots of unusually high volcanic activity. 118
As a result of this unusually high exposure to the mantle, temperatures of underground water
(characterized as steam due to its chemical state in this circumstance) tend to be very high.
Within 1,000 meters under Iceland’s volcanic zones, there are at least 20 high-temperature areas
containing steam fields with underground temperatures reaching 200 degrees Celsius. 119
In
addition, there are around 250 lower temperature hotspots surrounding the volcanic zones. 120
With activity and energy from the mantle unusually close to the surface, the amount of energy
flowing beneath Icelandic hotspots is estimated to be around 30 GW. 121
However, the National
Energy Authority claims that near the surface the energy current splits in such a way that of the
30 GW only 8 GW is stored in the form of water and steam in geothermal hotspots, which is still
115
Sveinbjörn Björnsson, Geothermal Development And Research In Iceland, Printing: Litróf, February 2010,
ISBN: 978-9979-68-273-8, 10 116
Ibid. 117
Agusta S. Loftsdottir, and Ragnheidur I. Thorarinsdottir, Energy in Iceland: Historical Perspective, Present
Status, Future Outlook, Printing: Gudjon O, Second edition, September 2006, ISBN: 9979-68-198-5, 15 118
Sveinbjörn Björnsson, Geothermal Development And Research In Iceland, Printing: Litróf, February 2010, 10. 119
Ibid., 10. 120
Ibid. 121
Ibid., 11.
29
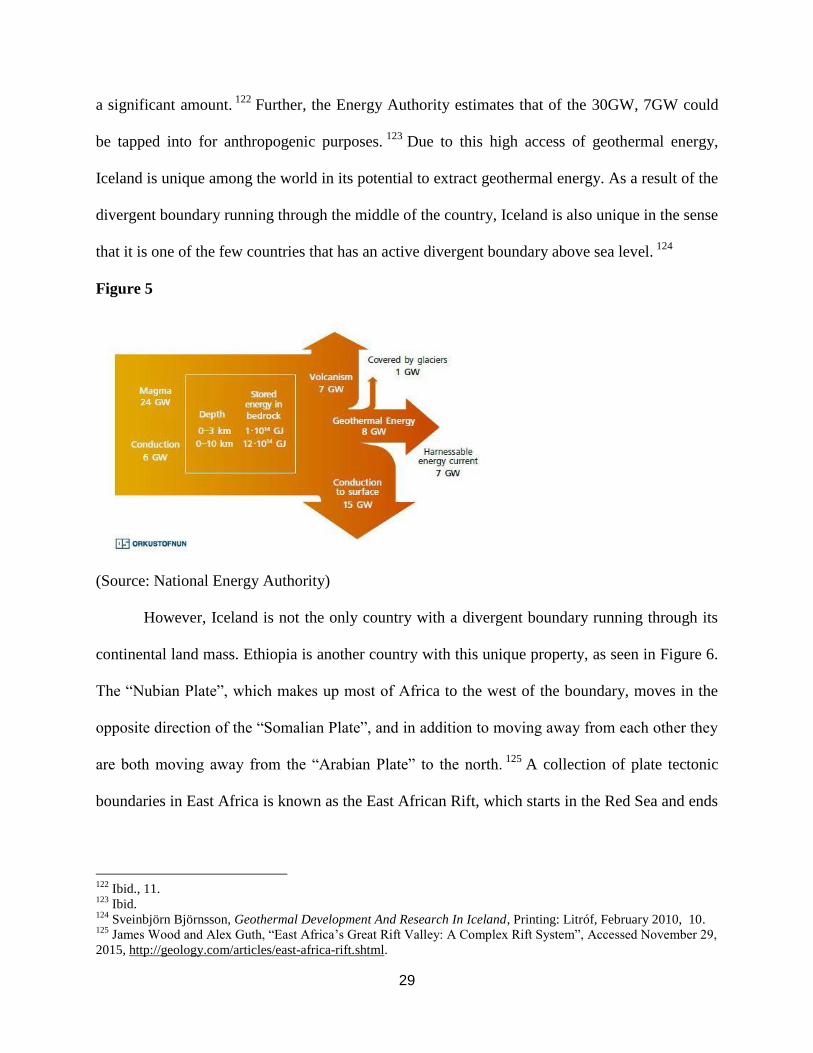
a significant amount. 122
Further, the Energy Authority estimates that of the 30GW, 7GW could
be tapped into for anthropogenic purposes. 123
Due to this high access of geothermal energy,
Iceland is unique among the world in its potential to extract geothermal energy. As a result of the
divergent boundary running through the middle of the country, Iceland is also unique in the sense
that it is one of the few countries that has an active divergent boundary above sea level. 124
Figure 5
(Source: National Energy Authority)
However, Iceland is not the only country with a divergent boundary running through its
continental land mass. Ethiopia is another country with this unique property, as seen in Figure 6.
The “Nubian Plate”, which makes up most of Africa to the west of the boundary, moves in the
opposite direction of the “Somalian Plate”, and in addition to moving away from each other they
are both moving away from the “Arabian Plate” to the north. 125
A collection of plate tectonic
boundaries in East Africa is known as the East African Rift, which starts in the Red Sea and ends
122
Ibid., 11. 123
Ibid. 124
Sveinbjörn Björnsson, Geothermal Development And Research In Iceland, Printing: Litróf, February 2010, 10. 125
James Wood and Alex Guth, “East Africa’s Great Rift Valley: A Complex Rift System”, Accessed November 29,
2015, http://geology.com/articles/east-africa-rift.shtml.

30
in Malawi. 126
The best-defined and oldest rift occurs in the area commonly referred to as the
Ethiopian Rift. 127
Although not as active as the Mid-Atlantic Ridge in Iceland, the plates in the
Ethiopian Rift move apart by 0.7 cm per year, according to the Iceland GeoSurvey. 128
The fact
that the plates are moving apart results in magmatism and the composition of volcanic activity,
the intensity of which depends on the opening rate. 129
Similar to what we learned from Iceland,
the Iceland GeoSurvey states that “high temperature geothermal resources are closely related to
the volcanic centres” in regards to the African Rift Valley. 130
Therefore, based off what we have
learned about Iceland’s plate tectonics, Ethiopia has potential geothermal resources due to the
divergent boundary running through the country’s land mass.
Figure 6
(Source: University of Edinburgh)
126
Kristján Saemundsson, “East African Rift System - An Overview.” Paper Presented at Short Course V on
Exploration for Geothermal Resources, Lake Bogoria and Lake Naivasha, Kenya, Oct. 29 – Nov. 19, 2010. 127
James Wood and Alex Guth, “East Africa’s Great Rift Valley: A Complex Rift System”, Accessed November 10,
2015, http://geology.com/articles/east-africa-rift.shtml. 128
Saemundsson, “East African Rift System - An Overview.” 129
Ibid. 130
Ibid.

31
Although Ethiopia is still very much developing its economy, it is worth noting that
countries like Iceland have successfully added geothermal energy to its portfolio for generating
electricity. Although it is worth noting that Iceland has a smaller population with a move active
boundary. Iceland’s population of approximately 331 thousand131
residents is dwarfed by
Ethiopia’s population of approximately 99 million residents. 132
Based off the Iceland
GeoSurvey’s claim that volcanic activity is dependent on the opening rate of the boundaries, we
should expect more geothermal resources from Iceland due to their opening rate of 2 cm per year,
which exceeds the Ethiopian Rift’s opening rate of 0.7 cm per year. As a result, one could argue
that you would expect Iceland to generate more electricity using geothermal energy relative to its
other resources. Regardless, from Iceland’s story of successfully developing geothermal energy
we take away one important inference. We can infer from our study of Iceland that Ethiopia sits
on a potentially grand resource that they can harness to generate electricity.
III. Geothermal Prospects in Ethiopia
III-i. Power Africa Initiative
Over the course of the coming decades, it is the goal of the Government of Ethiopia to
become a regional power in the realm of renewable energy.133
As it currently stands, Ethiopian
economic growth is substantial, but a key limiting factor lies in the underlying energy constraints
the economy faces. Historically, energy has been sourced through predominantly outdated
methods such as wood and waste burning. Yet, Ethiopia is now at a key juncture at which
131
“Iceland”, CIA, Accessed November 11, 2015, https://www.cia.gov/library/publications/the-world-
factbook/geos/ic.html. 132
“Ethiopia”, CIA, Accessed November 11, 2015, https://www.cia.gov/library/publications/resources/the-world-
factbook/geos/et.html.
133
“What Power Africa Means for Ethiopia,” last modified July 25, 2015,
https://www.usaid.gov/powerafrica/partners/african-governments/ethiopia.
32
infrastructure and research have finally begun to catch up to demand for energy, thus positioning
the country well for increased energy development in the coming years—particularly from
renewable energy sources—and specifically, geothermal energy development due to unique
geological profile. That said, in order for this development to be realized, private sector
investment is critical. The Government of Ethiopia has indicated a willingness to increase private
sector involvement in the energy sector, and is working to further develop transmission and
distribution networks in order to pass on increased power production to customers.134
Even so,
the Power Africa Initiative, started by President Obama, has proven to be absolutely essential in
the development of energy sources in Africa, and especially in Ethiopia.
To give a general overview, the Power Africa Initiative is designed to bring ‘together
technical and legal experts, the private sector, and governments from around the world to work
in partnership to increase the number of people with access to power.’135
As we will show in the
case of the Corbetti Concession, the Power Africa Initiative has played a key role in increasing
private sector involvement by aiding the Government of Ethiopia and the Ethiopian Electric
Power Company (EEPCo) in research and in their negotiations with private investors in the case
of Independent Power Producers (IPPs).
III-ii. History of Geothermal Energy
Before delving into the specifics of the Corbetti Concession, it is necessary to give an
overview of the history of geothermal energy in Ethiopia to contextualize the potential for
advancement in the coming years. As surprising as it may be given historical lack of
134
Ibid. 135
“Power Africa,” last modified November 10, 2015, https://www.usaid.gov/powerafrica.
33
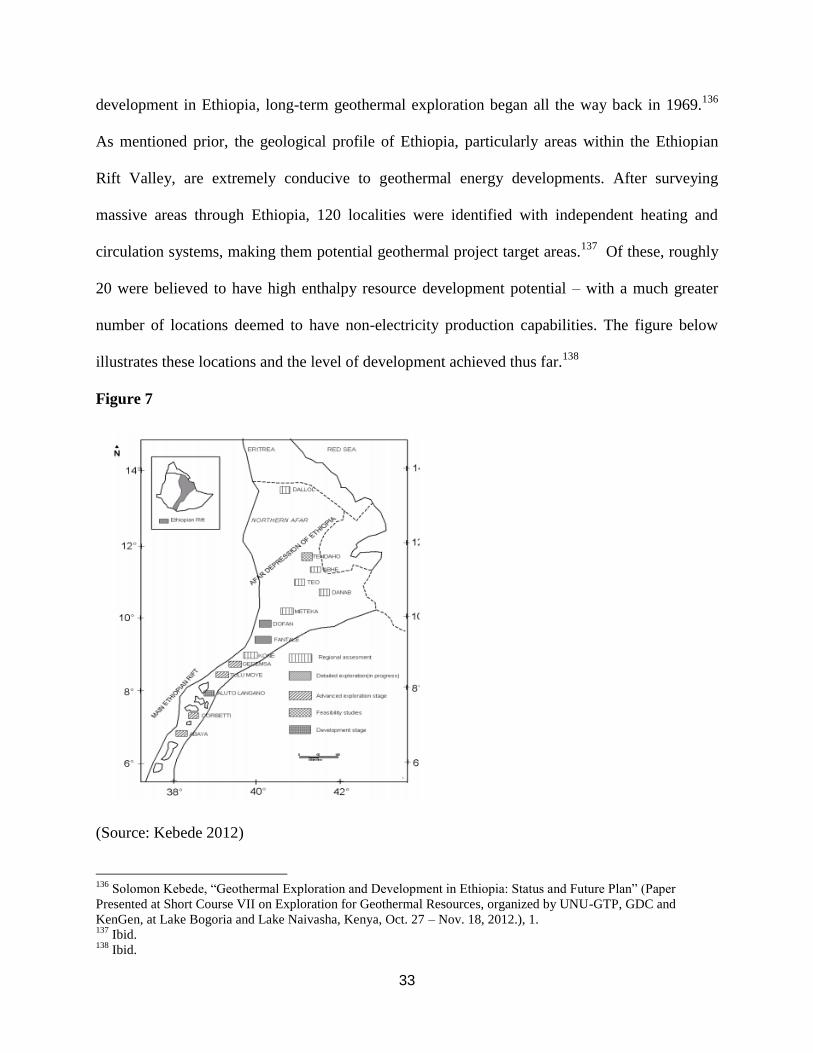
development in Ethiopia, long-term geothermal exploration began all the way back in 1969.136
As mentioned prior, the geological profile of Ethiopia, particularly areas within the Ethiopian
Rift Valley, are extremely conducive to geothermal energy developments. After surveying
massive areas through Ethiopia, 120 localities were identified with independent heating and
circulation systems, making them potential geothermal project target areas.137
Of these, roughly
20 were believed to have high enthalpy resource development potential – with a much greater
number of locations deemed to have non-electricity production capabilities. The figure below
illustrates these locations and the level of development achieved thus far.138
Figure 7
(Source: Kebede 2012)
136
Solomon Kebede, “Geothermal Exploration and Development in Ethiopia: Status and Future Plan” (Paper
Presented at Short Course VII on Exploration for Geothermal Resources, organized by UNU-GTP, GDC and
KenGen, at Lake Bogoria and Lake Naivasha, Kenya, Oct. 27 – Nov. 18, 2012.), 1. 137
Ibid. 138
Ibid.
34
Since the 1970s, significant testing and research has been conducted in the Abaya,
Corbetti, Aluto Langano, Tulu Moye, and Tendaho geothermal prospects, among others.139
Tests were conducted in order to estimate potential for future energy development. Further
research took place in the central and southern portions of the Afar depression, but despite
containing many of the best prospects for geothermal development, development was first made
elsewhere. There were a variety of reasons for this, but it was primarily due to weak
infrastructure for transmission and power generation, as well as a very low local load demand for
electricity, making it difficult to support expensive development projects. That said, in the
current state, having made significant infrastructure improvements in the past few decades, the
Afar depression is favorable for developmental projects. It was in the 1980s that exploratory
drilling began, specifically at the Aluto prospect. The project consisted of eight exploratory wells
of which five ultimately were productive sites140
. Drilling also took place throughout the mid-
1990s at the Tendaho prospect. That said, throughout these decades resource development was
insignificant because of infrastructure constraints as well as technological and operational
deficiencies.
Finally, in the late 1990s a pilot plant was installed in the Aluto Langano prospect with
the potential for about 7 MW. Unfortunately, the development of this plant was not as fruitful as
hoped. Mismanagement, as well as an insufficiency of operational expertise, led to inefficient
production.141
The plant was largely out of operation until 2007, when these issues were targeted
and operational improvements to mitigate these problems began. As it currently stands, the plant
is back in operation at partial efficiency, with output of about 4 MW. Nonetheless, it is an
139
Ibid, 5. 140
Meseret Teklemariam, “Goethermal Exploration and Development in Ethiopia,”
http://www.ethdiaspora.org.et/phocadownloadpap/Publications/geothermal%20potential%20of%20ethiopia.pdf, 88. 141
Ibid.
35
important development, and shows the ability for growth within the improved modern
infrastructure constraints, as opposed to the adverse conditions for earlier development.
Over the past few decades, a great deal of work has been put in and has resulted in high
levels of information and geothermal resource identification. The key now is the execution of the
development of plants to extract the aforementioned resources. Ethiopia is currently at a key
turning point regarding geothermal energy development. In prior decades, while research
conducted by the Geological Survey of Ethiopia added value in the form of increased
information and targeting of resources, infrastructure and expertise were too minimal for
significant development. Yet, with the Power Africa Initiative and increased private investment
in the sector, it seems Ethiopian geothermal energy is finally ready for development. Given the
decades of research and prospect identification, coupled with increased access, technology, and
private investment, geothermal energy is poised for growth in the coming years. As of now, there
are a number of plants in various stages of development throughout prospect areas, many of
which have significant power potential.
III-iii. Current Geothermal Energy and Prospects
Ethiopia, along with Kenya, is naturally endowed with considerable amounts of
geothermal resources, thanks to the East African Rift Valley: one of the greatest prospects of
geothermal energy, with an estimated potential between 10 GW and 15 GW.142
While Ethiopia’s
geothermal resource potential was previously estimated to be 5,000 MW, EEPCO believes that
the true potential is 10,000 MW.143
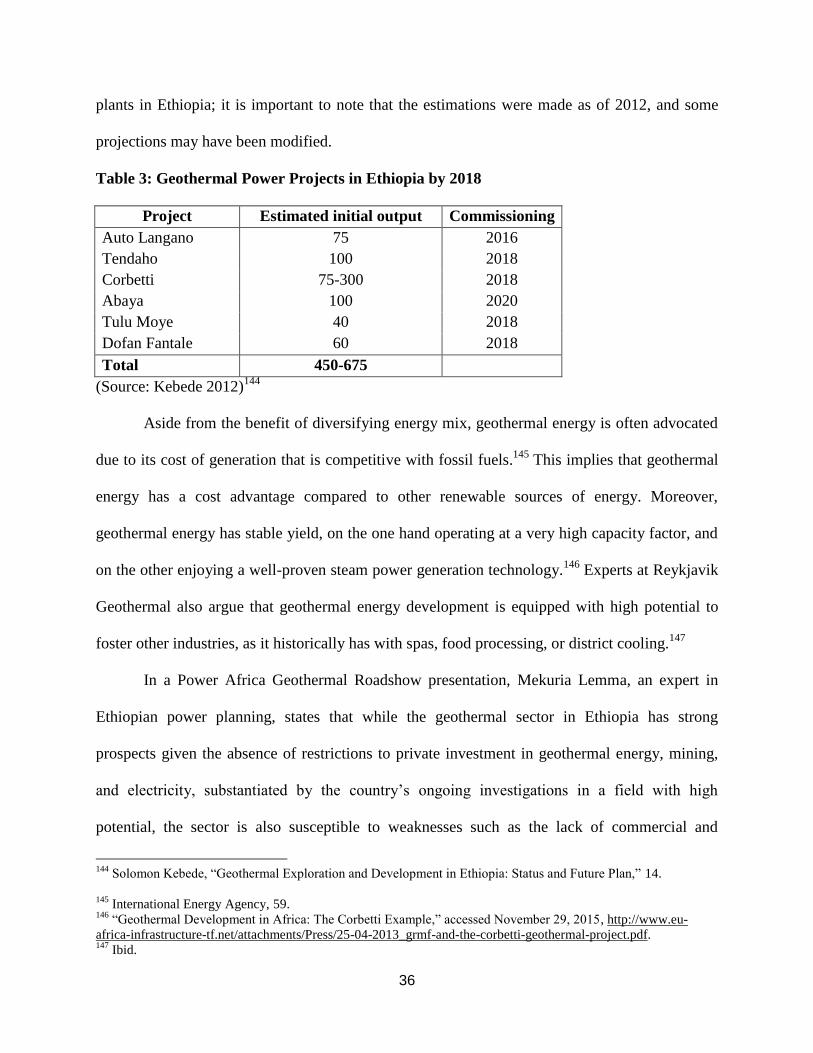
The table below shows projections of geothermal power
142
International Energy Agency, 59.
143
“Ethiopia (2014),” REEEP, October 11, 2013, https://www.reeep.org/ethiopia-2014.
36
plants in Ethiopia; it is important to note that the estimations were made as of 2012, and some
projections may have been modified.
Table 3: Geothermal Power Projects in Ethiopia by 2018
Project Estimated initial output Commissioning
Auto Langano 75 2016
Tendaho 100 2018
Corbetti 75-300 2018
Abaya 100 2020
Tulu Moye 40 2018
Dofan Fantale 60 2018
Total 450-675
(Source: Kebede 2012)144
Aside from the benefit of diversifying energy mix, geothermal energy is often advocated
due to its cost of generation that is competitive with fossil fuels.145
This implies that geothermal
energy has a cost advantage compared to other renewable sources of energy. Moreover,
geothermal energy has stable yield, on the one hand operating at a very high capacity factor, and
on the other enjoying a well-proven steam power generation technology.146
Experts at Reykjavik
Geothermal also argue that geothermal energy development is equipped with high potential to
foster other industries, as it historically has with spas, food processing, or district cooling.147
In a Power Africa Geothermal Roadshow presentation, Mekuria Lemma, an expert in
Ethiopian power planning, states that while the geothermal sector in Ethiopia has strong
prospects given the absence of restrictions to private investment in geothermal energy, mining,
and electricity, substantiated by the country’s ongoing investigations in a field with high
potential, the sector is also susceptible to weaknesses such as the lack of commercial and
144
Solomon Kebede, “Geothermal Exploration and Development in Ethiopia: Status and Future Plan,” 14.
145
International Energy Agency, 59. 146
“Geothermal Development in Africa: The Corbetti Example,” accessed November 29, 2015, http://www.eu-
africa-infrastructure-tf.net/attachments/Press/25-04-2013_grmf-and-the-corbetti-geothermal-project.pdf. 147
Ibid.
37
technical expertise in development of geothermal resources; barriers to the sector development
include but are not limited to: the lack of a policy directly supporting geothermal development,
and the inadequate legal and regulatory institutions to attract private investment.148
The relative
scarcity of active geothermal projects, despite geothermal energy development being the second
in priority after hydropower, may be in part due to the inherent risks associated with starting a
geothermal plant, such as the huge initial investment and failures of costly excavations.149
Therefore, from the perspective of policy, it is imperative that Ethiopia provides support and
incentive for private sector to invest, specifically in geothermal energy production.
III-iv. Geothermal Technology
All geothermal power plants consist of large turbines that run electrical generators. These
turbines are turned using steam and this process can be achieved through a variety of techniques.
One of the most efficient and viable geothermal platforms is the binary cycle power plant which
incorporates hot geothermal fluid and a secondary “binary” fluid, which is a liquid that has a
boiling point much lower than that of water. In a binary cycle plant, this binary fluid, typically a
butane or pentane hydrocarbon, is passed through a heat exchanger at a high pressure in which
heat from the geothermal fluid causes it to rapidly vaporize. The resulting vapor drives the
turbines and is then cycled back through the heat exchanger after being condensed by cold air or
water. The process then repeats itself in this effective, closed-loop system.150
There are key advantages of the binary cycle power plant compared to other existing
geothermal technologies. First, because it is a closed-loop system there are virtually no emissions
to the atmosphere and thermal efficiency is at an average of 10-13%. Second, and most
148
Mekuria Lemma, “Power Africa Geothermal Roadshow,” Ministry of Water and Energy, September 28, 2014. 149
Embassy of Japan in Ethiopia, “Study on the Energy Sector in Ethiopia,” September, 2008.
150
“Types of Geothermal Power Plants,” http://energyalmanac.ca.gov/renewables/geothermal/types.html
38
importantly, binary cycle plants are bound to far less restrictions in terms of geological
conditions. Unlike direct dry steam plants that directly utilize geothermal steam and flash stream
stations which require geothermal fluid temperatures of at least 180 degrees Celsius, binary cycle
plants are viable in areas with geothermal fluid as low as 57 degrees Celsius because of its use of
a binary fluid. Since most geothermal areas contain water at moderate temperatures, binary cycle
technology is the most viable form of widespread geothermal electricity. However, a main
disadvantage of the binary cycle power plant compared to its peers is its high initial cost of
construction.151
III-v. Case Study: The Corbetti Concession
The Corbetti Concession in particular has potential for dramatic effect on Ethiopian
power generation, and embodies many of the changes that have taken place over the past few
decades. In a country in which generation and distribution of electricity is state-controlled, the
Corbetti Concession is monumental in that it is the first project of its kind in which private
investment has been allowed.152
If the two-stage project is completed to its full potential, it will
be the largest geothermal plant in Africa, and possibly in the world, with estimated capacity of
up to 1000 MW.153
The 1000 MW of potential electricity generation is estimated to have the
capability to power roughly 2 million households.154
The Corbetti Concession is located within a
silicic volcano system within a 12 km wide caldera containing widespread and potentially
lucrative thermal activity. Thorough investigations have identified geothermal reservoirs with
151
Ibid. 152
“Ethiopia: Electric Power Signs Groundbreaking Agreement to Buy Geothermal Energy,” Brook Abdu, last
modified August 3, 2015, http://allafrica.com/stories/201508032221.html. 153
“Corbetti project signs 500 MW PPA with Ethiopian State Utility, last modified July 27, 2017,
http://www.thinkgeoenergy.com/corbetti-project-signs-500-mw-ppa-with-ethiopian-state-utility/. 154
“Ethiopia: Electric Power Signs Groundbreaking Agreement to Buy Geothermal Energy”, Brook Abdu.
39
temperatures reaching 250°C and higher.155
One of the vital aspects of the Corbetti Concession
project is its proximity to power transmission lines. A key concern for many developers is the
actual distribution of electricity generated at these plants – in some cases, generation is feasible,
but is useless because proper transmission is lacking. The Corbetti prospect, however, is located
within 15 km of a 132 KV power transmission line, which is the main line to southern Ethiopia
and runs through towns along two branches of the highway to Kenya.156
With easy road access,
connectivity to the national electric power grid, and dense population concentration,
infrastructure is aligned to make the project a success. This is also a fortunate scenario due to the
desire of many Ethiopian leaders to export some of this electricity and create a market for trade
within the region.
Regarding the specifics of the project, a consortium of private investors, including
Reykjavik Geothermal, Icelandic Drilling Company, and the African Renewable Energy Fund
managed by Berkeley Energy are leading the development. Cost estimations are $100 million for
the first 20 MW of output, $2 billion for the first 500 MW within the next 5-8 years and an
additional $2 billion for 500 MW to be developed between 2023 and 2025. The additional 500
MW is currently in negotiation for development in Tulu Moye and Abaya.157
Overall the
financing mix will be roughly 25% equity and 75% debt and will cost roughly $4 billion in
total.158
The interaction between the private sector and policy initiatives has made this project
particularly interesting. Regarding private sector participation, a Heads of Terms Power
Purchase Agreement (HoTPPA) for Corbetti in 2013 between EEPCo and Reykjavik Geothermal,
155
Kebede, “Geothermal Exploration and Development in Ethiopia: Status and Future Plan.” 156
Ibid. 157
“Ethiopia agrees on first deal for privately produced electrivity after Obama visit,” William Davison, last
modified July 29, 2015, http://mgafrica.com/article/2015-07-29-ethiopia-agrees-on-first-deal-for-privately-
produced-electricity-after-obama-visit. 158
“Africa: Ethiopia Plans Africa’s Largest Geothermal Well,” Kennedy Senelwa, last modified August 1, 2015,
http://allafrica.com/stories/201508031511.html.

40
with a purchase price of 7.9 US cents per kWh for the first 500 MWe and 6.5 US cents per kWh
for the latter 500 MW.159
These negotiations took a great deal of time and ultimately in 2015, the
official Power Purchase Agreement for the first 500 MW was signed at a rate of 7.53 US Cents
per kWh.160
This agreement was signed during President Obama’s visit to the area, with details
being confirmed by Edward Njoroge, the chairman of the Corbetti geothermal power project and
a leading member of Berkeley Energy. Regarding the price for electricity generation, Njoroge
suggested that while terms were tight, they were manageable. These rates were slightly lower
than past projects in Africa, as similar geothermal projects in Kenya had a cost of electricity of
about 8.5 US Cents per kWh to 9 US Cents per kWh. It is important to note, however, that
Kenya is Africa’s biggest producer of power from steam. After the agreement was signed,
Njoroge announced that drilling rigs would be mobilized shortly and that they should enter
Ethiopia within the three months after July 2015, when they will immediately begin drilling for
steam. 161
The Corbetti Concession is part of Obama’s Power Africa Initiative and most likely could
not have come to reach the developmental stages of power generation without the program.
Power Africa was instrumental in facilitating the negotiations between the Government of
Ethiopia, the state controlled Ethiopian Electricity Power Company (EEPCo) and the private
investors involved. Whether it was legal or funding related, the Power Africa Initiative was
crucial in these two parties coming to terms, moving beyond the negotiation stage, and initiating
development for production.162
159
“Ethiopia: Electric Power Signs Groundbreaking Agreement to Buy Geothermal Energy,” Brook Abdu. 160
“Ethiopia agrees on first deal for privately produced electricity after Obama visit,” William Davison. 161
Ibid. 162
“What Power Africa Means For Ethiopia”
41
Going forward, this bodes very well for other projects in their early stages. Obama even
cited Corbetti as an example of the tremendous role the private sector can play in electricity
development and general economic growth. It is his hope that the project drives further
electricity access and opens the market for development of other significant renewable energy
sources. As Michael Phillip, Chaiman of Reykjavik Geothermal said, ‘The impact of the U.S.
Power Africa program cannot be underestimated’ as it has ‘significantly reduced the cost of
equity funding for major energy infrastructure projects in Africa, such as Corbetti, by raising the
profile of energy investments in Africa to the institutional investment community in the U.S. and
around the world.’163
In conclusion, the Corbetti Concession project has the potential for massive
implications even beyond the generation of 1000 MW, in that it will roughly double the previous
largest independent power producer agreement of any kind in Africa and possibly open the doors
to future development and private investment. 164
Our project assesses the Corbetti geothermal plant as a possible alternative and
complement to much more prevalent hydropower plants in Ethiopia. We believe the core benefit
of the Corbetti Concession is its contribution to energy diversification, and consider it as a
potential solution to Ethiopia’s overdependence on hydroelectricity. We acknowledge, however,
that geothermal energy development faces steep initial costs, compared to relatively low
production costs of hydropower. As a result, it is our goal to analyze—both quantitatively and
qualitatively—the economic costs and benefits of this model power plant, as well as to shed light
on whether investment in geothermal energy is practical with respect to the Ethiopian energy
sector.
163
“Reykjavik Geothermal and Iceland Drilling Sign Agreement In Ethiopia,” Vala Hafstad, last modified August 5,
2015, http://icelandreview.com/news/2015/08/05/reykjavik-geothermal-and-iceland-drilling-sign-agreement-
ethiopia. 164
“Ethiopia: Electric Power Signs Groundbreaking Agreement to Buy Geothermal Energy,” Brook Abdu.
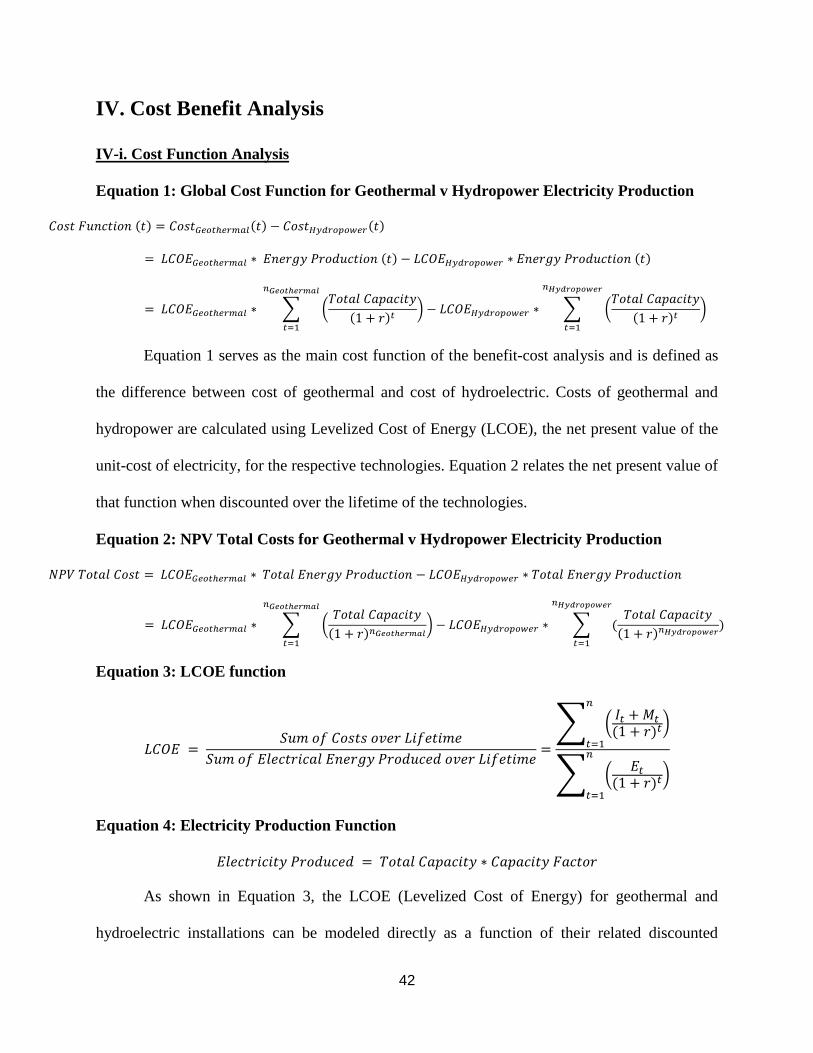
42
IV. Cost Benefit Analysis
IV-i. Cost Function Analysis
Equation 1: Global Cost Function for Geothermal v Hydropower Electricity Production
( ) ( ) ( )
( ) ( )
∑ (
( ) )
∑ (
( ) )
Equation 1 serves as the main cost function of the benefit-cost analysis and is defined as
the difference between cost of geothermal and cost of hydroelectric. Costs of geothermal and
hydropower are calculated using Levelized Cost of Energy (LCOE), the net present value of the
unit-cost of electricity, for the respective technologies. Equation 2 relates the net present value of
that function when discounted over the lifetime of the technologies.
Equation 2: NPV Total Costs for Geothermal v Hydropower Electricity Production
∑ (
( ) )
∑ (
( ) )
Equation 3: LCOE function
∑ ( ( )
)
∑ (
( ) )
Equation 4: Electricity Production Function
As shown in Equation 3, the LCOE (Levelized Cost of Energy) for geothermal and
hydroelectric installations can be modeled directly as a function of their related discounted

43
investment costs for exploration, drilling and power plant ( ), operation and maintenance costs
( ) as well as the electricity production and its various factors, over their lifetimes. As can be
expected, the main conclusions from Equation 3 and 4 are that the LCOE of geothermal and
hydropower are proportional to the investment cost and discount rate, and inversely proportional
to the capacity factor, assuming constant O&M costs as a percentage of investment costs. When
lower O&M costs can be achieved, the resulting LCOE would be proportionally lower. Table 4
shows the different inputs of the LCOE model for Geothermal vs. Hydropower plants in our
analysis:
Table 4: LCOE Model Inputs
Geothermal Model Direct Inputs Hydroelectric Model Direct Inputs
I: Investment Upfront Cost ($) 4,000,000,000.00 I: Investment Upfront Cost ($) 1,200,000,000.00
M: Maintenance & Operations Cost ($/year) 300,000,000.00 M: Maintenance & Operations Cost ($/year) 78,000,000.00
E: Electricity Production (kWh/year) 7,884,000,000.00 E: Electricity Production (kWh/year) 4,380,000,000.00
r: Discount Rate (%) 7.0 r: Discount Rate (%) 5.0
n: Lifetime (years) 30.00 n: Lifetime (years) 60.00
Geothermal Model Indirect Inputs Hydroelectric Model Indirect Inputs
Nameplate Capacity (MW) 1,000.00 Nameplate Capacity (MW) 1,000.00
Capacity Factor (%) 75.0 Capacity Factor (%) 47.0
Table 5: LCOE Model Outputs
Geothermal Model Outputs Hydroelectric Model Outputs
Sum of Costs over Lifetime ($/Lifetime) Sum of Costs over Lifetime ($/Lifetime)
30 Year 7,722,712,355.05 60 Year 2,676,484,582.96
Sum of Electrical Energy Produced over Lifetime (kWh/Lifetime) Sum of Electrical Energy Produced over Lifetime (kWh/Lifetime)
30 Year
88,097,400,575.63 60 Year
87,290,288,119.81
Levelized Cost of Energy ($/kWh) Levelized Cost of Energy ($/kWh)
30 Year 0.0877 60 Year 0.0307
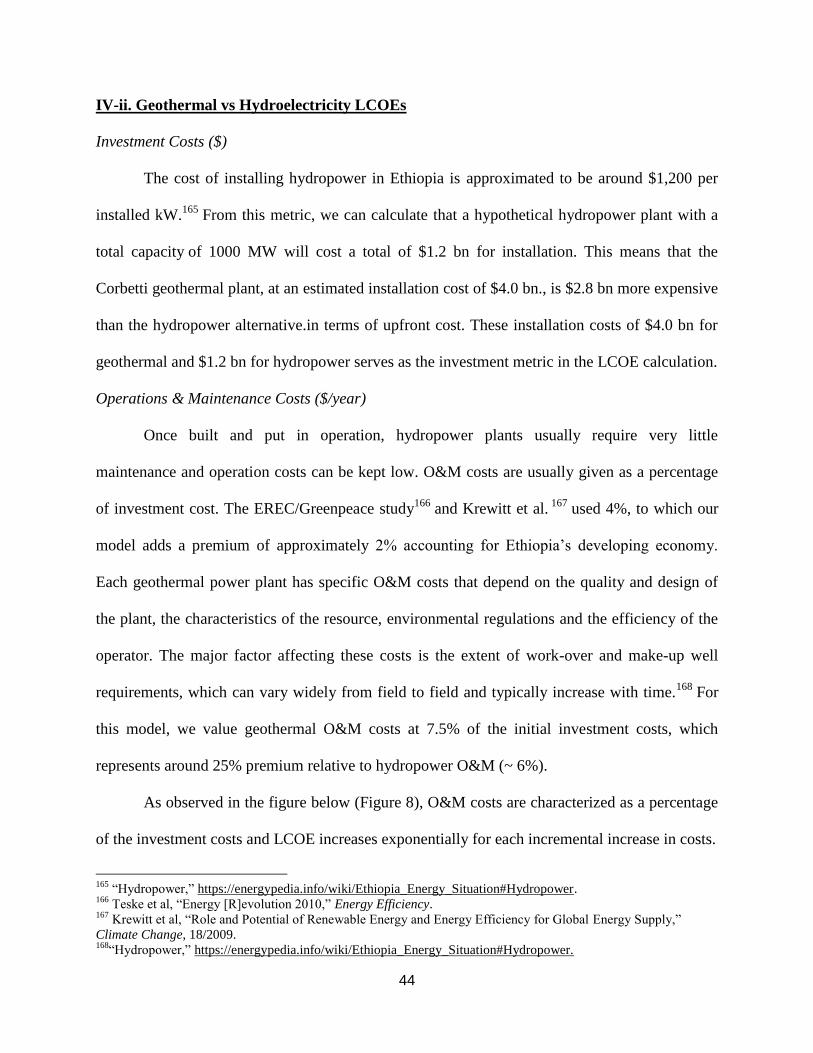
44
IV-ii. Geothermal vs Hydroelectricity LCOEs
Investment Costs ($)
The cost of installing hydropower in Ethiopia is approximated to be around $1,200 per
installed kW.165
From this metric, we can calculate that a hypothetical hydropower plant with a
total capacity of 1000 MW will cost a total of $1.2 bn for installation. This means that the
Corbetti geothermal plant, at an estimated installation cost of $4.0 bn., is $2.8 bn more expensive
than the hydropower alternative.in terms of upfront cost. These installation costs of $4.0 bn for
geothermal and $1.2 bn for hydropower serves as the investment metric in the LCOE calculation.
Operations & Maintenance Costs ($/year)
Once built and put in operation, hydropower plants usually require very little
maintenance and operation costs can be kept low. O&M costs are usually given as a percentage
of investment cost. The EREC/Greenpeace study166
and Krewitt et al. 167
used 4%, to which our
model adds a premium of approximately 2% accounting for Ethiopia’s developing economy.
Each geothermal power plant has specific O&M costs that depend on the quality and design of
the plant, the characteristics of the resource, environmental regulations and the efficiency of the
operator. The major factor affecting these costs is the extent of work-over and make-up well
requirements, which can vary widely from field to field and typically increase with time.168
For
this model, we value geothermal O&M costs at 7.5% of the initial investment costs, which
represents around 25% premium relative to hydropower O&M (~ 6%).
As observed in the figure below (Figure 8), O&M costs are characterized as a percentage
of the investment costs and LCOE increases exponentially for each incremental increase in costs.
165
“Hydropower,” https://energypedia.info/wiki/Ethiopia_Energy_Situation#Hydropower. 166
Teske et al, “Energy [R]evolution 2010,” Energy Efficiency. 167
Krewitt et al, “Role and Potential of Renewable Energy and Energy Efficiency for Global Energy Supply,”
Climate Change, 18/2009. 168“Hydropower,” https://energypedia.info/wiki/Ethiopia_Energy_Situation#Hydropower.
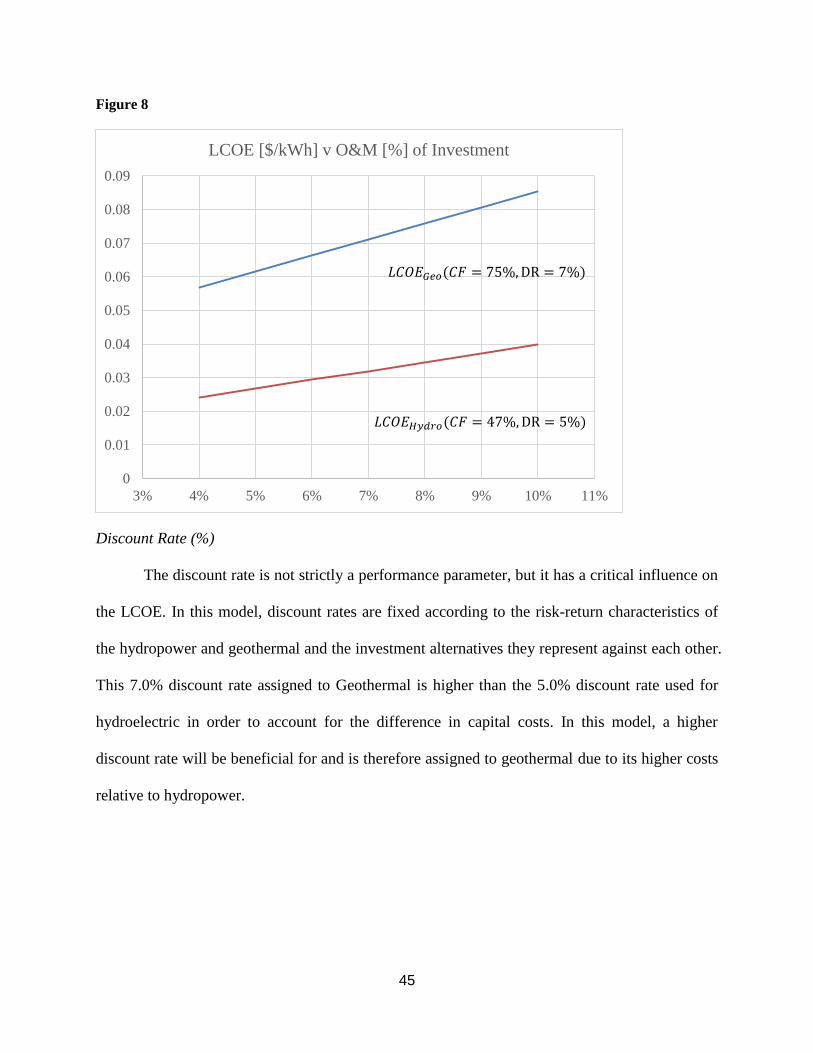
45
Figure 8
Discount Rate (%)
The discount rate is not strictly a performance parameter, but it has a critical influence on
the LCOE. In this model, discount rates are fixed according to the risk-return characteristics of
the hydropower and geothermal and the investment alternatives they represent against each other.
This 7.0% discount rate assigned to Geothermal is higher than the 5.0% discount rate used for
hydroelectric in order to account for the difference in capital costs. In this model, a higher
discount rate will be beneficial for and is therefore assigned to geothermal due to its higher costs
relative to hydropower.
0
0.01
0.02
0.03
0.04
0.05
0.06
0.07
0.08
0.09
3% 4% 5% 6% 7% 8% 9% 10% 11%
LCOE [$/kWh] v O&M [%] of Investment
( 75%,DR 7%)
( 47%,DR 5%)
46
Figure 9
As observed in Figure 9, all else equal the Discount Rate is positively related to the LCOE.
Lifetime (Years)
One important performance parameter is the economic lifetime of the power plant. Twenty-five to
thirty years is the common planned lifetime of geothermal power plants worldwide, although some of
them have been in operation for more than 30 years, such as Units 1 and 2 in Cerro Prieto, Mexico (since
1973), Eagle Rock and Cobb Creek in The Geysers, USA (since 1975 and 1979, respectively), and Mak-
Ban A and Tiwi A, the Philippines (since 1979).169
On that basis, this model incorporates a 30 year
lifetime for the geothermal installation. In contrast, a 60-year economic design lifetime is common
practice for hydroelectric plants, and accounted as such in this model.
Sum of Costs over Lifetime ($)
169
Barry Goldstein et al. “Geothermal Energy” (In IPCC Special Report on Renewable Energy Sources and Climate
Change Mitigation)
0
0.01
0.02
0.03
0.04
0.05
0.06
0.07
0.08
0.09
0.1
0% 2% 4% 6% 8% 10%
LCOE [$/kWh] v Discount Rate [%]
( 75%,O&M 7.5%)
( 47%,O&M 6.5%)
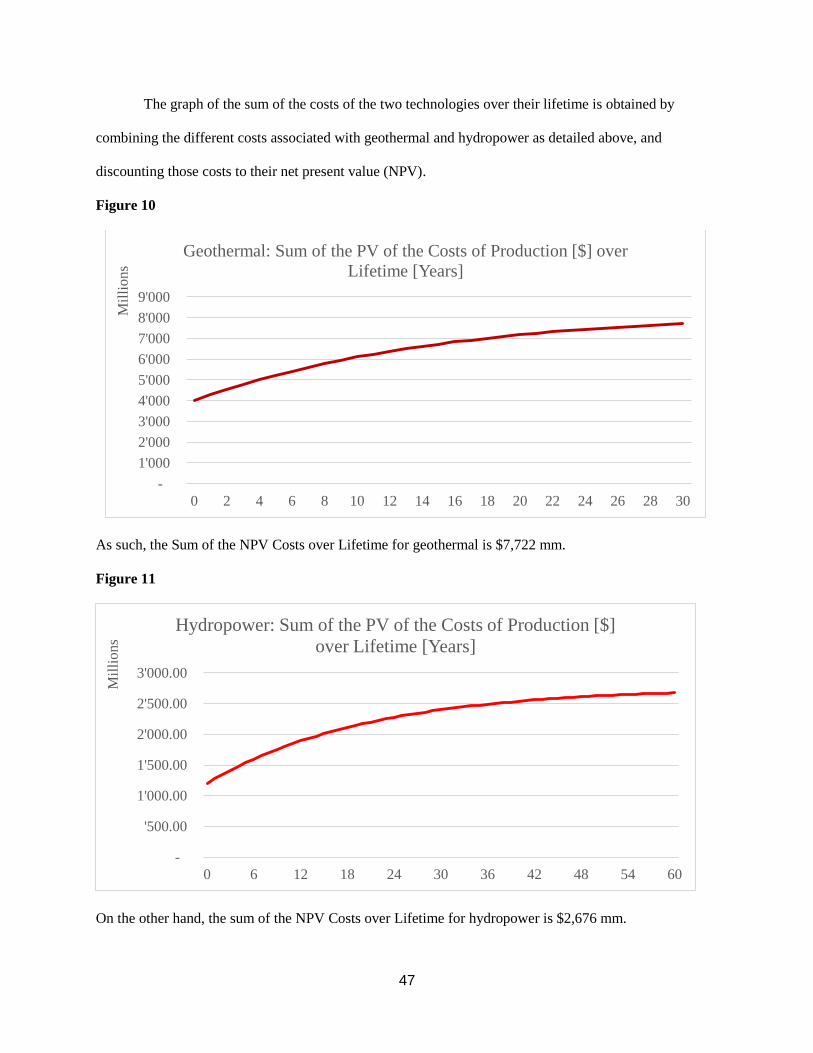
47
The graph of the sum of the costs of the two technologies over their lifetime is obtained by
combining the different costs associated with geothermal and hydropower as detailed above, and
discounting those costs to their net present value (NPV).
Figure 10
As such, the Sum of the NPV Costs over Lifetime for geothermal is $7,722 mm.
Figure 11
On the other hand, the sum of the NPV Costs over Lifetime for hydropower is $2,676 mm.
-
1'000
2'000
3'000
4'000
5'000
6'000
7'000
8'000
9'000
0 2 4 6 8 10 12 14 16 18 20 22 24 26 28 30
Mil
lio
ns
Geothermal: Sum of the PV of the Costs of Production [$] over
Lifetime [Years]
-
'500.00
1'000.00
1'500.00
2'000.00
2'500.00
3'000.00
0 6 12 18 24 30 36 42 48 54 60
Mil
lions
Hydropower: Sum of the PV of the Costs of Production [$]
over Lifetime [Years]

48
Total Capacity (or Nameplate Capacity) (MW/year)
This model is comparing the LCOE of geothermal and hydropower for a set nameplate capacity
of 1000 MW/year. That capacity represents the total capacity used in the model’s calculations.
Capacity Factor (%)
Capacity factors are an important measure of electric generator usage. Geothermal
technologies operate at a fairly steady and high capacity factor. Geothermal energy is currently
used for base load electric generation in 24 countries, with an estimated 67.2 TWh/yr (0.24
EJ/yr) of supply provided in 2008 at a global average capacity factor of 74.5%; newer
geothermal installations often achieve capacity factors above 90%.170
Hydroelectric generators
show both seasonal and annual variations reflecting changing levels of precipitation, river flow,
and snowmelt. Thus, with hydropower, the capacity factor can be indicative of how hydropower
is employed in the energy mix, the water availability, or the equipment and operation
optimization.171
The total worldwide technical potential for hydropower generation is 14,576
TWh/yr (52.47 EJ/yr) with a corresponding installed capacity of 3,721 GW, roughly four times
the current installed capacity. Worldwide total installed hydropower capacity in 2009 was 926
GW, producing annual generation of 3,551 TWh/y (12.8 EJ/y), and representing a global average
capacity factor of 44%, compared to an African average of 47%.172
As such we consider the
African average as the benchmark capacity factors for the technologies in our model.
170
Kumar et al. “Hydropower” (In IPCC Special Report on Renewable Energy Sources and Climate Change
Mitigation) 171
Ibid. 172
Ibid.
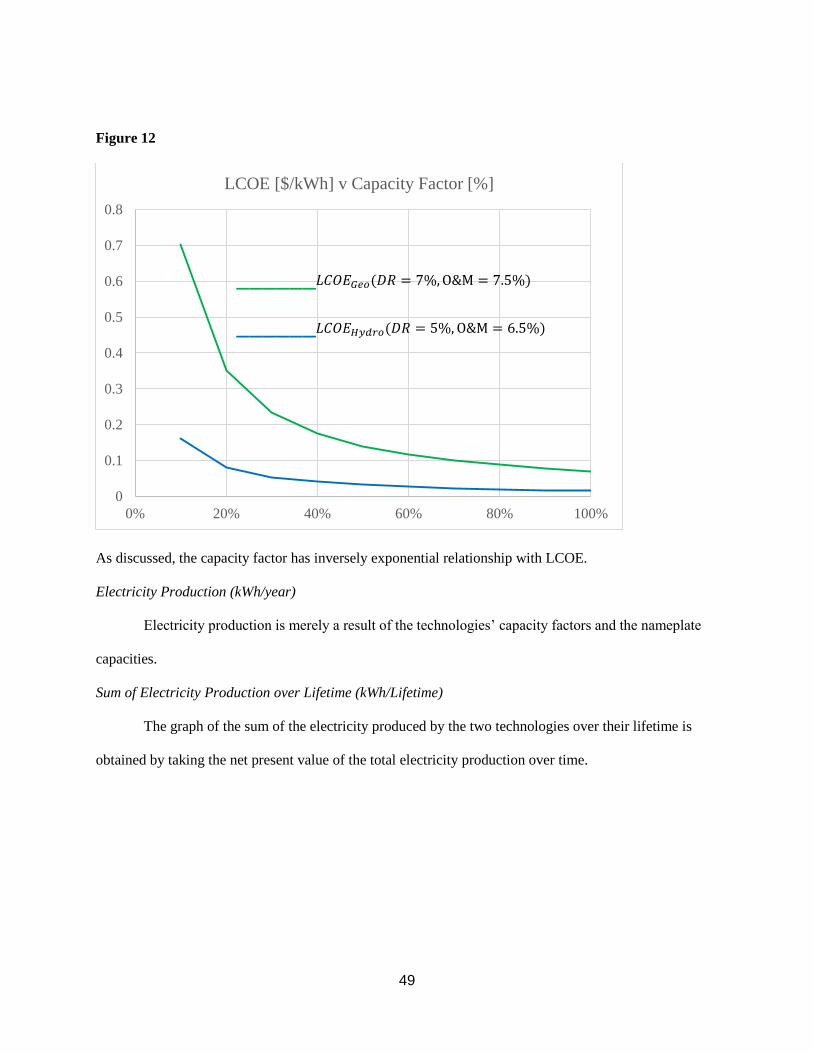
49
Figure 12
As discussed, the capacity factor has inversely exponential relationship with LCOE.
Electricity Production (kWh/year)
Electricity production is merely a result of the technologies’ capacity factors and the nameplate
capacities.
Sum of Electricity Production over Lifetime (kWh/Lifetime)
The graph of the sum of the electricity produced by the two technologies over their lifetime is
obtained by taking the net present value of the total electricity production over time.
0
0.1
0.2
0.3
0.4
0.5
0.6
0.7
0.8
0% 20% 40% 60% 80% 100%
LCOE [$/kWh] v Capacity Factor [%]
______ (𝐷𝑅 7%,O&M 7.5%)
______ (𝐷𝑅 5%,O&M 6.5%)
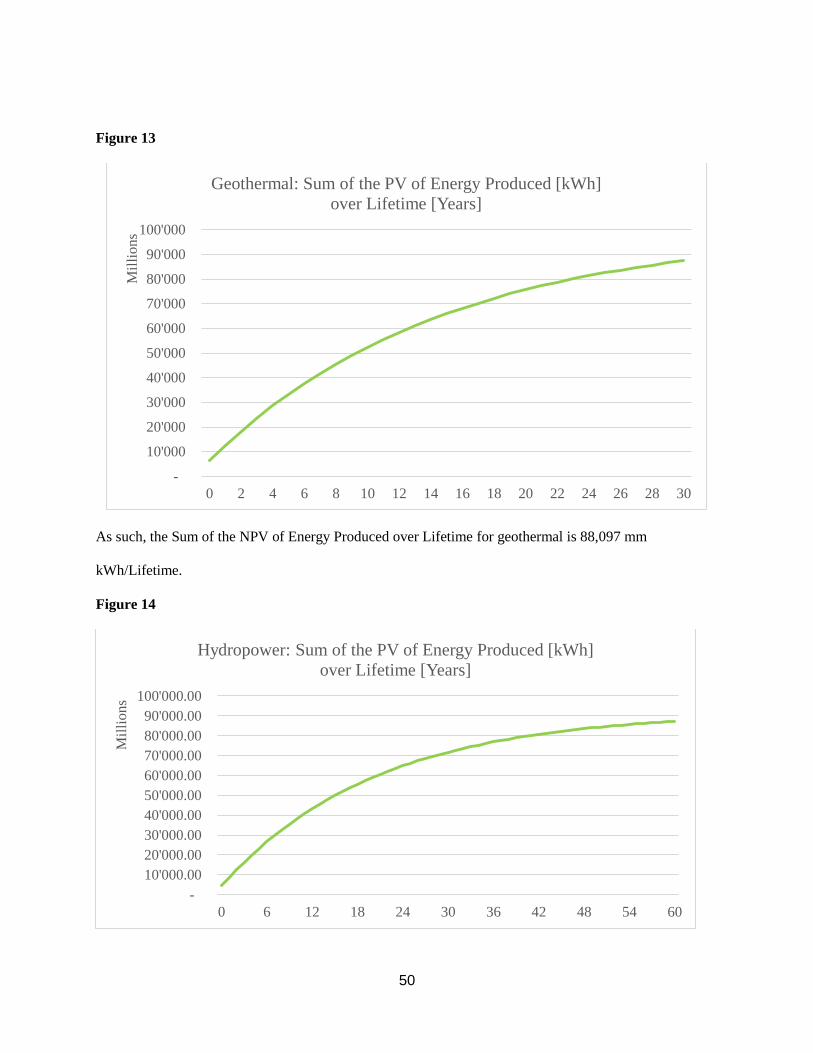
50
Figure 13
As such, the Sum of the NPV of Energy Produced over Lifetime for geothermal is 88,097 mm
kWh/Lifetime.
Figure 14
-
10'000
20'000
30'000
40'000
50'000
60'000
70'000
80'000
90'000
100'000
0 2 4 6 8 10 12 14 16 18 20 22 24 26 28 30
Mil
lio
ns
Geothermal: Sum of the PV of Energy Produced [kWh]
over Lifetime [Years]
-
10'000.00
20'000.00
30'000.00
40'000.00
50'000.00
60'000.00
70'000.00
80'000.00
90'000.00
100'000.00
0 6 12 18 24 30 36 42 48 54 60
Mil
lio
ns
Hydropower: Sum of the PV of Energy Produced [kWh]
over Lifetime [Years]

51
On the other hand, the Sum of the NPV of Energy Produced over Lifetime for hydropower is 87,290 mm
kWh/Lifetime.
LCOE per Technology
The table below resembles a LCOE sensitivity table based on varying degrees of discount rates,
capacity factors, and maintenance costs.
Table 6
Discount Rate
[%]
Capacity Factor
[%]
Maintenance
Costs as [%] of
Investment Costs
LCOE
Parameter
w.r.t.
Technology
Geo. Hydro. Geo. Hydro. Geo. Hydro. Geo. Hydro.
Bull Case, Low
LCOE 5.00 3.00 90.00 55.00 5.00 4.50 0.0548 0.0195
Base Model,
Standard
LCOE
7.00 5.00 75.00 47.50 7.50 6.50 0.0822 0.0370
Bear Case,
High LCOE 10.00 7.00 60.00 40.00 10.00 8.50 0.1418 0.0499
Figure 15
-
'0.1000
'0.2000
'0.3000
'0.4000
'0.5000
'0.6000
0 2 4 6 8 10 12 14 16 18 20 22 24 26 28 30
Geothermal & Hydropower: LCOE [$/kWh] over Lifetime [Years]
𝐺 ℎ 𝑌 30 0.0882
𝐻 𝑤 𝑌 60 0.0307

52
The overall LCOE analysis can be summarized by Figure 15.
IV-iii. Cost Function: Overall vs. Discounted Projection
Figure 17
In Figure 17, the constant annuities from years 2015 to 2045 are calculated using the delta of
geothermal and hydropower LCOE as the present value.
Figure 18
These annuities are then discounted by a rate of 7% to achieve the curve demonstrated in Figure
18. As such, Figure 18 represents the cost function of our Benefit-Cost analysis. A more detailed
explanation of the construction of these cost curves is given in the following section dealing with the
benefit-cost analysis.
$-
$'100.00
$'200.00
$'300.00
$'400.00
$'500.00
2010 2015 2020 2025 2030 2035 2040 2045 2050
USD
mm
Year
Overall Cost Projection: LCOE
Cost (Difference between Geothermal and Hydropower)
$-
$'50.00
$'100.00
$'150.00
$'200.00
$'250.00
$'300.00
$'350.00
$'400.00
2010 2015 2020 2025 2030 2035 2040 2045 2050
USD
mm
Year
Overall Discounted Cost Projection
Cost (Difference between Geo and Hydro)
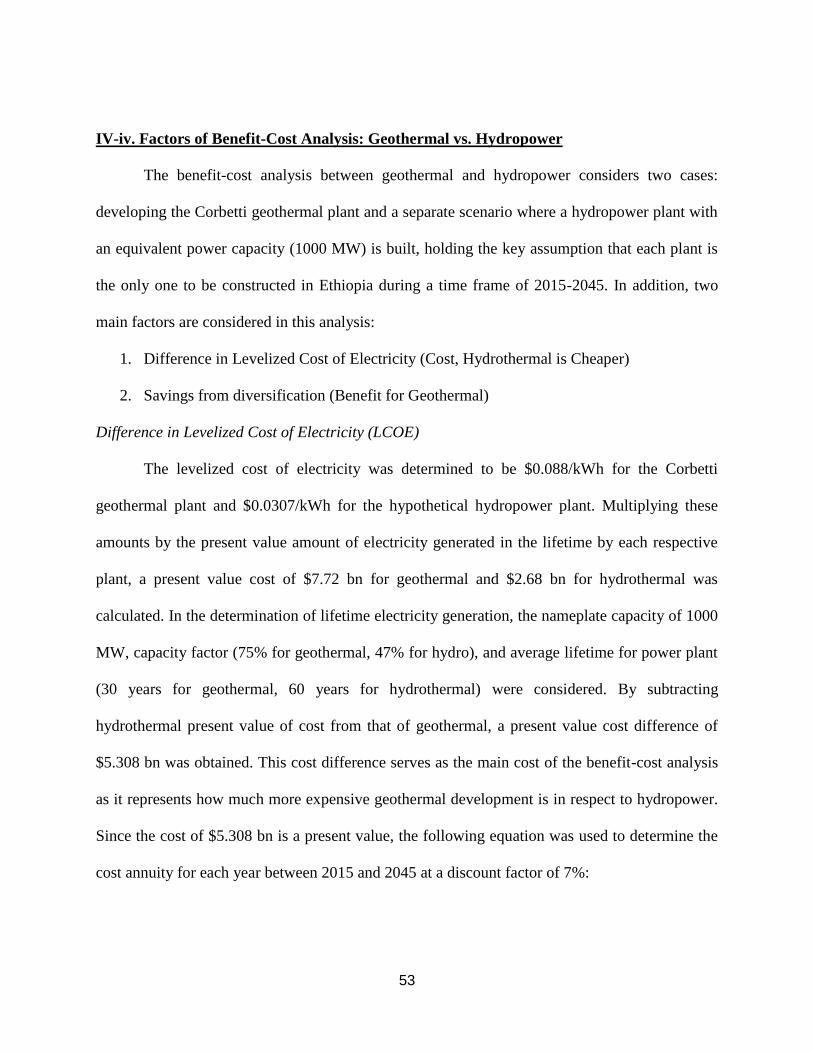
53
IV-iv. Factors of Benefit-Cost Analysis: Geothermal vs. Hydropower
The benefit-cost analysis between geothermal and hydropower considers two cases:
developing the Corbetti geothermal plant and a separate scenario where a hydropower plant with
an equivalent power capacity (1000 MW) is built, holding the key assumption that each plant is
the only one to be constructed in Ethiopia during a time frame of 2015-2045. In addition, two
main factors are considered in this analysis:
1. Difference in Levelized Cost of Electricity (Cost, Hydrothermal is Cheaper)
2. Savings from diversification (Benefit for Geothermal)
Difference in Levelized Cost of Electricity (LCOE)
The levelized cost of electricity was determined to be $0.088/kWh for the Corbetti
geothermal plant and $0.0307/kWh for the hypothetical hydropower plant. Multiplying these
amounts by the present value amount of electricity generated in the lifetime by each respective
plant, a present value cost of $7.72 bn for geothermal and $2.68 bn for hydrothermal was
calculated. In the determination of lifetime electricity generation, the nameplate capacity of 1000
MW, capacity factor (75% for geothermal, 47% for hydro), and average lifetime for power plant
(30 years for geothermal, 60 years for hydrothermal) were considered. By subtracting
hydrothermal present value of cost from that of geothermal, a present value cost difference of
$5.308 bn was obtained. This cost difference serves as the main cost of the benefit-cost analysis
as it represents how much more expensive geothermal development is in respect to hydropower.
Since the cost of $5.308 bn is a present value, the following equation was used to determine the
cost annuity for each year between 2015 and 2045 at a discount factor of 7%:
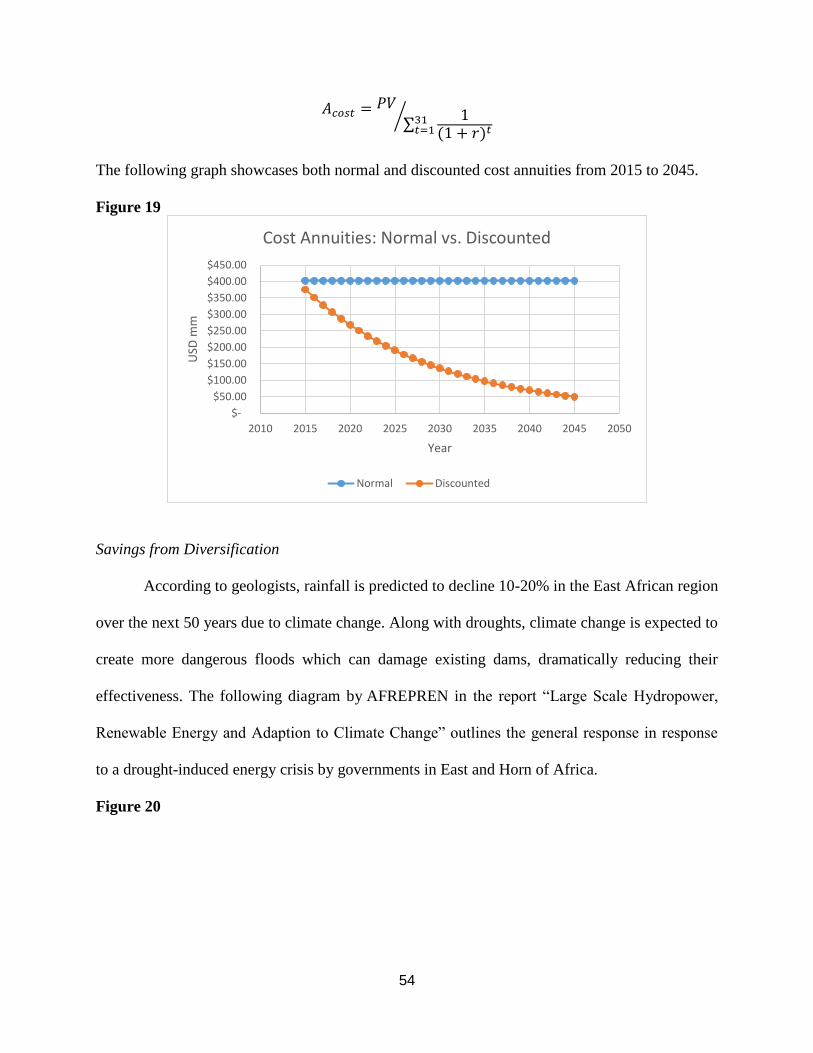
54
∑
( ) 3
⁄
The following graph showcases both normal and discounted cost annuities from 2015 to 2045.
Figure 19
Savings from Diversification
According to geologists, rainfall is predicted to decline 10-20% in the East African region
over the next 50 years due to climate change. Along with droughts, climate change is expected to
create more dangerous floods which can damage existing dams, dramatically reducing their
effectiveness. The following diagram by AFREPREN in the report “Large Scale Hydropower,
Renewable Energy and Adaption to Climate Change” outlines the general response in response
to a drought-induced energy crisis by governments in East and Horn of Africa.
Figure 20
$-
$50.00
$100.00
$150.00
$200.00
$250.00
$300.00
$350.00
$400.00
$450.00
2010 2015 2020 2025 2030 2035 2040 2045 2050
USD
mm
Year
Cost Annuities: Normal vs. Discounted
Normal Discounted
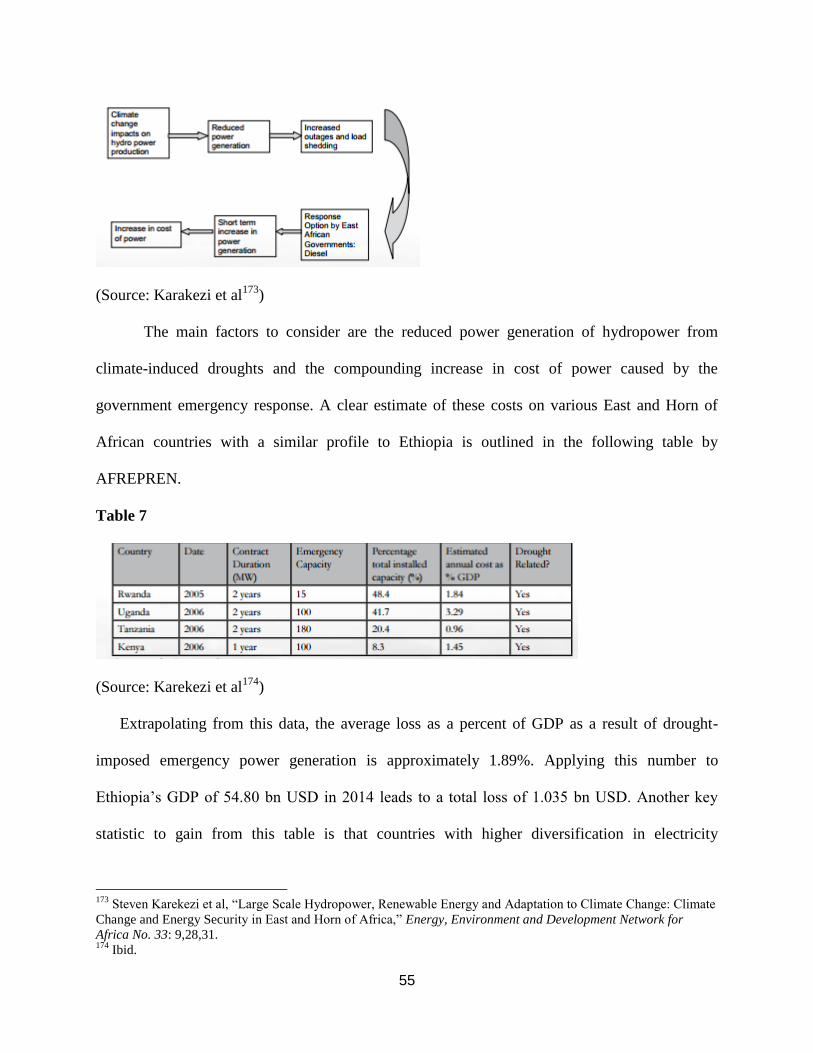
55
(Source: Karakezi et al173
)
The main factors to consider are the reduced power generation of hydropower from
climate-induced droughts and the compounding increase in cost of power caused by the
government emergency response. A clear estimate of these costs on various East and Horn of
African countries with a similar profile to Ethiopia is outlined in the following table by
AFREPREN.
Table 7
(Source: Karekezi et al174
)
Extrapolating from this data, the average loss as a percent of GDP as a result of drought-
imposed emergency power generation is approximately 1.89%. Applying this number to
Ethiopia’s GDP of 54.80 bn USD in 2014 leads to a total loss of 1.035 bn USD. Another key
statistic to gain from this table is that countries with higher diversification in electricity
173
Steven Karekezi et al, “Large Scale Hydropower, Renewable Energy and Adaptation to Climate Change: Climate
Change and Energy Security in East and Horn of Africa,” Energy, Environment and Development Network for
Africa No. 33: 9,28,31. 174
Ibid.
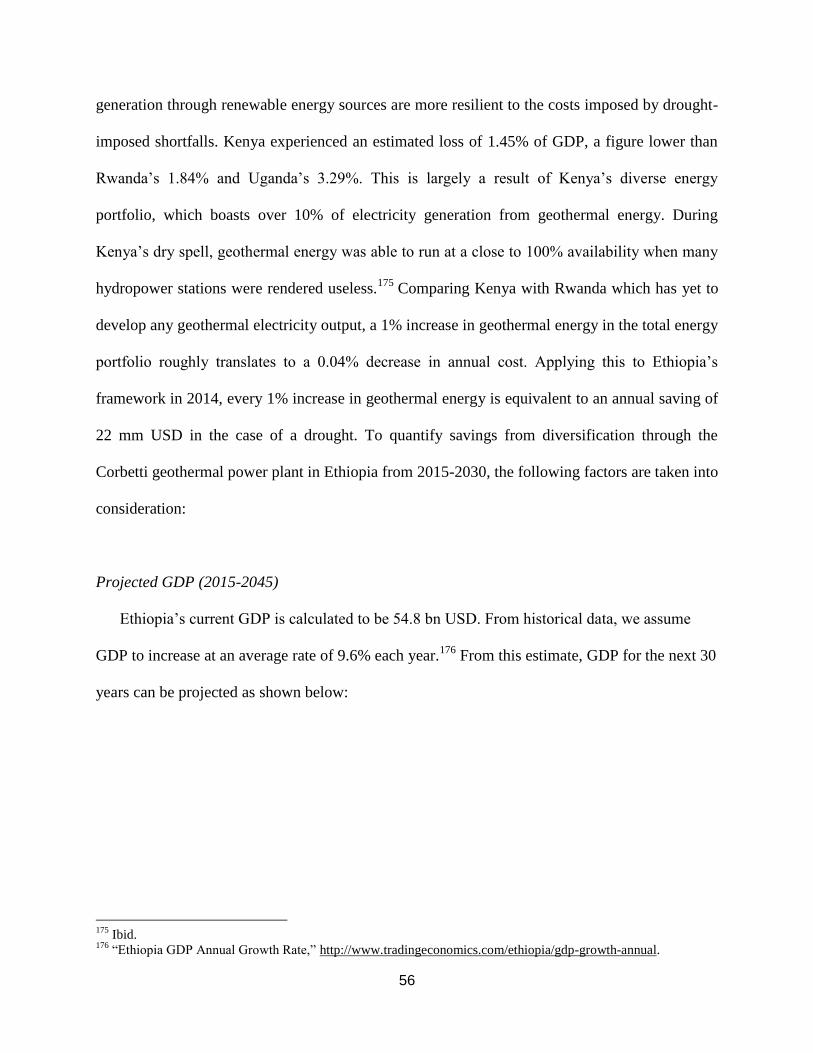
56
generation through renewable energy sources are more resilient to the costs imposed by drought-
imposed shortfalls. Kenya experienced an estimated loss of 1.45% of GDP, a figure lower than
Rwanda’s 1.84% and Uganda’s 3.29%. This is largely a result of Kenya’s diverse energy
portfolio, which boasts over 10% of electricity generation from geothermal energy. During
Kenya’s dry spell, geothermal energy was able to run at a close to 100% availability when many
hydropower stations were rendered useless.175
Comparing Kenya with Rwanda which has yet to
develop any geothermal electricity output, a 1% increase in geothermal energy in the total energy
portfolio roughly translates to a 0.04% decrease in annual cost. Applying this to Ethiopia’s
framework in 2014, every 1% increase in geothermal energy is equivalent to an annual saving of
22 mm USD in the case of a drought. To quantify savings from diversification through the
Corbetti geothermal power plant in Ethiopia from 2015-2030, the following factors are taken into
consideration:
Projected GDP (2015-2045)
Ethiopia’s current GDP is calculated to be 54.8 bn USD. From historical data, we assume
GDP to increase at an average rate of 9.6% each year.176
From this estimate, GDP for the next 30
years can be projected as shown below:
175
Ibid. 176
“Ethiopia GDP Annual Growth Rate,” http://www.tradingeconomics.com/ethiopia/gdp-growth-annual.
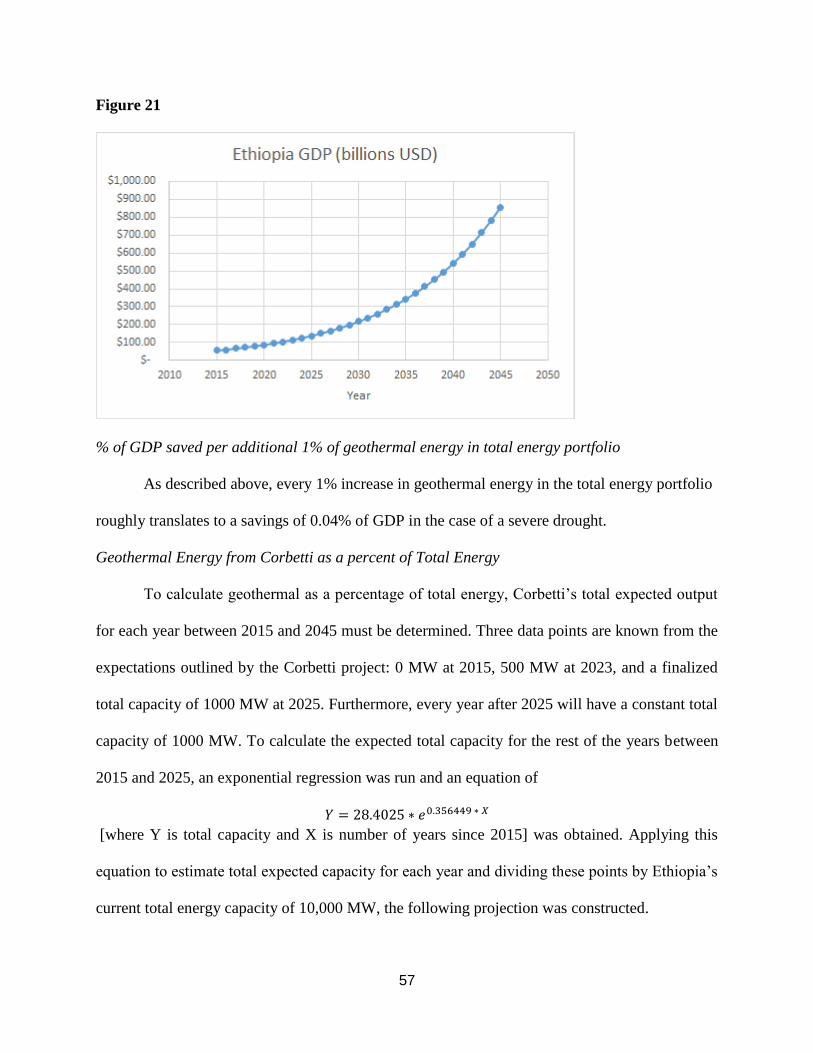
57
Figure 21
% of GDP saved per additional 1% of geothermal energy in total energy portfolio
As described above, every 1% increase in geothermal energy in the total energy portfolio
roughly translates to a savings of 0.04% of GDP in the case of a severe drought.
Geothermal Energy from Corbetti as a percent of Total Energy
To calculate geothermal as a percentage of total energy, Corbetti’s total expected output
for each year between 2015 and 2045 must be determined. Three data points are known from the
expectations outlined by the Corbetti project: 0 MW at 2015, 500 MW at 2023, and a finalized
total capacity of 1000 MW at 2025. Furthermore, every year after 2025 will have a constant total
capacity of 1000 MW. To calculate the expected total capacity for the rest of the years between
2015 and 2025, an exponential regression was run and an equation of
28.4025 0.3 6
[where Y is total capacity and X is number of years since 2015] was obtained. Applying this
equation to estimate total expected capacity for each year and dividing these points by Ethiopia’s
current total energy capacity of 10,000 MW, the following projection was constructed.
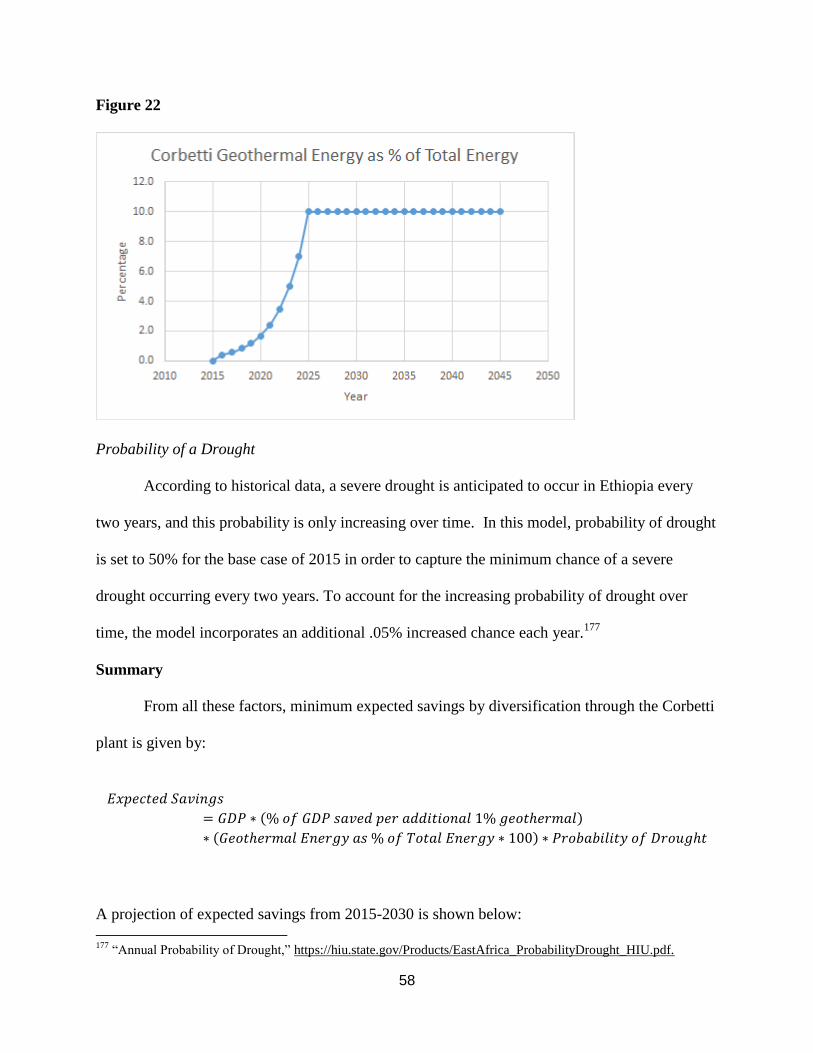
58
Figure 22
Probability of a Drought
According to historical data, a severe drought is anticipated to occur in Ethiopia every
two years, and this probability is only increasing over time. In this model, probability of drought
is set to 50% for the base case of 2015 in order to capture the minimum chance of a severe
drought occurring every two years. To account for the increasing probability of drought over
time, the model incorporates an additional .05% increased chance each year.177
Summary
From all these factors, minimum expected savings by diversification through the Corbetti
plant is given by:
𝐺𝐷 (% 𝐺𝐷 % ℎ )
(𝐺 ℎ % 00) 𝐷 ℎ
A projection of expected savings from 2015-2030 is shown below:
177
“Annual Probability of Drought,” https://hiu.state.gov/Products/EastAfrica_ProbabilityDrought_HIU.pdf.
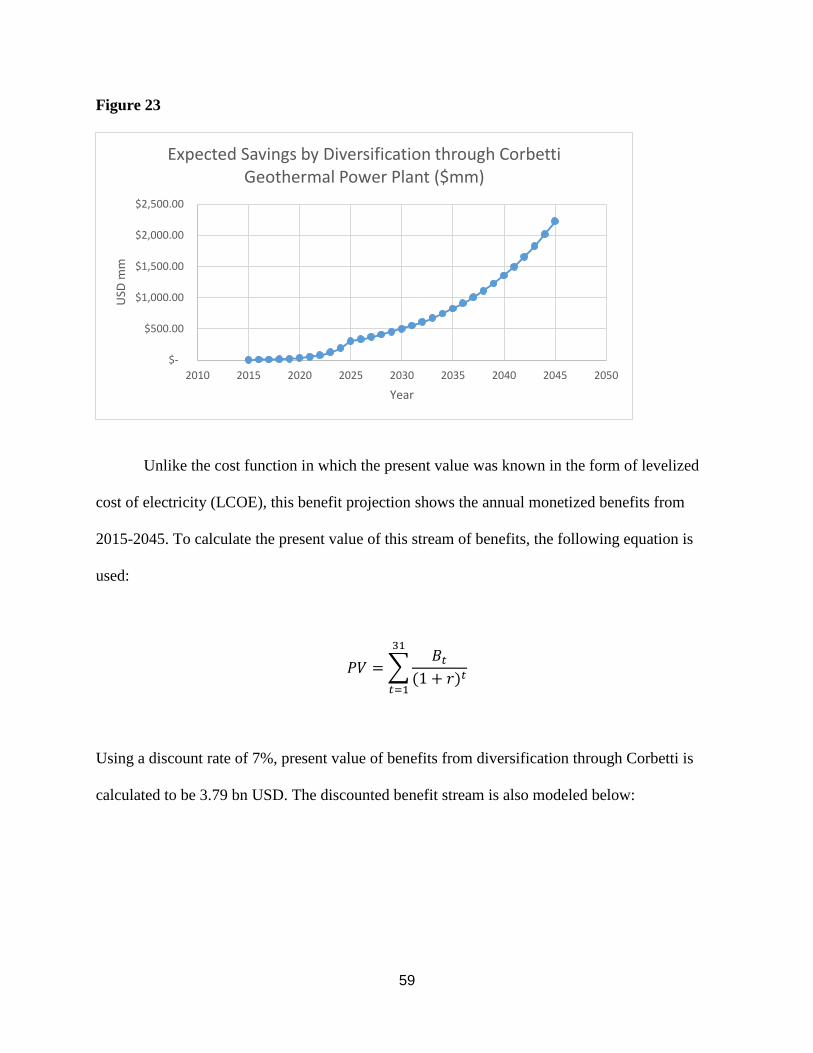
59
Figure 23
Unlike the cost function in which the present value was known in the form of levelized
cost of electricity (LCOE), this benefit projection shows the annual monetized benefits from
2015-2045. To calculate the present value of this stream of benefits, the following equation is
used:
∑
( )
3
Using a discount rate of 7%, present value of benefits from diversification through Corbetti is
calculated to be 3.79 bn USD. The discounted benefit stream is also modeled below:
$-
$500.00
$1,000.00
$1,500.00
$2,000.00
$2,500.00
2010 2015 2020 2025 2030 2035 2040 2045 2050
USD
mm
Year
Expected Savings by Diversification through Corbetti Geothermal Power Plant ($mm)
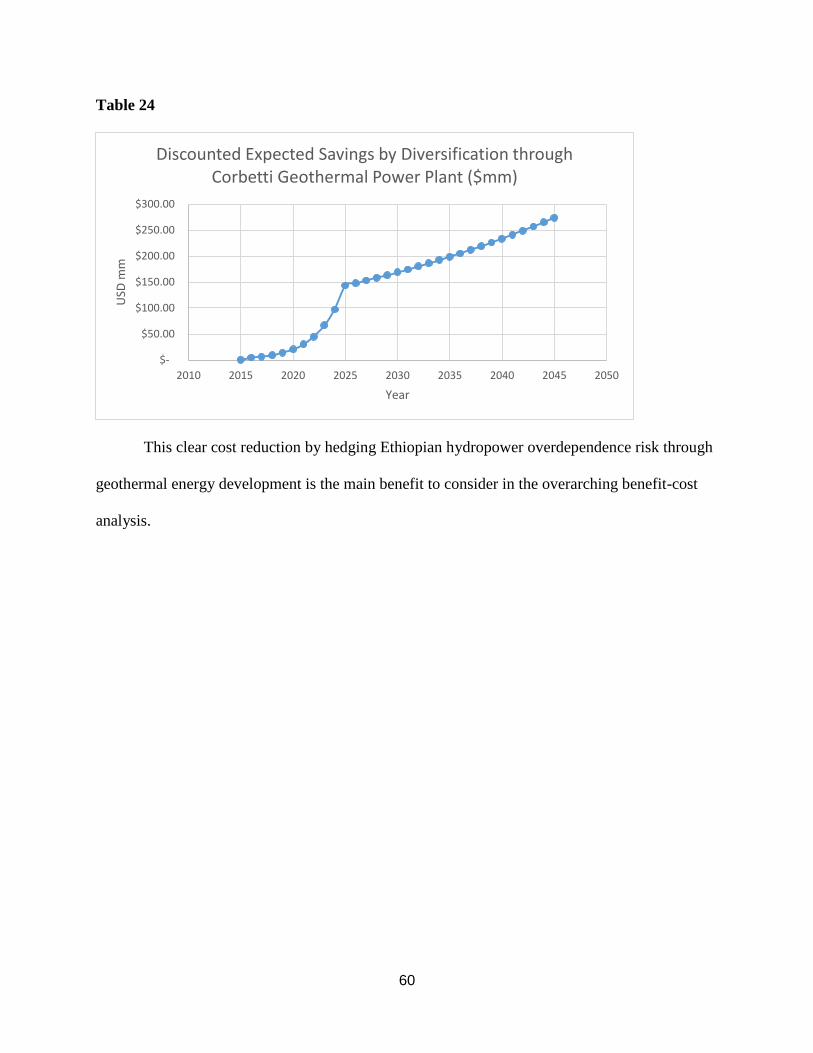
60
Table 24
This clear cost reduction by hedging Ethiopian hydropower overdependence risk through
geothermal energy development is the main benefit to consider in the overarching benefit-cost
analysis.
$-
$50.00
$100.00
$150.00
$200.00
$250.00
$300.00
2010 2015 2020 2025 2030 2035 2040 2045 2050
USD
mm
Year
Discounted Expected Savings by Diversification through Corbetti Geothermal Power Plant ($mm)
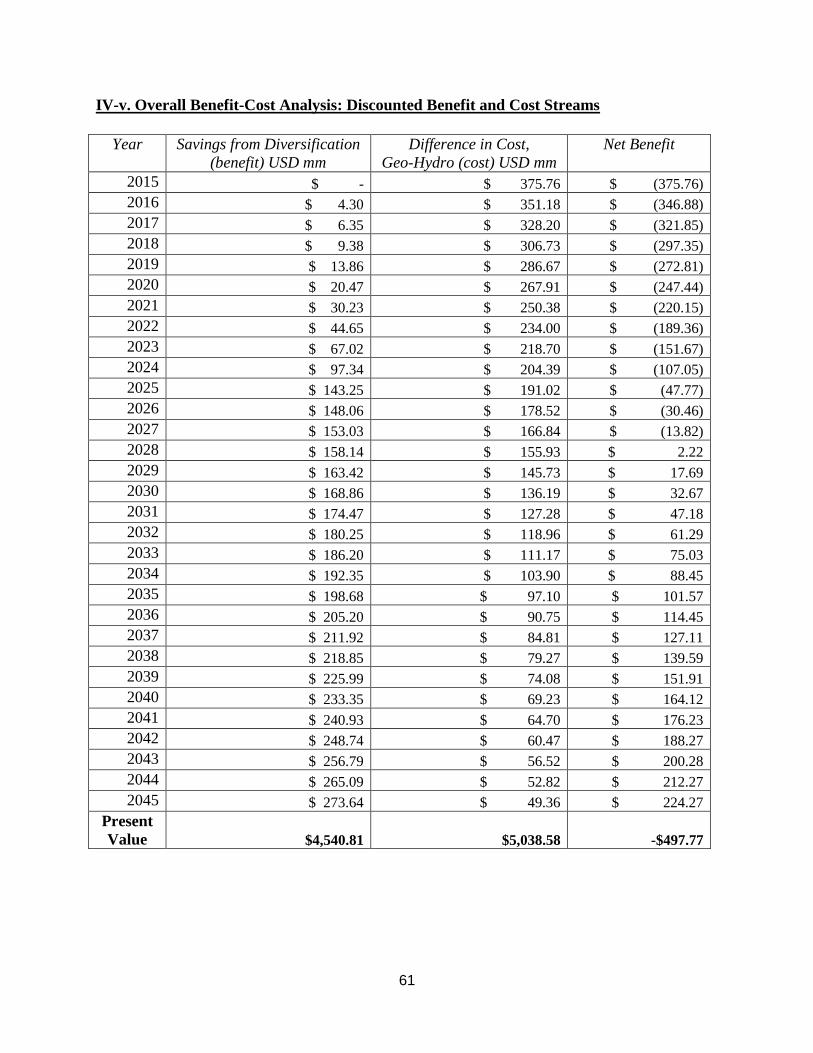
61
IV-v. Overall Benefit-Cost Analysis: Discounted Benefit and Cost Streams
Year Savings from Diversification
(benefit) USD mm
Difference in Cost,
Geo-Hydro (cost) USD mm
Net Benefit
2015 $ - $ 375.76 $ (375.76)
2016 $ 4.30 $ 351.18 $ (346.88)
2017 $ 6.35 $ 328.20 $ (321.85)
2018 $ 9.38 $ 306.73 $ (297.35)
2019 $ 13.86 $ 286.67 $ (272.81)
2020 $ 20.47 $ 267.91 $ (247.44)
2021 $ 30.23 $ 250.38 $ (220.15)
2022 $ 44.65 $ 234.00 $ (189.36)
2023 $ 67.02 $ 218.70 $ (151.67)
2024 $ 97.34 $ 204.39 $ (107.05)
2025 $ 143.25 $ 191.02 $ (47.77)
2026 $ 148.06 $ 178.52 $ (30.46)
2027 $ 153.03 $ 166.84 $ (13.82)
2028 $ 158.14 $ 155.93 $ 2.22
2029 $ 163.42 $ 145.73 $ 17.69
2030 $ 168.86 $ 136.19 $ 32.67
2031 $ 174.47 $ 127.28 $ 47.18
2032 $ 180.25 $ 118.96 $ 61.29
2033 $ 186.20 $ 111.17 $ 75.03
2034 $ 192.35 $ 103.90 $ 88.45
2035 $ 198.68 $ 97.10 $ 101.57
2036 $ 205.20 $ 90.75 $ 114.45
2037 $ 211.92 $ 84.81 $ 127.11
2038 $ 218.85 $ 79.27 $ 139.59
2039 $ 225.99 $ 74.08 $ 151.91
2040 $ 233.35 $ 69.23 $ 164.12
2041 $ 240.93 $ 64.70 $ 176.23
2042 $ 248.74 $ 60.47 $ 188.27
2043 $ 256.79 $ 56.52 $ 200.28
2044 $ 265.09 $ 52.82 $ 212.27
2045 $ 273.64 $ 49.36 $ 224.27
Present
Value $4,540.81 $5,038.58 -$497.77
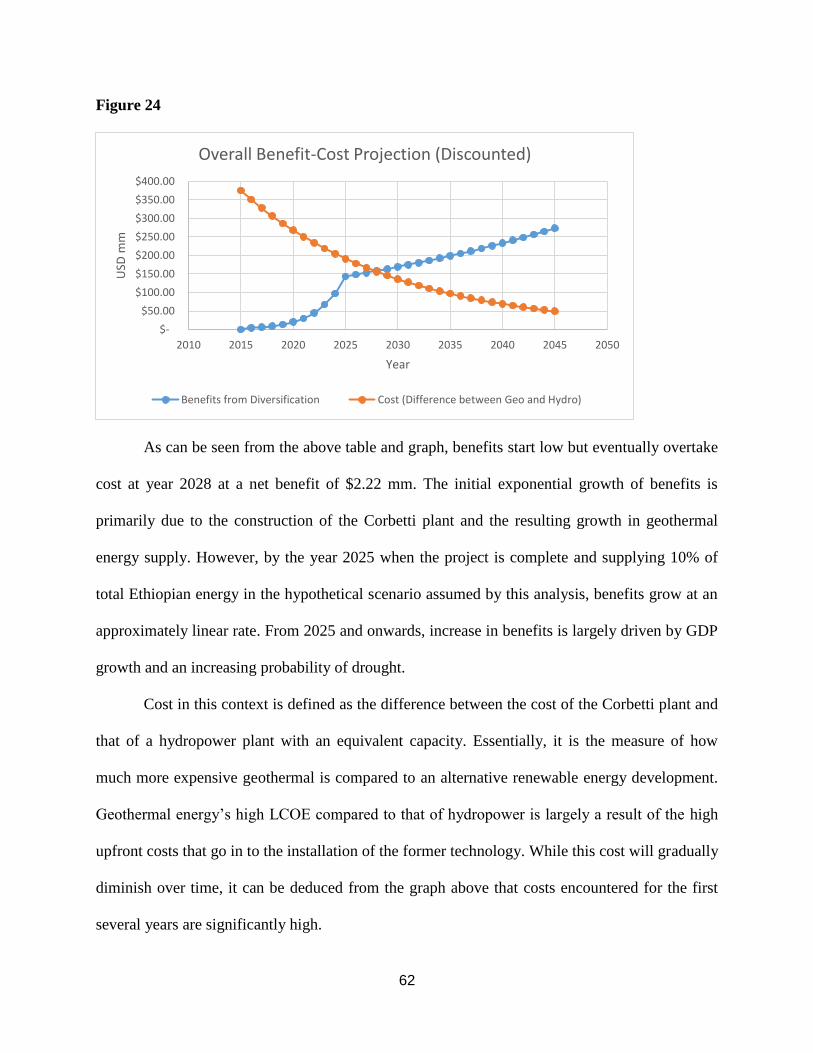
62
Figure 24
As can be seen from the above table and graph, benefits start low but eventually overtake
cost at year 2028 at a net benefit of $2.22 mm. The initial exponential growth of benefits is
primarily due to the construction of the Corbetti plant and the resulting growth in geothermal
energy supply. However, by the year 2025 when the project is complete and supplying 10% of
total Ethiopian energy in the hypothetical scenario assumed by this analysis, benefits grow at an
approximately linear rate. From 2025 and onwards, increase in benefits is largely driven by GDP
growth and an increasing probability of drought.
Cost in this context is defined as the difference between the cost of the Corbetti plant and
that of a hydropower plant with an equivalent capacity. Essentially, it is the measure of how
much more expensive geothermal is compared to an alternative renewable energy development.
Geothermal energy’s high LCOE compared to that of hydropower is largely a result of the high
upfront costs that go in to the installation of the former technology. While this cost will gradually
diminish over time, it can be deduced from the graph above that costs encountered for the first
several years are significantly high.
$-
$50.00
$100.00
$150.00
$200.00
$250.00
$300.00
$350.00
$400.00
2010 2015 2020 2025 2030 2035 2040 2045 2050
USD
mm
Year
Overall Benefit-Cost Projection (Discounted)
Benefits from Diversification Cost (Difference between Geo and Hydro)

63
Overall, while annual benefits do eventually catch up to costs and a positive net benefit is
achieved for every year after that point, this is not enough to offset the high initial cost of
geothermal energy. This is confirmed by subtracting the present value of cost from the present
value of benefits and arriving at a net present benefit of -$497.77 mm. If such a negative value is
achieved under assumptions built into the model, the benefit-cost analysis further justifies the
immense costs associated with developing geothermal energy that will only be magnified by the
conditions of the real world. For example, the entire benefit-cost analysis assumes that Corbetti
is the only power plant to be developed and Ethiopia’s total electricity capacity stays constant at
the 2015 target level of 10,000 MW. This assumption creates the case in which every additional
megawatt capacity of Corbetti has a large impact on increasing the total percent of geothermal
energy in the country’s overall energy portfolio.
However, in the real world, additional projects ranging from hydropower to wind are
going to be co-developed alongside Corbetti. These projects will inevitably increase the total
energy capacity of Ethiopia and the percentage of energy as geothermal will drop considerably,
drastically reducing savings from diversification. In this sense, the net present benefit of the
Corbetti plant is likely to be even more negative in the real world. While Ethiopia direly needs to
diversify its electricity generation in order to stabilize its supply, the negative net present benefit
produced by the benefit-cost analysis as well as consideration of real world factors that can
further drive this value even lower suggest that developing geothermal energy is an incredibly
costly venture which significantly impedes the potential benefits to be gained from this
renewable energy source.
64
V. Conclusion
From the results of the benefit-cost analysis, our final recommendation for the Ethiopian
government is that currently geothermal development is not a viable investment. Even with the
potential benefits from diversification that are only growing over time, the associated costs of
installation and maintenance are much too high to be outweighed by these benefits. That being
said, geothermal plant development is not completely out of Ethiopia’s energy forecast. Once
technological and efficiency innovations begin to drive down Ethiopian geothermal LCOE,
geothermal is a key renewable energy source through which increased energy security can be
attained. By serving as a substitute for drought-vulnerable hydroelectric power, geothermal
electricity can significantly hedge against the costs associated with the increasing risks
associated with climate change.
From our LCOE analysis, we determined key technological and efficiency factors that
can drive down costs to include an increased capacity factor and decreased installation cost.
Advances in geothermal power plant technology have allowed some plants to achieve a capacity
factor of 90%, compared to the average 75% used by this paper’s model to calculate cost. 178
Furthermore, installation costs are expected to go down as exploration and drilling begins to be
completed by pilot projects such as Corbetti. 179
With these clear improvements in efficiency
taking place, geothermal LCOE is expected to reach lower levels over time. In the present day,
the Ethiopian government can actively implement measures to accelerate this decrease in cost
driven by technological innovation by promoting research and development as well as investing
in human capital, similar to the previous policies made by the Icelandic government.
178
Barry Goldstein et al. “Geothermal Energy” (In IPCC Special Report on Renewable Energy Sources and Climate
Change Mitigation) 179
Ibid.
65
Once a profitable LCOE is reached in the future and geothermal becomes a viable avenue
for diversification, there are several factors that the Ethiopian government must consider in their
development strategy. For example, as described in the benefit-cost analysis, it is important to
consider the overall energy portfolio and the other on-going energy development beside
geothermal. If Ethiopia develops 1000 MW of geothermal and 1000 MW of hydroelectricity at
the same time, geothermal energy as a percentage of total energy will not be as high as the case
in which only geothermal is developed, marginally driving down expected savings from
diversification. A potential way to ensure a certain energy distribution is maintained is for the
Ethiopian government to implement capital subsidies to motivate geothermal over other
alternative sources.
Ultimately, the main benefit for geothermal electricity generation in Ethiopia is in dealing
with the risks of overreliance on hydroelectric power. However, diversification through other
energy sources such as geothermal is not the only way to mitigate this risk. Until a viable cost for
geothermal energy is attainable, Ethiopia can advance its current hydropower infrastructure
through reservoir improvements and better watershed management, along with promoting
technological innovations that will lower geothermal costs. And, when geothermal LCOE is
finally low enough, Ethiopia can truly mitigate overdependence risk through diversification and
utilize the parameters outlined in this paper in their implementation of geothermal energy.
66
Works Cited
Abdu, Brook. “Ethiopia: Electric Power Signs Groundbreaking Agreement to Buy Geothermal
Energy,” last modified August 3, 2015, http://allafrica.com/stories/201508032221.html.
Akele, Soyoum. “Customer Service Quality in Ethiopian Electric Power Coorporation,” Uppsala
University, 2012.
“Annual Probability of Drought,”
https://hiu.state.gov/Products/EastAfrica_ProbabilityDrought_HIU.pdf.
Bayissa, Bekele. “A Review of the Ethiopian Energy Policy and Biofuels Strategy,” Digest of
Ethiopia's National Policies, Strategies and Programs (Addis Ababa, Ethiopia: Forum
for Social Studies, 2008). 209-237.
Castellano, Antonio, Adam Kendall, Mikhail Nikomarov and Tarryn Swemmer. Brighter Africa:
The growth potential of the sub-Saharan electricity sector. February 2015,
http://www.mckinsey.com/~/media/mckinsey/dotcom/insights/energy%20resources%20
materials/powering%20africa/brighter_africa_the_growth_potential_of_the_sub-
saharan_electricity_sector.ashx, 1-64.
“Corbetti project signs 500 MW PPA with Ethiopian State Utility, last modified July 27, 2017,
http://www.thinkgeoenergy.com/corbetti-project-signs-500-mw-ppa-with-ethiopian-state-
utility/.
Davison, William. “Ethiopia agrees on first deal for privately produced electrivity after Obama
visit,” last modified July 29, 2015, http://mgafrica.com/article/2015-07-29-ethiopia-
agrees-on-first-deal-for-privately-produced-electricity-after-obama-visit.
Deichmann, Uwe, Craig Meisner, Siobhan Murray, and David Wheeler. “The economics of
renewable energy expansion in rural Sub-Saharan Africa,” Energy Policy 39 (2011): 215-
227. October 13, 2010, http://ac.els-cdn.com/S0301421510007202/1-s2.0-
S0301421510007202-main.pdf?_tid=549cab30-971e-11e5-9ea3-
00000aab0f27&acdnat=1448859402_0295d6fa5ceb2da901f3627753289ce1.
Derbew Dereje. “Ethiopia’s Renewable Energy Power Potential and Development
Opportunities,” Ministry of Water and Energy. June 22, 2013,
https://irena.org/DocumentDownloads/events/2013/July/Africa%20CEC%20session%20
3_Ministry%20of%20Water%20and%20Energy%20Ethiopia_Beyene_220613.pdf. 86-
93.
“Divergent Boundary”, Kids-Fun-Science.com, Accessed November 29, 2015, http://www.kids-
fun-science.com/divergent-boundary.html
E.J.M. Van Heesch, “Ethiopian Power Grid,” Electrical Power Engineering & Environment.
March 21, 2014. 1-32.
67
“Electricity Generation: Generation of Electricity using geothermal energy”, National Energy
Authority, Accessed November 29, 2015, http://www.nea.is/geothermal/electricity-generation/.
Embassy of Japan in Ethiopia. “Study on the Energy Sector in Ethiopia,” September, 2008.
“Ethiopia (2014),” REEEP, October 11, 2013, https://www.reeep.org/ethiopia-2014.
“Ethiopian Main Rift Volcanism (RiftVolc)”, the University of Edinburgh, Accessed November
29, 2015, http://www.geos.ed.ac.uk/riftvolc.
“Ethiopia to step up as regional clean power exporter,” World Bulletin. May 13 2015,
http://www.worldbulletin.net/news/159130/ethiopia-to-step-up-as-regional-clean-power-
exporter.
Farrell, John. “The Challenge of Reconciling a Centralized v. Decentralized Electricity System,”
Institute for Local Self-Reliance. October 17, 2011, https://ilsr.org/challenge-reconciling-
centralized-v-decentralized-electricity-system/.
Goldstein, B., G. Hiriart, R. Bertani, C. Bromley, L. Gutiérrez-Negrín, E. Huenges, H. Muraoka,
A. Ragnarsson, J. Tester, V. Zui. “Geothermal Energy.” In IPCC Special Report on
Renewable Energy Sources and Climate Change Mitigation [O. Edenhofer, R. Pichs-
Madruga, Y. Sokona, K. Seyboth, P. Matschoss, S. Kadner, T. Zwickel, P. Eickemeier,
G. Hansen, S. Schlömer, C. von Stechow (eds)], Cambridge University Press,
Cambridge, United Kingdom and New York, NY, USA.
Hafstad, Vala. “Reykjavik Geothermal and Iceland Drilling Sign Agreement In Ethiopia,” last
modified August 5, 2015, http://icelandreview.com/news/2015/08/05/reykjavik-
geothermal-and-iceland-drilling-sign-agreement-ethiopia.
Helgason, Hafsteinn, “Geothermal Power in Iceland”, Presented at the Geothermal Energy
Workshop, Salta, December, 2014,
https://www.google.com/url?sa=t&rct=j&q=&esrc=s&source=web&cd=3&ved=0ahUKE
wi4spqK7abJAhWHmx4KHU7YDaEQFggqMAI&url=http%3A%2F%2Falcuenet.eu%2
Fdms-
files.php%3Faction%3Ddoc%26id%3D680&usg=AFQjCNHqkhR4BecrSq8MAQRJavY
gJDIa-Q&sig2=ktsBCsWV9wrXcqn0aQQTVQ.
International Energy Agency. Africa Energy Outlook: A focus on energy prospects in
sub-Saharan Africa. 2014,
https://www.iea.org/publications/freepublications/publication/WEO2014_AfricaEnergyO
utlook.pdf. 1-242.
Japan International Cooperation Agency. “Energy Policy of Ethiopia,” IEEJ. July 5, 2011,
https://eneken.ieej.or.jp/data/3959.pdf. 1-36.
Kebede, Solomon. “Geothermal Exploration and Development in Ethiopia: Status and Future
68
Plan.” Paper presented at Short Course VII on Exploration for Geothermal Resources,
Kenya, October 27-November 18, 2012.
Krewitt, W., K. Nienhaus, C. Kleßmann, C. Capone, E. Stricker, W. Graus, M. Hoogwijk, N.
Supersberger, U. von Winterfeld, and S. Samadi (2009). “Role and Potential of Renewable
Energy and Energy Efficiency for Global Energy Supply,” Climate Change, 18/2009.
Kumar, A., T. Schei, A. Ahenkorah, R. Caceres Rodriguez, J.-M. Devernay, M. Freitas, D. Hall,
. Killingtveit, Z. Liu, 2011: Hydropower. In IPCC Special Report on Renewable Energy
Sources and Climate Change Mitigation [O. Edenhofer, R. Pichs-Madruga, Y. Sokona, K.
Seyboth, P. Matschoss, S. Kadner, T. Zwickel, P. Eickemeier, G. Hansen, S. Schl mer,
C. von Stechow (eds)], Cambridge University Press, Cambridge, United Kingdom and
New York, NY, USA.
Ketilsson, Jonas, “Geothermal Utilization in Iceland”, Accessed November 29, 2015,
https://www.google.com/url?sa=t&rct=j&q=&esrc=s&source=web&cd=16&cad=rja&ua
ct=8&ved=0ahUKEwins-
Ka6abJAhVIWz4KHcNoD0I4ChAWCDAwBQ&url=https%3A%2F%2Fwww.mos.gov.
pl%2Fg2%2Fbig%2F2014_10%2F3c0e118708254243d111c18a4eeb7f2d.pdf&usg=AFQ
jCNEY_ZcO8-CrTsdN0QJhoUwUfqgmSw&sig2=af5Dq2nArQi6OzaC9WayDA.
Lemma, Mekuria. “Power Africa Geothermal Roadshow.” Ministry of Water and Energy,
September 28, 2014.
Loftsdottir, Agusta S. and Ragnheidur I. Thorarinsdottir, Energy in Iceland: Historical
Perspective, Present Status, Future Outlook, Printing: Gudjon O, Second edition,
September 2006, ISBN: 9979-68-198-5, 10
Ministry of Water and Energy. “Scaling-up Renewable Energy Program Ethiopia Investment
Plan,” Investment Plan for Ethiopia. March 8, 2012. 1-115.
Naod Mekonnen, “Energy Use Patterns and Energy Efficiency in Ethiopia,” Ethiopian Economic
Policy Research Institute. 1-8.
Rai, Neha, Naki Kaur, Daniel Fikreyesus, Misgana Elias Kallore. “Scaling up Renewable Energy
Programme (SREP) in Ethiopia - a status review,” Climate Investment Funds. September
2013, http://pubs.iied.org/pdfs/10053IIED.pdf, 1-24.
Reykjavik Geothermal. “Geothermal Development in Africa: The Corbetti Example,” Accessed
November 29, 2015.
Senelwa, Kennedy. “Africa: Ethiopia Plans Africa’s Largest Geothermal Well,” last modified
August 1, 2015, http://allafrica.com/stories/201508031511.html.
69
“Sustainable Utilisation”, National Energy Authority, Accessed November 29, 2015,
http://www.nea.is/geothermal/sustainable-utilization/
Teklemariam, Meseret. “Geothermal Exploration and Development in Ethiopia,”
http://www.ethdiaspora.org.et/phocadownloadpap/Publications/geothermal%20potential
%20of%20ethiopia.pdf, 86-93.
Teske, S., T. Pregger, S. Simon, T. Naegler, W. Graus, and C. Lins (2010). “Energy [R]evolution
2010—a sustainable world energy outlook.” Energy Efficiency.
Tessema, Zereay, Brijesh Mainali, and Semida Silveira. “Mainstreaming and sector-wide
approaches to sustainable energy access in Ethiopia,” Energy Strategy Reviews 2 no. 3-4
(2014): 313-322. February 2014, http://ac.els-cdn.com/S2211467X13000977/1-s2.0-
S2211467X13000977-main.pdf?_tid=49a40e80-8fd5-11e5-8b32-
00000aab0f27&acdnat=1448058373_0f4fd08d3eaf3bce2f77cf118ff7baf7.
The World Bank. “Implementation Completion and Results Report,” Energy and Extractives
Global Practice Country Department. June 24, 2015. 1-81.
Trading Economics. “Ethiopia GDP Annual Growth Rate,”
http://www.tradingeconomics.com/ethiopia/gdp-growth-annual.
USAID. “Power Africa,” last modified November 10, 2015, https://www.usaid.gov/powerafrica.
USAID. “What Power Africa Means for Ethiopia,” last modified July 25, 2015,
https://www.usaid.gov/powerafrica/partners/african-governments/ethiopia.
U.S. Department of State. “Ethiopia Investment Climate Statement 2015,” 2015 Investment
Climate Statement, May 2015.