Embed Size (px)
Citation preview

Energy and Energy Policy, BPRO29000
Brazil’s Belo Monte: A Cost-Benefit Analysis
Prepared by:
Apratim Guatam
Ian Haubold
Vicky Pacey
David Papirnik
Mehek Premjee
Patrick Schlumpf
Prepared for:
Dr. R. Stephen Berry
Dr. George Tolley

ACKNOWLEDGEMENTS
We would like to thank the following people for their help throughout the quarter:
Professor R. Stephen Berry, Professor George Tolley, Jing Wu, and Jaeyoon Lee.
TABLE OF CONTENTS
I. Abstract……………………………………………………………………… 5
II. Introduction…………………………………………………………………. 6
Goal………………………………………………………………………. 6
The Basics……………………………………………………………….. 6
Baseline Figure: Average Power Production……………………………...7
Belo Monte’s Past: A Brief History……………………………………...10
Energy Consumption in Brazil…………………………………………...17
Brazil’s Electricity Production: A Hydroelectric Focus………………… 19
III. Dam Technology…………………………………………………………….21
History……………………………………………………………………21
Turbine Efficiency………………………………………………………. 23
Design…………………………………………………………………… 23
IV. Cost-Benefit Inputs………………………………………………………… 29
Financial and Economic Costs and Benefits……………………………..29
Environmental Costs and Benefits……………………………………….37
Social and Political Costs and Benefits…………………………………. 47

V. Analysis……………………………………………………………………... 52
Scenario A: The Base Case……………………………………………… 55
Scenario B: Initial Budget………………………………………………..61
Scenario C: Longer Construction Period, Increased Overrun Factor…… 63
Scenario D: Slightly Improved Capacity Factor…………………………65
Scenario E: The Miracle, Maximum Capacity………………………….. 67
Scenario F: Extreme Weather and the Possibility of Droughts…………. 69
Scenario G: Decrease in Price of Alternatives…………………………...72
Discount Rate Sensitivity Analysis………………………………………74
VI. Conclusion………………………………………………………………….. 76
VII. Contributions………………………………………………………………. 79
VIII. Bibliography………………………………………………………………...80

I. ABSTRACT
This paper analyzes the costs and benefits of Brazil’s Belo Monte hydroelectric dam
complex. We also provide a historical and technological introduction to Belo Monte. The
cost and benefit analysis begins with a careful consideration of inputs, and includes a
discussion of both quantifiable and unquantifiable costs and benefits. Finally, an analysis
of Belo Monte’s net present value across seven distinct scenarios and across a range of
discount rates is conducted. Our paper finds that Belo Monte is very unlikely to be a
positive net present value project over a time horizon of fifty years.

II. INTRODUCTION
Goal
The goal of this paper is to consider the costs and benefits of the Belo Monte Dam in
Brazil. Though a significant source of renewable energy and arguably a necessary project
if Brazil’s economic growth is to be sustained, the dam’s positives are diminished by its
high upfront costs and its associated, and significant, political, environmental and social
costs. After an introduction to the dam and its technology and a consideration of the
aforementioned costs and benefits, we will conduct an analysis of Belo Monte’s net
present value across seven scenarios and a range of discount rates to determine under
what scenarios Belo Monte is likely to have a positive or negative net present value.
Please note that we use an exchange rate of 2.57 Brazilian reals (R$) per US dollar ($) for
the entirety of the paper.
The Basics
The Belo Monte Dam is currently under construction in the northern Brazilian state of
Pará. Situated on the “Big Bend” of the Xingu River (a major tributary of the Amazon),
Belo Monte is due to become the world’s third largest hydroelectric dam complex in
terms of installed capacity1; its maximum output of 11,233 megawatts (MW) will place it
1 Installed capacity (also known as nameplate capacity or rated capacity) is maximum output or, in other words, power production during ideal circumstances.

behind only the Itaipu Dam on the Brazil Paraguay border and the Three Gorges Dam in
Chinai. The vast majority of this generating capacity – a full 11,000 MW – will come
from the main power station situated alongside the namesake damii. However, two other
dams are central to the production of electricity at the Belo Monte station. Pimental, the
largest of the three, is located about 60 km upstream of Belo Monte and diverts much of
the Xingu into the Canals Reservoir from which Belo Monte draws its wateriii. Pimental
also contains the auxiliary power station that supplies the remaining 233 MWiv. Bela
Vista, the third and final dam, acts as the Reservoir’s spillwayv. That is to say, along with
Pimental, Bela Vista helps control water levels. Throughout this paper, we use “Belo
Monte” to refer to the entire complex, as well as the supplementary dykes and canals,
unless specified otherwise.
Figure 2.1vi: The “Big Bend” of the Xingu River

Baseline Figure: Average Power Production
Although the installed capacity of Belo Monte is 11,233 MW, the dam will actually
produce, on average, 4,571 MW of powervii. That is to say, Belo Monte’s projected
capacity factor2 is 40.7%. Many opponents of the dam note this figure with dismay.
Although this number may seem low, Table 2.1, which presents the capacity factor of
Belo Monte relative to certain geographical averages and to the only four existing dams
with installed capacities over 10,000 MW, shows that this is not necessarily the case.
Table 2.1: Belo Monte’s Capacity Factor vs. The World
Capacity Factor
Belo Monte 40.7%
Three Gorges (China)viii 46%
Itaipu (Brazil-Paraguay)ix 75%
Xiluodo (China)x 47%
Guri (Venezuela)xi 52%
Brazilian Averagexii 56%
Latin American Averagexiii 54%
World Averagexiv 44%
2 A capacity factor is simply a ratio consisting of actual output divided by installed capacity over some given amount of time (for us, this time period is a year).

While Belo Monte’s capacity factor is over 10% lower than the Brazilian and Latin
American average capacity factors, the Brazilian average is calculated using all dams
with an installed capacity over 30 MW and the Latin American average is calculated
using dams of all sizesxv. Therefore, since smaller dams tend to have much larger
capacity factors, comparing Belo Monte to these figures does not seem particularly apt.
When comparing Belo Monte with the other dams in the world that have an installed
capacity over 10,000 MW, we see that Belo Monte still has a low capacity factor
(especially when compared to Itaipu), though the difference is not quite as glaring. For
hydroelectric dams, capacity factors can be influenced by water availability, equipment,
and how the hydroelectric power is employed (for instance, is the energy only supplied
during peak hours, or is it base-load generation). In the case of Belo Monte, water
availability plays the largest role. One reason for this is that the dam is meant for base-
load supply – it is meant to be a constant contributor to the electricity grid. Naturally,
dams designed to produce electricity for peak hours will have lower capacity factors, but
since Belo Monte is primarily designed for base-load generation, this cannot be what is
driving down the capacity factor. Often, water issues are solved through reservoirs that
help stabilize the flow of water and through careful surveys of the land and water.
Though Belo Monte includes a large reservoir, it seems to be the case that the river flow
is such that, even with the reservoir, the capacity factor is relatively low. Still, when
compared to the other large capacity dams, Belo Monte’s capacity factor is not quite as
dismal as on first sight.

Finally, given the dam’s capacity and its average power production 4,571 MW, we
calculate the total energy produced by Belo Monte in a year. We will assume that the
dam runs 24 hours a day for 360 days per year (i.e. the availability factor of the dam is
98.6% due to maintenance, extremely low water flows, etc. – this figure is consistent with
general hydroelectric plants). Therefore, the total energy produced by the dam in a year is
equivalent to 39,493,440 MWh.
Table 2.2: Key Figures
Belo Monte Average Power Production 4,571 MW
Annual Energy Produced by Belo Monte 39,493,440 MWh
Belo Monte’s Past: A Brief History
Historical perspective is important when trying to understand the general significance and
controversy of the Belo Monte Dam. Though this section is lengthy, the reader will find
some historical understanding useful when reading later sections of this paper.
Beginning and Failure
The possibility of a major hydroelectric dam near the village of Belo Monte do Pontal
was first identified between 1975 and 1979, when a hydrographic study funded by
Eletrobras, a government majority-owned power utility company and the largest power

utility company in Latin America, listed the site as one of six on the Xingu River for
potential developmentxvi. The key feature of the Belo Monte site was the “Volta Grande”
or “Big Bend” of the Xingu River. The 140 km “Bend” sees the river’s elevation fall by
93 meters (a sizeable drop in Amazonia) and provides the opportunity to cut a relatively
short and direct path from upstream to downstreamxvii. Such considerations are vital when
designing dams, as is discussed in ‘Dam Technology’.
In 1987, eight years after this initial study, Eletrobras officially released its “2010 Plan,”
which mapped out the construction of 297 dams across Brazil by 2010, including the six
on the Xingu Riverxviii. However, the Xingu dams faced major opposition. Spearheaded
by the indigenous Kayapo people, whose lands bordered much of the Xingu and who felt
threatened by the fact that the dams would flood their lands and disrupt the river
ecosystem that was vital to their way of life, opponents of the Xingu dams made the
Brazilian governments’ efforts known to the world. In fact, Kayapo leaders, outraged by
the Brazilian government’s disregard for their civil rights, met with members of the US
Congress and the World Bank in 1987, eventually convincing the Bank to deny the
Brazilian government a loan that was earmarked for the construction of the Xingu
damsxix. The opposition to the dams culminated with the five-day “Altamira Gathering”
of 1989, where around 500 Kayapo people, as well as farmers and other opponents of the
dams, gathered to protest and hold a media conference xx . The event shined an
international spotlight on the Brazilian government. Pope John Paul II sent a telegram of
support to the Kayopa people. The rock star Sting spent a day in Altamira showcasing his
commitment to the Kayopa. Other members of the “Gathering” included a British

Member of Parliament and a Belgium Member of the European Parliamentxxi. Within two
weeks of the “Altamira Gathering,” and with the World Bank refusing to grant Brazil the
loan, the Brazilian National Congress announced that it would conduct a formal
investigation of the Xingu damsxxii. The final result was a shelving of five of the six dams
Eletrobras had planned to build on the Xingu River. The only remaining dam was the one
at Belo Monte, and even Belo Monte was to be subject to further review.
Between 1989 and 2002, Eletronorte (a subsidiary of Eletrobras in charge of power
generation and distribution in northern Brazil), slowly and discretely revived the idea of a
Belo Monte Dam Complexxxiii . The dam was redesigned, Eletronorte increased its
political activity in the state of Pará, new environmental impact assessments were made,
and, when low waters at existing dams led to an electricity supply and distribution crisis
in the spring of 2001, Belo Monte was once more considered as a potential solutionxxiv.
However, it was not until Luiz Inácio Lula da Silva became Brazil’s president in 2003
that the second attempt at building Belo Monte Dam succeeded. Early in his term,
President Lula made it clear that one of his main goals was to complete many of the
country’s stalled infrastructure projectsxxv . Much of the focus was directed at 18
hydroelectric dams, with Belo Monte the foremost of them. In 2005, the Brazilian
National Congress passed legislative decree 788, which authorized construction of the
Belo Monte Dam, subject to the approval of the relevant environmental and financial
agenciesxxvi. The Senate passed the decree within three days of it being passed by the
house – an unheard of level of expediency for the National Congressxxvii. Moreover, since

the environmental and financial agencies are part of Brazil’s executive branch, it was
widely expected that they would support President Lula’s direction, and that the building
of Belo Monte was a foregone conclusion.
Second Time’s a Charm
In 2008, a new environmental assessment by Eletrobras led to more design changes,
specifically the addition of the Canals Reservoir in order to avoid the flooding of
indigenous lands. In 2010, the Brazilian environmental agency, the Brazilian Institute of
Environment and Renewable Natural Resources (IBAMA), granted a partial preliminary
license, the first of the three necessary licenses, to the project and, later that year, Norte
Energia, a consortium 49% owned by Eletrobras and 75% stake-owned by government
institutions as a whole, won the project auctionxxviii. However, Norte Energia’s winning
bid of R$77.97/MWh was more than 6% cheaper than the price ceiling of R$83/MWh,
which many potential bidders balked at as economically unfeasible xxix. Unsurprisngly,
the bid itself was thus subject to much scrutiny. Indeed, the Brazilian Federal Attorney
General’s Office investigated the bid, and eventually suspended the partial preliminary
license granted by IBAMA on the grounds that partial licenses were not permitted under
Brazilian lawxxx. However, a regional appellate court overruled this decision and, in
August of 2010, President Lula and Norte Energia signed a contract for the construction
of the Belo Monte Damxxxi.
Nonetheless, licensing issues for the dam did not stop with the signing of the agreement
between Lula and Norte Energia. In January 2011, the full preliminary license was

granted by IBAMA, but it included 40 “mitigation actions” that Norte Energia would
need to take before the second license, the installation license that is necessary to start
construction, would be grantedxxxii. The then President of IBAMA, Abelardo Bayma
Azevedo, was particularly adamant about these “mitigation actions” and refused to grant
Norte Energia a full installation license as he maintained that the project was rife with
environmental problems that were not being properly addressed. Under heavy political
pressure from the administration of President Rousseff (who succeeded Lula in 2011 and
continued many of Lula’s infrastructure policies), Azevedo was forced to resign in
January 2011. The new IBAMA president was appointed in February of that year and, by
June, he granted the installation license to Norte Energia under the condition that the
consortium would spend $1.9 billion to address the social and environmental issues noted
by Brazil’s National Indian Foundation (FUNAI)xxxiii.
From the granting of the full installation license in June 2011 to the present day, Belo
Monte has been embroiled in a series of lawsuits, protests, suspensions of work, and
strikes. In October 2011, for instance, 600 members of 21 indigenous tribes occupied the
Belo Monte work site and had to be intimidated into leaving by military policexxxiv.
Combinations of students, NGOs, farmers, and fishermen have held similar protests, and
clashes ranging from blocking ferries from transporting machinery down the Xingu River
to occupying the roads that lead to the work site have occurred. Workers, unhappy with
working conditions and pay, have revolted and held strikes on multiple occasions as well,
even burning down parts of the Pimental construction site in March 2013. There have
been prostitution and human trafficking scandals, detentions of Norte Energia engineers

by indigenous tribes, and even a November 2013 European Parliament conference on the
topic of Belo Montexxxv.
Perhaps the most significant event since the granting of the installation license, however,
occurred on August 14, 2012, when a Brazilian federal appeals court ordered all
construction of the dam to be haltedxxxvi. The indigenous people of the region claimed
that the Brazilian National Congress and Norte Energia had not properly consulted them
regarding the project before construction began. A clause in the Brazilian constitution,
derived from the International Labour Organization’s Convention 169 (of which Brazil is
a signatory), required such consultationxxxvii. Living next to the part of the river whose
flow the Pimental Dam restricts (up to about 80% of the water’s previous flow is diverted
into the Canais Reservoir), the indigenous tribes claimed dependence on the water. The
indigenous tribes’ case was endorsed by, among others, the Human Rights Commission
of the Organization of American States and the Brazilian Public Ministry (a branch of the
Ministry of Justice)xxxviii. However, the Chief Justice of the Brazilian Supreme Court,
Carlos Ayres Britto, unilaterally overturned the appeal court’s ruling and work was thus
allowed to resume after only about a week’s pausexxxix. This ruling, more so than
anything else that has occurred over the lifetime of the Belo Monte Dam, captured the
importance of the project for the Brazilian government. Belo Monte is a huge financial
and political capital investment by the executive branch of the Brazilian government – it
is important enough to have pressured the judiciary into what was, by most accounts, a
controversial decision, one that was viewed by many as making a mockery of the
democratic process.

Despite all the issues, construction of the Belo Monte Dam has lumbered on. Roads have
been built, over a “Panama-Canal’s worth” of soil and rock has been excavated, dams are
slowly being erected, and around 20,000 workers (a population larger than almost 75% of
Brazil’s 5,600 municipalities) are working virtually day and night to make the
hydroelectric complex a realityxl. The auxiliary powerhouse, though three-months behind
schedule, is expected to start producing energy in May 2015, while the main station at
Belo Monte is projected to have its turbines gradually started up between 2016 and
2019xli. More outrage, problems, and hiccups will certainly occur, but one thing is clear:
the second time around has been a charm. Belo Monte is currently over 50% complete,
and the Brazilian executive branch will see the Belo Monte Dam project to the endxlii.

Energy Consumption in Brazil
As Figure 2.2 shows, Brazil’s energy demand grew at an average rate of 3.85% between
1980 and 2011 (the US’s energy consumption, by comparison, grew at an average of
0.5%). From 2000 to 2010, energy consumption increased by a little over 30%. This huge
increase in energy consumption coincided with the emergence of Brazil as a strong
developing economy and with the shift of tens of millions of Brazilians out of povertyxliii.
Figure 2.2xliv
0
2,000
4,000
6,000
8,000
10,000
12,000
14,000
0
2
4
6
8
10
12
14
1975 1980 1985 1990 1995 2000 2005 2010 2015
GDP per Capiita ($ at 2.57 Reals/$)
Energy Consumption (Quadrillion btu)
Brazil's Energy Consumption and GDP per Capita
Energy Consumption
GDP per Capita

Though economists are generally split on the relationship between economic growth and
energy consumption, there are many findings that point to the fact that the relationship
differs from country to county. In some nations, GDP seems to have a causal relationship
with energy consumption. In others, the inverse is true. In general, developing countries
seem to have a less pronounced causal relationship in both directions and, the richer they
become, the stronger this causal relationship becomes xlv . In Brazil specifically,
researchers have shown that there is a bidirectional strong Granger causality between
energy consumption and GDPxlvi. These last two facts imply that Brazil’s reliance on
energy consumption as an input for economic growth has been steadily increasing over
the past two decades, and that Brazilian energy consumption lead to increases in GDP
(the inverse also holds true for Brazil).
What is clear is that Brazil’s energy demand has rocketed. In 2012, it was projected that
Brazil would be able to satisfy its energy demands only if it added 6,350 MW of installed
capacity per year for the next ten years. Given Brazil’s 2012 installed generating capacity
of 121,000 MW, this means that Brazil needs to increase its installed capacity by just
under 50% by 2021xlvii. A dam like Belo Monte, with its installed capacity of 11,233 MW
of production, therefore supplies about 17.6% of the necessary increase in installed
capacity.
Brazil’s Electricity Production: A Hydroelectric Focus
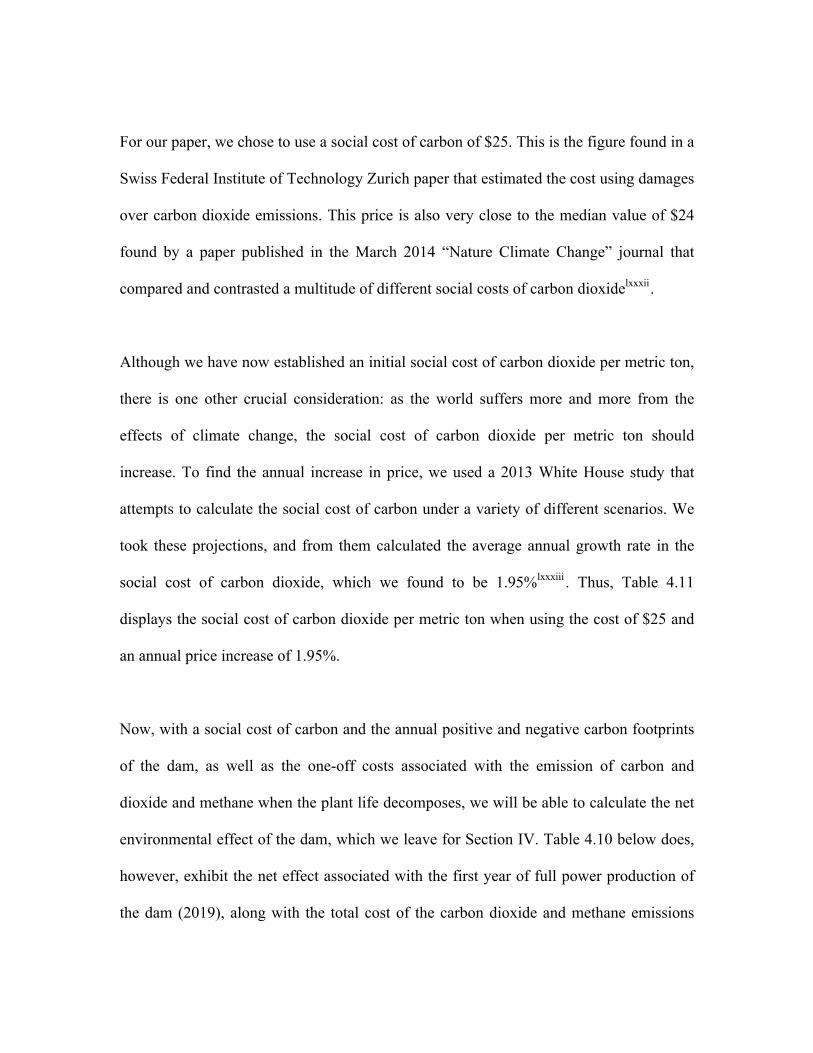
To better understand the importance of hydroelectricity in Brazil, it is helpful to look at
what percentage of total electricity produced in Brazil comes from hydroelectric sources.
As Figure 2.3 shows, an astonishing 80% of Brazil’s produced electricity is generated
hydroelectrically. To get a better sense of just how much that is, we can look at what the
relative hydroelectric production is in a series of other countries – Brazil’s neighbor
Argentina, fellow member the “BRIC” China, and the USA. It is clear that Brazil is much
more dependent on hydroelectric power than these countries (in fact, there is only one
country in the world with a higher percentage of hydroelectricity production: Norway).
Of course, the fact that Brazil is hydroelectricity-reliant does not speak to whether or not
the Belo Monte Dam will have a positive net value. However, it does showcase the fact
that Brazil is a country willing to make use of its hydroelectric potential, comfortable
with hydroelectricity, and in a class of its own when it comes to the production of
hydroelectricity.

Figure 2.3xlviii: Distribution of Electricity Produced in 2011
Hydroelectric 80%
Nuclear 3%
Non-‐Hydroelectric Renewables
6%
Fossil Fuels 11% Brazil
Hydroelectric 25%
Nuclear 5% Non-‐
Hydroelectric Renewables
2%
Fossil Fuels 68%
Argentina
Hydroelectric 15% Nuclear
2%
Non-‐Hydroelectric Renewables
3% Fossil Fuels
80%
China Hydroelectric
8%
Nuclear 19%
Non-‐Hydroelectric Renewables
5%
Fossil Fuels 68%
USA

III. DAM TECHNOLOGY
As has been mentioned, Belo Monte is comprised of three dams. The main dam, Belo
Monte, has a turbine house capable of generating 11,000MW, and this power capacity
comes from 20 Francis turbines, each with an expected capacity of 550-660MW. The
secondary dam, Pimental, contains seven Kaplan bulb turbines, each with a power
capacity 25.9MWxlix. This section will highlight how the turbines work, what their
expected efficiency is, and why they are so popular.
There are three main kinds of turbines used around the world: Pelton, Kaplan and
Francis, the most popular type. Pelton turbines are not used at Belo Monte, the other two
are. Since 97.9% of the dam’s power capacity is generated from Francis turbines, and
since these are by far the most popular type of dam technology internationally, the
majority of this section will focus on Francis Turbines.
History
James B. Francis developed Francis Turbines in mid-19th century Massachusetts l .
Francis developed the turbine due to the inefficiencies in waterwheels, which were the
previous most popular model of turbines. However, such wheels suffered from
backwater, which prevented them from turning effectively. Francis’ innovation was to
create a waterwheel turning horizontally, as seen in Figure 3.2. The Francis turbine
quickly became the most popular turbine for dams due to both its efficiency and the fact

that the perpendicular arrangement between the turbine itself and the rotating vertical
shaft protected the generator from water, diminishing the likelihood of water damage to
the generatorli.
In 1913, Austrian professor Viktor Kaplan invented the Kaplan turbine. The design for
the Kaplan turbine was inspired by that of the Francis turbinelii, and it aimed to solve
some of the inefficiencies of the Francis turbine, namely that it required a high hydraulic
head to function. By combining adjustable blades, Kaplan was able to alter the pressure
of the water, negating the need for a high head (though, with Kaplan turbines, a very low
head causes significant drops in efficiency). Like the Francis turbine, the Kaplan turbine
requires a high flow of waterliii. The other innovation of the Kaplan turbine was to alter
the shape of the turbine such that water would enter from above, axially, rather than
radially as in the case of the Francis turbine (as seen in Figure 3.2 and 3.4).
Consequently, Kaplan turbines are able to create their own pressure differential, rather
than relying on naturally occurring or man-made high heads3. The Kaplan turbine is
generally expensive to install and design, more efficient than the Francis turbine, and has
a lower overall hypothetical power generation capacity. Often, where possible, the two
are used in conjunction. This is the case at Belo Monte.
3 A hydraulic head is the difference in height between the surface of the reservoir from which water enters the turbines, and the river in to which water exits after turning the turbines.

Turbine Efficiency
Within this section and throughout the paper, we have made references to the efficiency
of the turbines. The efficiency of a turbine is taken to be the proportion of kinetic energy
(of the water) that transfers to mechanical energy (the spinning of the turbine), which in
turn transfers to electrical energy, and is then distributed to the grid liv . The key
determinant of efficiency, then, is the proportion of mechanical energy that is not turned
into electrical energy, and is “lost”. Some may be lost due to the friction of the turning of
the turbine blades and some mechanical energy may be dissipated as heat energy or
sound energy. Fortunately, both the Kaplan and Francis turbines are extremely efficient
when compared to steam or wind turbines. The Francis turbine is approximately 90%
efficient, and much of this is down to the fact that each turbine (Francis, Kaplan or
Pelton) is designed specifically with the site’s specifications in mind (water flow, head
and so on). The Kaplan turbine is generally around 92% efficient. The difference is down
to the fact that the axial entry (discussed below) of the water in the Kaplan turbine
reduces loss of energy due to friction, as compared to the Francis turbine, which loses
more energy due to blade friction since water hits the blades radially.
Design
Two major determinants of the power generating capacity of a dam are the hydraulic
head, as seen in Figure 3.1, and the flow rate, which is the velocity with which the water
travels through the penstock and hits the turbine, also seen in Figure 3.1. Pelton turbines

require large hydraulic heads and low flow rates and are built in mountainous regions,
while Kaplan turbines require low water heads and high flow rates, and are built in low
lands, such as around the Pimental section of the dam. Francis turbines can be used in
areas of high hydraulic heads and high flow rates, which allows for greater power
generation capacities than the other two designs. The major downside to such a design
specification is the significant shift in landscape required by the turbines; this is why Belo
Monte requires a large reservoir; the area does not have a naturally occurring high
hydraulic head (an example of a naturally occurring high water head is a waterfall).
However, if the area was not dammed, and only Kaplan turbines were used for the full
11,233MW capacity, 446 turbines, as opposed to the current 27, would be required
Figure 3.1lv : Hydraulic Head
There is a second distinct benefit to using Francis generators, and that is the fact that the
dam can be used for pumped storage. This reuses the same water more than once by
keeping water in reserve for when demand for electricity peaks. During hours of low
demand, the blades of the Francis turbine reverse in their direction of rotation, pushing

additional water back in to the reservoir. At peak times, this accrued water is allowed to
flow back through the turbine-generators, satisfying the increased demand at hours of the
day, and preventing over-generation in non-peak hours. In effect the dam can act like a
battery, rapidly scaling up and scaling down production of power as required.
With this in mind, Francis turbines operate in areas with hydraulic heads of between 10
and 600 meters. The Francis turbines of Belo Monte have an average hydraulic head of
89.3 meters, which, even with the large drop of the “Big Bend,” is only possible in this
section of the Amazon due to the significant damming and the creation of the reservoir.
By contrast, the Kaplan turbines at Pimental have an average hydraulic head of 13.1
meters. This significant difference points to the greater need for building the reservoir to
allow for the use of the Francis turbines.
In Figure 3.2 we see that water hits the Francis turbine radially and turns turbine
horizontally as it enters the blades. This, in turn, rotates the vertical shaft, which rotates
inside an electrical generator. Figure 3.3 reveals an above view of the turbine, and shows
Figure 3.2lvi: Francis Turbine

how the blades catch the water as it enters via the penstock. The Belo Monte Francis
turbines have a diameter of 11.2 meters, and each turbine weighs approximately 320
tonslvii. As Francis had originally determined, the horizontal rotation of the blade prevents
backwater, which would reduce the efficiency of the turbine, as in vertical rotation.
Figure 3.3lviii: Francis Turbine Overhead View
The spinning of blades rotates the vertical shaft. These shafts can typically rotate at
between 80-1000 rounds per minute; the Belo Monte Francis turbines operate at 90rpmlix.
As the shaft rotates inside the generator, electricity is produced, which is transformed into
high voltage, to be transmitted across the country via the grid.

Kaplan Turbines
Kaplan turbines are much smaller than Francis turbines, and were developed in 1913 as
an extension of the Francis turbine. As mentioned, the Kaplan turbines at Belo Monte
have a generating capacity of only 25.9MW. The major benefit they present over Francis
turbines is that they are able to generate electricity efficiently in situations of low heads.
Kaplan turbines also have adjustable blades that allow water pressure to change as water
rotates through the turbine.
Figure 3.4: Kaplan Turbine
This, combined with the shape of the turbine (pictured in Figure 4.3) has two effects. The
first is, as mentioned, that a large hydraulic head is unnecessary. The second is that it is
more efficient than the Francis turbine. Despite being more efficient, however, Kaplan
turbines’ maximum power generation lags well behind the Francis turbine for several
reasons. First, the water velocity as it hits the turbine is far less than Francis turbines, due
to the lower hydraulic head. This gives a resulting expected rpm between 79 and 429.
Second, a lower volume of water is pumped around the blades, because the chamber itself

is smaller than its Francis equivalent. Kaplan turbines are also more expensive to design
and install per unit of output than Francis turbines, because the water enters axially in,
and axially out, whereas the Francis turbine has water entering radially and leaving
axially. Additionally, unlike Francis turbines, Kaplan turbines cannot be used to provide
pumped storage. In the case of Belo Monte when there is expected variation of demand of
power over a day, this is a significant disadvantage.

IV. COST-BENEFIT INPUTS
In this section, we consider the relevant costs and benefits that will allow us to determine
the net present value of the dam, and thus allow us to judge the project. Our cost-benefit
analysis of the dam consists of three main sections: financial and economic costs and
benefits, social costs and benefits, and environmental costs and benefits. Figures
calculated throughout the “Cost-Benefit Input” section are either one-off costs or yearly
costs (for a year in which the dam is at full operational capacity). The projection and
discounting of costs occurs in Section IV.
Financial and Economic Costs and Benefits
The financial and economic costs and benefits of the project primarily consist of the cost
of construction and the value of the electricity produced by the dam over its lifetime.
Other considerations include the losses in fishing and ornamental fish collection, the
opportunity cost of the dam (represented by the cost of supplying an equivalent amount
of energy through alternative energy sources), and the operational costs of the dam.
Construction and Financing Costs
The cost of the Belo Monte Dam is a highly contentious issue, with estimates ranging
from $13 billion to $27 billionlx. We decided to use a recent study at Oxford’s Said
School of Business to estimate our own cost of the Belo Monte Dam, using the initially

proposed and final figures for Brazil’s other major dam, Itaipu, to help direct our
calculation. The Said School of Business study compared the estimated and true costs of
a sample of 245 “mega-dams” built between 1934 and 2007 in order to calculate mean
overrun cost values for major dam projects. The study arrives at a mean overrun cost
value of 2. This means that final costs were, on average, double the initial cost estimate.
The median overrun cost value was 1.27. To check if the mean figure could reasonably
be applied to Belo Monte, we compared it to the overrun cost value of Itaipu, the only
dam in Brazil comparable to Belo Monte. We found that Itaipu had an overrun cost value
of 2.4. Therefore, we believe it is reasonable to apply an overrun factor of 2 to Belo
Monte, despite this figure being significantly larger than the median. We will scale this
overrun factor in the scenario analysis (Section V) to produce different scenarios..
Table 4.1: Estimating the Final Cost of Belo Monte
Projected Cost $11.3 billion
Mean Overrun Cost Value 2.0
Estimated Final Cost $22.6 billion
The initial projected cost of the dam, according to Norte Energia, was R$29 billion when
it bid for the project in 2010lxi. Thus, using the cost overrun value of 2, we will state that
the estimated final cost of the dam is R$58 billion. Converting these values into US
dollars, we reach the numbers presented in Table 4.1. To be clear, these costs include the
materials needed to build the dam, wages paid to the approximately 25,000 workers that
built the dam, the housing for these workers, several injections of funds into the local

economy, necessary transmission lines and roads, and the present value of the interest
payments needed to pay off debts incurred when financing the dam.
Operation Costs
Another key economic and financial cost is the operation of the dam. Though figures
related to the operation of the dam are not yet published, we predict that the number of
workers needed to operate the dam once it is at full capacity to be equal to 2,674. We
found this number by considering Brazil’s two other major dams – we looked at how
many workers they had relative to their installed capacity, took the average of that ratio,
and applied it to Belo Monte. Table 4.2 shows the results.
Table 4.2: Projecting Number of Workers
Belo Monte Itaipulxii Tucurialxiii
Workers (to build) 25,000 40,000 20,000
Installed Capacity (MW) 11,233 14,000 8,370
Workers (to operate) 2,674 3,153 2,100
Knowing that the average wage of workers at Itaipu comes to about $583.66 per month,
we will assume that the same holds true for Belo Montelxiv. Therefore, over an entire
year, the cost to Norte Energia from paying their workers will amount to around $18.73
million.

Table 4.3: Cost of Operation
Workers (to operate) 2,674
Average Wage of Workers $583.66 (per month)
Annual Costs of Operation $18.73 million
Of course, there may be other costs associated with operating a dam, and we have
excluded the issue of maintenance – for instance, you may have to repair or replace
turbines if it happens to be faulty – but, since we do not have the information required to
accurately predict or quantify these other costs, and since they would be largely
negligible in the scheme of the overall cost-benefit analysis, these have been excluded
from the calculation.
Cost of Losses in Fishing and Ornamental Fish Collection
Belo Monte has other economic costs that are distinct from construction costs. Of the
estimated 20,000 people being displaced by Belo Monte, many derive their income from
fishing and the collection of ornamental fish, i.e. fish that are used in aquariums.
Residents of the affected area have historically caught an average of 464,000 kilograms
of fish per yearlxv. To determine an average market price, we used the revenue generated
from fishing exports divided by the number of kilograms exported in 2010, the last year
with available data. This price was computed to be $6.89/kglxvi. Data on ornamental fish
collection, meanwhile, points to an average of 321,600 ornamental fish collected per year
at an average price per fish of $2.45lxvii. Using these values, we determined the annual

loss in income as a result of decreased fishing and ornamental fish collection to be
$3,984,880. A breakdown of this figure is presented in Table 4.4.
Table 4.4: Annual Cost of Fish Related Losses
Annual Cost of Losses in Fishing $3,196,960
Annual Cost of Loss in Ornamental Fish Collection $787,920
Energy Revenue Benefit
The major benefit of the Belo Monte dam is the generation of electricity. Belo Monte’s
annual revenues depend on the price per megawatt hour Norte Energia receives and the
number of megawatt hours of energy the dam generates. It is important to use the price of
electricity that Norte Energia receives as opposed to the price of electricity on the market
because the market price of electricity reflects all types of energy generation and is often
subject to taxes and subsidieslxviii. During the bidding process for the dam project, the
Brazilian government set a price ceiling of $32.3/MWh (R$83). Norte Energia won the
bid with a price of $30.34/MWh (R$77.97). Interestingly, and as briefly mentioned in the
“History” section, Odebrecht, Camargo Correa, and CPFL, all large Brazilian
construction companies, dropped out of the bidding processlxix. They claimed that the
price ceiling set by the government was too low, and feared that the project would not
generate sufficient returns. Recall from Section I that Belo Monte is projected to produce
39,493,440 MWh annually. The calculation of the net present value of energy revenue is
undergone in Section IV. Relevant figures are presented in Table 4.6.

Pricing Benefit Relative to Other Energy Sources
We assume that Brazil would meet its demand for energy regardless of whether Belo
Monte was being built. Therefore, we wanted to determine if it was cheaper for Belo
Monte to generate energy relative to other methods of generation purely on a price per
MWh basis. Belo Monte is estimated to produce 39,493,440 MWh annually and Norte
Energia won the contract to produce power at $30.34/MWh. We obtained contracted
prices per MWh for other methods of energy generation and created a weighted average
alternative energy price. Weights for each energy source were determined by Brazil’s
current energy distribution. As previously mentioned, 20% of Brazil’s energy is not
generated from hydroelectric power. This twenty percent is made up of other renewables
(biomass, wind, and solar), fossil fuels, and nuclear. Prices and weights (scaling from the
20% to 100%) are found in Table 4.5.
Table 4.5: Weights and Prices of Alternative Sources
Source Weight R$/MWh $/MWh
Biomasslxx 15% 58 23
Windlxxi 10% 189 74
Solarlxxii 5% 215 84
Fossil Fuelslxxiii 55% 205 80
Nuclearlxxiv 15% 193 75
Average $70.09/MWh

Table 4.6: Belo Monte vs. Alternative Sources
We computed the average alternative energy price to be roughly $70.09/MWh. This is
almost $40/MWh above Belo Monte’s contracted price. Using this figure, we calculated
the amount Belo Monte would save each year as a result of not producing energy using
other sources (this figure is for a year where Belo Monte is fully operational).
Unquantifiable Financial and Economic Cost and Benefits
Belo Monte will inevitably have economic benefits that are difficult to quantify. The
increase in installed capacity will allow Brazil’s economy to continue growing. The
electricity generated from Belo Monte will help meet consumer demand as more citizens
move out of poverty and consume more electricity. This benefit to people is difficult to
quantify since the value they derive from having stable, cheap electricity may well be
greater than the price they actually pay for the electricity, assuming such electricity can
be reliably provided. Additionally, the knock-on effect to industry is similar. Much of the
benefit to the rest of the country is in terms of what the increased power capacity allows
Belo Monte Alternative Sources
$/MWh 30.34 70.09
MWh per year 39,493,440 39,493,440
Total cost per year 1,198,230,967 2,768,198,169
Savings per year $1,569,967,200

power-using industries to do. For instance, it might allow firms to build additional
factories, in the knowledge that they now have access to the power required to run such
factories, thus increasing the output potential of the country. An example of this is the
expected boost in mining due to Belo Monte, such as the Canadian company Belo Sun
Mining Corp, which is in the process of opening a gold mine in the arealxxv. This might
complicate socio-economic and environmental factors, but also might likely add to the
value of national GDP. The net effect going forward is unclear since we do not know, for
example, how much such a mine will end up costing or how many local workers versus
imported workers the Canadian company will hire.
Another unquantifiable cost of the dam is the legal battles regarding construction, which
have been ubiquitous since the dam has been proposed, as covered in the introduction.
The legal fees, and the time spent engaging in legal disputes, are significant, but data is
either not readily available, or ambiguous. These legal battles are not costless, but they
are not included in the construction costs for the dam either. As such, this greater
expenditure on the dam is an area to consider when evaluating whether it is cost effective.
It is not, however, straightforward to assign values to this and so we are left to consider
the true value of legal costs.
Finally, as briefly mentioned in “Operation Costs,” maintenance may be a significant cost
over the lifetime of the dam. Turbine failures or general wear and tear lead to
replacement and repairing costs. Though not easily quantifiable, these costs must also be
noted.

Environmental Costs and Benefits
The environmental costs and benefits of the dam are varied. On the one hand, as
renewable sources of energy, dams such as Belo Monte have a positive effect on the
environment because they produce energy with a smaller carbon footprint when
compared to substitutes such as oil. On the other hand, the construction of the dam
involves an enormous diversion of water, which will lead to the flooding of
approximately 500km². This leads to both losses in carbon absorption and the release of
methane and carbon dioxide, as the flooded trees anaerobically decompose. However,
since approximately 50% of this land was already deforested during the construction of
the Trans-Amazonian Highway, we use the figure 250km² during our calculationslxxvi.
Though the above considerations will be quantified, there are also environment costs and
benefits to the dam that are difficult to quantify. These include, for example, losses in
biodiversity and animal life. We discuss these costs and benefits further at the end of this
section, in “Unquantifiable Environmental Costs and Benefits.”
Positive Carbon Footprint
The most obvious environmental benefit of the Belo Monte Dam is the reduction in CO2
emissions that will result from producing energy from a renewable source. When
building our counterfactual argument, we assume that oil would replace hydroelectric as
a source of energy. We decided to choose oil as our counterfactual due to the ease with

which Brazil would be able to scale their oil consumption. Moreover, the assumption that
oil would be a substitute for hydroelectricity is common practice when assessing the
environmental impact of dams. Again, note that, although there is a CO2 reduction from
the switch in energy sources, the overall impact of the Belo Monte Dam in terms of CO2
is ambiguous, as construction, deforestation, and flooding all have associated CO2 costs.
Table 4.7: Oil vs. Hydroelectricity
Barrel of Oils Equivalent to an Hour of Operation 2,689.84
Metric Tons of CO2 Saved per Hour of Operation 1,156.65
Metric Tons of CO2 Saved a Year 9,994,8616
As Table 4.7 shows, if oil were used to produce the same amount of energy that Belo
Monte will supply, Brazil would emit an extra 9,987,840 metric tons of CO2 per year. In
other words, on average and given our assumptions, every hour of electricity production
at Belo Monte prevents the emission of 1,156.6 metric tons of CO2.
4 Belo Monte’s average power production = 4,571 MW. Translate into kWh: 4,571*(1,000) *1 = 4,571,100 kWh. 1 Barrel of Oil Equivalent = 1,699.4 kWh. So, 4,571,000/1,699.4 = 2,689.8 Barrel of Oil Equivalent. 5 To find the CO2 emissions of a barrel of crude oil, we multiply the heat content of the barrel by its carbon coefficient, the fraction oxidized, and the molecular weight of CO2 relative to carbon. Therefore, (5.8 mmbtu/boe)(20.31 kg C/mmbtu)(44 kg CO2 / 12 kg C)(1 metric ton/1,000 kg) = 0.43 metric tons CO2/barrel, and 2,689.8 *0.43 = 1,156.6 metric tons of CO2. http://www.epa.gov/cleanenergy/energy-resources/refs.html 6 From per hour to per year, we just multiply 1,156.6*(24*360) = 9,994,861 metric tons of CO2.

Negative Carbon Footprint
This section will analyze the extent to which the two main negative environmental
impacts we quantify act against the positive carbon footprint. First, we will consider the
loss in carbon dioxide absorption that occurs due to the flooding of the land. Second, we
will quantify the release of greenhouse gases due to flooding. Together, these two effects
act against the positive carbon footprint. However, we determine that it is a fairly
negligible counteraction.
Losses in Carbon Dioxide Absorption
The losses in carbon dioxide absorption essentially represent a type of environmental
opportunity cost of the land flooded by the reservoir. When the land is flooded, the trees
that previously occupied that land do not photosynthesize and absorb carbon dioxide
anymore, and hence the positive carbon footprint they normally create is nullified.
Since the approximately 5,500,000 km2-large Amazon absorbs an estimated 1.7 billion
metric tons of CO2 a year, we can easily calculate the amount of CO2 that is not absorbed
every year as a result of the dam being builtlxxvii. Table 4.8 presents the key figures.
Figure 4.8: Negative Carbon Footprint from Lack of CO2 Absorption
% of Amazon Covered by 250km2 0.0045%7
Metric Tons of CO2 Not Absorbed per Year 77,272.68
7 250 km2/5,500,000 km2 = 0.000045. 8 1,700,000,000 metric tons of CO2 a year * 0.000045 = 77,272.6.

Greenhouse Gases Released by Underwater Trees
As water floods an area of trees, it does more than just prevent the trees from absorbing
CO2 and inhibit the ability of the Amazon to act as a carbon dioxide sink. The flooding
also causes the plant life to release the large amounts of carbon dioxide and methane
(CH4) already tied up in them in the form of glucose as they decompose. This
underwater, anaerobic decomposition follows the equation:
C6H12O6 à 3CO2 + 3CH4
Thus, we see that for every molecule of glucose decomposed, three carbon dioxide
molecules and three methane molecules are released. There are approximately 20 kg of
carbon in every square meter of a dense rainforest such as the Amazon, and it is
estimated that methane has a global warming potential that is roughly 21 times that of
CO2 (that is to say, methane is roughly 21 times better at trapping heat in our atmosphere
than carbon dioxide)lxxviii. Using the chemical equation and the two aforementioned facts,
we can calculate the metric tons of CO2 emitted by the decomposing trees.
As Table 4.9 shows, the carbon dioxide and methane released by the decomposition of
the flooded trees is equivalent to 55 million metric tons of carbon dioxide. For the
purpose of this paper, we take this to be a one-time event. In reality, the season nature of
the water flows in the Xingu River will result in the reservoir contracting and expanding
over time, which, in turn, leads to plants encroaching onto the banks of the reservoir and
then being flooded again when the reservoir expands. However, due to the high
uncertainty of projecting this seasonal growth in plant life and the miniscule amount of

carbon dioxide and methane these plants would release relative to the initial emission of
55 million metric tons, this consideration has not been quantified.
Table 4.9: Negative Carbon Footprint from Decomposition
Metric Tons of Carbon in 250km2 5,000,0009
Metric Tons of CO2 Released 2,500,00010
Metric Tons of Methane Released 2,500,000
Total Metric Tons of CO2 Released
(assuming 1 ton of CH4 = 21 tons of Methane)
55,000,00011
Monetary Value of CO2 Emissions
What remains is to find a monetary value for these savings in and costs of CO2 emissions.
The social cost of CO2 is a topic of some controversy, and it is difficult to pin down an
accurate number. For instance, the European Union’s Emission Trading Scheme has seen
the price of a metric ton of carbon dioxide fluctuate from as low as €0.10 to a peak of
about €30 ($0.12 to $36.86 at €1.23/$1)lxxix. Other calculations have estimated the net
damage carbon dioxide imposes on society and divided that by the carbon dioxide
emitted, finding a price of carbon dioxide of $25lxxx. A series of White House technical
support documents in 2010 calculated a social cost of carbon range from $7 to $81lxxxi.
9 20 kg C/m2 * 1,000,000 m2/km2 * 250 km2 * 1 metric ton/1,000 kg= 2,500. 10 According to the chemical reaction of glucose breaking down into carbon dioxide and methane, we saw that carbon is equally split between the two greenhouse gasses, so 5,000,000/2 = 2,500,000. 11 (2,500,000) + 21*(2,500,000) = 55,000,000.
For our paper, we chose to use a social cost of carbon of $25. This is the figure found in a
Swiss Federal Institute of Technology Zurich paper that estimated the cost using damages
over carbon dioxide emissions. This price is also very close to the median value of $24
found by a paper published in the March 2014 “Nature Climate Change” journal that
compared and contrasted a multitude of different social costs of carbon dioxidelxxxii.
Although we have now established an initial social cost of carbon dioxide per metric ton,
there is one other crucial consideration: as the world suffers more and more from the
effects of climate change, the social cost of carbon dioxide per metric ton should
increase. To find the annual increase in price, we used a 2013 White House study that
attempts to calculate the social cost of carbon under a variety of different scenarios. We
took these projections, and from them calculated the average annual growth rate in the
social cost of carbon dioxide, which we found to be 1.95%lxxxiii . Thus, Table 4.11
displays the social cost of carbon dioxide per metric ton when using the cost of $25 and
an annual price increase of 1.95%.
Now, with a social cost of carbon and the annual positive and negative carbon footprints
of the dam, as well as the one-off costs associated with the emission of carbon and
dioxide and methane when the plant life decomposes, we will be able to calculate the net
environmental effect of the dam, which we leave for Section IV. Table 4.10 below does,
however, exhibit the net effect associated with the first year of full power production of
the dam (2019), along with the total cost of the carbon dioxide and methane emissions

that occur due to anaerobic decomposition (any consideration of discount rates is left for
section IV). For the total cost from decomposition, it is assumed that decomposition starts
the first year of electricity production, 2015, and is completed after five years – the
amount of carbon dioxide and methane emitted is further assumed to be equal year-to-
year.
Table 4.10: Annual Net Environmental Effect and Decomposition Cost
Value
Annual Positive Environmental Effect $269,771,558
Annual Negative Environmental Effect $2,254,486
Net Environmental Effect $267,517,072
Total Cost from Decomposition $1,429,667,670

Figure 4.11: Projected Social Cost of Carbon
Year Price ($) 2015 25.00 2016 25.49 2017 25.98 2018 26.49 2019 27.01 2020 27.53 2021 28.07 2022 28.62 2023 29.18 2024 29.74 2025 30.32 2026 30.92 2027 31.52 2028 32.13 2029 32.76 2030 33.40 2031 34.05 2032 34.71 2033 35.39 2034 36.08 2035 36.78 2036 37.50 2037 38.23 2038 38.98 2039 39.74 2040 40.51 2041 41.30 2042 42.11 2043 42.93 2044 43.76 2045 44.62 2046 45.49 2047 46.37 2048 47.28 2049 48.20 2050 49.14 2051 50.10 2052 51.07 2053 52.07 2054 53.08

Unquantifiable Environmental Costs
One environmental consideration and cost is the decrease in animal and plant life and
diversity associated with the dam. A few species that will be particularly affected by Belo
Monte are the yellow-spotted river turtle, white-cheeked spider monkey, plant-eating
piranha, Xingu poison dart frog, and the zebra pleco fishlxxxiv. These species do not have a
monetary cost associated with them per se. They are not generally captured for zoos, nor
are they sold in markets for food, and thus there is no real market value that can be
attached to them. This does not mean, however, that they are not a loss, and a significant
one as a result of the building of the dam. The value of the diversity of life on the planet
is more than just the sum of money that could be expended attempting to save it, or the
money that could be made by selling it. The intangible value that many place on
biodiversity should not to be underestimated. As pressure for climate change deals
between governments gather pace, and as these deals actually occur, this presents us with
real examples of the manifestation of the value people and their governments place on
protecting biodiversity.
Our reliance on using the resources of biodiversity in places such as the Amazon is
indisputable. The derivation of medicines, in particular, has relied heavily on the
Amazon, and it is estimated that less than 1% of flowering species have been studied for
their potential medicinal valuelxxxv. Furthermore, the scientific value of the region, and
the contribution it could make to our understanding of evolution and various responses of
animal species to an array of evolutionary pressures. Nor can we rule out unexpected

implications of such research. For instance, presently, research is being conducted on
electric eels in South America which are able to use electric shocks to activate the
neurons of prey, essentially controlling their movement. It is hoped that such research in
the future could be useful in repairing brain damage or other neurological diseaseslxxxvi.
The loss of such diversity might well signify the loss of potential avenues of research that
could result in tangible benefits to society in the future, and whilst difficult to assign a
monetary value to such hypothetical, it does merit further consideration.
We have already quantified the impact on the ability of the Amazon to capture carbon
dioxide as a result of the loss of this area of rainforest. Something that is much more
difficult to predict, however, is the impact on climate sensitivity, which is defined as the
equilibrium temperature change in response to changes in radiative forcings. Forcings are
taken to be the difference between the amount of sunlight that is absorbed by Earth
versus that which is radiated back in to space. The impact of this is not linear, as factors
such as water vapor feedback, cloud feedback and albedo feedback can all intensify the
effect on the atmospherelxxxvii. Here, the albedo affect might be relevant. Albedo is
defined as the reflective power of a surface. Previously, the area being flooded by the
dam was forest, with much less reflective power than a still reservoir of water. This could
impact the local cooling of the area, which in turn might affect the probability of
droughtlxxxviii.

Social and Political Cost-Benefit Analysis
The final major category of cost and benefit inputs that we consider is social and
political. Unfortunately, these are very difficult to quantify, as they vary from severed ties
between the Brazilian executive branch and the National Indian Foundation of Brazil
(FUNAI) to potential for political unrest. One type of social cost that can be quantified,
however, is the displacement of people due to the construction of Belo Monte.
Displacement Costs
The construction of the Belo Monte Hydroelectric Dam Complex, and specifically the
Canals Reservoir created for the main powerhouse, has displaced approximately 30,000
people from their homes along the Xingu River. We choose the number 30,000 because
there are consistently two figures that appear in news reports and papers when discussing
the number of people displaced by Belo Monte’s construction: 20,000 and 40,000lxxxix,xc.
Since we have little reason to believe that one number is truer than the other, and since
these numbers appear with roughly the same frequency, we have decided to split the
difference and assume that 30,000 people will be displaced.
In order to quantify the effect of displacement, we decided to follow the trend most
commonly used when assessing hydroelectric dams; that is, costs of displacement are
equated to the costs of building new homes. Luckily, there is a prominent Brazilian
government program called “Minha Casa, Minha Vida” (My House, My Life) that

provides homes to low-income families such as those affected by the dams. The cost of
an average house built by “Minha Casa, Minha Vida” should thus fairly accurately
predict the cost of displacement. The program has spent $13.23 billion to build one
million homes, for an average price of $13,230 per homexci.
Two other facts allow us to calculate the total costs of displacement. First, the average
household size in Brazil is 3.3xcii. Second, we know that the construction of 8,000 homes
has already been included in Norte Energia’s initial budgetxciii. We consider social costs
of displacement to thus be equal to the number of homes that have not been built to
support displaced families. In other words, displaced families with no constructed home
“suffer” at a cost equal to the construction cost of the home they are missing
(alternatively, if Norte Energia does build the necessary additional homes, our calculated
figure will be the amount they need to spend). Table 4.12 presents the total costs of
displacement.
Table 4.12: Total Costs of Displacement
# of Displaced Families Without a Home 1,09112
Cost of a Family Home $13,23013
Total Costs of Displacement $14,432,72714
12 30,000 families displaced/3.3 people in average family – 8,000 families with homes already built for them = 1,091 families. 13 R$34 billion/1 million homes/(R$2.57/$) = $13,230 14 $13,230*1,091 = $14,432,727.

Therefore, we see that the total costs of displacement amount to $14,432,727.
Surprisingly, this is actually quite a small figure – it is less than Belo Monte’s annual cost
of operation (calculating in “Operation”). However, there are, of course, many other costs
of displacement that are not sufficiently captured by our calculation. These include
severed community ties and possible tensions caused by an influx of families into a new
area.
Unquantifiable Social and Political Costs and Benefits
One major potential political benefit is continued and even increased energy security. The
International Energy Agency defines this as “the uninterrupted availability of energy
sources at an affordable price”xciv. Certainly one goal of Belo Monte is to provide energy
at an affordable price. We cannot be certain if there will be uninterrupted availability of
energy, however, as the 2001 Brazilian Drought showedxcv. Energy security can also be
considered in terms of the relationship between other nations around the world, and the
potential dangers present in relying on importing types of energy from other nations.
There are several implications of energy security.
For one, building internal capacity for power generation, rather than importing energy
resources from abroad, means that Brazil is not dependent on fluctuations in the supply of
energy from other nations. Thus, it is more able to insulate itself from, for example,
regional instability in the Middle East, from which it might import oil. Energy security
means that Brazil can, in most instances, exert control over how and when it produces

power. In other words, higher energy imports makes Brazil less vulnerable to
international crises that would precipitate a fall in energy availability. Clearly, energy
independence is difficult to quantify, but what we do know is that insulating oneself from
international fluctuations in, say, the price of oil, would be good for the stability of
energy pricing. This does, however, assume that the domestic substitute is able to
perform as expected year-round. The worst case for Brazil would be one in which their
attempt to insulate themselves from international fluctuations in energy (the dam) fails to
work as planned, and they are forced to import energy from abroad despite already
spending a considerable sum on a dam.
One significant cost the government may face is a lack of trust if the results of Belo
Monte do not turn out according to plan. This is due to both the exorbitant cost of the
dam and the potential problems it will face in terms of supplying power reliably due to
seasonal variation in rain and water supply. The least the Brazilian public will expect
from such an expensive undertaking is reliable energy, and yet variable rainfall, the risk
of drought, and the risk in general of the dam underperforming puts this expected output
at risk. This could have a significant political cost for the government, as an inability to
provide basic goods and services worsens along with confidence in the government. The
result could be anything from unfavorable election results to protests and civil
disobedience. Ultimately the credibility of the government on the domestic scale will
affect Brazil’s ability to be an international power with influence. Any loss of credibility
domestically will impact Brazil’s ability to project power abroad, compromising its goals
in bodies such as the G20, or the United Nations. This is unquantifiable but could lead to

increased geopolitical uncertainty, and potential economic costs down the road in the
form of less favorable treaties or influence in relevant negotiations. A related cost is also
the integrity of legal and democratic institutions in Brazil. As detailed in the introduction,
the political machinations that occurred in terms of firing civil servants unwilling to sign
off on the dam works to undermine the faith that Brazilian citizens have in the ability of
such institutions to protect them. Compromising the ability of government bodies such as
IBAMA may pay off for the Brazilian government now, but in the future an acquiescent
energy department may be a catalyst for poor decisions.
A further cost might be increased tensions in local cities as displaced peoples are moved
to already occupied, resource-constrained areas. The effect could be reminiscent of the
rural to urban migration that, at least in part, caused destabilizing slums such as Rocinha,
in Rio de Janeiro. Even though Norte Energia and the government are setting aside
resources for those displaced, if this proves to be insufficient, as our predictions suggest,
the destabilizing influence of forced migration, especially in Altamira, Belo Monte’s
neighboring city, could be significant. Moreover, issues such as ethnic tensions may
further compound displacement, given that many of the displaced peoples are Indigenous.
Furthermore, the large boost in the labor force supply may not be met with an increase in
jobs, and thus the stress of the infrastructure of the city from unemployed people could be
significant.

V. ANALYSIS
In this section, we use the numbers from Section IV as inputs in a series of scenarios that
might occur over the lifetime of the Belo Monte Hydroelectric Dam Complex. The
numbers calculated in Section IV were always either one-time costs or benefits or annual
costs or benefits (for years when the dam is fully operational). This section projects these
costs and benefits, discounts them, applies a number of assumptions, as well as explains
the process we used to calculate our final net present values (NPVs).
Crucially, we analyze the decision to build Belo Monte from a 2011 vantage point. That
is to say, we take the perspective of a benevolent social planner who, in 2011, just prior
to the ground being broken at Belo Monte, calculates the NPV of the project.
We also need to define two key time periods: the construction period, and the ramping up
period. The construction period is simply the number of years between when construction
begins and when construction ends (which we take as the first year in which the dam is
fully operational, i.e. the year it first reaches its full installed capacity of 11,233 MW).
The ramping up period, meanwhile, is the time period that begins with the year the dam
starts producing electricity and ends with, again, the year during which the dam first
becomes fully operational. Therefore, the ramping up period is a subset of the
construction period.

We will use the same discount rate for every scenario (though after our discussion of all
seven scenarios, we will conduct a discount rate sensitivity analysis). The discount rate
we have chosen is 12%. Discount rates for energy projects are not generally derived from
yields on government bondsxcvi. However, this argument generally refers to the United
States. It is argued that this rate is “riskless” and purely a financial rate, not reflecting the
real opportunity cost of investing in government bonds. That is to say, investors could put
that capital to use in other ways. However, Brazilian government bonds should not be
considered riskless. In March of 2014, Standard & Poor’s dropped Brazil’s credit rating
to BBB-xcvii. This is the lowest credit rating for debt to be considered investment grade.
Riskless government debt in the United States has a credit rating of AAA, the highest
rating possible. The initial feasibility study conducted by Norte Energia in 2002 used a
discount rate of 12%xcviii. This is in line with yields on Brazilian government debt, which
currently stand around 12%. Moreover, a discount rate of 12% is appropriate because
Norte Energia is 90% government-owned and, as a result, possible burdens of deficits
from the dam will fall on the taxpayersxcix.

There are several more assumptions that hold true for all scenarios we calculate:
• The time horizon (lifetime of the dam) is 50 years (starting from 2011, the
beginning of construction).
• Belo Monte starts producing electricity in 2015.
• The following scale up during the ramping up period:
- Energy revenue benefits (scales up by even increments).
- Pricing benefit relative to other energy sources (scales up by even
increments).
- Positive carbon footprint (metric tons of CO2 scale evenly, but
dollar values do not due to increasing CO2 prices).
• Construction costs are divided evenly across the construction period.
• Operational costs are first incurred once construction is complete and are
incurred annually for the rest of the time horizon.
• The annual cost of losses in fishing is constant across the 50-year time
horizon.
• The annual cost of losses in ornamental fish collection is constant across the
50-year time horizon.
• The negative carbon footprint from decomposition (and the subsequent release
of CO2 and CH4) is split evenly across the years 2015-2019.
• The negative carbon footprint from foregone CO2 absorption starts in 2015.
• Displacement costs are divided evenly across the construction period.

Scenario A: Base Case Scenario
Our Base Case scenario is the one created using all the numbers in Section IV. We also
use the dates from the “Brief History” section of Section II. That is, the construction
period to is 9 years (2011-2019) and the ramping up period is 5 years (2015-2019)
To reiterate, Table 5.1 exhibits the inputs for the base case scenario:
Table 5.1: Inputs
Discount rate 12%
General
Installed capacity 11,233
% of capacity used 40.70%
Reservoir Area m2 500,000,000
Years of construction 9
Years ramping up 5
Economic
Initial budget 11,300,000,000
Overrun factor 2.00
Number of operational workers 2,674
Yearly wage 7,004
Contracted price per MWh 30.34
Alternative source price per MWh 70.09

Market price of fish per kg 6.89
Kg of fish caught in area 464,000
Market price of ornamental fish 2.45
Kg of ornamental fish caught in area 321,600
Environmental
Tons of CO2 absorbed by Amazon annually 1,700,000,000
% of Amazon cleared 0.0045%
Plant biomass tons per m2 0.02
KWh / Barrel of oil 1,699
Cost of CO2 in 2015 (grows at 1.19% per year) $25
Social
Number of people displaced 30,000
Average family size 3.3
Number of houses accounted for 8,000
Price per house 13,230
Table 5.2, meanwhile, shows how the net costs and benefits vary year-to-year across the
50-year time horizon. Finally, Table 5.3 tables the lifetime cost and benefits broken down
by sector and Figure 5.1 graphs the cumulative NPV of the project over the time horizon.
Therefore, we see that the NPV of the Belo Monte Hydroelectric Dam Complex in the
base case scenario is -$2,572,707,577.30. This implies that, from the perspective of 2011,
with a 12% discount rate and with the best knowledge available today about the costs and
benefits of Belo Monte, we would seriously consider not constructing the dam.

Arguably the biggest contributing factor to the -$2.5 billion NPV is the high upfront cost
of constructing the dam. With such a high discount rate and with benefits only beginning
in 2015, the construction costs are such that they cannot be overcome by the many future
years of net benefits. Another key factor is the (perhaps absurdly) low price per MWh of
the electricity supplied by the dam (as may have been expected from the fact that many
large Brazilian energy companies did not even bid on the project due to worries about
recouping their investment). In fact, this low price results in the energy revenue from the
dam not even being the largest benefit. Instead, the cheapness of the electricity relative to
other energy sources does the most to counteract the many costs. Interestingly, however,
were the price of electricity supplied by Belo Monte to increase, the effect on energy
revenue would increase, while the effect on the benefit related to Belo Monte as a cheap
energy source would decrease by an equivalent amount. Thus, changes in the price of
electricity supplied by Belo Monte have no effect on the final net present value – they
only change the relative contribution of the two main benefits, revenue and
hydroelectricity as a cheap energy source.

Table 5.2: Scenario A - Net Present Values by Year
Year Costs ($) Benefits ($) NPV ($) 2011 2,516,272,676 - (2,516,272,676) 2012 2,246,672,032 - (2,246,672,032) 2013 2,005,957,172 - (2,005,957,172) 2014 1,791,033,189 - (1,791,033,189) 2015 1,756,275,327 342,552,184 (1,413,723,142) 2016 1,570,852,895 612,692,816 (958,160,079) 2017 1,405,002,517 821,899,959 (583,102,559) 2018 1,256,748,235 980,099,329 (276,648,906) 2019 1,124,173,818 1,095,735,066 (28,438,751) 2020 7,998,263 992,421,888 984,423,625 2021 7,153,316 887,644,314 880,490,998 2022 6,397,822 793,953,704 787,555,881 2023 5,722,294 710,174,644 704,452,349 2024 5,118,253 635,256,539 630,138,286 2025 4,578,118 568,260,341 563,682,223 2026 4,095,115 508,346,687 504,251,572 2027 3,663,190 454,765,301 451,102,111 2028 3,276,929 406,845,528 403,568,598 2029 2,931,496 363,987,868 361,056,372 2030 2,622,566 325,656,418 323,033,852 2031 2,346,273 291,372,112 289,025,839 2032 2,099,162 260,706,688 258,607,525 2033 1,878,144 233,277,285 231,399,141 2034 1,680,458 208,741,630 207,061,171 2035 1,503,635 186,793,720 185,290,085 2036 1,345,468 167,159,978 165,814,510 2037 1,203,985 149,595,809 148,391,824 2038 1,077,420 133,882,523 132,805,103 2039 964,198 119,824,589 118,860,391 2040 862,909 107,247,177 106,384,268 2041 772,291 95,993,960 95,221,669 2042 691,217 85,925,157 85,233,939 2043 618,681 76,915,773 76,297,092 2044 553,779 68,854,036 68,300,257

2045 495,707 61,639,995 61,144,288 2046 443,744 55,184,263 54,740,519 2047 397,246 49,406,904 49,009,658 2048 355,636 44,236,428 43,880,792 2049 318,398 39,608,898 39,290,499 2050 285,073 35,467,130 35,182,056 2051 255,248 31,759,978 31,504,730 2052 228,554 28,441,696 28,213,142 2053 204,661 25,471,365 25,266,704 2054 183,275 22,812,384 22,629,109 2055 164,132 20,432,012 20,267,880 2056 146,995 18,300,961 18,153,966 2057 131,655 16,393,031 16,261,377 2058 117,921 14,684,783 14,566,862 2059 105,626 13,155,247 13,049,621 2060 94,617 11,785,661 11,691,044
Table 5.3: Scenario A - Net Present Values Broken Down by Category
Costs BenefitsConstruction 14,985,406,526$ Energy revenue 5,139,966,490$ O&M 55,740,390 Pricing benefit 6,734,135,399 Fishing loss 26,549,149 Positive carbon footprint 1,301,261,866 Ornamental fish collection lost 6,543,280 Displacement 9,569,924 Foregone CO2 Absorption 12,064,640 Methane and CO2 Emission 652,197,422
15,748,071,332 13,175,363,755
Total NPV (2,572,707,577)$

(14)
(12)
(10)
(8)
(6)
(4)
(2)
0
2
4
2011 2021 2031 2041 2051 2061
Cum
mula'
ve NPV
(in billino
s of $
)
Year
Scenario A -‐ Cumula've NPV Over Time
Figure 5.1

Scenario B: Initial Budget
The Initial Budget scenario makes one key change to the Base Case: the dam does not run
over budget, i.e. the overrun factor is 1 and the construction costs of the dam are thus
equal to $11.3 billion. Scenario B’s net present values for each category are presented in
Table 5.4. Cumulative NPV over time is shown in Figure 5.2.
When Belo Monte’s construction costs are equivalent to its initial budget, we see that the
NPV is $4.9 billion. However, it is highly unlikely that Belo Monte will end up running
according to budget. Though certain people (primarily members of the Brazilian
government) still purport that the project will not run over budget, most sources make
estimates that fall close to the construction costs we calculated for our Base Case
scenario.
All else equal, in order for the NPV to be greater than or equal to zero, Belo Monte
cannot exceed an overrun factor of 1.66. This is equivalent to construction costs of $18.6
billion.

Table 5.4: Scenario B - Net Present Values Broken Down by Category
Figure 5.2
(7)
(5)
(3)
(1)
1
3
5
2011 2021 2031 2041 2051 2061
Cum
mulative NPV (in billinos of $)
Year
Scenario B -‐ Cumulative NPV Over Time
Costs BenefitsConstruction 7,492,703,263$ Energy revenue 5,139,966,490$ O&M 55,740,390 Pricing benefit 6,734,135,399 Fishing loss 26,549,149 Positive carbon footprint 1,301,261,866 Ornamental fish collection lost 6,543,280 Displacement 9,569,924 Foregone CO2 Absorption 12,064,640 Methane and CO2 Emission 652,197,422
8,255,368,069 13,175,363,755
Total NPV 4,919,995,686$

Scenario C: Longer Construction Period, Increased Overrun Factor
In Scenario C, we assume that the construction period now lasts eleven years instead of
nine – a two-year increase. Since a longer construction period absent an increase in the
overrun factor results in a higher NPV, we make the added assumption that the overrun
factor increases to 2.4, the overrun factor of Itaipu Dam. Scenario C’s net present values
for each category are presented in Table 5.5. Cumulative NPV over time is shown in
Figure 5.3.
Thus, we see that Scenario C results in a NPV of -$5.2 billion. Of all of our scenarios,
Scenario C is perhaps the most likely, as Belo Monte has already been delayed several
times by, for instance, legal disputes or strikes.
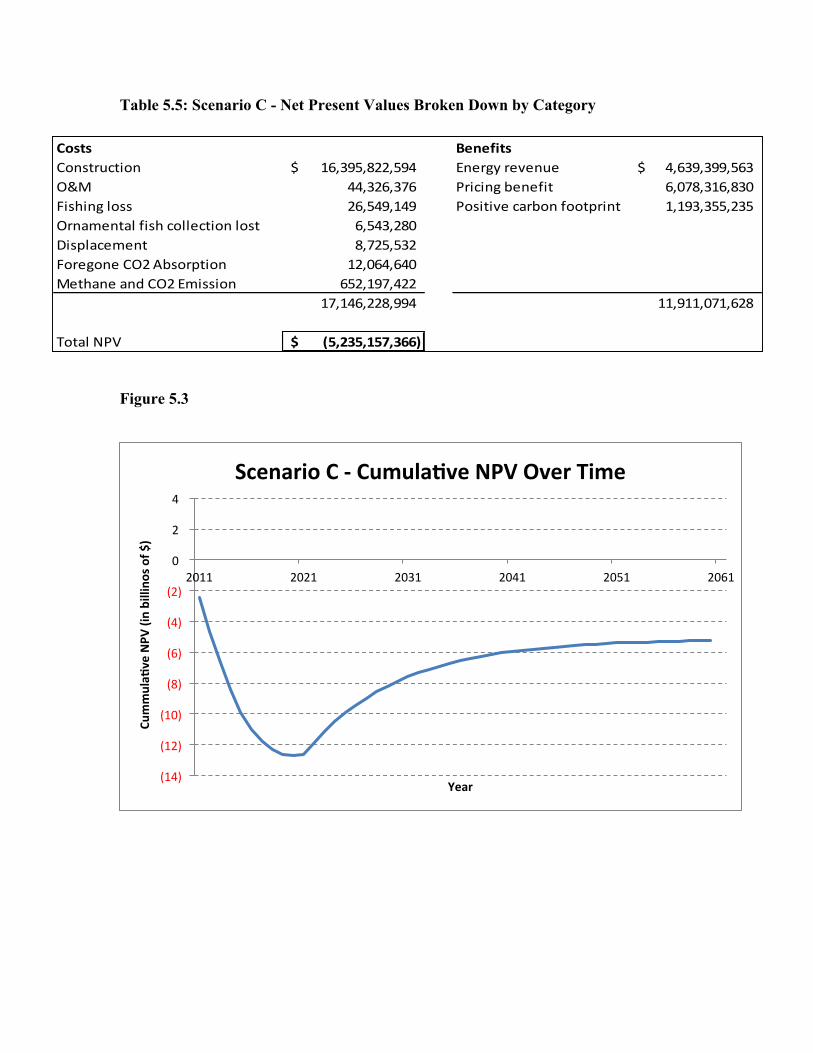
(14)
(12)
(10)
(8)
(6)
(4)
(2)
0
2
4
2011 2021 2031 2041 2051 2061
Cum
mula'
ve NPV
(in billino
s of $
)
Year
Scenario C -‐ Cumula've NPV Over Time
Table 5.5: Scenario C - Net Present Values Broken Down by Category
Figure 5.3
Costs BenefitsConstruction 16,395,822,594$ Energy revenue 4,639,399,563$ O&M 44,326,376 Pricing benefit 6,078,316,830 Fishing loss 26,549,149 Positive carbon footprint 1,193,355,235 Ornamental fish collection lost 6,543,280 Displacement 8,725,532 Foregone CO2 Absorption 12,064,640 Methane and CO2 Emission 652,197,422
17,146,228,994 11,911,071,628
Total NPV (5,235,157,366)$

Scenario D: Slightly Improved Capacity Factor
For Scenario D, we will assume that Belo Monte reaches a capacity factor of 56% as
opposed to the 40.7% originally predicted. The 56% is equivalent to the average capacity
factor of large (>30MW) hydroelectric dams in Brazil. Scenario D’s net present values
for each category are presented in Table 5.6. Cumulative NPV over time is shown in
Figure 5.4.
Scenario D results in a NPV of $2.4 billion. As we can see, you do not need a 15.7%
increase in its capacity factor in order to be NPV positive (all else equal). In fact, Belo
Monte could have a lower than average capacity factor relative to other large dams in
Brazil and still be NPV positive; Belo Monte’s capacity factor needs only to increase to
48.65% to be NPV positive.
There are several ways to increase the capacity factor. One, were the reservoir enlarged
through the construction of more dams along the Xingu River, Belo Monte would be able
to draw water from a larger source and thus run closer to its installed capacity. Of course,
this benefit of constructing more dams may be outweighed by the costs of building these
extra dams. Second, increases in rainfall would also lead to a larger reservoir and thus
lead to a higher capacity factor. However, average rainfall over a timespan as large as
fifty years is likely to be similar to historical averages, and historical averages were used
to predict the original capacity factor of 40.7%.

Table 5.6: Scenario D - Net Present Values Broken Down by Category
Figure 5.4
(12)
(10)
(8)
(6)
(4)
(2)
0
2
4
2011 2021 2031 2041 2051 2061
Cum
mulative NPV (in billinos of $)
Year
Scenario D -‐ Cumulative NPV Over Time
Costs BenefitsConstruction 14,985,406,526$ Energy revenue 7,072,189,766$ O&M 55,740,390 Pricing benefit 9,265,640,843 Fishing loss 26,549,149 Positive carbon footprint 1,790,434,017 Ornamental fish collection lost 6,543,280 Displacement 9,569,924 Foregone CO2 Absorption 12,064,640 Methane and CO2 Emission 652,197,422
15,748,071,332 18,128,264,626
Total NPV 2,380,193,294$

Scenario E: The Miracle, Maximum Capacity
Scenario E assumes that the dam will operate at full installed capacity over the entire fifty
years. The scenario is little more than a thought experiment – it serves to provide a type
of upper bound for our analysis. Scenario E’s net present values for each category are
presented in Table 5.7. Cumulative NPV over time is shown in Figure 5.5.
Maximum capacity power production results in a NPV of $16.6 billion. Again, this figure
is purely hypothetical. Even Itaipu Dam, one of the most efficient mega-dams in the
world, runs at a capacity factor of 75%.

Table 5.7: Scenario E - Net Present Values Broken Down by Category
Figure 5.5
(13)
(8)
(3)
2
7
12
17
2011 2021 2031 2041 2051 2061
Cum
mulative NPV (in billinos of $)
Year
Scenario E -‐ Cumulative NPV Over Time
Costs BenefitsConstruction 14,985,406,526$ Energy revenue 12,628,910,296$ O&M 55,740,390 Pricing benefit 16,545,787,220 Fishing loss 26,549,149 Positive carbon footprint 3,197,203,601 Ornamental fish collection lost 6,543,280 Displacement 9,569,924 Foregone CO2 Absorption 12,064,640 Methane and CO2 Emission 652,197,422
15,748,071,332 32,371,901,117
Total NPV 16,623,829,785$

Scenario F: Extreme Weather and the Possibility of Droughts
Another scenario that we will run includes the possibility of extreme weather, specifically
droughts. The decrease in rainfall and low river conditions associated with droughts leads
to dams having lower power production. This issue is certainly applicable to Belo Monte,
a dam that already suffers from a very low current during the two dry months of the year.
Brazil has experienced four major droughts in the past two decades – one in 1997-98,
another in 2005, a third in 2010, and a fourth that is currently ongoing and considered to
be the worst in eight decades (extreme rainfall and flooding also affected the country in
2011)c. Projections of future rainfall levels in the Amazon differ by region and change
over time. The northern part of the Amazon, where Belo Monte is located, is projected to
become more vulnerable to extreme dryness and droughts over the course of the 21st
century due to shifts in the world’s air circulation and the potential acceleration of
climate changeci. Therefore, it is possible that our base case scenario is too optimistic
regarding the dam’s power production, since lower water levels and thus lower reservoir
levels will decrease the dam’s overall power generation capacity. Hence, in this scenario,
we incorporate the possibility of droughts.
For Scenario F, there are two key assumptions. First, we assume that there will be a
drought in Brazil roughly every four years (with the first drought in 2018). We took this
number from the cited study from the University of Texas at Austincii. Second, we will
assume that a year that includes a drought drops the average power production of Belo

Monte by 50%. Unfortunately, there is little information available about how droughts
have affected Brazilian dams’ power production in the past, so this number was chosen
arbitrarily. However, the importance of this scenario is to analyze the general
hypothetical of frequent droughts. Scenario F’s net present values for each category are
presented in Table 5.8. Cumulative NPV over time is shown in Figure 5.6.
Scenario F results in a NPV of -$4.2 billion. As expected, the NPV of the dam decreases
as a result of the introduction of possible negative shocks to average power production.
Droughts accomplish this by decreasing all three benefits (energy revenue, cheaper
energy source, positive carbon footprint) while not affecting costs whatsoever.
Interestingly, it took only eleven occurrences of drought to almost double the negative
NPV relative to the Base Case.

Table 5.8: Scenario F - Net Present Values Broken Down by Category
Figure 5.6
(14)
(12)
(10)
(8)
(6)
(4)
(2)
0
2
4
2011 2021 2031 2041 2051 2061
Cum
mulative NPV (in billinos of $)
Year
Scenario F -‐ Cumulative NPV Over Time
Costs BenefitsConstruction 14,985,406,526$ Energy revenue 4,523,105,004$ O&M 55,740,390 Pricing benefit 5,925,953,326 Fishing loss 26,549,149 Positive carbon footprint 1,143,928,422 Ornamental fish collection lost 6,543,280 Displacement 9,569,924 Foregone CO2 Absorption 12,064,640 Methane and CO2 Emission 652,197,422
15,748,071,332 11,592,986,752
Total NPV (4,155,084,580)$
Scenario G: Decrease in Price of Alternatives
Scenario G assumes that the weighted average alternative price per MWh discussed in
“Economic and Financial Costs and Benefits” decreases by 10% (from $70.09/MWh to
$63.08). Scenario G’s net present values for each category are presented in Table 5.9.
Cumulative NPV over time is shown in Figure 5.7.
The net present value for Scenario G is -$3.8 billion. The average alternative price
decrease that drives this decrease in NPV may occur due to shifts in the weighting of the
alternative energy sources or due to decreases in the price of alternatives. Currently, the
highest weight in our calculation of the average alternative price is assigned to fossil
fuels, which also have the second highest price per MWh. If Brazil pursues a policy of
decreasing fossil fuel’s relative contribution to energy production, we will thus see a
decrease in the weighted average alternative price. Another trend that could lead to
decreases in the weighted average price of alternatives is the decrease in price per MWh
of non-hydroelectric renewables such as solar or biomass. It is not a stretch to assume
that these renewable sources of energy will become more prevalent and more
technologically advanced, and thus become cheaper.

Table 5.9: Scenario G - Net Present Values Broken Down by Category
Figure 5.7
(14)
(12)
(10)
(8)
(6)
(4)
(2)
0
2
4
2011 2021 2031 2041 2051 2061
Cum
mulative NPV (in billinos of $)
Year
Scenario G -‐ Cumulative NPV Over Time
Costs BenefitsConstruction 14,985,406,526$ Energy revenue 5,139,966,490$ O&M 55,740,390 Pricing benefit 5,546,555,798 Fishing loss 26,549,149 Positive carbon footprint 1,301,261,866 Ornamental fish collection lost 6,543,280 Displacement 9,569,924 Foregone CO2 Absorption 12,064,640 Methane and CO2 Emission 652,197,422
15,748,071,332 11,987,784,154
Total NPV (3,760,287,178)$

Discount Rate Sensitivity Analysis
We conducted a discount rate sensitivity analysis, using a range 8% through 16%. Table
5.10 shows the net present value of each scenario and for each discount rate.
Table 5.10: NPV of Scenarios Across Discount Rates
The table above illuminates several interesting points about our analysis of Belo Monte.
First, when using a discount rate of 8%, every scenario has a positive NPV. While this
rate is far below the 12% we used for most of our analysis, it is interesting to note that
simply decreasing the risk profile of the country (or alternatively worded, decreasing the
average rate of return on investments in Brazil) has such a dramatic effect on the NPV of
the project. We used the difference in NPVs at 8% and 16% as a proxy for the sensitivity
of each scenario to changes in the discount rate. Five scenarios fall within a $3.7 billion
band, ranging from $9.9 billion to $13.6 billion. The two outliers, Scenarios D and E with
differences of $17.8 billion and $35.0 billion respectively, are both scenarios in which the
average power production of the dam is increased. While Scenario F’s difference of $9.9
8% 10% 12% 14% 16% 8% -‐ 16%
A 5,962,367,694 675,141,917 (2,572,707,577) (4,617,279,953) (5,922,547,873) 11,884,915,567 B 14,433,147,701 8,628,993,699 4,919,995,686 2,462,626,936 786,627,362 13,646,520,339 C 2,229,841,300 (2,473,311,015) (5,235,157,366) (6,873,899,650) (7,839,131,625) 10,068,972,925 D 14,959,715,252 7,240,184,543 2,380,193,294 (779,619,806) (2,884,468,047) 17,844,183,299 E 40,834,440,254 26,120,045,690 16,623,829,785 10,256,788,462 5,852,493,543 34,981,946,711 F 3,051,415,386 (1,436,328,339) (4,155,084,580) (5,834,531,728) (6,878,832,191) 9,930,247,578 G 3,819,031,993 (894,512,476) (3,760,287,178) (5,539,492,008) (6,653,883,230) 10,472,915,223
Scenario
Discount rate

billion was not an outlier, it set the lower bound to our sensitivity analysis. As with
Scenarios D and E, Scenario F deals with changing average power production, except this
time in the opposite direction. Therefore, it seems as though changes in average power
production are the most sensitive to changes in the discount rate relative to other possible
changes in inputs.
In general, the data in Table 5.10 seems to support the idea that Belo Monte is likely to be
a negative NPV project. Only the incredibly unlikely scenarios turn positive NPV at a
10% discount rate, and while an 8% discount rate does make all scenarios positive NPV,
a drop from 12% to 8% seems quite large for a country growing as rapidly as Brazil is
currently. In the range of 10% - 14%, the typical negative NPV is in the several billions.
The notoriety of Belo Monte and the heaps of negative attention surrounding the dam do
seem to be justified.

VI. CONCLUSION
The value of scenario-based analysis is in allowing us to build a robust model to
determine the likely effects of the dam across a wide range of parameters. From the seven
scenarios examined, holding the discount rate constant, we see that four of the scenarios
result in negative NPVs, with the smallest still standing at a sizeable -$2.5 billion. Of the
three positive cases, it is worth immediately dismissing the miracle scenario, Scenario E,
which uses the 100% capacity factor assumption – this is unrealistic given the
performance of similar dams around the world. Of the two remaining positive NPV
scenarios, the first, Scenario B uses the assumption that the final budget is equal to the
proposed budget. The second positive scenario, Scenario D uses a capacity factor in line
with the Brazilian average for large dams (> 30MW). Of these two assumptions, Scenario
D is the more likely, though, given problems with rainfall and water flow, Scenario D
seems to be a stretch as well.
The largest negative scenario, Scenario C, assumes a two-year increase in the total
construction period. Additionally, Scenario C assumes an increase in the overrun factor
of construction costs to 2.4. This is not an unrealistic assumption given the delays in
construction at Belo Monte so far. The next largest negative NPV scenario, Scenario F,
factors in the probability of droughts. Given that Brazil is currently in a drought and
experiences one approximately every four years, this ought to be a serious consideration.
Scenario G assumes that the price of alternative energy sources decreases, eroding the
advantage that hydroelectric power has over them. Considering Brazil’s determination to

move to cheaper renewables, as well as the effect technological advance should have on
the price of such renewables, this too seems a reasonable assumption. Finally, in Scenario
A, our Base Case, the default assumptions still lead to a large, negative NPV. Therefore,
it seems that all scenarios that run reasonable assumptions support the Base Case; Belo
Monte is likely to be a negative NPV project.
Of course, the aforementioned cases are for the discount rate of 12%. In the sensitivity
analysis, we varied the discount rate. A decrease in the discount rate to 8% results in all
scenarios being positive NPV, while a decrease to 10% turns the Base Case into a
positive NPV scenario. By contrast, if the discount rate were to increase to 14% or 16%,
there would only be two positive scenarios: Scenarios B and E. Scenarios B and E are
positive across all the discount rates we tested. Recall, however, that B and E are highly
unlikely (almost impossible, in fact) scenarios.
One further area for discussion is the unquantifiable costs and benefits, which were not
included in the NPV analysis. The value of the dam will be affected by more than just the
inputs included in the analysis, by factors that are either unknown or difficult to predict.
What, for instance, might be the eventual long-term effect of the political cost to the
Brazilian government? Perhaps the credibility of the government might be damaged to
the point where the next large infrastructural investment is met with far greater
skepticism and resistance. This could have a significant but unpredictable effect on the
growth prospects of Brazil going forward. Unquantifiable factors should not be ignored
because they cannot be quantified, and will be fruitful questions to consider when

evaluating the performance of the dam in the future. While the unquantifiable results will
have both positive and negative effects, it is not inconceivable that there are more
unknown negative results than positive, based on preceding analysis.
Two final considerations must be noted. First, could Brazil meet its growing energy
demand by increasing energy efficiency? A WWF-Brazil report in 2007 estimated that
Brazil could cut its demand for electricity by 40% by 2020 by investing in energy saving
technologies. Second, some have argued that greater investment in other types of
renewables, such as wind or nuclear power, could achieve, at a lower price, similar
outcomes to hydroelectricity. As the energy demands for Brazil continue to go up, both of
these options may require revisiting.
Given both Brazil’s burgeoning demand for energy and insistence on filling this demand
with domestic sources of renewable energy, a large infrastructural project such as Belo
Monte that was capable addressing both issues was highly likely. Based on the
assumptions we have described, we expect the Belo Monte Dam to be a costly
infrastructural project, with likely negative Net Present Value. Brazil has precedent; as
discussed throughout the paper, Itaipu Dam was extremely costly, but has still been a
vital source of energy to the nation. A similar end for Belo Monte is certainly plausible,
but especially contingent on construction costs and the variability of rainfall and thus the
reservoir level. While neither strictly negative nor positive, Belo Monte is nearing
completion, and only time will tell if the dam’s numerous detractors are proved correct.

VII. CONTRIBUTIONS Apratim Guatam: Apratim conducted researched for and wrote the “Dam Technology”
section, wrote the three subsections on unquantifiable costs and benefits, jointly wrote the
“Conclusion” section, and edited the paper.
Ian Haubold: Ian created the Excel model used to run all our scenarios, created all tables
and figures in the “Analysis” section, wrote the “Financial and Economic Costs and
Benefits” subsection, and wrote the “Discount Rate Sensitivity Analysis” subsection.
Vicky Pacey: Vicky conducted research for the “Social and Political Costs and Benefits”
subsection and created the bibliography.
David Papirnik: David conducted research for and wrote the “Introduction” section,
conducted research for and wrote most of the “Cost-Benefit Input” section, wrote the
“Analysis” section, jointly wrote the “Conclusion” section, and edited the paper.
Mehek Premjee: Mehek conducted research for the “Environmental Costs and Benefits”
subsection.
Patrick Schlumpf: Patrick conducted research for the subsections “Economic and
Financial Costs and Benefits” and “Social and Political Costs and Benefits.”
VIII. BIBLIOGRAPHY
Almeida Prado, Fernando, and Sanford Berg. “Capacity Factors of Brazilian Hydroelectric
Power Plants: Implications for Cost Effectiveness.” University of Florida Press.
Accessed November 12, 2014.
http://warrington.ufl.edu/centers/purc/purcdocs/papers/1305_Berg_Capacity_Factors_of.
pdf.
“Amazon Watch - Brazil’s Belo Monte Dam.” Amazon Watch. Accessed December 6, 2014.
http://amazonwatch.org/work/belo-monte-dam.
Ansar, Atif and Flyvbjerg, Bent and Budzier, Alexander and Lunn, Daniel. “Should We Build
More Large Dams? The actual Costs of Hydropower Megaproject Development.” Energy
Policy, March 2014. http://ssrn.com/abstract=2406852
“Belo Monte Dam.” International Rivers. Accessed December 6, 2014.
http://www.internationalrivers.org/campaigns/belo-monte-dam.
“The Belo Monte Dam: An Environmental Crime.” International Rivers. Accessed October
12, 2014. http://www.internationalrivers.org/th/resources/the-belo-monte-dam-an-
environmental-crime-7533.

"Belo Sun Volta Grande Project." Belo Sun Mining Corp. January 1, 2011. Accessed
December 8, 2014. http://www.belosun.com/Projects/Volta-Grande/.
Bloomberg Data. Ticker: GEBR10Y:IND, Bloomberg, December 3, 2014.
http://www.bloomberg.com/quote/GEBR10Y:IND.
"Brazil Drought Stokes Worries over Energy Shortages." BBC News. January 18, 2013.
Accessed December 8, 2014.
“Brazil’s Belo Monte Dam to Displace Thousands in Amazon.” ABC News Blogs. Accessed
December 6, 2014. http://abcnews.go.com/blogs/headlines/2012/06/brazils-belo-monte-
dam-to-displace-thousands-in-amazon/.
“Brazil’s Wind Power Auction Spurs More Clean Energy Development.” Renewable Energy
World. Accessed December 6, 2014.
http://www.renewableenergyworld.com/rea/news/article/2009/12/brazils-wind-power-
auction-spurs-more-clean-energy-development.
“Brazil’s Wind Power Auction Spurs More Clean Energy Development.” Renewable Energy
World. Accessed December 6, 2014.
http://www.renewableenergyworld.com/rea/news/article/2009/12/brazils-wind-power-
auction-spurs-more-clean-energy-development.

Bergh, JC van der and Botzen, WJ. “A lower bound to the social cost of CO2 Emissions.”
Nature Climate Change, March 2013.
Cabral de Sousa, Wilson. “Tapajós: Hidrelétricas, Infraestrutura E Caos.” ITA/TCA, 2014.
Accessed December 3, 2014.
“Calculations and References.” Environmental Protection Agency. Accessed December 6,
2014. http://www.epa.gov/cleanenergy/energy-resources/refs.html.
Callan, Hilary, Brian Street, and Simon Underdown. Introductory Readings In Anthropology.
Berghahn Books, 2013.
Chung, Helena and Di Capua, Michel. “Solar Energy Makes Landfall in Brazil at Record-
Setting Low Price.” Bloomberg. Accessed December 5, 2014.
http://about.bnef.com/press-releases/solar-energy-makes-landfall-brazil-record-setting-
low-price/.
Claydon, John. “Turbines,” n.d. http://www.jfccivilengineer.com/index.htm.
Commerford, Mark. “Hydroelectricity: The Negative Ecological and Social Impact and the
Policy That Should Govern It.” ETH, n.d.
http://www.files.ethz.ch/cepe/Top10/Commerford.pdf.

Cotton, K. C. Evaluating and Improving Steam Turbine Performance. Rexford, N.Y.: Cotton
Fact, 1993
Council of Economic Advisors. “Interagency Working Group on Social Cost of Carbon,
United States Government.” White House, May 2013.
Craide, Sabrina. “Brazil’s Big Contractors Looking for a Bigger Slice of Belo Monte’s
Action.” Brazzil Mag, April 27, 2010.
Daneshkah, K., and M. Zangeneh. "Parametric Design of a Francis Turbine Runner by Means
of a Three-dimensional Inverse Design Method." IOP Conference Series: Earth and
Environmental Science, 2010.
Dezem, Vanessa. “Brazil Awards First Contracts Since 2011 for Coal and Gas Power.”
Bloomberg, November 28, 2014. http://www.bloomberg.com/news/2014-11-28/brazil-
awards-first-contracts-since-2011-for-coal-and-gas-power.html.
Eletrobras. “AHE Belo Monte - Evolução Dos Estudos,” n.d.
"Energy Security." International Energy Association – 2011.
"The Ethnobotanical Approach to Drug Discovery," Scientific American”, June 1994
Environnmental Encyclopedia, 3rd ed., Thompson Gale, 2003.
Fearnside, Philip. “Dams in the Amazon: Belo Monte and Brazil’s Hydroelectric Development
of the Xingu River Basin.” International Rivers, Environmental Management xx, no. x
(n.d.): 1–13.
Fearnside, Philip M. “Hydroelectric Dams in the Brazilian Amazon as Sources of
‘Greenhouse’ Gases.” Environmental Conservation 22, 01 March 1995: 7.
doi:10.1017/S0376892900034020.
Fearnside. Philip M. “Will Brazil’s Belo Monte Dam Get the Green Light?” Latin America
Energy Advisor, August 2012.
Francis, James. “Lowell Notes.” National Park Service, n.d.
http://www.nps.gov/lowe/historyculture/upload/JB%20Francis_%20Lowell%20Notes
Francis Turbine, 2013.
https://www.youtube.com/watch?v=JD4VkzHk6rk&feature=youtube_gdata_player.
"Francis Hydro Turbines | Alstom." Francis Hydro Turbines | Alstom. March 1, 2012

Gillis, Justin. “A Price Tag on Carbon as a Climate Rescue Plan.” The New York Times, May
30, 2014. http://www.nytimes.com/2014/05/30/science/a-price-tag-on-carbon-as-a-
climate-rescue-plan.html.
Graham, Nick, Tatiana Santos, and Humberto Correa. “Overseas Market Introduction Service
First Activity for Seafish.” UK Trade & Investment, n.d.
http://seafish.org/media/765540/brazil.pdf.
“Harmful Impacts of the Belo Monte Dam on the Amazon’s Xingu River.” Intercontinental
Cry. Accessed October 20, 2014. https://intercontinentalcry.org/harmful-impacts-of-the-
belo-monte-dam-on-the-amazons-xingu-river/.
Holcomb, Katrina. “Will the Belo Monte Dam Project on the Amazon River Cause More
Harm to the Environment or Will It Be a Good Source of Energy for Brazil?” TED Talks,
n.d. Accessed November 1, 2014.
Howard, Brian Clark. “Brazil’s Severe Drought Dries Up Reservoirs.” National Geographic,
October 24, 2014. http://news.nationalgeographic.com/news/2014/10/141024-sao-paulo-
brazil-drought-water-environment/.
“IBAMA President Resigns Over Belo Monte Licensing.” International Rivers. Accessed
December 6, 2014. http://www.internationalrivers.org/blogs/258/ibama-president-
resigns-over-belo-monte-licensing.

“IMPSA Belo Monte Facts”, March 2012
http://www.impsa.com/en/downloads/HYDRO/BELO%20MONTE.pdf
“Itaipu Binational Hydroelectric Power Plant.” Clean Energy Action Project. Accessed
December 6,
2014.http://www.cleanenergyactionproject.com/CleanEnergyActionProject/Hydropower_
Case_Studies_files/Itaipu%20Binational%20Hydroelectric%20Power%20Plant.pdf
“Kaplan, Viktor | Austria-Forum.” Austria-Forum. January 2, 2012.
Kepp, Michael. “The Battle of Belo Monte - A $13-Billion Enterprise.” Folha de San Paulo.
Accessed December 6, 2014. http://arte.folha.uol.com.br/especiais/2013/12/16/belo-
monte/.
Korby, Boris. “Brazil’s Credit Rating Cut to BBB- by S&P on Sluggish Growth.” Bloomberg,
March 24, 2014.http://www.bloomberg.com/news/2014-03-24/brazil-s-credit-rating-cut-
to-bbb-by-s-p-on-sluggish-growth.html
Kozloff, Nikolas. “No Rain in the Amazon: How South America’s Climate Change Affects
the Entire Planet.” Palgrave MacMillan, 2010. New York, USA.

Kumar, A., T. Schei, A. Ahenkorah, R. Caceres Rodriguez, J.-M. Devernay, M. Freitas, D.
Hall, A. Killingtveit, Z. Liu. “Hydropower” in IPCC Special Report on Renewable
Energy Sources and Climate Change Mitigation [O. Edenhofer, R. Pichs-Madruga, Y.
Sokona, K. Seyboth, P. Matschoss, S. Kadner, T. Zwickel, P. Eickemeier, G. Hansen, S.
Schlomer, C. von Stechow (eds)], Cambridge University Press 2011.
“Lowell Notes, James B. Francis.” National Park Service. January 1, 2008.
Walter, Martin E. “Earthquakes and Weatherquakes: Mathematics and Climate Change.”
Notices of the American Mathematical Society, Volume 57, Number 10.
Marengo, José. “Climate Change and Extreme Events in Brazil.” FBDS, n.d.
http://www.lloyds.com/~/media/lloyds/reports/360/360%20climate%20reports/fbdsreport
onbrazilclimatechangeenglish.pdf.
“Norte Energia | Norte Energia S.A.” Accessed December 6, 2014.
http://norteenergiasa.com.br/site/ingles/norte-energia/.
Osava, Mario. “BRAZIL: Belo Monte Dam Means Floods for Some, Drought for Others.”
Inter Press Service. Accessed October 1, 2014. http://www.ipsnews.net/2010/07/brazil-
belo-monte-dam-means-floods-for-some-drought-for-others/.

Pao, Hsiao-Tien, Yi-Ying Li, and Hsin-Chia Fu. “Causality Relationship between Energy
Consumption and Economic Growth in Brazil.” Smart Grid and Renewable Energy 05,
Nov 08 2014: 198–205. doi:10.4236/sgre.2014.58019.
“Power and the Xingu.” The Economist, April 22, 2010.
http://www.economist.com/node/15954573.
Guimaraes, Rogerio, and Miller, Michael. “Brazilian Transmission System: A Race for the
Future.” Electrical Transmission and Substation Structures 2012: Solutions to Building
the Grid of Tomorrow. ASCE Publications, 2012.
“Quais São as Vantagens E Desvantagens de Belo Monte?” Superinteressante - Abril.
Accessed December 6, 2014. http://super.abril.com.br/ecologia/quais-sao-vantagens-
desvantagens-belo-monte-667389.shtml.
Reid, John. “Wholesale Price of Energy.” CSF, April 4, 2009.
“The Rights and Wrongs of Belo Monte.” The Economist, May 4, 2013.
http://www.economist.com/news/americas/21577073-having-spent-heavily-make-worlds-
third-biggest-hydroelectric-project-greener-brazil.

Schmidt, Blake. “Megadams Are Dismal Investments.” Bloomberg Businessweek, March 13,
2014. http://www.businessweek.com/articles/2014-03-13/megadams-are-dismal-
investments
Schweiger, F., and J. Gregori. "Developments in the design of Kaplan turbines." International
Water Power and Dam Construction IWPCDM 39, December 1987.
Smith, Tom Y. ”Brazil’s Power Market Crisis.” Bureau of Economic Geology Jackson School
of Geosciences, The University of Texas at Austin, 2002.
http://www.beg.utexas.edu/energyecon/new-
era/case_studies/Brazil_Power_Market_Crisis.
Soytas, Ugur, and Ramazan Sari. “Energy Consumption and GDP: Causality Relationship in
G-7 Countries and Emerging Markets.” Elsevier, n.d. https://plagiarism.repec.org/amiri-
zibaei/amiri-zibaei4.pdf.
“Sustainability Report: Economic Performance,” 2010.
http://www.eletrobras.com/relatorio_sustentabilidade_2010/html_in/economic_performa
nce.html.
Teixeira, Juliana Christina. “Construtora revela custos de empreendimento no ‘Minha Casa,
Minha Vida.’” Construcao, June 2009. http://construcaomercado.pini.com.br/negocios-
incorporacao-construcao/95/artigo299235-1.aspx.

“Tenotã–mõ Executive Summary.” International Rivers. Accessed December 6, 2014.
http://www.internationalrivers.org/resources/tenot%C3%A3%E2%80%93m%C3%B5-
executive-summary-4065.
“Three Gorges Hydroelectric Power Plant.” Clean Energy Action Project. Accessed December
6, 2014.
http://www.cleanenergyactionproject.com/CleanEnergyActionProject/Hydropower_Case
_Studies_files/Three%20Gorges%20Dam%20Hydroelectric%20Power%20Plant.pdf
Tol, R. S. J. “The Economic Impact of Climate Change.” J. Econ. Persp. 2009: 29–51.
doi:10.1257/jep.23.2.29.
Tundisi, José Galizia, Marco Aurélio Santos, and Carlos Frederico Menezes. “TUCURUÍ
RESERVOIR AND HYDROELECTRIC POWER PLANT Management Experience
Brief.” Worldlakes, n.d. http://www.worldlakes.org/uploads/Tucurui_15Jun03.pdf.
Turner, Terence. “The Role of Indigenous Peoples in the Environmental Crisis: The Example
of the Kayapo of the Brazilian Amazon.” Johns Hopkins University Press, n.d., 526–45.
US Energy Information Administration. “BRAZIL,” n.d.
http://www.eia.gov/countries/country-data.cfm?fips=BR#tpe.

US EPA, Climate Change Division. “Social Cost of Carbon.” Overviews & Factsheets,
Accessed December 6, 2014.
http://www.epa.gov/climatechange/EPAactivities/economics/scc.html.
USGS. “Advantages of Hydroelectric Power Production and Usage.” Accessed November 11,
2014. http://water.usgs.gov/edu/hydroadvantages.html.
"Water Turbines and Their Uses." Water Turbines and Their Uses, JFF Civil Engineers.
January 1, 2011. Accessed December 8, 2014.
http://www.jfccivilengineer.com/turbines.htm.
Dunham, Will. "Shocking News: Electric Eels Exert Remote Control over Prey." Reuters.
December 4, 2014. Accessed December 8, 2014
World Bank Data. “Brazil.” World Bank, Accessed December 5, 2014.
http://data.worldbank.org/country/brazil.
World Nuclear Association. “Nuclear Power in Brazil,” n.d. http://www.world-
nuclear.org/info/Country-Profiles/Countries-A-F/Brazil/.
WWF. “Sustainable Electricity Agenda 2020: Study of scenarios for an efficient, safe, and
competitive Brazilian electrical sector.” Estudos Avancados, 2007.

i Kepp. ii ibid. iii ibid. iv ibid. v ibid. vi “Sustainability Report: Economic Performance.” vii “The Rights and Wrongs of Belo Monte.” viii “Three Gorges Hydroelectric Power Plant.” ix “Itaipu Binational Hydroelectric Power Plant.” x Kumar et al. xi ibid. xii Almeida Prado et al. xiii Kumar et al. xiv ibid. xv Almeida Prado et al. xvi Eletrobras. xvii ibid. xviii “Tenotã–mõ.” xix Callan et al. xx Turner et al. xxi Callan et al. xxii ibid. xxiii “Amazon Watch - Brazil’s Belo Monte Dam.” xxiv ibid. xxv “Tenotã–mõ.” xxvi “Amazon Watch - Brazil’s Belo Monte Dam.” xxvii ibid. xxviii ibid. xxix “The Rights and Wrongs of Belo Monte.” xxx Fearnside, “Will Brazil’s Belo Monte Dam Get the Green Light?” xxxi “Amazon Watch - Brazil’s Belo Monte Dam.” xxxii ibid. xxxiii “IBAMA President Resigns Over Belo Monte Licensing.” xxxiv “Amazon Watch - Brazil’s Belo Monte Dam.” xxxv ibid. xxxvi Fearnside, “Will Brazil’s Belo Monte Dam Get the Green Light?” xxxvii ibid. xxxviii ibid. xxxix ibid. xl “The Rights and Wrongs of Belo Monte.” xli ibid. xlii ibid. xliii “Power and the Xingu.” xliv US Energy Information Administration. xlv Soytas et al. xlvi Pao et al. xlvii Guimaraes et al. xlviii US Energy Information Administration. xlix Belo Monte | Norte Energia S.A. l “Lowell Notes, James B. Francis.” li Deneshkah et al. lii “Kaplan, Viktor | Austria-Forum.” liii Schweiger et al. liv Cotton. lv lv "Francis Hydro Turbines | Alstom."

lvi GDF Suez lvii Belo Monte | Norte Energia S.A. lviii “Water Turbines and their Uses” JFF Civil Engineering lix IMPSA Belo Monte lx Schmidt. lxi Cabral de Sousa. lxii “Itaipu Binational Hydroelectric Power Plant.” lxiii Tundisi et al. lxiv Fearnside, “Will Brazil’s Belo Monte Dam Get the Green Light?” lxv Cabral de Sousa. lxvi Graham et al. lxvii Cabral de Sousa. lxviii Reid. lxix Craide. lxx “Brazil’s Wind Power Auction Spurs More Clean Energy Development.” lxxi ibid. lxxii Chung et al. lxxiii Dezem. lxxiv World Nuclear Association. lxxv Belo Monte Sun Volta Grande lxxvi “The Rights and Wrongs of Belo Monte.” lxxvii Kozloff lxxviii Commerford. lxxix ibid. lxxx US EPA. lxxxi Council of Economic Advisors. lxxxii Bergh et al. lxxxiii Council of Economic Advisors. lxxxiv “Harmful Impacts of the Belo Monte Dam on the Amazon’s Xingu River.” lxxxv "The Ethnobotanical Approach to Drug Discovery” lxxxvi Dunham. lxxxvii Walter. lxxxviii Environnmental Encyclopedia. lxxxix “The Rights and Wrongs of Belo Monte.” xc “Brazil’s Belo Monte Dam to Displace Thousands in Amazon.” xci Teixeira. xcii World Bank. xciii “The Rights and Wrongs of Belo Monte.” xciv "Energy Security." IEA -. 2011 xcv "Brazil Drought Stokes Worries over Energy Shortages.". xcvi Bloomberg Data. xcvii Korby. xcviii Cabral de Sousa. xcix “The Rights and Wrongs of Belo Monte” c Howard. ci Marengo. cii Smith.