Embed Size (px)
Citation preview

Discussion Papers in Economics
No. 2000/62
Dynamics of Output Growth, Consumption and Physical Capital in Two-Sector Models of Endogenous Growth
by
Farhad Nili
Department of Economics and Related Studies University of York
Heslington York, YO10 5DD
No. 2000/04
Prescription Charges In The United Kingdom: A Critical Review
by
Theodore Hitiris

PRESCRIPTION CHARGES IN THE UNITED KINGDOM: A CRITICAL REVIEW
Theodore Hitiris*
Abstract
This is a critical evaluation of studies of the effects of prescription charges on UK National
Health Care revenues. The conclusion reached is that, for several reasons relating to the
availability of data and the quantitative methods used, the empirical studies of the effects of these
charges were not able to provide a reliable estimate of the elasticity of demand for prescriptions
and therefore of the revenue effects of increasing the prescription charges. However, a sensitivity
analysis based on a range of this elasticity’s values shows that the revenue effect of prescription
charges is negligible.
Key words: Prescription charges, Co-payments
Journal of Economic Literature classification numbers: I11, I18
* Department of Economics, University of York, York YO10 5DD, uk
e-mail address: [email protected]

1
PRESCRIPTION CHARGES IN THE UNITED KINGDOM: A CRITICAL REVIEW*
Theodore Hitiris
University of York
1. Introduction
The demand for health care can be viewed as any other demand for goods and services, that is a
function of its price, the prices of other goods, income and other factors such as tastes. When
public or private insurance pays the bill, the effective price to consumers is zero, and they are
expected to demand the quantity associated with zero price. Therefore, unless the demand is
perfectly elastic, copayments are expected to reduce the quantity demanded. A copayment is here
defined as a direct charge on the patient at the time of service for each service consumed. Such
charges, which are proportional to the cost or fixed, are also referred to as utilisation fees, cost-
sharing, coinsurance, deductibles, etc.
* I am grateful for the comments of Professor T. Tokita and the seminar participants at the
Ministry of Health and Welfare, Tokyo, Japan, in December 1999. I would also like to thank
Karen Bloor, Sandrine Chambaretaud, David Hughes, Julie Glanville, Andrew Jones, Alistair
McGuire, Kate Misso, Mark Sculpher, and Peter Yuen for the supply of helpful information. I
remain responsible for errors, omissions and opinions expressed in this paper.
2
1The term utilisation is often used instead of demand to reflect that the latter is generatedby the interaction of the patient and his clinical agent, the GP. It is the GP who demands healthcare on the patient’s behalf.
In insurance-based health care systems, copayments in health care are usually justified as a
reduction in “moral hazard.” It is argued that if consumers of health services do not contribute to
costs, they tend to use more medical care. Therefore, copayment “is intended as an incentive to
deter unnecessary or marginal utilization” (Reeder and Nelson, 1985). In National Health
Systems (NHS), this type of moral hazard is preventable. However, NHS also introduce
copayments but for the sole purpose of generating additional revenue for the health service.
Whatever the reason, what is important to know before introducing copayments is:
i. whether the reduction in utilisation would be substantial;
ii. whether the reduction would have delayed effects on national health and the future
health care budget;
iii. the effect on the distribution of the provision of services to selected population
groups, such as the low income, the old etc.;
iv. the effect on the distribution of income, and particularly the income of the sick and
the poor.
To study the effect of copayments on the utilisation1 of health services, we need to know the
price elasticity of demand for medical services. A problem associated with the measurement of
response to copayments is that different individuals and groups of individuals in the population
(identified by age, sex, income, sickness categories, educational level etc.) have different tastes
for medical care, different demand characteristics and different responses to price changes.
Therefore, it is important to identify the persons, whose use of medical services will be reduced

3
2Experimental data are also used, mostly in USA studies, e.g. Reeder and Nelson (1985).
3Studies have shown that individuals in the lowest fifth of families by income reportabout twice the level of acute and chronic conditions as the remainder of the population. Beck(1974) found that in Saskatchewan copayment provisions reduced the use of physicians’ servicesby an estimated 18 percent by the poor, which is conciderably greater than 6 to 7 per centreduction experienced by the entire population.
4 Although, at the margin, the NHS imposes certain constraints on GPs on what they areallowed to prescribe.
most and least by the policy of copayments so that the overall reduction in utilisation can be
evaluated. However, most studies in this field depend on the available data which are mostly
national aggregates that do not reveal any allocational information2.
A major conclusion reached by almost all studies is that copayments affect
disproportionally the poorer sections of the population which, besides their low incomes, also
display health status which is typically poorer that of the more affluent3.
In the following we review the methodology and findings of studies concerned with drug
prescription copayments (or charges) in the UK which is a typical NHS country.
2. Prescription charges in the UK
The demand for prescriptions is indirectly a demand for medicines. In the highly regulated NHS
system of the UK, it is the GP who determines the patient’s “need” for drugs which are dispensed
by registered pharmacists. Under the NHS system, the supply of pharmaceuticals prescribed by
GPs is unrelated to the price faced by the consumers4. Therefore, supply in the relevant range is
perfectly elastic and the demand can be studied on its own. The demand for prescriptions
4
depends on the price of prescriptions in real terms, other relevant variables and on the incidence
of sickness. Therefore, an increase of prescription charges is expected to reduce the demand.
The copayment/charge is a flat rate tax, that is a fixed amount per prescription, P, which
is independent of the volume of the medicine prescribed and of its cost, C, to the NHS.
Therefore, if P>C, the drug is subject to high cost-sharing and thus the patient subsidises the
NHS; and if P<C, the patient is subsidised by the NHS. In general, high cost users of drugs are
cross-subsidised by low-cost users. Charges are changed periodically, e.g., in the UK normally
once a year.
Patient charges are increasingly advocated by UK governments as a policy to raise
revenue and regulate the utilisation of primary health care. The total NHS prescription cost has
increased from £1,351 million in 1968 to £4,470 million in 1998 (at 1990 prices), an increase of
330%. In per capita terms the increase is from £24 in 1968 to £75 in 1998, an increase of 312%.
However, the UK has one of the lowest pharmaceutical expenditures per capita among the OECD
countries, where Japan comes first: see Figure 1. In the UK, spending on drugs represents 12.6%
of the NHS budget, and it is increasing steadily over time. From 1948, the inception of the NHS,
to 1952 no charge was levied on prescriptions. In 1952 a charge of £0.05 per item prescribed was
introduced. The charge was abolished during 1965-68 and reintroduced in 1968 at £0.13. In 1971
it was raised to £0.20 and remained at a constant level until 1979. Since 1982, the charge has
been increasing annually in keeping with the aim of the government to maintain or increase
efficiency and equity, reaching £5.90 in 1999: see Table 1. During the period 1980-98, the charge
per prescription item has increased by 355% in real terms.

5
0 50 100 150 200 250 300 £ per capita
JapanFrance
USABelgium
GermanyDenmarkPortugal
SpainNetherlands
ItalyCanada
AustraliaGreece
UKIreland
Figure 1 Pharmaceutical expenditureper capita in OECD countries, 1995
Source: OECD Health Database

6
NHS Precription Charges, 1949-1999
1. 1 June 1952 0.05 per form2. 1 Dec 1956 0.05 per item3. 1 Mar 1961 0.10 per item4. 1 Feb 1965 charges abolished5. 10 June1968 0.13 per item6. 1 Apr 1971 0.20 per item7. 16 July 1979 0.45 per item8. 1 Apr 1980 0.70 per item9. 1 Dec 1980 1.00 per item10. 1 Apr 1982 1.30 per item11. 1 Apr 1983 1.40 per item12. 1 Apr 1984 1.60 per item13. 1 Apr 1985 2.00 per item14. 1 Apr 1986 2.20 per item 15. 1 Apr 1987 2.40 per item16. 1 Apr 1988 2.60 per item17. 1 Apr 1989 2.80 per item18. 1 Apr 1990 3.05 per item19. 1 Apr 1991 3.40 per item20. 1 Apr 1992 3.75 per item21. 1 Apr 1993 4.25 per item22. 1 Apr 1994 4.75 per item23. 1 Apr 1995 5.25 per item24. 1 Apr 1996 5.50 per item25. 1 Apr 1997 5.65 per item26. 1 Apr 1998 5.80 per item27. 1 Apr 1999 5.90 per item
Table 1

7
With the prescription charge increasing through time, the per capita prescription items dispensed
increase as a result of a sharp increase in exempt prescription, while the per capita nonexempt
items decrease, as shown in Figure 2. Therefore, patients liable to pay the charge do receive
considerably fewer prescriptions than those who get it free, e.g., seven times fewer in 1997. This
also means that the revenue from prescription charges is necessarily small.
Critics of this policy argue that charging for drugs is contrary to the aim of the NHS since
it is just a regressive tax on the sick which reduces the take-up of prescription medicines, and
more generally, of primary health care by those who face the charge. The Government’s view is
categorical:
There is no evidence that increases in charges deter people from getting the
medicines they need. (House of Commons, 1989).
This clearly means that the Government believes that the price elasticity of demand for
prescriptions is very small or even zero at the margin. But not all prescriptions dispensed are
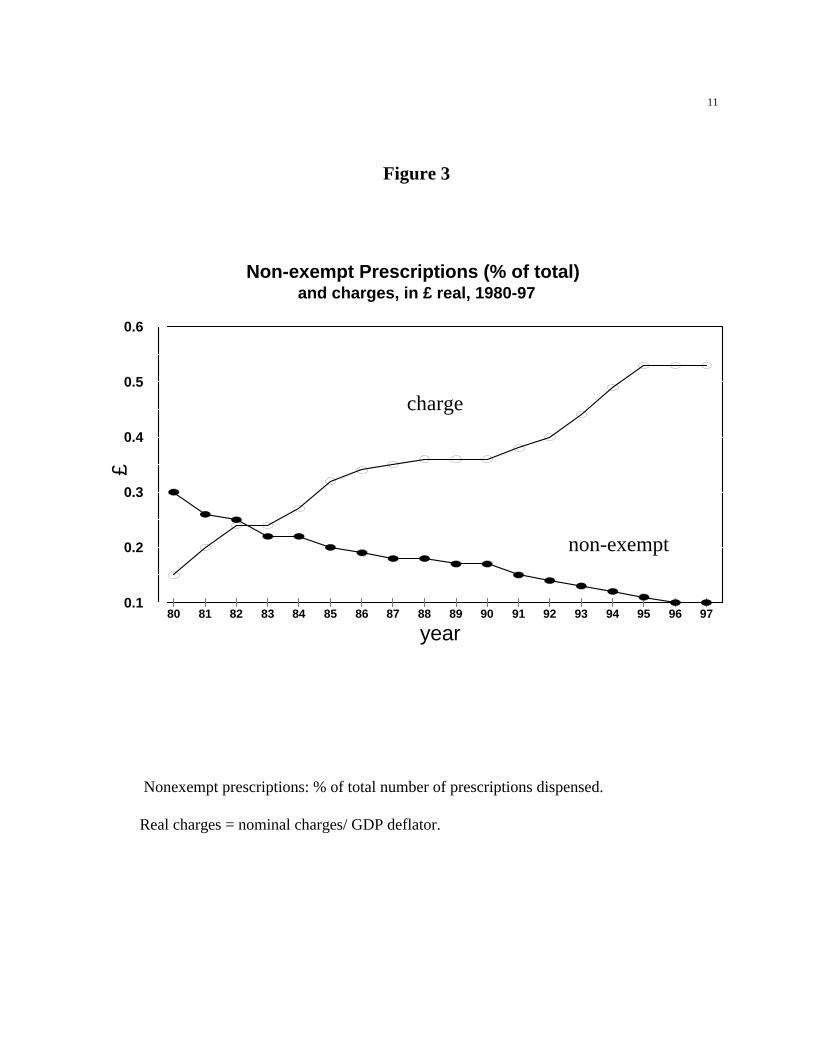
subject to charges: from all prescriptions dispensed in 1997, about 86% were exempted. Figure 3
clearly shows that there is a negative relation between the prescription charges in real terms and
the ratio of charged to total prescriptions dispensed. The current rules of exemptions are as in
Table 2.
When the government increases the prescription charges as the means for saving money,
the following may occur:
� The price rise deters the patients from consulting their GP, they consume no health care
or they switch to self-medication with “over-the-counter” cheaper drugs;
� The GP responds to the increase in charges by increasing the quantity prescribed per

8
5For example, in the UK, an increase the prescription charge in 1961 was associated witha 4% increase in the average quantities per prescription. Some of these complications can beavoided by adopting an appropriate copayment system, e.g., in Germany there is a fixed chargebased on the package size of a prescription item plus a proportion on the cost of the drug.
prescription. Thus the impact of copayment on the patient is diminished by reducing the
frequency of prescription dispensing (and there is no much budgetary saving for the
health service5).
� The GP, taking into account of the economic effects of the charges on the patient, does
not prescribe a drug;
� The GP prescribes a drug but the patient does not present the prescription to the
pharmacist (i.e., reduces compliance; this could result in inefficient drug use, harming the
patient);
� The patient discards the prescription and buys a cheaper alternative to the medicine
prescribed (advised perhaps by the pharmacist) which is available for retail sale without
prescription(over-the-counter).
The primary reason of the charges is to raise revenue to offset the costs of the medicines
dispensed by the NHS. Thus, it operates as a substitute for Government expenditure on the NHS.
Therefore, for estimates of the revenue generating effects of the charges, an accurate estimation
of the elasticity of demand is essential.
The objectives of the study of prescription charges are three:
1. To estimate the size of the quantitative relationship and elasticity between charges
and utilisation;
2. To determine which population groups are deterred from using prescription

9
medicines; and
3. Thus to evaluate whether the policy of charges has deleterious health effects, which
may have delayed cost consequences on the health service budget far exceeding the
short-run savings.
The studies of the UK charges concentrate in objective 1. In the following, we review the
evidence found by some analytically and methodologically important studies in this field of
research.
Table 2: Exemptions from Prescription Charges, 1999
under 16
between 16-18 and in full time in education
60 or over
pregnant, or mother of baby in the last 12 months
entitled to medical exemptions
a war or Ministry of Defense pensioner
entitled to prepayment certificate
in the NHS Low Income Scheme
receiving any of the following:
income support
family credit
Disability Working Allowance (DWA)
job seeker’s allowance (income based)

10
0
2
4
6
8
10
80 81 82 83 84 85 86 87 88 89 90 91 92 93 94 95 96 97
total
exempt
non-exempt
Figure 2:
UK Per Capita Prescriptions Dispensed: Total, Exempt and Nonexempt
Prescriptions, 1980-97
11
0.1
0.2
0.3
0.4
0.5
0.6
£
80 81 82 83 84 85 86 87 88 89 90 91 92 93 94 95 96 97
year
Non-exempt Prescriptions (% of total)and charges, in £ real, 1980-97
charge
non-exempt
Figure 3
Nonexempt prescriptions: % of total number of prescriptions dispensed.
Real charges = nominal charges/ GDP deflator.

12
6 The symbols V and U in front of a variable indicate the author’s expected sign of thecoefficient of that variable, minus or plus respectively.
3. A Critical Review of UK Studies
In the UK’s primary health care under NHS increasing use is made of direct patient charges, such
as for dental checkups, sight tests and prescription drugs (see Office of Health Economics, 1999).
The increase in charges is expected to have similar effects in all three cases. However, most
studies concentrated on the analysis and effects of prescription charges, mostly because the data
are more detailed and of better quality. From the many published studies dealing with this issue
we present and evaluate the four most original and innovative in the application of estimation
techniques.
(1) Lavers: 1971-1982
Lavers (1989) studied the prescription charges of the time series period 1971-82. In his analysis
he set the three-equation model:
Demand Q = b0 + b1 P + b2 E + b3 Y + b4 Ps + b5 M (1)
Cost C = c1 + c2 P + c2 E + c3 Y + c4 M + c1 S (2)
Morbidity M = a 0 + a1 P + a2 E + a 3 Y + a4 B + a5 S (3)
where6:
� The Demand, Q, is the number (volume) of prescriptions subject to a charge and actually

13
dispensed. It depends on VP =price of prescription: charge/index of retail prices; VE=%
increase of consumers exempted from charges; UY= real income of the population; UPs
=relative price of substitute drugs; and UM =morbidity (=unhealthiness).
� The Average cost (to the NHS) of the items prescribed, C, which is not identical with the
charge. The cost depends on UP, UE, UY, UM and US =a seasonal factor, dummy=1 for
October-March.
� Morbidity is the number of employed certified sick and absent from work. It depends on
VP, VE, VY, US and UB =the level of sickness benefit paid to adults absent from work:
the higher the benefit, the more reported sick.
The Demand, Q, Cost, C, and Morbidity, M , are endogenous variables, the rest are exogenous.
The system of simultaneous equations (1), (2), (3) is recursive with Demand and Cost as
functions of Morbidity and different subsets of the exogenous variables, and Morbidity as a
function of a subset of the exogenous variables only. Therefore, if the error term in (1) and (2)
can be assumed to be uncorrelated with the M variable, the endogenous variables of the system
can be estimated sequentially by OLS.
Using monthly data for 1971-1982 and loglinear functional form, the results show that the
Demand, Q, depends on:
� Price, P, with elasticity -0.22;
� Morbidity, M, with elasticity 0.27;

14
7The most important influence on Morbidity, M, is the seasonal factor, S. Price, P, has nosignificant effects on Costs, C, in contrast to exceptions, E, and the growth of income, Y.
� and the increase in exceptions from charges, E, with elasticity -0.097;
� income, Y, and the relative price of substitutes, Ps, have no significant influence on
demand.
These results are based on the assumption that the structural model is recursive and that the
disturbances in the equations are serially independent. However, this assumption does not always
hold. As a consequence, the parameter values are not maximum-likelihood and their variances
are underestimated.
(2) O’Brien: 1969-86
In his analysis, O’ Brien ( 1989) uses time series of monthly observations of prescriptions both
subject to the charge and exempt of the period 1969-86. Starting from the notion of a consumer
investing in the stock of health (Grossman, 1972), the demand for prescription drug utilisation is
derived demand for health. Therefore, the demand for drugs has a negative own price elasticity
and a positive cross-price elasticity for substitutes (over-the-counter) drugs. The equations for
prescriptions subject to charges, Q, and exempted Qx, take the form:
Q = b0 + b1 Pq + b2 Y + b3 Ps+ b4 B + b5 WP + b6 S (4)
Qx = a0 + a1 Px + a2 Y + a3Ps + a4 B + a5 WP + a6 OP + a7 YP + a8 S (5)

15
where Q is the number (volume) of prescriptions subject to a charge and actually dispensed; and
Qx exempt prescriptions. The two demands depend on:
� VP =the price/charge for charged items Pq and exempt items Px ;
� UY= real income of the population;
� U Ps =relative price of substitute drugs;
� WP = the working population, %: U for Q, and V for Qx;
� UOP =old population, %;
� UYP =young population,%;
� S =monthly dummies.
Since the exempt and nonexempt prescriptions are for the same group of products, equations (4)
and (5) bear a closed conceptual relationship. Therefore, it is expected that their error terms are
correlated. Consequently, taking account of the correlation between equations, an appropriate
method of estimation is that of Seemingly Unrelated Regressions (SUR) for joint estimation of
the two-equation system using Generalised Least Squares (GLS). This method was applied to the
first-differences of the data to remove the observed first-order serial correlation. The results
provided cross-price elasticity of the substitutes + 0.22; and own price elasticity for the
nonexempt prescriptions: - 0.33, increasing to - 0.64 in the latest years. This suggests that
utilisation has become more responsible to increasing charges over time. The seasonal factors
confirm that the consumption rises in the cold months, mostly in January-March. Income has no
significant effect on the demand for drugs. The problem with the formulation of the model is that
the demand for drugs exempt from charges, equation (5), is assumed to depend positively on
price, the charge imposed on the nonexempt patients, and the estimation yielded a positive and

16
8 Studies of copayments have revealed an increase in related health care costs such asacute psychiatric services and institutionalisation in nursing homes for elderly people. Forexample, limiting the reimbursement of drug prescriptions for psychiatric patients in NewHampshire was estimated to cost 17 times more than it saved (Soumerai et al., 1994).
significant coefficient, with elasticity 0.17. But the explanation offered by the author, that this
reveals price discounts by pre-payment purchase and dispensing, is rather far fetched since only
6% of the exempt items benefitted from pre-payment purchase: O’Brien (1989) p. 113.
It is possible that the charges policy has detrimental effects on the NHS. The objective of
the policy is to raise additional revenue. However, reduced current utilisation of relatively low
cost prescriptions may have adverse health effects leading to higher future health costs for the
NHS. However, this point cannot be examined by these types of econometric analysis of
aggregate national data8.
(3) Hughes & McGuire: 1969-1992
In contrast to the two previous studies, Hughes and McGuire (1995) make use of a long-run
model based on annual data, because the changes in charges/price occur usually once a year. They
also take tests for and account of stationarity. Since the charge/price is determined exogenously
(by the NHS), a single equation model is adequate for the estimation. The analysis is applied to
the prescriptions which are subject to the charges (nonexempt). The utilisation function is
specified as:
U = f(P, Y, GP, Ps, M, T) (6)
where:

17
9That is, the data are generated by stochastic processes which are not fixed but time-variant with a mean level changing over time. Many economic nonstationary time series have theproperty that, if they are differenced one or more times, the resulting series will be stationary.
� U = utilisation per capita, i.e., the number of prescriptions subject to charges;
� VP =prescription charge;
� UY =income;
� Ps =index of pharmaceutical prices, as a proxy for Usubstitutes or Vcomplements;
� UM =morbidity rate;
� UGP =number of GPs per 100,000 of population to account for supply influences;
� T =time trend to capture influences not explicitly specified.
The equation was estimated in linear form. Testing for stationarity, they found that the variables
are variant with respect to time9 but integrated of order two, I(2). This property of the time series
data directed the researchers to estimate the relationship as an error correction dynamic model
with EC=error correction variable and � indicating second differences of the data:
�U = b0 + b1 � P - b2 �Y + b3 �GP + b4 � Ps + b5 �M + b6 ECt-1 + e (7)
The results of the estimation yielded the following conclusions:
� The short term elasticity with respect to price/copayment is - 0.32 and the long run -
0.37, with higher elasticity estimates for the latest years.
� The variable GP is not significant.
� Income, Y, and Morbidity, M, are both positive and significant, as expected.
� The coefficient of Ps is negative, indicating complementarity and not
18
substitutability. This is an unusual finding which cannot be explained satisfactorily.
The problem with these conclusions is that they are derived from a relatively small sample of 23
annual observations, reduced by differencing to 21. Therefore, the stationarity tests as well as the
estimated parameters must be deemed suspect.
(4) Smith and Watson: 1979-84 micro-data
Smith and Watson (1990) used a novel approach to modelling the utilisation of NHS
prescriptions. They employed micro-data which are available for individual households from the
UK Family Expenditure Survey (FES). The potential advantage of using this type of information
is that:
� It may be possible to distinguish more effectively the effect of price on utilisation from
the effects of other trend variables - unemployment, demographic changes, etc.;
� It allows investigation of the possibility that the effects of prescription charges may differ
across the population according to age, health condition etc.
However, the disadvantages of this approach are also serious, as for example:
� There is no way to distinguish whether a family does not buy the prescription because (i)
there is no patient in the family needing the drug or (ii) of the increase in charges.
� Since the observations are per family, while individuals are exempt or nonexempt from
prescription charges, it is not possible to study how the nonexempt group will react to an
increase in prescription charges.
19
� If a family pays for more than one prescriptions, there is no way to distinguish whether:
(i) a particular household member was sick more than once; (ii) more than one family
members were sick; or (iii) a particular member of the family was sick but needed more
than one kind of drug.
Despite these problems, one study used a Poisson regression model to fit the available data of a
sample of 42,091 households for the period 1979-84. During this period, prescription charges
were increased by 500% and the volume of prescriptions fell by 40%. The utilisation of
prescriptions, U, was regressed on three groups of variables:
i. composition of household: number of children, pensioners, exempt adults, other adults.
ii. pattern of sickness: number of individuals reported absent from work, the age of
household head, individuals receiving income supplement, seasonal factors.
iii. income and other characteristics of the household: level of income relative to poverty
line for exception from charges, dummy variables for occupation and economic
conditions, price of substitutes.
The result of the estimation provided own price coefficient significant and negative, giving for
the average household elasticity - 0.5. This seems to suggest that ‘the entire 40% fall in the
number of charged prescriptions issued and dispensed between 1979 and 1984 could be
accounted for by the approximately fivefold increase in the real level of the prescription charge’
(p. 91).
3. Some estimates
The studies we have reviewed suffer from several problems which make their estimates of the

20
demand for prescriptions in the UK suspect. However, the empirical evidence confirms that
increasing the prescription charges does decrease the number of chargeable items dispensed. The
range of estimated elasticities yielded is rather wide, from -0.22 to -0.50 (increasing to -0.64 in
later years), but two of the studies have reached an almost identical, and from an economic theory
viewpoint, a reasonable middling value of about -0.35. Using these elasticity values as a base, we
arrive at the following calculations:
� In 1997, a total of 454.3 million prescriptions were dispensed in the UK of which
46.7 million were chargeable at £5.65 per item, bringing a revenue of £263.9 million
to the NHS.
� The total NHS expenditure for prescriptions in 1997 was £5,448 million at current
prices. Therefore, the revenue generated by the charges was 4.8% of the total NHS
expenditure for prescriptions.
� A 10% increase in prescription charges would raise the copayment to about £6.20
per item.
� Therefore, other things being equal, the increase in the charge would reduce the
number of dispensed chargeable prescriptions by (46.7x0.35) = 1.6 million
prescriptions, leaving 46.7-1.6=45.1 million of nonexempt prescriptions. The revenue
from these prescriptions will be: 45.1x£6.20=£279.62 million, i.e a net increase of
£279.62-£263.9=£15.82 million.
� Therefore, the increase in prescription charges will raise the revenue generated from
4.8% of the NHS total expenditure on drugs (£5,448 million in 1997) to 5.1%.
� If the elasticity of demand for prescriptions is zero, as the Government seems to

21
believe, then the revenue generated by the increase in charges would be 5.3% of the
total, that is by 0.2 percentage points higher than under the -0.35 average elasticity.
This certainly is a very small increase in revenue both in absolute terms and as
contribution to total NHS expenditure on drugs.
� But it is also possible that the increase in charges may increase the price of over-the-
counter substitutes, reducing their purchases by patients.
� Some patients who are deterred from utilising drugs by the increase in the charge
and the increase in the price of substitutes may develop more serious conditions the
cost of which would fall on the NHS.
� Therefore, although the exact overall welfare effect of the increase in charges is
difficult to calculate, it may very well be negative.
4. Conclusions
Prescription charges have an inverse effect on the demand for drugs by patients liable to pay the
charge. Increases in charges are associated with a significant reduction in utilisation of prescribed
drugs among nonexempt patients. The often cited rationale for the charges policy is to raise
additional funds for the NHS, from those patients able to pay more, to offset partially the cost of
the service. However, there is also evidence that the short-term target of using charges to raise
revenue is pursued at the expense of the long-term health of persons, and this may cost more to
the NHS than the increase in revenue. Therefore, the introduction of copayments is not an
efficient policy.

22
References
Beck, R. G. (1974), “The effects of co-payments on the poor”, Journal of Human Resources, 9,
129-142.
Hughes, D. and McGuire, A. (1995), “Patient charges and the utilisation of NHS prescription
medicines: some estimates using a cointegration procedure”, Health Economics, 4, 213-
220.
Lavers, R., J. (1989), “Prescription charges, the demand for prescriptions and morbidity”, Applied
Economics, 21, 1043-1052.
O’Brien, B. (1989), “The effect of patient charges on the utilisation of prescription medicines”,
Journal of Health Economics, 8, 109-132.
Office of Health Economics (1999), Compendium of Health Statistics, 11, Edition, London.
Reeder, C. E. and Nelson, A. A. (1985), “The differential Impact of Copayment on drug use in a
Medicaid population”, Inquiry, 22, 396-403.
Smith, S. and Watson, S. (1990), “Modelling the effect of prescription charge rises”, Fiscal
Studies, 11, 75-95.
Soumerai, S. B., McLaughlin, T. J., Ross-Degnan, D., Casteris, C. S., Bollini, P. (1994), “Effects
of limiting Medicaid drug-reimbursement benefits on the use of psychotropic agents and
acute mental health services by patients with schizophrenia”, New England Journal of
Medicine, 331, 650-655.