Embed Size (px)
Citation preview
Working Papers in EconomicsDepartment of Economics, Rensselaer Polytechnic Institute, 110 8th Street, Troy, NY, 12180-3590, USA. Tel: +1-518-276-6387; Fax: +1-518-276-2235; URL: http://www.rpi.edu/dept/economics/; E-Mail: [email protected]
The Influence of Federal Laboratory R&D on Industrial
Research
James D. AdamsRensselaer Polytechnic Institute and NBER
Eric P. ChiangNew Mexico State University
Jeffrey L. JensenNew York University
Number 0301
October 2003
___________________________________________________________________________For more information and to browse and download further Rensselaer Working Papers in Economics, please visit:http://www.rpi.edu/dept/economics/www/workingpapers/
The Influence of Federal Laboratory R&DOn Industrial Research*
By
James D. AdamsRensselaer Polytechnic Institute and NBER
Eric P. ChiangNew Mexico State University
Jeffrey L. JensenNew York University
JEL Codes: O31, O33, O38 and C25
Address of corresponding author: James D. Adams, Department of Economics, Rensselaer Polytechnic Institute,3406 Sage Laboratory, 110 8th Street, Troy, NY 12180-3590. Telephone: 1-518-276-2523, fax: 1-518-276-2235, e-mail: [email protected]
* This research was supported by NSF grant SBR-9502968 and carried out while Adams was at University ofFlorida and Chiang at New Mexico State University. We thank the editor (Robert Pindyck) and a referee, as well asChunrong Ai, Gary Becker, Maryann Feldman, Adam Jaffe, David Mowery, Ariel Pakes, Sam Peltzman and GeertRidder for comments. This paper benefited from presentations at Central Florida, Chicago, Florida, Johns Hopkins,Minnesota, and Oslo, as well as NBER. Eleanora Voelkel, Meg Fernando, and Richard Anderson administered theSurvey of Industrial Laboratory Technologies 1996 and Katara Starkey administered the Survey of GovernmentLaboratory R&D 1998 that yielded most of the data used in this paper. Within the federal government we thankKaren Azzaro, Mark Boroush, Margaret Brautigam, Richard Burrow, Carol Carlson, Shelly Ford, Ronald Meeks,Robert Rohde, and Sallie Sherertz for information relating to federal laboratories. Of course, any remaining errorsare our responsibility.
3
Abstract
This paper studies the influence of R&D in the federal laboratory system, the world’s largest, on firm
research. Our results are based on a sample of 220 industrial research laboratories that work with a variety of
federal laboratories and agencies and are owned by 115 firms in the chemicals, machinery, electrical equipment, and
motor vehicles industries. Using an indicator of their importance to R&D managers, we find that Cooperative
Research and Development Agreements or CRADAs dominate other channels of technology transfer from federal
laboratories to firms. With a CRADA industry laboratories patent more, spend more on company-financed R&D,
and devote more resources to their federal counterparts. Without this influence patenting stays about the same, and
only federally funded R&D increases, mostly because of government support.
The Stevenson-Wydler Act and amendments during the 1980s introduced CRADAs, which legally bind
federal laboratories and firms together in joint research. In theory the agreements could capitalize on
complementarities between public and private research. Our results support this perspective and suggest that
CRADAs may be more beneficial to firms than other interactions with federal laboratories, precisely because of the
mutual effort that they demand from both parties.
I. Introduction
Since World War II the United States has constructed the world’s largest system of government
laboratories. In 1995 laboratory research amounted to 26 billion dollars, or 14% of U.S. Research and Development
(R&D), a sum greater than all of university R&D and the R&D of many countries. Laboratory R&D includes
defense, energy, pollution abatement, mathematics, computer science, astronomy, physics, molecular biology and
genetics; the treatment of disease, improvement of the system of measures, and much else besides. Even this
understates the influence of the laboratories, given their support of research in universities and firms1.
In this paper we examine the channels by which federal laboratory R&D could affect research efforts of
industrial firms. We examine many different channels, including contractor relationships, use of federal laboratory
facilities, patent licensing, cooperative research agreements, movements of scientists and engineers, and several
others. But of all these possibilities it is cooperative agreements or CRADAs that are the most telling for firm R&D
and patents.
The literature on federal laboratory R&D is not extensive. Most of it concentrates on recent
commercialization efforts associated with the National Laboratories run by the Department of Energy. Markusen
and Oden (1996) conduct case studies of spin-offs from Los Alamos and Sandia Laboratories in New Mexico. They
find that spin-offs are less than firms or universities of similar size. The shortfall is attributed to personnel policies,
absence of incentives, and geographic isolation. Still, Markusen and Oden find that the laboratories have advantages
as business incubators, which include their unique technologies, the training of their scientists and engineers, and the
skill of their machinists and other workers.
Cohen and Noll (1996) discuss the future of the National Laboratories after the Cold War. They argue that
cuts in defense research must lead to cuts in civilian research in the laboratories, owing to complementarities
between the two kinds of research. Cohen and Noll also suggest that CRADAs cannot solve the problem of
declining budgets because of inherent political conflicts over the distribution of laboratory support that accompany
CRADAs, despite the value of laboratory expertise for the success of the agreements.
1 For more on the size of the federal laboratories, see National Science Board (1998). Table 4-3, p. A-121 includesstatistics on R&D in federal laboratories and other sectors. Table 4-7, p. A-125 includes statistics on basic researchperformed in federal laboratories and other sectors. Basic research, defined as research designed to gainunderstanding without specific applications, accounts for an important share of federal laboratory research. In 1995basic research contributed 67% of university R&D, 23% of federal laboratory R&D, and 4% of industrial R&D.
2
Ham and Mowery (1998) describe five case studies of CRADAs signed by the Lawrence Livermore
National Laboratory. They advise that to be successful CRADAs should include: (a) incentives that ensure
commitment; (b) awareness by laboratory researchers of the needs of firms; (c) laboratory flexibility that reduces
missteps in project execution; and (d) selection of CRADAs that are consistent with capabilities of the laboratory.
And while some CRADAs were unsuccessful, most of the firms felt that the laboratory brought useful competencies
to their projects.
Jaffe and Lerner (2001) analyze patents by Department of Energy Laboratories, citations to the patents, and
the formation of CRADAs. Their findings include that laboratory patents have increased over time and have
reached parity per dollar of R&D with those of universities; that citations per laboratory patent have stayed about the
same, suggesting that patent quality has not fallen in spite of the increase in patents; and that successful patenting
requires that a laboratory remain focused on its area of competence, preferably in applied research. Similar to
patents, CRADAs are likely to be formed when the laboratories emphasize applied research, suggesting that applied
laboratories possess technologies that are close to commercialization.
The various studies agree that federal laboratories could in some circumstances contribute to industrial
projects. But all of the studies find that weak incentives, geographic isolation and political quarrels have interfered
with these contributions. Nevertheless, Jaffe and Lerner (2001) find that dissemination of laboratory technologies
has risen and suggest that changes in technology transfer policy may have contributed to this increase.
With this justly skeptical literature as background, we approach the subject of federal laboratory impacts
with caution. Our goal is simply to examine the influence of federal laboratory R&D on industrial laboratory
patents and R&D. In support of this goal, as noted, our data provide alternative channels by which federal
laboratories affect industrial research. Since industrial laboratories are in the forefront of interactions between firms
and federal laboratories, our evidence relates to early stages of this contact, before any effects on product markets
have occurred (Klette, Moen, and Griliches, 2000). Given that new technology transfer policies have been in place
for a decade or so, R&D laboratories are likely places to look for their effects.
As is nearly always the case in empirical research, the data used in this paper have their limitations. Since
the data are at the level of R&D laboratories within firms, this implies that firm level information matches very
imperfectly with our data on industrial laboratories. Clearly it is desirable to have continuous indicators of
contractor relationships, cooperative research agreements, and patents licensed that would complement our mostly
3
dichotomous indicators of interactions with federal laboratories. But these data are not publicly available2. For these
reasons we rely on our survey evidence, turning to external data as circumstances permit.
From one perspective the concerns of this paper relate to the appropriate limits of organizations, including
that assignment of intellectual property that is most likely to promote innovation. For in licensing patents from
federal R&D or in undertaking cooperative agreements where commercial rights to any resulting innovations are
given to firms, the government sets a limit to its own authority, assigns intellectual property away from itself, and to
that extent privatizes R&D. From another perspective, as we discuss below, the results of this paper suggest that
recent efforts may have increased joint research between the federal laboratories and industry and complemented
other efforts to commercialize inventions from publicly funded research.
Results from the investigation are the following. First, the influence of the federal laboratories on
industrial patenting and R&D depends on the channel of interaction. In head-to-head comparisons of CRADA
indicators with alternative channels of federal laboratory effects, we find that CRADAs are the principal means by
which federal laboratories influence patenting and company-financed R&D of industrial laboratories. Since
CRADAs are agreements that require cost sharing, a close connection to capabilities of the laboratories, and ongoing
commitment to be successful (Ham and Mowery, 1998), this suggests that intensive interaction is needed for
government laboratories to have an effect. Second, government contractor interactions have little or no effect on
industrial patents and company-financed R&D. In contrast CRADAs increase patents, usually with significance,
and increase company-financed as well as publicly funded R&D.
The rest of the paper consists of seven sections. Section II describes trends in technology transfer by the
federal government since 1980. Section III reviews the literature on property rights economics and models the
CRADA arrangement in light of this literature. Section IV describes the data used in this paper. Section V
considers the effects of federal laboratories on industrial patents, while section VI presents estimates of a two-
equation model of the effect of CRADAs on patents that takes determinants of CRADAs into account. Section VII
explores the federal laboratory impact on R&D effort, while section VIII is a summary and conclusion.
2 Our requests for firm and laboratory level data on CRADAs were repeatedly declined by various agencies. Theindustrial laboratories in our sample deal with federal laboratories in the Departments of Agriculture, Commerce,Defense, and Energy, as well as the National Institutes of Health, the National Aeronautics and SpaceAdministration, and the Bureau of Mines (now closed). This makes the data collection problem that much moredifficult.
4
II. Federal Technology Transfer Policy Since 1980
The history of the federal laboratories falls into two periods. From 1940 to 1980 the laboratories engaged in
internal research and supported research in firms and universities, but were not formally required to commercialize
technology3. Starting with 1980 commercialization became paramount. Three developments seem to have
contributed to this change in policy. First, the end of the Cold War suggested that downsizing of the laboratories
was near. Technology transfer offered a “peace dividend” but also the chance to protect laboratory budgets (Cohen
and Noll, 1996). Second, productivity growth declined over a twenty-year period beginning in the early 1970s, and
the decline appeared to be permanent (Krugman, 1994). Policy makers viewed technology transfer from federal
laboratories and universities as a means of restoring growth. Third, the privatization movement (Shleifer, 1998)
advocated the sharing of federal technologies with firms in order to make the most out of publicly funded research.
Thus legislation since 1980 has promoted technology transfer between federal laboratories and industry.
The Stevenson-Wydler Technology Innovation Act of 1980 made technology transfer a mission of all federal
laboratories. The Bayh-Dole Act of 1980 gave title to inventions resulting from federal funding to performers of the
R&D. From the special standpoint of the federal laboratory system, Bayh-Dole transferred intellectual property to
contractors operating Federally Funded Research and Development Centers. Stevenson-Wydler and Bayh-Dole are
complementary pieces of legislation whose goal is to promote commercialization of federally funded R&D.
Stevenson-Wydler grants title to patents that result from collaboration with the federal government but involve no
direct support from government. Bayh-Dole transfers title to parties who did receive support and whose inventions
derived from that support, and enables the licensing of patents that are government-owned4.
Additional legislation clarified the treatment of intellectual property derived from collaborative
agreements5. The Federal Technology Transfer Act of 1986 gave incentives to Government Owned and
Government Operated laboratories (GOGOs) to commercialize their inventions. The act established a budgetary
3 Mowery and Rosenberg (1998) document federal programs during 1940-1980 that generated large benefits to theU.S. economy in computers, aircraft, instruments, and electronics, some of them involving the federal laboratories.4 For a good discussion of the Bayh-Dole and Stevenson-Wydler Acts, see Schacht (2000).5 The National Aeronautics and Space Administration (NASA) was the first federal agency to implement jointresearch agreements. The Space Act of 1958 allowed NASA to assign intellectual property to collaborating firmsand these agreements are known as Space Act Agreements, or SAAs. See NASA (2001) for details.
5
function for Cooperative Research and Development Agreements (CRADAs), annual reviews of CRADAs by the
agencies, and set-asides for the agreements. The National Competitiveness Technology Transfer Act of 1989
extended similar rules to Government Owned and Contractor Operated laboratories (GOCOs). Together the two
kinds of laboratories account for most of the R&D conducted in the government.
Other legislation relaxed the application of antitrust to jointly conducted R&D. The National Cooperative
R&D Act of 1984 sheltered R&D joint ventures from antitrust action. The National Cooperative Research and
Production Act of 1993 extended this protection to joint production of new products arising from R&D joint
ventures. Both laws could contribute to technology transfer from federal laboratories to industry. With antitrust
protection alliances of firms are allowed to share the benefits from working with federal laboratories. Still, changes
in the treatment of cooperative R&D have not fully addressed the problem of creating winners and losers through
federal technology transfer (Cohen and Noll, 1996).
It is important to see that there are many channels of technology transfer from the federal laboratories.
Formal channels include issuance of patents; exclusive and non-exclusive patent licenses; and CRADAs. Less
formally, technology transfer can occur through spin-offs and movements of laboratory scientists to industry and
through meetings between laboratory and industrial researchers. The flat profile of laboratory funding and the
growth of industrial research since 1987 (U.S. Department of Commerce, 2000) have contributed to outplacement of
laboratory scientists. And besides, the Federal Technology Transfer and National Competitiveness Acts have
encouraged the laboratories to seek industrial partners. Although evidence on mobility from federal laboratories to
firms is scarce, it is likely to have increased in recent years. A study by Feldman (2001) traces the movement of
laboratory employees into new firms in the U.S. Capitol region, which has increased partly as a result of policy
decisions, including the decline of federal funding in natural science and engineering since the early 1990s (National
Research Council, 2001).
The nature of technology transfer varies considerably, including by agency. For example, patent licenses
can be exclusive or non-exclusive. The National Institutes of Health (NIH) favor non-exclusive licenses for
biological molecules discovered with public funds. NIH also grants non-exclusive licenses under its Materials
Transfer Agreements (NIH, 2001). Other agencies such as the Department of Energy (DOE) are more inclined to
grant exclusive licenses in order to encourage commercialization.
6
CRADAs also vary widely. Besides involving one or many firms, contributions by federal laboratories and
firms depend on the facts of each case. While CRADAs rule out direct grants (Schacht, 2000), in-kind federal
support ranges from half of a project’s funding to “funds-in” CRADAs, where firms provide all the funding.
III. Technology Transfer Policy and Property Rights Economics
A. Review of the Property Rights Literature
In this section we review the Property Rights Economics (PRE) literature and draw inferences for recent
technology transfer policy, especially CRADAs. Grossman and Hart (1986) construct a theory of the costs and
benefits of integration. In their theory integration consists of common ownership of physical assets. The key
assumption in their work is that contractual relationships cannot be specified in advance, either because of a large
number of contingencies or because investments cannot be verified. Investment decisions are central to the model
and lead production decisions, and neither they nor the benefits that follow are contractible. The decision whether
or not to integrate, and the decision as to which party should own the assets, depend on which particular
arrangement supplies investment incentives that are closest to first-best6. They show that non-integration is closest
to first-best if investments by both parties are important and if benefits of each party and thus incentives are
independent of production decisions by the other. Control by one of the parties is best if that party’s investment is
the more important and if benefits of the other party are independent of its production decisions.
Aghion and Tirole (1994) extend PRE to the question of whether a customer or a research unit should own
an innovation. The allocation of the property right is determined by two factors. First, the property right should be
awarded to the party whose value of marginal product is the larger. The logic is that of Grossman and Hart:
ownership incentives are scarce and should go to the party whose investment is more important to realizing the
benefits from an innovation. Second, the allocation of the property right is always efficient when the research unit
has the bargaining power, because the research unit can sell the innovation to the customer. However, allocation of
the property right to the customer can be inefficient if the research unit is cash-constrained. In that event the
6 None of the ownership arrangements are optimal. This is because the first order condition for investment places aweight of _ on the first best marginal benefit and _ on the non-cooperative default marginal benefit (assuming equalsharing of benefits). Thus the allocation of property rights is important because it establishes default payoffs toinvestment and bargaining power. An allocation that assigns ownership to the party whose marginal product islarger generates first order conditions closer to first best for that party but moves away from first best for the other.Thus incentives are subject to a tradeoff. See Holmstrom and Roberts (1998) for a review and critique.
7
research unit cannot buy the innovation from the customer, even if that increases its social value.
Hart, Shleifer and Vishny (1997) apply PRE to the problem of whether government should undertake or
contract out an activity. One restriction that they impose, which is not perfectly general, is that government
employees and contractors are substitutes and not complements. Contractors can allocate effort to product
innovation or to cost saving, but cost saving may detract from product quality. Private contractors have more
powerful incentives to bring about innovations than government employees because private ownership gives more
benefits to the contractor. But contractors may ignore erosion of product quality unless competed against or
sanctioned by the loss of contracts. Public ownership dominates contracting when product quality undergoes severe
deterioration, though competition and repeat contracting limit the empirical relevance of this issue (Shleifer, 1998).
Now consider the relevance of PRE to technology transfer. First, the assignment of patents from federally
funded inventions under Bayh-Dole has increased payoffs to firms, in part through university licensing (Jensen and
Thursby, 2001). But firms are the entities most able to commercialize. Thus Bayh-Dole illustrates the appropriate
assignment of ownership and incentives to one party, a firm. The other party, the government, does not change its
research when property is reassigned (Grossman and Hart, 1986). Second, the Stevenson-Wydler Act and its
amendments share intellectual property from public-private collaborations. Firms and federal laboratories provide
complementary inputs under CRADAs (Mowery and Ham, 1998). In this case PRE suggests sharing of incentives
since both parties’ investments are important (Grossman and Hart, 1986; Aghion and Tirole, 1994). Consistent with
this view, firms gain from commercialization while the government gains from use of innovations free of royalties.
B. Property Rights Economics Interpretation of CRADAs
Since CRADAs figure prominently in our empirical results we provide an analysis of them in the spirit of
PRE. This analysis gives CRADAs the benefit of the doubt and assigns them a productive function. An alternative
view is one of political exchange, in which winning a CRADA secures future procurement contracts. Thus patents
and private R&D that are attributed to CRADAs could reflect procurement, and conversely some procurement could
be due to CRADAs. However, we find rather weak evidence for these hypotheses below.
Let E and e stand for R&D effort of a federal laboratory and firm that are devoted to a particular
innovation, and assume that neither R&D is contractible. Since both parties are risk-neutral the laboratory cares
only about the expected value of the innovation VG in the public sector, indicated by subscript G, and the firm cares
only about the expected value VP in the private sector, indicated by subscript P. We also assume that if the
8
laboratory and firm do not cooperate, then each party can make limited progress in its own sector. Thus the
laboratory can generate a value of BG (E) and the firm can create a value of BP (e). CRADAs improve on this status
quo by legally permitting the parties to conduct joint research. We assume that joint research generates incremental
values Ij (E, e), j=G, P. It follows that the value of the innovation given cooperation is
(1)( ) ( )( ) ( )eEIeBV
eEIEBV
PPP
GGG
,
,
+=+=
The value functions have the following properties. The base values jB are concave: 0>′jB , 0<′′jB , j=G, P. In
addition the incremental values ( )eEI j , are increasing in E and e, so that 01 >jI , 02 >jI , where subscripts 1 and 2
indicate partial derivatives with respect to E and e. The incremental value functions are also concave, so 011 <jI ,
022 <jI , and 02122211 >− jjj III . And since E and e are complements it follows that 012 >jI . We strengthen the
role of complementarity between public and private research somewhat further, by requiring that positive
incremental value requires positive E and e: ( ) ( ) ( ) 00,00,,0 === jjj IEIeI .
The base values GB and PB are status quo bargaining points, while PG II + is the social surplus from joint
research. The net social value of the innovation with joint research is eEIIBBeEVV PGPGPG −−+++=−−+ .
In the classic renegotiation phase the two parties split the social surplus 50:50 and maximize their private net gains
on this basis. The gain for the federal laboratory is then ( ) EIIB PGG −++21 , while the gain for the firm is
( ) eIIB PGP −++21 . First order conditions for laboratory and firm are thus
(2) ( )( ) 1
1
2221
1121
=++′
=++′
PGP
PGG
IIB
IIB
Equation (2) yields the solution EE ˆ= and ee ˆ= . However, it may be possible to improve on (2) using contracts that
more closely resemble CRADAs. Assume that 11 PG II > and 22 PG II < for any positive E and e, so that
government laboratories have an absolute as well as comparative advantage in creating public sector value
( 11 PG II > ) while firms enjoy an advantage in the private sector ( 22 PG II < ). In effect, each party knows its own
business best. Given these assumptions about the laboratory and firm we can show that both parties will receive
larger benefits and do more R&D if 100 percent of the public sector value goes to the federal laboratory and 100
percent of the private sector value goes to the firm, like the split property rights analysis of Aghion and Tirole
9
(1994). According to this division of the rewards, net gains for laboratory and firm are EIB GG −+ and
eIB PP −+ . Then the first order conditions for R&D are
(3) 1
1
2
1
=+′=+′
PP
GG
IB
IB
Equation (3) yields the solution EE~= and ee ~= . It is easy to show that if knowing one’s own business is best, then
R&D increases under (3) compared with (2), so that EE ˆ~ > and ee ˆ~ > . Since in that event 11 PG II > , it follows that
( )1121
1 PGG III +> . Likewise 22 PG II < for all positive E and e implies ( )2221
2 PGP III +> . Thus at the same E
and e that satisfy (2), 1 and 1 21 >+′>+′ PPGG IBIB . E must then increase. First, holding e constant, 1 and GG IB′
decrease in E, so that E must increase to restore the first equation in (3). Second, an increase in e increases 1GI ,
since 012 >jI , and implies a further increase in E. The analysis of e is similar.
We can add to the above interpretation an explanation of “funds-in” CRADAs, where companies pay all the
cost of the government’s research as well as their own7. Assume that private sector benefits to firms from joint
research greatly exceed public sector benefits to federal laboratories. In this setting firms can increase R&D by
federal laboratories by paying the marginal cost of the government’s research. By this means the firm secures an
increase in E as well as the private benefit PI , moving both to a level that is closer to first-best.
IV. Description of the Data
Having reviewed the literatures of federal technology transfer and Property Rights Economics, we turn now
to the empirical analysis. Most of the data used in this paper derive from two surveys. A 1996-1997 survey of
industrial laboratories collected data on R&D, patents, and the nature of laboratory contacts with other R&D
performers. These include two types of interactions with federal laboratories. First, industrial laboratories were
asked to rank an array of interactions with federal laboratories on a scale of 1 to 5 in order of increasing importance.
Second and conditional on some interaction, the industrial laboratories were asked to cite particular federal
laboratories that were influential for their research.
7 The well-known Extreme Ultraviolet Lithography CRADA is an example of a funds-in CRADA in which partnerfirms—Intel, Advanced Micro Devices, Motorola, and IBM—paid all the costs of the research. The resultinginvention successfully uses hard ultraviolet light to increase the density of transistors on computer chips (see“Extreme Measures,” The Economist, June 23, 2001).
10
A 1998 survey collected data on intramural or on-site R&D carried out in federally funded
laboratories—the same that are cited by the industrial laboratories in the 1996 survey8. The follow-up survey was
necessary because there is no comprehensive, published source of information on the R&D of federal laboratories.
A. Survey of Industrial Laboratory Technologies 1996
The industrial laboratory survey collected R&D budgets, company and publicly financed shares of R&D
and detailed information on the channels and sources of federal laboratory spillovers relevant to the laboratories.
First we randomly selected 200 companies from a population of 500 firms in the chemicals, machinery, electrical
equipment, and motor vehicle industries. Firms in the target population had to be included in Standard and Poor ’s
1995 Compustat database, had to report R&D and sales, and had to name-match assignees in the U.S. Patent and
Trademark Office (USPTO) database. Thus, the population consisted of publicly traded, high technology firms in
the four industries whose size, R&D intensity, and patents were known. Motor vehicle firms were deliberately over-
sampled compared with other industries because of response-rate concerns. Partly as a result of this over-sampling
our combined sample contains firms that are larger than firms in the population. A response bias analysis, however,
finds no significant difference between sample means and population means for firm sales, R&D, or R&D intensity9.
The 200 firms owned about 600 laboratories whose address information was taken from the Directory of
American Research and Technology (R.R. Bowker, 1997)10. Responses to the survey include 208 laboratory
observations from 115 responding firms. The 208 observations actually account for 220 laboratories because three
of the firms responded at the corporate level. Thus, the implied response rate was 37% (220/600). Of the 116 firms,
29 were publicly traded for less than 16 years in 1996, so that young companies as well as old form an important
part of the sample. Respondents were R&D managers with considerable knowledge of their firms. They were in
industrial research for an average of 17 years and with their firms for an average of 15 years.
One could ask whether the laboratories in our sample accurately represent R&D in their companies. It is
quite hard to answer this question because information on the laboratories forms an element of corporate strategy
8 On-site federal laboratory R&D is the preferred measure, since the laboratories spend the rest of their R&D oncontractors, opening up the possibility of double counting in R&D budgets of contractors and federal labs.9 Survey firms reported an average of $211.1 million of R&D and $4523.2 million in sales in Compustat.Population firms reported an average of $114.6 million in R&D and $2274.6 million in sales. Two sample t-tests ofthe difference in means of R&D and sales (assuming unequal variances) were 1.43 and 1.48 respectively and thuswere insignificant. Likewise R&D intensities were similar, 0.047 for the sample and 0.050 for the population.
11
and as a result is proprietary. In addition there are issues of comparability between R&D in Compustat and the
survey. Compustat R&D is influenced by R&D tax credits and may include non-R&D portions of the R&D budget,
while R&D in the survey is careful to exclude all overhead and non-R&D charges11. For this reason we simply say
that the data represent a sample of laboratories taken from the sample of firms. This statement reflects the reality of
research groups operating within firms and the two-stage nature of data collection in this area.
Table 1 shows the distribution of firms and laboratories by industry. The distribution is uniform except for
smaller numbers in motor vehicles that correspond to the greater degree of concentration in this industry. Response
rates are roughly equal across industries. Notice that numbers of laboratories in table1 are upper bounds on the
observations for each year’s worth of data in the regression tables, since missing values are ignored.
Table 2 displays size characteristics of the R&D laboratories classified by their connection to federal
laboratories. Since the data were cover 1991 and 1996 we are averaging over the two years as well as laboratories
in these calculations. The top panel shows R&D inputs: the number of scientists and engineers, number of Ph.D. or
MD researchers and laboratory R&D budget in millions of 1987 dollars12. The bottom panel shows R&D outputs
measured by the number of patents issued. Table 2 reports two measures of patents. The first is patents granted in
1991 and 1996 as reported in the survey. Not all laboratories report their patents. Thus the second measure of
patents replaces missing patents with an estimate for the firm, laboratory location, and year. Imputed patents derive
from the U.S. Patent and Trademark Office and were downloaded from the U.S. Patents Database (Community of
Science, 1999). The method for obtaining the estimate is this. We match two-digit zip codes to the addresses of all
inventors for a company using the zip code database of the U.S. postal service. Next we assign all patents of the
parent firm to the location if the inventor’s zip code matches the zip code of the laboratory. Finally we assign
patents to years 1991 and 1996 according to their issue dates13. We call this result, augmented patents.
The imputation method is the best we could devise and yet it contains errors. Inventors may live in a
different zip code and state than the laboratory and their patents are ignored by our method. Patents can include
10 The survey instrument was refined in three stages. A retired R&D manager read and critiqued the initial draft.Then a beta version was tested on 10 nearby laboratories. Using these comments a final draft was produced. Thesurvey team then mailed the survey to all laboratories that granted permission to send the instrument.11 In two case studies that we have conducted we find that, based on information provided by R&D executives, theR&D budget of the central research laboratory was approximately one-tenth of Compustat R&D.12 R&D in the laboratory survey tries to follow NSF definitions. However, R&D in the survey data is net ofoverhead expenses and non-R&D charges, and for this reason may be a leaner concept than in some other data.13 We thank Meg Fernando for downloading the patent data from the Community of Science web site and fortranslating the text fields into SASTM for further analysis.
12
multiple inventors in the same firm who cluster in different zip codes, and worse, in the same zip code. Both cases
over-count the firm’s patents. We handle the first problem by multiplying patents by the fraction of the top four
inventors on the patent that are in the same two-digit zip code as the laboratory. We deal with the second problem,
of clustering of the firm’s laboratories in the same zip code, by apportioning the total number of patents of the
different laboratories according to each laboratory’s share in total scientists and engineers for the firm and location.
Table 2 shows that larger industrial laboratories are more likely to be associated with federal laboratories.
Affiliated laboratories employ three times as many scientists, nearly seven times as many Ph.D. or MD researchers,
and do more than twice as much on R&D as other laboratories. Patents issued by laboratories that are associated
with government are also more than twice as large. Given the role of size in the selection process for government
affiliation we are careful to control for laboratory size in the regressions reported below.
The survey measures ten interactions between industrial and federal laboratories. Table 3 describes these
and reports the percent of industrial laboratories rating each interaction as important. Not all imply technology
transfer. Government contractors manufacture products to specification but need not be engaged in product
development. Likewise SBIR awards finance small projects in universities and startups but do not provide the
projects. Use of test facilities, outflows of scientists to government laboratories, and outflows of ideas to
government laboratories do not necessarily imply technology transfer from the government.
Five of the interactions do suggest technology transfer. These are licensing of government patents,
involvement in CRADAs, inflows of scientists from government laboratories, inflows of ideas from government
laboratories, and use of industry-government technology transfer centers. We mark these accordingly in table 3 and
examine their distribution in table 4. Fifty-eight percent of laboratories rank none of the technology transfer
indicators as important. The distribution of the number of indicators is essentially flat among the remaining 42
percent. This suggests that multiple channels of communication contribute to technology transfer.
For the empirical work we code each of the interactions as dummy variables equal to 1 if the private
laboratories rated an interaction as important, and 0 otherwise. For some purposes we sum across dummy variables
coding for technology transfer, or we recode the individual indicators to show technology transfer of a certain kind.
In the case of CRADA, which turns out to be an important variable, we do not have the number and value of the
agreements in each year because the data are not publicly available. Instead we have a dummy variable that
measures the importance of CRADAs to R&D managers. This scale-free, time-invariant measure prevents us from
13
including fixed effects in our econometrics. However, it has the advantage that it pertains to individual laboratories
within firms and indicates whether CRADA and other interactions are important in the opinion of R&D managers.
B. Survey of Government Laboratory R&D 1998
Contingent on some interaction, the industrial laboratories in the 1996 survey were asked to write down
particular federal laboratories that were significant for their research. The result was a name and address list of
federal laboratories14. Using this information we identified laboratories by federal agency using U.S. General
Accounting Office (1996). Large numbers were in DOE and Department of Defense (DOD) with lesser numbers in
NASA and the Departments of Commerce, Health and Human Services (HHS), and others. In six cases respondents
cited non-profit laboratories that were funded by government, which we call federally funded R&D laboratories.
Given this list we sought to construct spillovers of R&D from published data on the federal laboratories in
order to test a simple model of public-private interactions. The idea is that larger pools should represent a larger
source of knowledge than smaller pools and automatically transmit more knowledge to the industrial laboratories15.
The chief alternative to this view is that knowledge spills over when a firm devotes resources to making the
knowledge spill over (Cohen and Levinthal, 1989). This second argument suggests that the firm is interested in the
small part of federal research that is opened up by research collaboration.
We need at least three pieces of evidence to test the hypothesis that larger laboratories provide larger
spillovers. These are (1) a history of federal laboratory R&D that begins at least a decade before the survey data, in
order to compute a partial R&D stock. In addition we require (2) data on on-site or intramural R&D, which is
distinct from contracts and grants and avoids double counting in the budgets of private and federal laboratories.
Finally (3), we would like data on research divisions in a laboratory to capture diversity of R&D within federal
laboratories and serve as a real deflator of that R&D16. However, we were unable to construct the spillovers. Only
DOD consistently has this information (Defense Technical Information Center, various years).
We lacked data on spillovers for most government laboratories except for DOD and a few exceptions in
National Science Foundation (various years). With the sole purpose of constructing spillovers of government
14 Our respondents cite 69 federal laboratories located in the Department of Energy, Department of Defense,National Aeronautics and Space Administration, Department of Commerce, National Institutes of Health,Department of Agriculture, and the now defunct Bureau of Mines. This is likely to be an undercount though,because some of our laboratories regarded this information as proprietary.15 See Cockburn and Henderson (1996), Ham and Mowery (1998), and Adams (2002) for a critique of this view.
14
laboratory R&D we conducted the Survey of Government Laboratory R&D 1998 (Adams, 1998). This survey
polled chief financial officers (CFOs) of non-DOD federal laboratories and had a response rate of 97%17.
Inevitably, the data on R&D of federal laboratories contain measurement error. Respondent error by
industrial laboratories is probably the most important since citations refer to all of a federal laboratory rather than
the “sending” division. In addition agencies aggregate differently and this leads to more errors. Finally, data quality
varies by agency and respondent in the federal laboratory survey.
Forty-five percent of private laboratories report some interaction with federal laboratories. Of these nearly
all or 42 percent, report that at least one of the technology transfer channels (see table 3) was important for their
research. Of the 45 percent having a federal lab connection, two thirds or 31 percent describe particular federal
laboratories that were influential for their research. We refer to these as closely affiliated federal laboratories.
Contingent on citation, mean numbers of federal laboratories and their research divisions were 3.5 and
20.5, indicating six divisions per federal laboratory. For each federal laboratory we construct 10-year stocks of
R&D in millions of 1987 dollars discounted at 15 percent. The R&D stocks end one year prior to the survey data
dated as of 1991 and 1996. From the standpoint of citing R&D laboratories stocks of federal R&D are sums over
R&D stocks of cited federal laboratories. The average federal laboratory has a stock of total R&D of about 9 billion
dollars. Intramural stocks are about 4 billion18. The divisional stocks of total and on-site R&D are respectively 500
and 200 million dollars. These figures indicate the extraordinary size of the federal laboratories.
We adopt the following policy for keeping observations in regressions that include R&D stocks of cited
federal laboratories. If a federal laboratory connection was declared and federal laboratories were cited then we
keep the observation. If there was no connection, then that observation is also kept. But if a connection was
declared and no federal laboratory was cited we drop the observation because the data are censored.
C. Supplemental Data
Besides the survey evidence we introduce R&D and net sales of parent firms from Compustat (Standard
and Poor, 1994). The Compustat data give us two variables that play a useful role in the empirical work. The first is
16 This idea first appears in Evenson and Kislev (1973). Adams and Jaffe (1996) and Adams (1999) make use of“real” deflators of R&D consisting of numbers of plants by location or technology.17 In some cases we obtained data on federal laboratory R&D from both the 1998 survey and published sources. Inall such cases the two sets of figures matched closely.
15
R&D in the rest of the firm in millions of 1987 dollars. This variable controls for R&D elsewhere in the firm, which
could contribute to patents in addition to laboratory R&D. The second is the logarithm of the stock of recent sales
of the firm. In constructing this stock we express sales over the previous 12 years in millions of 1987 dollars,
depreciate them at a rate of 15 percent, sum the result, and take logarithms. Recent firm sales control for size of the
firm. Another size measure from Compustat, stock market value, performs in a similar way to recent sales.
Finally we include the value of R&D and non-R&D procurement contracts by firm and location. The data
span the period 1991 to 1996 and include the Departments of Commerce, Defense, Energy, Health and Human
Services, and NASA, the five principal agencies with which firms were affiliated19. Based on these data we
construct the value in millions of 1987 dollars of contracts for the same two-digit zip code and firm as the
laboratory, and elsewhere in the firm. The point of constructing these variables is that CRADAs could be a veil for
rent seeking if the purpose of the agreements is to generate procurement. Thus, holding procurement constant is
useful for verifying the effect of CRADA. However, procurement does not change the CRADA effect.
V. The Influence of Federal Laboratories on Industrial Patents
Tables 5 and 6 include single equation results for patents issued to private R&D laboratories. The
estimation method is negative binomial regression, a type of random effects Poisson. Many of the laboratories do
not patent and the mean number of patents is close to zero. Poisson regression is one way of handling such count
data but it has a drawback because it fails to handle over-dispersion of counts in microdata. Negative binomial
regression corrects for the over-dispersion problem20. In all the regressions the statistics for over-dispersion are
highly significant and support the Negative Binomial over the Poisson.
18 The fraction of total R&D that is conducted on-site ranges from 1 to 99 percent across the cited group of federallaboratories. This indicates the heterogeneity of the laboratories in the degree to which they contract out research,and the importance of obtaining intramural R&D to correctly measure internal laboratory R&D.19 The source is the procurement transactions database of the General Services Administration (GSA), which recordsall procurement expenditures in the federal government. Over the 1991 to 1996 period roughly 60,000 of thesetransactions apply to companies in the survey data.20 Maddala (1983), Ch. 2 is a basic treatment of Poisson regression. Hausman, Hall and Griliches (1984) discuss theextension to the negative binomial. Johnson and Kotz (1969) derive the negative binomial as follows. Assume thatthe count data are Poisson distributed for a given parameter λ, and further assume that λ is a random variable thatfollows the Gamma distribution. Then the unconditional distribution of the data follows a negative binomial.
16
The following passage interprets the parameters in Negative Binomial regression. To ensure non-negativity
the computational algorithm writes the logarithm of the Poisson parameter λ i as a regression function:
(4) βλ ii x ′=log
This parameter determines the expected number of patents. It follows from (4) that if ijx an element of ix is
specified in logarithmic form, jβ is the elasticity of patents with respect to ijx .
We provide a more elaborate analysis for ijx a dummy variable, since our federal laboratory interactions
take this form and are a cornerstone of the analysis. Take the anti-logarithm of (4) to obtain the expected number of
patents for the ith observation iλ . Let 0iλ and 1
iλ stand for expected patents when ijx equals 0 or 1 respectively.
Then the change in the number of patents due to ijx changing from 0 to 1 is:
(5) ( ) 1 001 .... −=−=−…∆ + jjjijjji eee ixx
iiiββββ λλλλ
The equation uses the notation jijjjii xxx βββ +=′ .. to partition the regression function, as well as ijx =1 to
write 1iλ and ijx =0 to write 0
iλ . The expression on the far right follows from the definition of 0iλ . Equation (5) is
the expected change in patents for the ith observation due to a dummy variable changing from 0 to 1. But we are
really interested in the mean effect of a change in the dummy variable, using the sample of observations where the
dummy equals zero as a baseline. Let 0λ stand for mean patents for the jx =0 sub-sample and let 1~λ represent the
effect on mean patents of a change in jx from 0 to 1. Using (5) we write the predicted change in patents as
(6) ( ) 1 ~ 0010 −=−…∆ je
βλλλλ
The ratio of (6) to the difference in mean patents in samples where the dummy is 1 and 0 respectively ( 01 λλ − ) is a
comparison function that is useful in gauging the mean effect of the dummy:
(7)01
0
0
λλλ
λ −∆…∆R
We make frequent use of (6) and (7) in assessing the impact of CRADAs on patents below.
We now turn to table 5. Patents granted are the dependent variable in equations 5.1 to 5.4. Augmented
patents are the dependent variable in 5.5 to 5.8. Since these include imputes, we insert a dummy to absorb the effects
of imputation. The imputation dummy is positive and significant indicating the larger size of laboratories in
17
imputed cases but also the tendency for imputed patents to be more inclusive. All equations include dummies for
year and industry. Two other dummies describe specialization. We find that laboratories that engage in routine
testing patent less, though the effect is not significant. Joint housing with manufacturing is also insignificant.
Separately housed laboratories focus on research, making them more prone to patent, but they are also engaged in
work that is closer to basic science. This makes them less prone to patent so the net effect is zero.
The rest of the table considers the effect of current laboratory R&D, rest of firm R&D and the interactions
with federal laboratories, including the value of procurement contracts21. Throughout laboratory R&D is positive
and highly significant though its elasticity (about 0.7) is significantly less than 1.0. While the returns to patenting
may be diminishing, it is more likely that larger laboratories report their R&D more consistently than smaller
laboratories. Equations 5.4 and 5.8 split laboratory R&D budget into company-financed and federally funded
components. Only company-financed R&D increases patenting. This may indicate that government contracts
dominate federally funded R&D, for which patent rights or technological opportunities are limited.
We include the logarithm of R&D elsewhere in the firm to control for size and the benefits of research
conducted in other parts of the company. Its effect on laboratory patents is positive and significant, though its
elasticity (0.06) is less than a tenth of the elasticity of laboratory R&D. We have suggested that rest of firm R&D
could measure the firm’s ability to capture returns to its R&D. Alternatively, rest of firm R&D could reflect joint
research within the firm. In regressions not shown we also include recent sales of the firm to capture size. Sales are
insignificant while rest of firm R&D remains significant, apparently capturing joint research.
Table 5 contains three indicators of government laboratory interaction. Government Contractor is a dummy
equal to 1 (and 0 otherwise) when a private lab indicates that a contractor relationship with the federal laboratories is
important. Government Contractor has a negative coefficient in the patent equations, perhaps suggesting that rights
to government-sponsored R&D remain with government. CRADA significantly increases patents, consistent with
the view that it expedites technology transfer. This effect weakens (see 5.4 and 5.8) when federally funded
laboratory budget is included as a separate variable, presumably because federal support is correlated with CRADA.
21 We used current R&D of the laboratory and current patents because of time constraints on the survey respondents.However, in part because of serial correlation in R&D related to adjustment costs, current R&D is frequently foundto be strongly associated with current patents at the firm level. Two notable early studies, those of Scherer (1965)and of Griliches and Pakes (1984), find that current R&D is the predominant contributor to patents, even though therelationship should be lagged. Thus current R&D in our study is a proxy for recent R&D of the lab. Rest of firmR&D is the 13-year stock of R&D of the firm lagged one year, from Compustat.
18
The remaining indicator, on-site R&D in closely affiliated government laboratories, is never significant. In
regressions not shown we add a dummy for the importance of licensing government patents, but this is never
significant. CRADA is the only federal laboratory interaction that contributes to industrial patents. This raises anew
the question of how to measure its effect.
We use (6) and (7) for this purpose. To do so we require mean patents 0λ for laboratories where
CRADA=0 and 1λ for the sample where CRADA=1. In the data 0λ =5.93 and 1λ =17.8022. From table 5 we apply
values of jβ =0.4 or 0.5 in (6). The estimated effect of CRADA on the number of patents ( 0λ∆ ) using these values
for jβ is 2.91 or 3.85 patents. Since CRADA could stand for several cooperative agreements and since agreements
in other studies are worth about one million $ (Ham and Mowery, 1998), these figures seem within range.
Furthermore, using the relative measure 0λ∆R from (7), we can compute the fraction of the mean difference in
patents that is accounted for by CRADA. Substituting 1λ =17.80 and 0λ =5.93 and 0λ∆ =2.91 or 3.85 into (7) we
find that 0λ∆R ranges from 0.25 to 0.32. We conclude that most of the difference in patents between the two samples
is due to the laboratories rather than CRADA. This again seems reasonable.
Procurement in the vicinity of the laboratory is at most marginally significant. Procurement in the rest of
the firm is negative and significant, perhaps reflecting movement of R&D to the rest of the firm. But procurement
has little to do with the effect of CRADA. If we omit the procurement variables the coefficient of CRADA remains
about the same. This pattern continues to hold when procurement is broken up into R&D and non-R&D
components and when current procurement is replaced by cumulative procurement over the period 1991-1996.
Procurement considerations are not driving the CRADA effect observed in our data23.
Table 6 further explores the effect of CRADA. We set up a competition between CRADA and other
technology transfer indicators to see which dominates. The collection of indicators on each line is extracted from
regressions specified exactly as in table 5. Technology transfer indicators are on the left. Estimated coefficients are
on the right, with t-statistics in parentheses. The table reports eight combinations of technology transfer interactions.
22 Laboratories for which CRADAs are not important issue 5.93 patents and have R&D budgets of 4.48 million $.Laboratories for which CRADAs are important issue 17.8 patents and have R&D budgets of 23.13 million $.23 In addition we estimated Probit equations that included procurement and other variables, and where CRADA wasthe dependent variable. The procurement variables were insignificant, again suggesting that they are not driving theCRADA effect.
19
ANY is a dummy variable equal to 1 if any of the technology-transfer indicators in table 3 (licensing of
government patents, use of CRADAs, inflows of ideas from government laboratories, inflows of government
scientists, and use of industry-government technology transfer centers) are important. Otherwise, ANY equals 0.
ANY is insignificant until Government Contractor is introduced on the second line of the table.
ALL is the sum of the five technology transfer indicators and accordingly ranges from 0 to 5. ALL is a
more significant contributor to patents than ANY, especially when Government Contractor is introduced. This is
because ALL captures intensity of interactions with government laboratories in a way that ANY does not.
The last four lines of table 6 separate CRADA from ANY and ALL. ANY OTHER is a dummy variable
that equals 1 if some other technology transfer indicator besides CRADA is important, and 0 otherwise. The fifth
line of table 6 separates ANY into ANY OTHER and CRADA. ANY OTHER is negative and insignificant while
CRADA remains positive and significant. The sixth line adds Government Contractor to the specification. ANY
OTHER is again insignificant while CRADA strengthens, suggesting that omission of Government Contractor
causes a downward bias in the CRADA coefficient. Lines seven and eight separate CRADA from ALL. We
decompose ALL into ALL OTHER and CRADA. Otherwise the regressions are comparable to lines three and four.
Again ALL OTHER is insignificant while CRADA retains its effect.
In these data federal laboratories exert their primary effect on industrial patents through CRADA. But in
spite of all the controls CRADA could still reflect fixed effects of the laboratories rather than cooperative
agreements, a point that we address in the next section.
VI. Joint Determination of Industrial Patents and CRADAs
So far we find that CRADAs increase patents but we have not explored the possibility that CRADAs are
themselves influenced by unobserved quality of the laboratories. And yet industrial laboratories that collaborate
with federal laboratories are larger than average (see table 2) and are likely to be more productive than average. One
view of the process generating the observations is that CRADA is a dummy variable in a simultaneous equation
system24. According to this interpretation patents are a function of laboratory R&D budget, CRADA, industry and
year dummies and specialization of the laboratory25. At the same time CRADAs are a function of laboratory R&D
24 Heckman (1978) develops the theory of dummy endogenous variables in a simultaneous equation system andapplies the theory to anti-discrimination laws. Maddala (1983), Ch. 5 contains a survey of this literature.25 An alternative view emphasizes the role of selectivity. According to this view, the error term of the patentequation of (8), which may be interpreted as unobserved research productivity, can be expressed as a function of
20
budget; industry and year dummies; and other interactions with federal laboratories, including Government
Contractor. Both equations are part of a two-equation system that allows for cross-correlation of the errors.
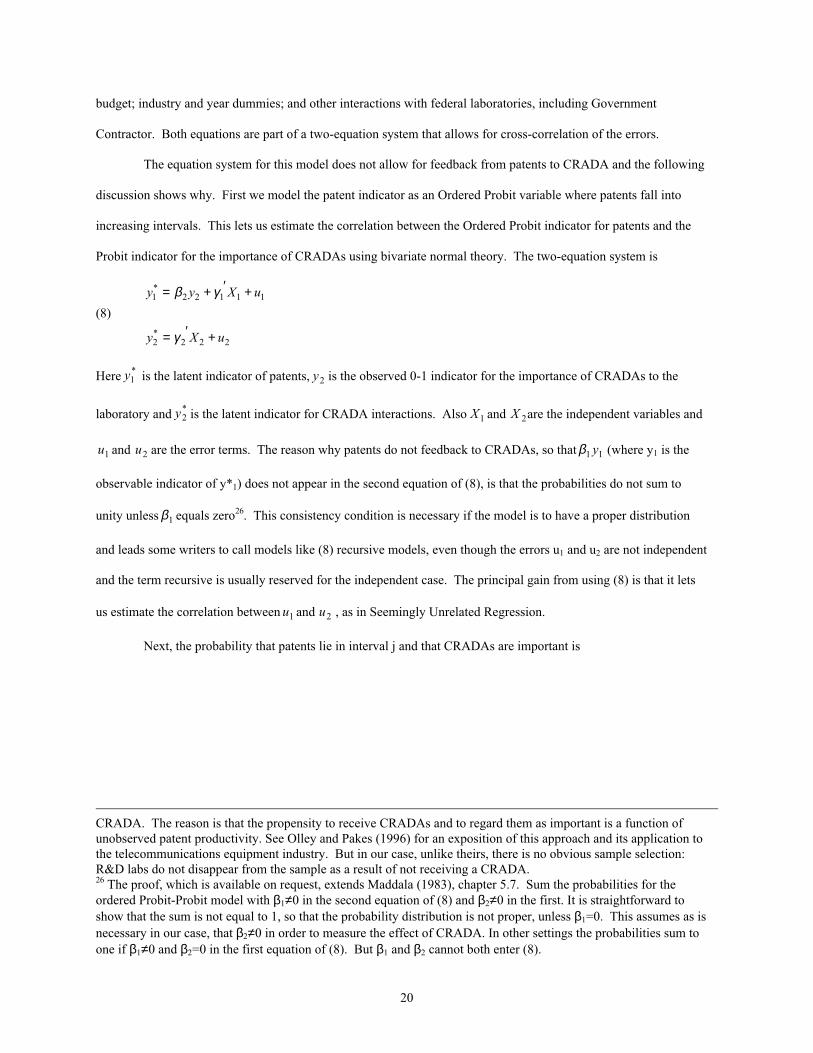
The equation system for this model does not allow for feedback from patents to CRADA and the following
discussion shows why. First we model the patent indicator as an Ordered Probit variable where patents fall into
increasing intervals. This lets us estimate the correlation between the Ordered Probit indicator for patents and the
Probit indicator for the importance of CRADAs using bivariate normal theory. The two-equation system is
(8)
222*2
11122*1
uXy
uXyy
+′=
+′+=
γ
γβ
Here *1y is the latent indicator of patents, 2y is the observed 0-1 indicator for the importance of CRADAs to the
laboratory and *2y is the latent indicator for CRADA interactions. Also 1X and 2X are the independent variables and
1u and 2u are the error terms. The reason why patents do not feedback to CRADAs, so that 11 yβ (where y1 is the
observable indicator of y*1) does not appear in the second equation of (8), is that the probabilities do not sum to
unity unless 1β equals zero26. This consistency condition is necessary if the model is to have a proper distribution
and leads some writers to call models like (8) recursive models, even though the errors u1 and u2 are not independent
and the term recursive is usually reserved for the independent case. The principal gain from using (8) is that it lets
us estimate the correlation between 1u and 2u , as in Seemingly Unrelated Regression.
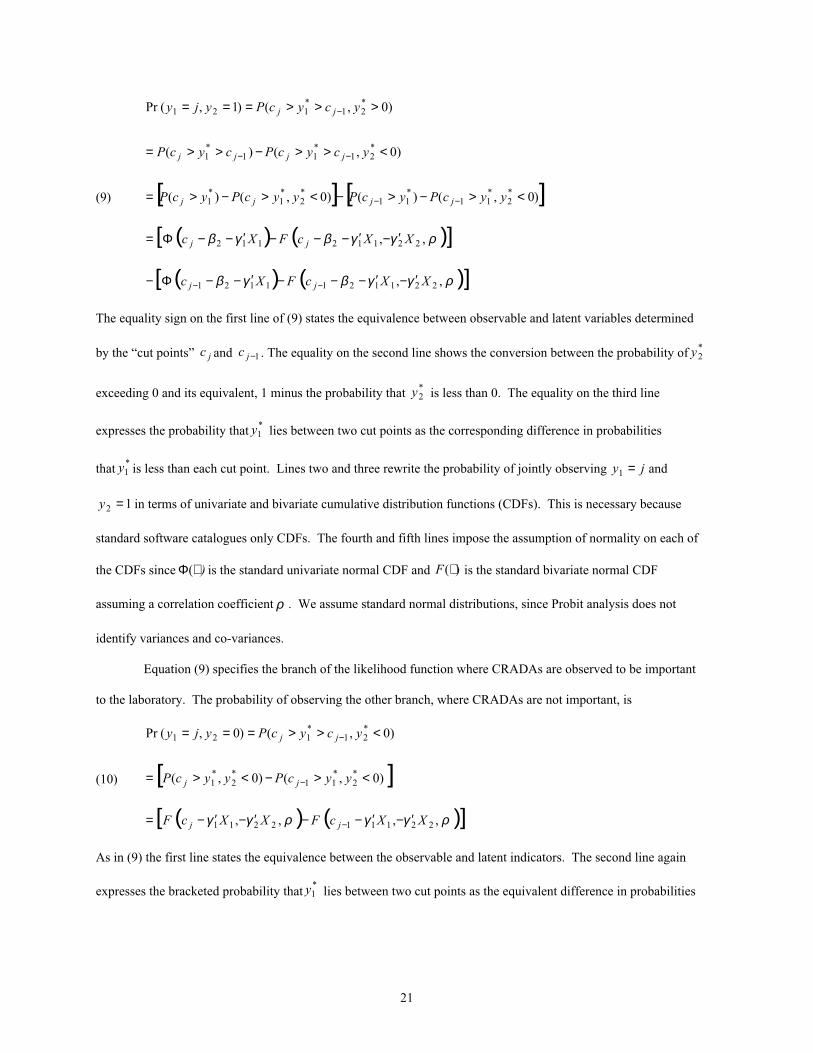
Next, the probability that patents lie in interval j and that CRADAs are important is
CRADA. The reason is that the propensity to receive CRADAs and to regard them as important is a function ofunobserved patent productivity. See Olley and Pakes (1996) for an exposition of this approach and its application tothe telecommunications equipment industry. But in our case, unlike theirs, there is no obvious sample selection:R&D labs do not disappear from the sample as a result of not receiving a CRADA.26 The proof, which is available on request, extends Maddala (1983), chapter 5.7. Sum the probabilities for theordered Probit-Probit model with β1≠0 in the second equation of (8) and β2≠0 in the first. It is straightforward toshow that the sum is not equal to 1, so that the probability distribution is not proper, unless β1=0. This assumes as isnecessary in our case, that β2≠0 in order to measure the effect of CRADA. In other settings the probabilities sum toone if β1≠0 and β2=0 in the first equation of (8). But β1 and β2 cannot both enter (8).
21
(9) [ ] [ ]
( ) ( )[ ]
( ) ( )[ ] XXc FXc
XXc FXc
yycPycPyycPycP
ycycPcycP
ycycPyjy
jj
jj
jjjj
jjjj
jj
ργγβγβ
ργγβγβ
,,
,,
)0,()()0,()(
)0,()(
)0,()1,(Pr
2211211121
22112112
*2
*11
*11
*2
*1
*1
*21
*11
*1
*21
*121
′−′−−−′−−Φ−
′−′−−−′−−Φ=
<>−>−<>−>=
<>>−>>=
>>>===
−−
−−
−−
−
The equality sign on the first line of (9) states the equivalence between observable and latent variables determined
by the “cut points” jc and 1−jc . The equality on the second line shows the conversion between the probability of *2y
exceeding 0 and its equivalent, 1 minus the probability that *2y is less than 0. The equality on the third line
expresses the probability that *1y lies between two cut points as the corresponding difference in probabilities
that *1y is less than each cut point. Lines two and three rewrite the probability of jointly observing jy =1 and
12 =y in terms of univariate and bivariate cumulative distribution functions (CDFs). This is necessary because
standard software catalogues only CDFs. The fourth and fifth lines impose the assumption of normality on each of
the CDFs since )⟨Φ( is the standard univariate normal CDF and )(⟨F is the standard bivariate normal CDF
assuming a correlation coefficient ρ . We assume standard normal distributions, since Probit analysis does not
identify variances and co-variances.
Equation (9) specifies the branch of the likelihood function where CRADAs are observed to be important
to the laboratory. The probability of observing the other branch, where CRADAs are not important, is
(10) [ ]
( ) ( )[ ] XXc F XXc F
yycPyycP
ycycPyjy
jj
jj
jj
ργγργγ ,,,,
)0,()0,(
)0,()0,(Pr
221112211
*2
*11
*2
*1
*21
*121
′−′−−′−′−=
<>−<>=
<>>===
−
−
−
As in (9) the first line states the equivalence between the observable and latent indicators. The second line again
expresses the bracketed probability that*1y lies between two cut points as the equivalent difference in probabilities
22
that *1y is less than each cut point and translates the probabilities into computable CDFs. The last line imposes
normality on the CDFs, where )(⟨F is the standard bivariate normal CDF, assuming a correlation coefficient ofρ .
The likelihood function is the product of (9) and (10) across observations:
(11) [ ] [ ] ijij Zijij
Zijij
ji
ycycPycycPL *
21*1
*21
*1 )0,( )0,( <>>⟨>>>= −−ΠΠ ,
where i is the observation and 1=ijZ if *1iy falls in category j of patents and 0 otherwise.
Table 7 contains the results for the two-equation econometric model consisting of (8)-(11)27. Equation 7.1
presents single equation, Ordered Probit estimates of the patent equation in which categorical patents are
PATCAT28. CRADA is highly significant as before. Equation 7.2 reports single equation Probit estimates of the
CRADA equation that include a battery of other interactions with government labs as instruments. These
interactions include Government Contractor, inflows of ideas from government labs, inflows of scientists from
federal labs, licensing of government patents, test facilities in government laboratories, and industry-government
technology transfer centers. The logarithm of R&D conducted elsewhere in the firm is excluded from 7.2 on the
grounds that size and quality of the laboratory attract CRADAs, not research elsewhere in the firm29. The results of
7.2 suggest that Government Contractor, inflows of ideas, and licensing of government patents are the most
important determinants of CRADA.
Equations 7.3 and 7.4 contain the two-equation maximum likelihood estimates of PATCAT and CRADA.
The key result is that taking cross-equation correlation into account increases the point estimate of CRADA and also
its standard error, but CRADA remains significant. The correlation between the error terms of the PATCAT and
CRADA equations is negative but insignificant30.
We also estimate (8)-(11) using augmented patents, which include imputes for missing patents. The results
are similar to those in table 7. In the single equation results for PATCAT the coefficient for CRADA is 0.34 (t=2.4).
In the two equation maximum likelihood results, the coefficient of CRADA is 0.41 (t=1.9). The cross-equation
correlation is negative, but insignificant.
27 The STATA program that computes the estimates is available on request. See Gould and Sribney (1999) for anintroduction to maximum likelihood estimation using STATA .28 The 10 categories of PATCAT correspond to 0, 1, 2, 3, and 4 patents, 5-7 patents, 8-10 patents, 11-20 patents, 21-40 patents, and 41+ patents. The intervals are chosen to avoid cells with few observations on PATCAT.29 The instruments and the exclusion restrictions identify the probabilities for this model. See Maddala (1983),p. 122-123.
23
VII. Federal Laboratories and Industrial Research Expenditures
A. Influence of Public-Private Interactions on Industrial R&D
Table 8 studies the determinants of laboratory R&D. The table reports four specifications of laboratory
R&D: total; company-financed (less expenditures on federal laboratories); federally financed; and expenditures on
federal laboratories. We expect that interactions with federal laboratories would have different effects on these
measures. Total laboratory R&D averages the effects across components. Company-financed R&D forms most of
budget. It is the part most driven by profitability of the firm’s research. Federally funded R&D increases with
government support. It is therefore, influenced by characteristics of the firm and laboratory that attract the funding.
Although a minor part of budget, expenditures on federal laboratories are the most affected by contact with such
laboratories. Thus we are looking for comparative effects of federal laboratory interactions in table 8. We are also
interested in whether the average of these effects differs from the effect on patents.
Equations 8.1 and 8.2 fit laboratory budget to variables that measure size and other characteristics. R&D
spending is significantly smaller in laboratories that specialize in testing and are jointly housed with manufacturing.
Ph.D. scientists to an extent capture size of the laboratory while recent sales of the firm control for firm size and the
incentives to perform R&D. Both are linked to increases in R&D.
Holding recent sales constant, R&D in the rest of the firm reduces laboratory R&D, suggesting substitution
towards other laboratories. Building on previous research that finds R&D intensity to be unrelated to firm size
(Bound et al., 1984), the joint effect of rest of firm R&D and recent sales is positive for laboratory R&D. We
impose constancy of R&D intensity by assuming an equal percentage increase in R&D in the rest of the firm and in
sales. Then the finding in table 8 of a larger elasticity of laboratory R&D with respect to sales than rest of firm
R&D implies that their joint effect is positive for laboratory R&D.
The pattern of government laboratory interactions in 8.1 and 8.2 resembles the pattern for patents in table 5.
Government Contractor is insignificant whereas CRADA increases laboratory R&D. As before, on-site federal
R&D in closely affiliated federal laboratories has almost no effect on R&D.
Equations 8.3 and 8.4 explore the determinants of company-financed R&D net of expenditures on federal
laboratories. Since most R&D is company-financed the results are similar to 8.1 and 8.2. Of the three indicators of
30 The estimated cut points are 0.22, 0.71, 1.17, 1.62, 1.90, 2.24, 2.58, 3.13 and 3.69.
24
federal laboratory interaction only CRADA increases company-financed R&D, perhaps reflecting the cost-sharing
provisions of cooperative agreements that were discussed in section II of this paper.
Equations 8.5 and 8.6 study federally funded R&D. The estimation method is Tobit analysis since 80% of
the laboratories receive no federal funding31. Clearly larger firms attract larger amounts of federal funding. In 8.5
both Government Contractor and CRADA contribute to federally funded R&D. Equation 8.6 introduces R&D of
closely affiliated federal laboratories. As before, federal laboratory R&D is insignificant.
The Tobit coefficients are much larger than the OLS coefficients. But expected marginal effects in Tobit
analysis are the estimated coefficients times the fraction of observations not censored32. The marginal effect of
CRADA on company-financed R&D is 0.65 in 8.3, but the marginal effect of CRADA on federally funded R&D is
0.2×3.79=0.76 in 8.5. The same comparison holds for the other variables. All the Tobit coefficients must be
multiplied by the fraction of observations not censored to obtain expected marginal effects that are comparable to
OLS coefficients.
Table 8 concludes with company-financed expenditures by the private laboratories on federal laboratories.
Though a minor element of R&D, one would expect a strong reaction of this type of expenditure to public-private
interactions, because of its focus on federal laboratory research. The estimation method is again Tobit analysis since
expenditures on federal laboratories equal zero for 83% of the observations.
Equations 8.7 to 8.8 contain the results. Equation 8.7 includes Government Contractor and CRADA, while
8.8 adds the logarithm of federal laboratory R&D per research division. Government Contractor is insignificant
consistent with the notion that contractor R&D is fully funded by government. CRADA increases expenditures on
federal laboratories, consistent with its interpretation as an indicator of joint research. For the first time R&D of
federal laboratories contributes significantly, perhaps because larger federal laboratories award larger grants or
because they attract more interest from collaborating R&D laboratories. But these effects apply to a minor part of
R&D and are concealed in laboratory R&D, as equations 8.1 and 8.2 show.
Similar to the findings for patents table 8 suggests that only CRADA among federal laboratory interactions
stimulates company R&D. As a mechanical matter government contracts increase publicly funded R&D. As a
31 For a discussion of Tobit, see for example Greene (2000), chapter 20.3.32 Where β is the Tobit coefficient and 1-Φ is the fraction of observations not censored, the expected marginal effectis β•(1-Φ). Compare this result with OLS, where β is both the regression coefficient and the marginal effect. SeeGreene (2000), Theorem 20.4 for a proof.
25
contractual matter and as a result of incentives, firms that participate in CRADAs spend more on their own, receive
more government support, and are more energetic in finding out about research in government laboratories.
In order to measure the effect of CRADA we use a formula like (6) for patents. Just as βλ x ′= log , so
here δzDR ′=& log . We replace mean λ with mean R&D throughout (6), yielding
(12) ( ) 1 &&~
&~~
&0010
−=−…∆ jeDRDRDRDRδ
0& DR∆ is the mean increase in R&D due to CRADA, 1~
&~~
DR is additional R&D in non-recipient laboratories
brought about by CRADA, and0
& DR is mean R&D in non-recipient laboratories. Superscript 0 stands for the
group where CRADA=0, superscript 1 stands for the group where CRADA=1, and jδ is the coefficient of CRADA.
Equation (12) reports the average effect of CRADA using mean R&D of laboratories where CRADA=0 (0
& DR )
as a baseline. Mean R&D in laboratories where CRADA=0 is0
& DR =4.48 and 1
& DR =23.13 where CRADA=1
(see fn. 22). For the CRADA effect we use jδ =0.5 or 0.6 from 8.4 and 8.5—the results for company-financed R&D
and the concept that is most free from federal support and the most reliable for estimating the effect of CRADA.
Substituting these numbers into (12), we find that0
& DR∆ =2.90 or 3.69.
To gauge the size of this effect we use a formula that is similar to (7):
(13) 01
0
& &&
&0
DRDR
DRR
DR −
∆…∆
This is the fraction of the difference in R&D in laboratories where CRADA=1 (superscript 1) and
CRADA=0 (superscript 0) that is due to CRADA itself. We have calculated the numerator of (13) to be 2.90 or
3.69. In addition0
& DR =4.48 and1
& DR =23.13 (again see fn. 22). Inserting these calculations in (13) we find
oDR
R&∆
=0.16 or 0.20. Thus CRADA accounts for 0.16-0.20 of the difference in R&D between the two groups of
laboratories. CRADA contributes up to one-fifth of the gap in R&D budget between the two sub-samples. This
finding seems sensible given that CRADA may represent several cooperative agreements.
Table 9 further explores the effect of federal laboratory interactions on industrial R&D. As in table 6 we
set up a competition between CRADA and alternative indicators of technology transfer to see which dominates.
26
One difference is that there are now four dependent variables made up of the different types of laboratory R&D in
table 8. Table 9 reports eight regressions that are otherwise specified as in table 8. These regressions compare the
importance of the other technology transfer indicators (licensing of government patents, inflows of ideas from
government laboratories, inflows of government scientists, and use of industry-government technology transfer
centers) with that of CRADA. Throughout CRADA has a positive and significant effect on every category of R&D.
As before Government Contractor has the same effect on federally funded R&D.
Now consider combined indicators of technology transfer. Recall that ANY is equal to 1 if any of the
technology transfer dummies equals 1 and 0 otherwise. ALL is the sum of the five dummies and ranges from 0 to 5,
capturing intensity of interactions with federal laboratories. ANY OTHER and ALL OTHER take CRADA out of
ANY and ALL. ANY and ALL are significant alone and in combination with Government Contractor in lines 1-4
of the table. But when CRADA is taken out of ANY and ALL in lines 5 and 7, ANY OTHER and ALL OTHER are
insignificant in columns (1) and (2), representing total and company-financed R&D. Only in columns (3) and (4),
consisting of federally funded R&D and expenditures on federal laboratories, are ANY OTHER and ALL OTHER
significant. Lines 6 and 8 enter the Government Contractor variable. ANY OTHER and ALL OTHER are no
longer significant in the case of federally financed R&D. However ANY OTHER and ALL OTHER still matter for
company expenditures on federal laboratories.
In general ANY and ALL are more often significant in the equations for R&D expenditures than they are in
patent equations. And yet, just as in table 6, most of their effect is due to CRADA and Government Contractor.
Once these two indicators are accounted for residual indicators of technology transfer (licensing of government
patents, inflows of ideas from government laboratories, inflows of government scientists, and use of industry-
government technology transfer centers) influence only the minor part of budget devoted to expenditures on
government laboratories. This effect disappears from total R&D budget, where ANY OTHER and ALL OTHER are
insignificant, showing how small expenditures on federal laboratories are.
B. Influence of Public-Private Interactions on Procurement
We conclude the empirical work by studying the determinants of procurement. In section III we said that
CRADAs could stimulate procurement as well as the reverse. To test this idea we estimate Tobit equations in which
the logarithm of procurement is the limited dependent variable and laboratory R&D, the importance of science fields
27
rather than engineering (Science), firm sales, and CRADA are the determinants. Equation (14) reports our first set
of results, with t-statistics shown in parentheses.
Log (Procurement)= -18.65+1.01*log (Company R&D) - 2.63*Science + 1.01*log (Firm Sales) (-5.1) (2.7) (-1.1) (2.5)
(14)+2.98*CRADA (N=294, Fraction Left Censored= 0.65, Log Likelihood= -437.26) (2.5)
Also included in this equation, but omitted for brevity, are industry dummies, the logarithm of R&D in the rest of
the firm, and laboratory specialization in testing. Equation (14) shows that larger laboratories and firms and
laboratories where CRADAs are important all win more procurement dollars, while laboratories oriented towards
basic science earn less (though the last effect is insignificant). As in our earlier investigations, equation (15)
includes GOVERNMENT CONTRACTOR as well as CRADA:
Log (Procurement)= -17.40+0.96*log (Company R&D) - 2.49*Science + 0.84*log (Firm Sales) (-5.0) (2.6) (-1.0) (2.1)
(15)+0.31*CRADA +4.60*GOVERNMENT CONTRACTOR(0.2) (3.2)
(N=294, Fraction Left Censored= 0.65, Log Likelihood= -432.24)
Thus, while there is some indication from (14) and (15) that CRADA helps to drive procurement, the relationship is
not robust. In effect, the causal significance of CRADA is not identified separately from contractor relationships in
the same way as it was for industrial patents and R&D.
VIII. Summary and Conclusion
The passage of the Bayh-Dole and Stevenson-Wydler Acts two decades ago transformed technology
transfer policy. Bayh-Dole eased restrictions on the private use of inventions funded by government. Stevenson-
Wydler Act complemented Bayh-Dole by introducing cooperative research or CRADAs between firms and federal
laboratories. Our findings suggest that Stevenson-Wydler and its successors may have had an effect, since
CRADAs as we measure them appear to have stimulated industrial patents and company-financed R&D. Moreover,
in this paper we find no other channel of technology transfer from federal laboratories that exerts a comparable
effect. Our results may suggest that arrangements like CRADAs that strive to ensure effort by both firms and
federal laboratories are required for successful technology transfer. But further work is needed to verify the CRADA
effect and whether additional policies, especially licensing of federal patents and movements of federal laboratory
28
scientists into the private sector, also drive the influence of the laboratories. For example, patent licensing and
mobility could affect new products and processes produced by firms, rather than company patents or R&D as
analyzed here. Also of interest is the influence of CRADAs on the federal laboratories themselves, since the
analysis of section III suggests that they also benefit from CRADAs.
We turn now to some unanswered questions. The CRADA effect that we observe is not random. Instead a
double selection mechanism operates that yields CRADAs between pairs of firms and federal laboratories. Firms
will not apply for CRADAs unless expected returns exceed their expected costs. Likewise federal laboratories
choose among applicants and establish acceptance criteria for projects. Therefore, the CRADAs that we observe are
likely to be more productive than CRADAs awarded at random. We suspect that firms apply to federal laboratories
that they know well, and that federal laboratories select CRADA applicants whose work is relevant and trusted by
them. Hence CRADAs spring from long-term relationships between federal laboratories and firms. It follows that
a panel of data on collaborations between firms and federal laboratories is needed to expand the study of CRADAs
and other policies. The Ordered Probit-Probit equations of table 7 try to get at this, but more evidence is needed.
Eventually one would like to do a cost benefit analysis of CRADAs and other forms of technology transfer
from the federal laboratories. But to undertake such an analysis one would have to be able to calculate the stream of
producer and consumer’s surplus from products and processes that derive from CRADAs, as well as the rates of
decay in both forms of surplus. On the cost side one would need to know all the costs incurred by firms in carrying
CRADAs to commercialization, including those CRADAs that turned out to be unsuccessful, and likewise the costs
of federal laboratories in administering all the CRADAs. More deeply one would like to know which portions of the
federal laboratory system are able to sustain a stream of successful CRADAs and other technology transfer and why,
including those aspects of contract design that are most successful in ensuring technology transfer. We have
scratched the surface of public-private interactions in research, but there is still much to be learned about the factors
that determine success and failure of the interactions. Together these constitute a notable social experiment of our
own time.
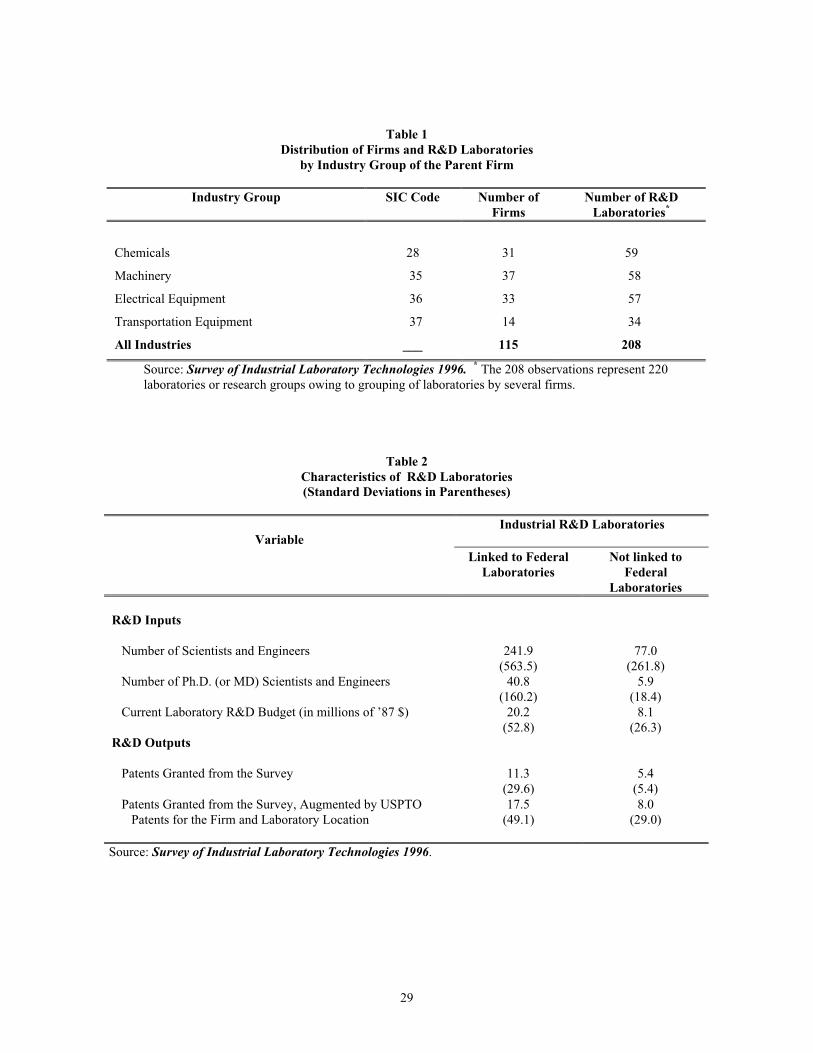
29
Table 1Distribution of Firms and R&D Laboratories
by Industry Group of the Parent Firm
Industry Group SIC Code Number ofFirms
Number of R&DLaboratories*
Chemicals 28 31 59
Machinery 35 37 58
Electrical Equipment 36 33 57
Transportation Equipment 37 14 34
All Industries ___ 115 208
Source: Survey of Industrial Laboratory Technologies 1996. * The 208 observations represent 220laboratories or research groups owing to grouping of laboratories by several firms.
Table 2Characteristics of R&D Laboratories(Standard Deviations in Parentheses)
Industrial R&D LaboratoriesVariable
Linked to FederalLaboratories
Not linked toFederal
Laboratories
R&D Inputs
Number of Scientists and Engineers 241.9(563.5)
77.0(261.8)
Number of Ph.D. (or MD) Scientists and Engineers 40.8(160.2)
5.9(18.4)
Current Laboratory R&D Budget (in millions of ’87 $) 20.2(52.8)
8.1(26.3)
R&D Outputs
Patents Granted from the Survey 11.3(29.6)
5.4(5.4)
Patents Granted from the Survey, Augmented by USPTO Patents for the Firm and Laboratory Location
17.5(49.1)
8.0(29.0)
Source: Survey of Industrial Laboratory Technologies 1996.
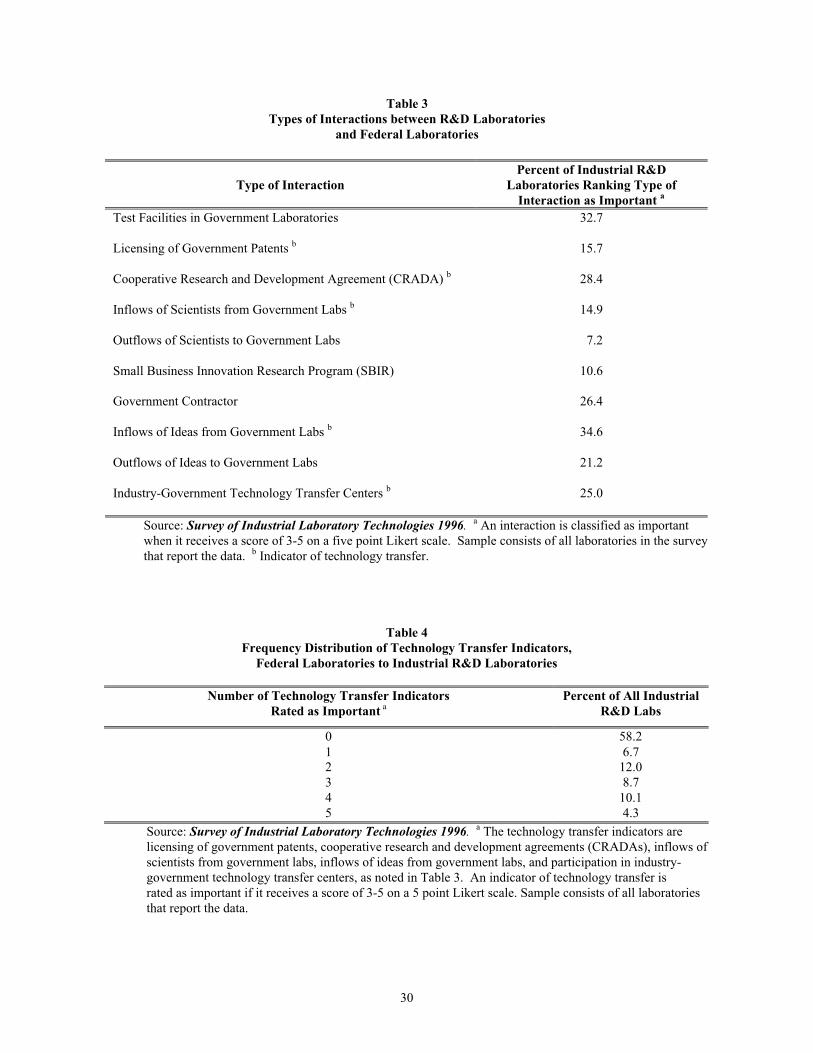
30
Table 3Types of Interactions between R&D Laboratories
and Federal Laboratories
Type of InteractionPercent of Industrial R&D
Laboratories Ranking Type ofInteraction as Important a
Test Facilities in Government Laboratories 32.7
Licensing of Government Patents b 15.7
Cooperative Research and Development Agreement (CRADA) b 28.4
Inflows of Scientists from Government Labs b 14.9
Outflows of Scientists to Government Labs 7.2
Small Business Innovation Research Program (SBIR) 10.6
Government Contractor 26.4
Inflows of Ideas from Government Labs b 34.6
Outflows of Ideas to Government Labs 21.2
Industry-Government Technology Transfer Centers b 25.0
Source: Survey of Industrial Laboratory Technologies 1996. a An interaction is classified as importantwhen it receives a score of 3-5 on a five point Likert scale. Sample consists of all laboratories in the surveythat report the data. b Indicator of technology transfer.
Table 4Frequency Distribution of Technology Transfer Indicators,
Federal Laboratories to Industrial R&D Laboratories
Number of Technology Transfer IndicatorsRated as Important a
Percent of All IndustrialR&D Labs
0 58.21 6.72 12.03 8.74 10.15 4.3
Source: Survey of Industrial Laboratory Technologies 1996. a The technology transfer indicators arelicensing of government patents, cooperative research and development agreements (CRADAs), inflows ofscientists from government labs, inflows of ideas from government labs, and participation in industry-government technology transfer centers, as noted in Table 3. An indicator of technology transfer israted as important if it receives a score of 3-5 on a 5 point Likert scale. Sample consists of all laboratoriesthat report the data.
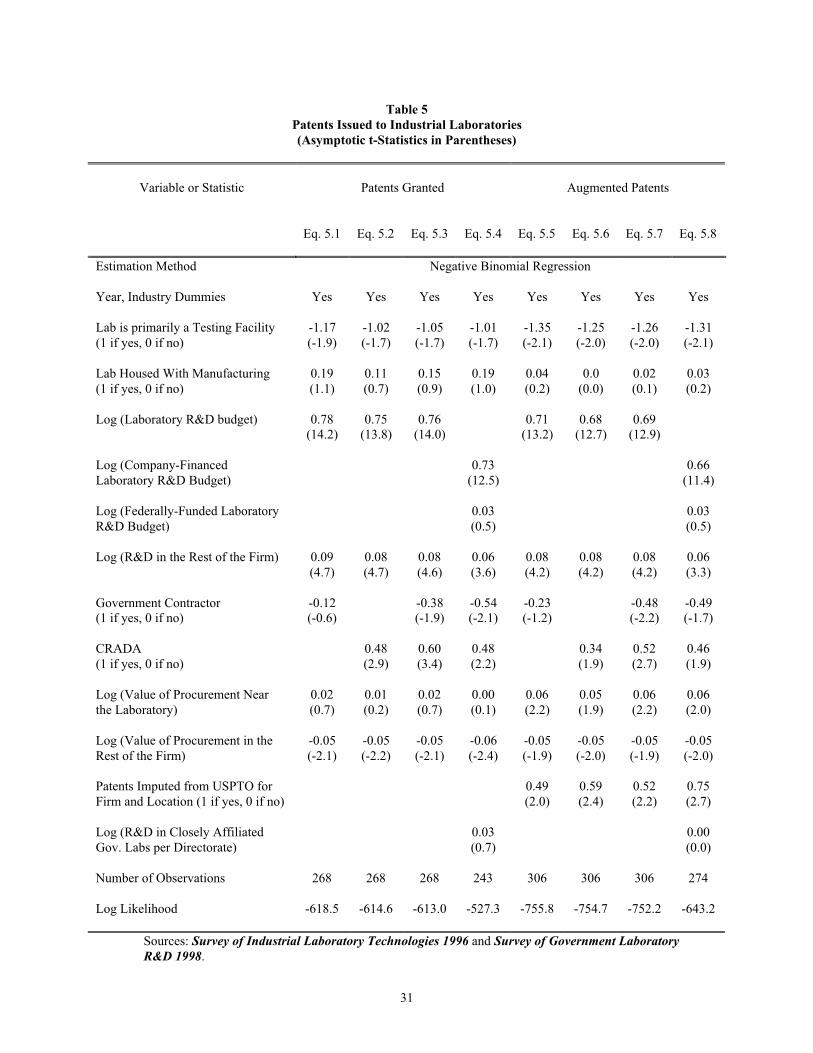
31
Table 5Patents Issued to Industrial Laboratories(Asymptotic t-Statistics in Parentheses)
Variable or Statistic Patents Granted Augmented Patents
Eq. 5.1 Eq. 5.2 Eq. 5.3 Eq. 5.4 Eq. 5.5 Eq. 5.6 Eq. 5.7 Eq. 5.8
Estimation Method Negative Binomial Regression
Year, Industry Dummies Yes Yes Yes Yes Yes Yes Yes Yes
Lab is primarily a Testing Facility(1 if yes, 0 if no)
-1.17(-1.9)
-1.02(-1.7)
-1.05(-1.7)
-1.01(-1.7)
-1.35(-2.1)
-1.25(-2.0)
-1.26(-2.0)
-1.31(-2.1)
Lab Housed With Manufacturing(1 if yes, 0 if no)
0.19(1.1)
0.11(0.7)
0.15(0.9)
0.19(1.0)
0.04(0.2)
0.0(0.0)
0.02(0.1)
0.03(0.2)
Log (Laboratory R&D budget) 0.78(14.2)
0.75(13.8)
0.76(14.0)
0.71(13.2)
0.68(12.7)
0.69(12.9)
Log (Company-FinancedLaboratory R&D Budget)
0.73(12.5)
0.66(11.4)
Log (Federally-Funded LaboratoryR&D Budget)
0.03(0.5)
0.03(0.5)
Log (R&D in the Rest of the Firm) 0.09(4.7)
0.08(4.7)
0.08(4.6)
0.06(3.6)
0.08(4.2)
0.08(4.2)
0.08(4.2)
0.06(3.3)
Government Contractor(1 if yes, 0 if no)
-0.12(-0.6)
-0.38(-1.9)
-0.54(-2.1)
-0.23(-1.2)
-0.48(-2.2)
-0.49(-1.7)
CRADA(1 if yes, 0 if no)
0.48(2.9)
0.60(3.4)
0.48(2.2)
0.34(1.9)
0.52(2.7)
0.46(1.9)
Log (Value of Procurement Nearthe Laboratory)
0.02(0.7)
0.01(0.2)
0.02(0.7)
0.00(0.1)
0.06(2.2)
0.05(1.9)
0.06(2.2)
0.06(2.0)
Log (Value of Procurement in theRest of the Firm)
-0.05(-2.1)
-0.05(-2.2)
-0.05(-2.1)
-0.06(-2.4)
-0.05(-1.9)
-0.05(-2.0)
-0.05(-1.9)
-0.05(-2.0)
Patents Imputed from USPTO forFirm and Location (1 if yes, 0 if no)
0.49(2.0)
0.59(2.4)
0.52(2.2)
0.75(2.7)
Log (R&D in Closely AffiliatedGov. Labs per Directorate)
0.03(0.7)
0.00(0.0)
Number of Observations 268 268 268 243 306 306 306 274
Log Likelihood -618.5 -614.6 -613.0 -527.3 -755.8 -754.7 -752.2 -643.2
Sources: Survey of Industrial Laboratory Technologies 1996 and Survey of Government LaboratoryR&D 1998.
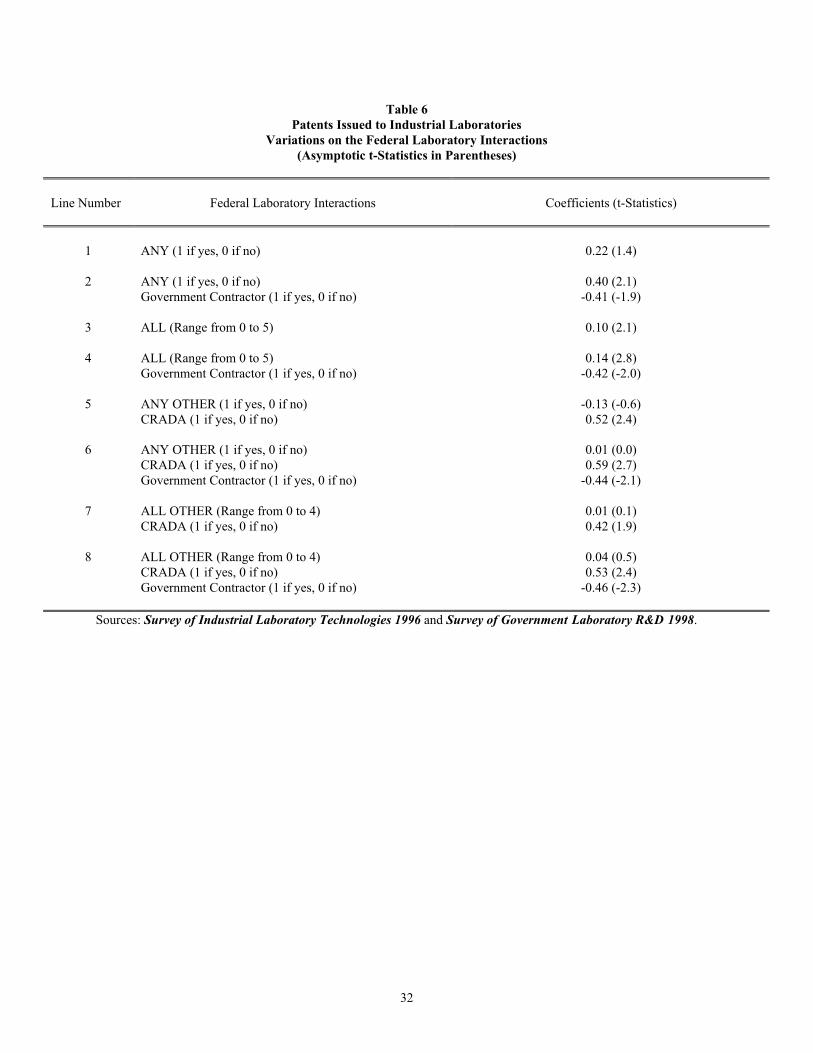
32
Table 6Patents Issued to Industrial Laboratories
Variations on the Federal Laboratory Interactions(Asymptotic t-Statistics in Parentheses)
Line Number Federal Laboratory Interactions Coefficients (t-Statistics)
1 ANY (1 if yes, 0 if no) 0.22 (1.4)
2 ANY (1 if yes, 0 if no)Government Contractor (1 if yes, 0 if no)
0.40 (2.1)-0.41 (-1.9)
3 ALL (Range from 0 to 5) 0.10 (2.1)
4 ALL (Range from 0 to 5)Government Contractor (1 if yes, 0 if no)
0.14 (2.8)-0.42 (-2.0)
5 ANY OTHER (1 if yes, 0 if no)CRADA (1 if yes, 0 if no)
-0.13 (-0.6)0.52 (2.4)
6 ANY OTHER (1 if yes, 0 if no)CRADA (1 if yes, 0 if no)Government Contractor (1 if yes, 0 if no)
0.01 (0.0)0.59 (2.7)
-0.44 (-2.1)
7 ALL OTHER (Range from 0 to 4)CRADA (1 if yes, 0 if no)
0.01 (0.1)0.42 (1.9)
8 ALL OTHER (Range from 0 to 4)CRADA (1 if yes, 0 if no)Government Contractor (1 if yes, 0 if no)
0.04 (0.5)0.53 (2.4)
-0.46 (-2.3)
Sources: Survey of Industrial Laboratory Technologies 1996 and Survey of Government Laboratory R&D 1998.
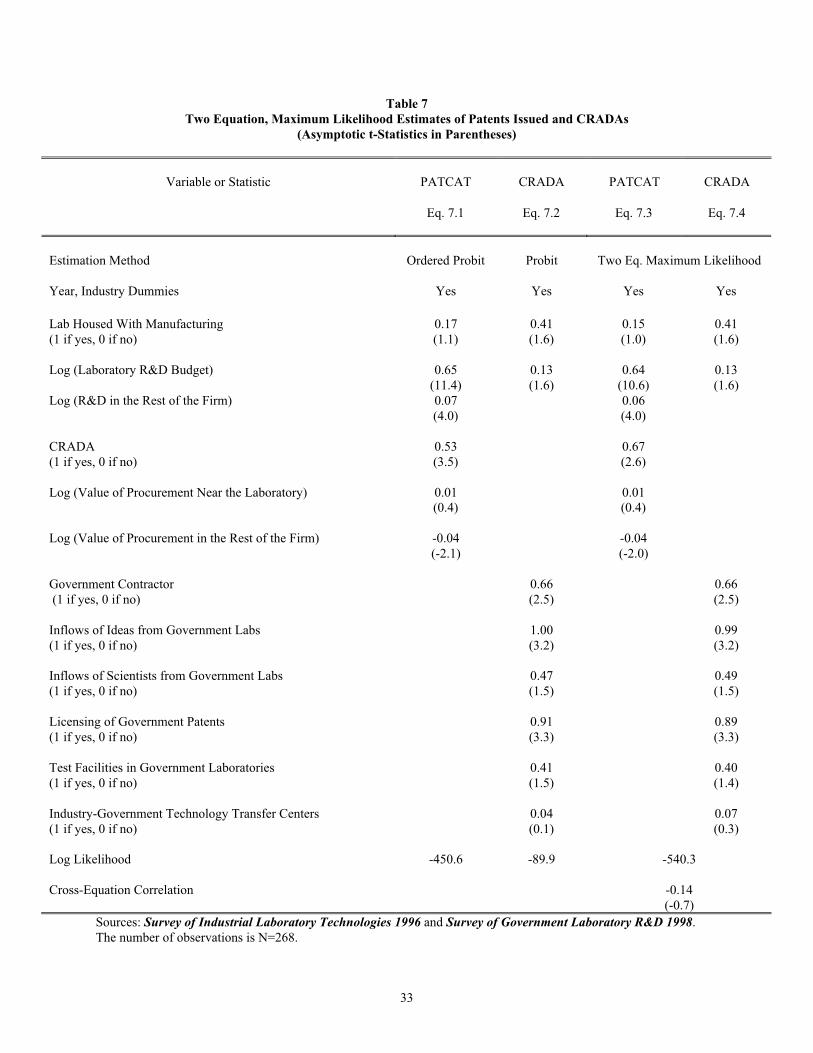
33
Table 7Two Equation, Maximum Likelihood Estimates of Patents Issued and CRADAs
(Asymptotic t-Statistics in Parentheses)
Variable or Statistic PATCAT CRADA PATCAT CRADA
Eq. 7.1 Eq. 7.2 Eq. 7.3 Eq. 7.4
Estimation Method Ordered Probit Probit Two Eq. Maximum Likelihood
Year, Industry Dummies Yes Yes Yes Yes
Lab Housed With Manufacturing(1 if yes, 0 if no)
0.17(1.1)
0.41(1.6)
0.15(1.0)
0.41(1.6)
Log (Laboratory R&D Budget) 0.65(11.4)
0.13(1.6)
0.64(10.6)
0.13(1.6)
Log (R&D in the Rest of the Firm) 0.07(4.0)
0.06(4.0)
CRADA(1 if yes, 0 if no)
0.53(3.5)
0.67(2.6)
Log (Value of Procurement Near the Laboratory) 0.01(0.4)
0.01(0.4)
Log (Value of Procurement in the Rest of the Firm) -0.04(-2.1)
-0.04(-2.0)
Government Contractor (1 if yes, 0 if no)
0.66(2.5)
0.66(2.5)
Inflows of Ideas from Government Labs(1 if yes, 0 if no)
1.00(3.2)
0.99(3.2)
Inflows of Scientists from Government Labs(1 if yes, 0 if no)
0.47(1.5)
0.49(1.5)
Licensing of Government Patents(1 if yes, 0 if no)
0.91(3.3)
0.89(3.3)
Test Facilities in Government Laboratories(1 if yes, 0 if no)
0.41(1.5)
0.40(1.4)
Industry-Government Technology Transfer Centers(1 if yes, 0 if no)
0.04(0.1)
0.07(0.3)
Log Likelihood -450.6 -89.9 -540.3
Cross-Equation Correlation -0.14(-0.7)
Sources: Survey of Industrial Laboratory Technologies 1996 and Survey of Government Laboratory R&D 1998.The number of observations is N=268.
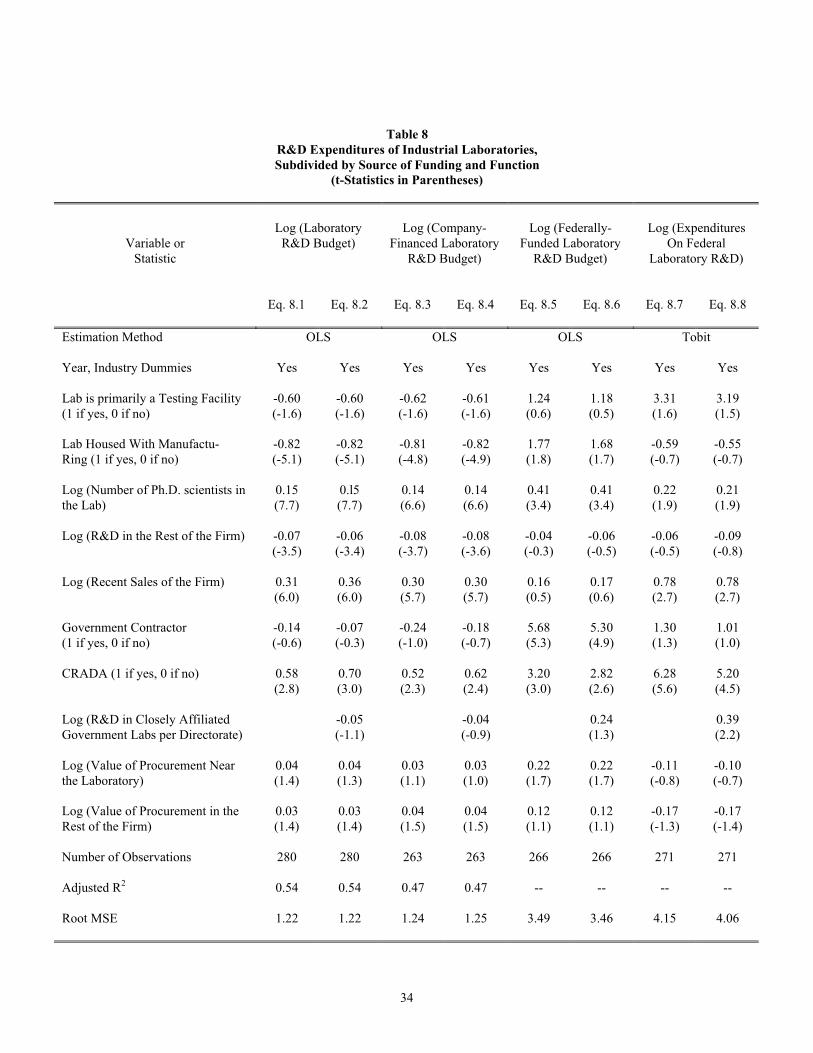
34
Table 8R&D Expenditures of Industrial Laboratories,Subdivided by Source of Funding and Function
(t-Statistics in Parentheses)
Variable orStatistic
Log (LaboratoryR&D Budget)
Log (Company-Financed Laboratory
R&D Budget)
Log (Federally-Funded Laboratory
R&D Budget)
Log (ExpendituresOn Federal
Laboratory R&D)
Eq. 8.1 Eq. 8.2 Eq. 8.3 Eq. 8.4 Eq. 8.5 Eq. 8.6 Eq. 8.7 Eq. 8.8
Estimation Method OLS OLS OLS Tobit
Year, Industry Dummies Yes Yes Yes Yes Yes Yes Yes Yes
Lab is primarily a Testing Facility(1 if yes, 0 if no)
-0.60(-1.6)
-0.60(-1.6)
-0.62(-1.6)
-0.61(-1.6)
1.24(0.6)
1.18(0.5)
3.31(1.6)
3.19(1.5)
Lab Housed With Manufactu-Ring (1 if yes, 0 if no)
-0.82(-5.1)
-0.82(-5.1)
-0.81(-4.8)
-0.82(-4.9)
1.77(1.8)
1.68(1.7)
-0.59(-0.7)
-0.55(-0.7)
Log (Number of Ph.D. scientists inthe Lab)
0.15(7.7)
0.l5(7.7)
0.14(6.6)
0.14(6.6)
0.41(3.4)
0.41(3.4)
0.22(1.9)
0.21(1.9)
Log (R&D in the Rest of the Firm) -0.07(-3.5)
-0.06(-3.4)
-0.08(-3.7)
-0.08(-3.6)
-0.04(-0.3)
-0.06(-0.5)
-0.06(-0.5)
-0.09(-0.8)
Log (Recent Sales of the Firm) 0.31(6.0)
0.36(6.0)
0.30(5.7)
0.30(5.7)
0.16(0.5)
0.17(0.6)
0.78(2.7)
0.78(2.7)
Government Contractor(1 if yes, 0 if no)
-0.14(-0.6)
-0.07(-0.3)
-0.24(-1.0)
-0.18(-0.7)
5.68(5.3)
5.30(4.9)
1.30(1.3)
1.01(1.0)
CRADA (1 if yes, 0 if no) 0.58(2.8)
0.70(3.0)
0.52(2.3)
0.62(2.4)
3.20(3.0)
2.82(2.6)
6.28(5.6)
5.20(4.5)
Log (R&D in Closely AffiliatedGovernment Labs per Directorate)
-0.05(-1.1)
-0.04(-0.9)
0.24(1.3)
0.39(2.2)
Log (Value of Procurement Nearthe Laboratory)
0.04(1.4)
0.04(1.3)
0.03(1.1)
0.03(1.0)
0.22(1.7)
0.22(1.7)
-0.11(-0.8)
-0.10(-0.7)
Log (Value of Procurement in theRest of the Firm)
0.03(1.4)
0.03(1.4)
0.04(1.5)
0.04(1.5)
0.12(1.1)
0.12(1.1)
-0.17(-1.3)
-0.17(-1.4)
Number of Observations 280 280 263 263 266 266 271 271
Adjusted R2 0.54 0.54 0.47 0.47 -- -- -- --
Root MSE 1.22 1.22 1.24 1.25 3.49 3.46 4.15 4.06
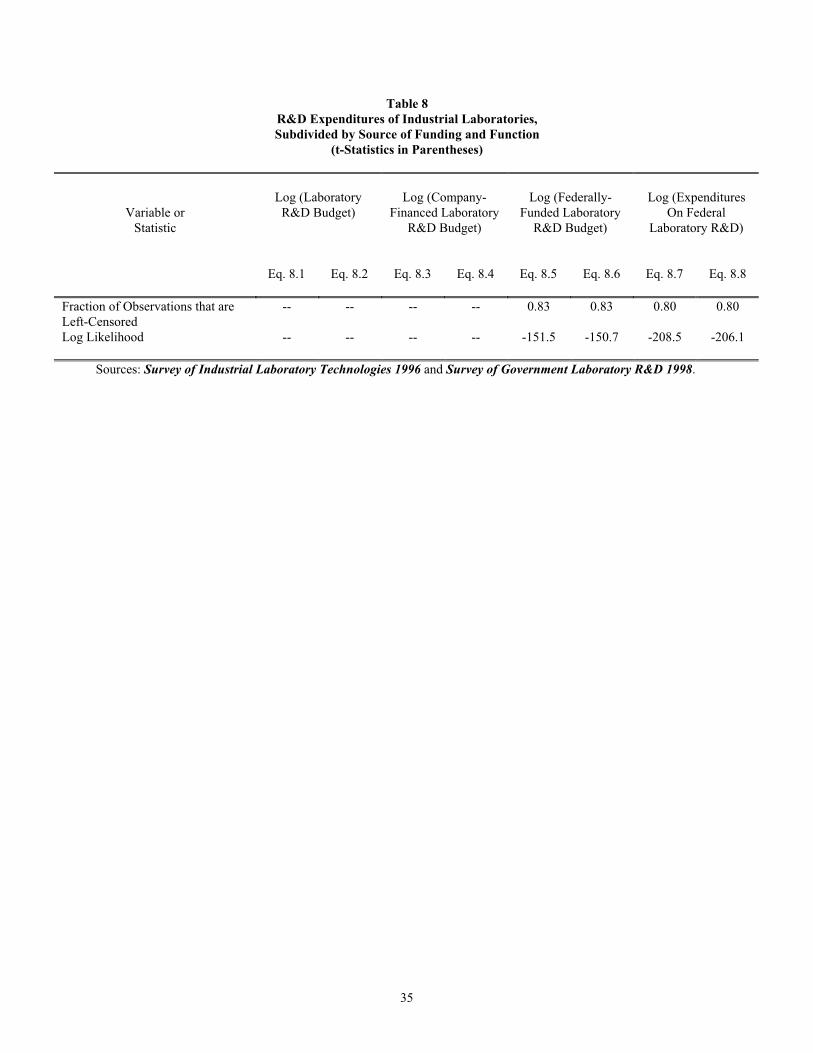
35
Table 8R&D Expenditures of Industrial Laboratories,Subdivided by Source of Funding and Function
(t-Statistics in Parentheses)
Variable orStatistic
Log (LaboratoryR&D Budget)
Log (Company-Financed Laboratory
R&D Budget)
Log (Federally-Funded Laboratory
R&D Budget)
Log (ExpendituresOn Federal
Laboratory R&D)
Eq. 8.1 Eq. 8.2 Eq. 8.3 Eq. 8.4 Eq. 8.5 Eq. 8.6 Eq. 8.7 Eq. 8.8
Fraction of Observations that areLeft-Censored
-- -- -- -- 0.83 0.83 0.80 0.80
Log Likelihood -- -- -- -- -151.5 -150.7 -208.5 -206.1
Sources: Survey of Industrial Laboratory Technologies 1996 and Survey of Government Laboratory R&D 1998.
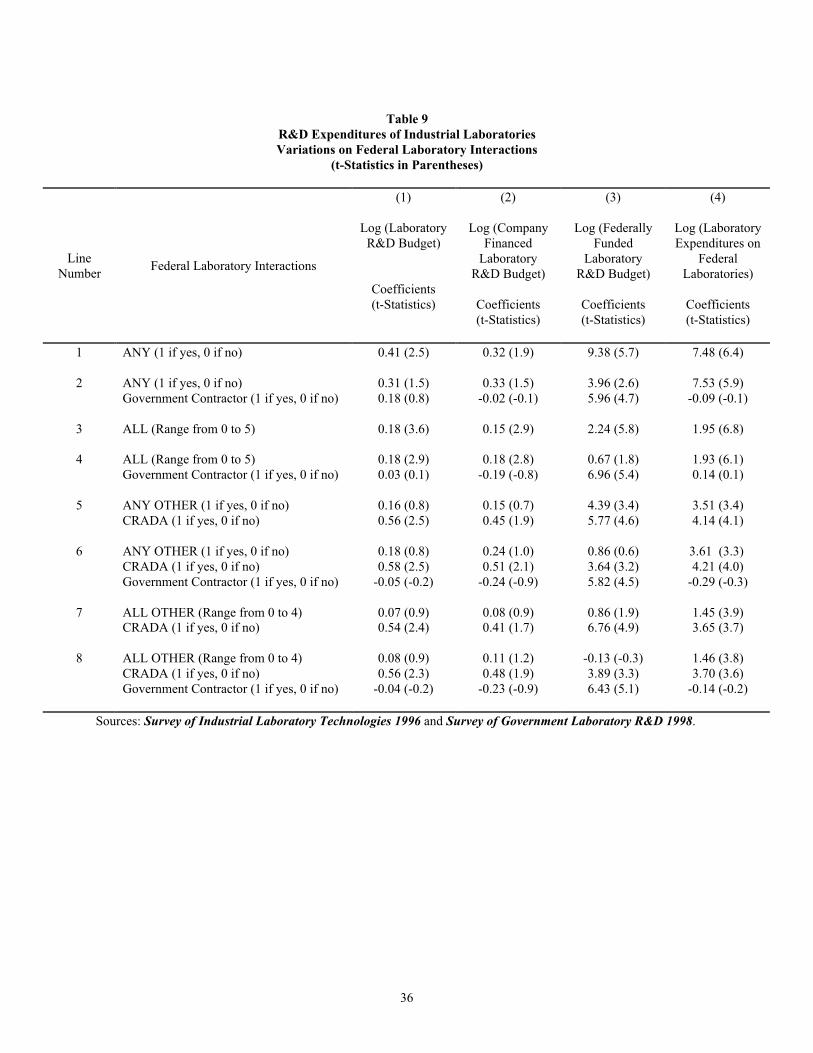
36
Table 9R&D Expenditures of Industrial LaboratoriesVariations on Federal Laboratory Interactions
(t-Statistics in Parentheses)
LineNumber
Federal Laboratory Interactions
(1)
Log (LaboratoryR&D Budget)
Coefficients(t-Statistics)
(2)
Log (CompanyFinanced
LaboratoryR&D Budget)
Coefficients(t-Statistics)
(3)
Log (FederallyFunded
LaboratoryR&D Budget)
Coefficients(t-Statistics)
(4)
Log (LaboratoryExpenditures on
FederalLaboratories)
Coefficients(t-Statistics)
1 ANY (1 if yes, 0 if no) 0.41 (2.5) 0.32 (1.9) 9.38 (5.7) 7.48 (6.4)
2 ANY (1 if yes, 0 if no)Government Contractor (1 if yes, 0 if no)
0.31 (1.5)0.18 (0.8)
0.33 (1.5)-0.02 (-0.1)
3.96 (2.6)5.96 (4.7)
7.53 (5.9)-0.09 (-0.1)
3 ALL (Range from 0 to 5) 0.18 (3.6) 0.15 (2.9) 2.24 (5.8) 1.95 (6.8)
4 ALL (Range from 0 to 5)Government Contractor (1 if yes, 0 if no)
0.18 (2.9)0.03 (0.1)
0.18 (2.8)-0.19 (-0.8)
0.67 (1.8)6.96 (5.4)
1.93 (6.1)0.14 (0.1)
5 ANY OTHER (1 if yes, 0 if no)CRADA (1 if yes, 0 if no)
0.16 (0.8)0.56 (2.5)
0.15 (0.7)0.45 (1.9)
4.39 (3.4)5.77 (4.6)
3.51 (3.4)4.14 (4.1)
6 ANY OTHER (1 if yes, 0 if no)CRADA (1 if yes, 0 if no)Government Contractor (1 if yes, 0 if no)
0.18 (0.8)0.58 (2.5)
-0.05 (-0.2)
0.24 (1.0)0.51 (2.1)
-0.24 (-0.9)
0.86 (0.6)3.64 (3.2)5.82 (4.5)
3.61 (3.3)4.21 (4.0)
-0.29 (-0.3)
7 ALL OTHER (Range from 0 to 4)CRADA (1 if yes, 0 if no)
0.07 (0.9)0.54 (2.4)
0.08 (0.9)0.41 (1.7)
0.86 (1.9)6.76 (4.9)
1.45 (3.9)3.65 (3.7)
8 ALL OTHER (Range from 0 to 4)CRADA (1 if yes, 0 if no)Government Contractor (1 if yes, 0 if no)
0.08 (0.9)0.56 (2.3)
-0.04 (-0.2)
0.11 (1.2)0.48 (1.9)
-0.23 (-0.9)
-0.13 (-0.3)3.89 (3.3)6.43 (5.1)
1.46 (3.8)3.70 (3.6)
-0.14 (-0.2)
Sources: Survey of Industrial Laboratory Technologies 1996 and Survey of Government Laboratory R&D 1998.
37
References
Adams, James D., Survey of Industrial Laboratory Technologies 1996, processed, Department of Economics,
University of Florida, 1997.
______________, Survey of Government Laboratory R&D 1998, processed, Department of Economics,
University of Florida, 1998.
______________, “The Structure of Firm R&D, the Factor Intensity of Production, and Skill Bias,” The Review of
Economics and Statistics 81 (August 1999): 499-510.
______________, “Learning and Internal Research: The Two Faces of R&D Revisited,” Working Paper, University
Of Florida, September 2002.
______________, and Adam B. Jaffe, “Bounding the Effects of R&D: An Investigation Using Matched Firm and
Establishment Data,” RAND Journal of Economics 27 (1996): 700-721.
Aghion, Philippe, and Jean Tirole, “The Management of Innovation,” Quarterly Journal of Economics 109
(November 1994): 1185-1209.
Bound, John, Clint Cummins, Zvi Griliches, Bronwyn H. Hall, and Adam B. Jaffe, “Who Does R&D and Who
Patents?” in Zvi Griliches, ed., R&D, Patents, and Productivity, Chicago: University of Chicago Press
for NBER, 1984.
Cockburn, Iain, and Rebecca Henderson, “Public-Private Interaction in Pharmaceutical Research,” Proceedings
of the National Academy of Sciences 93 (1996): 12725-12730.
Cohen, Linda R., and Roger G. Noll, “The Future of the National Laboratories,” Proceedings of the National
Academy of Sciences 93 (1996): 12678-12685.
Cohen, Wesley M., and Daniel A. Levinthal, “Innovation and Learning: the Two Faces of R&D,” The Economic
Journal 99 (1989): 569-596.
Defense Technical Information Center, Department of Defense In-House RDT&E Activities, U.S. Army Materiel
Development and Readiness Command, Alexandria, Virginia: various years.
Directory of American Research and Technology, 31st Edition, New Providence, New Jersey: R.R. Bowker,
1997.
Evenson, Robert, and Yoav Kislev, “Research and Productivity in Wheat and Maize,” Journal of Political
Economy 81 (1973): 1309-1329.
38
“Extreme Measures,” The Economist 158 (June 23, 2001).
Feldman, Maryann P., “The Entrepreneurial Event Revisited: Firm Formation in a Regional Context,” Industrial
And Corporate Change 10 (December 2001): 861-891.
Gould, William, and William Sribney, Maximum Likelihood Estimation with STATA, 1st ed., College Station,
Texas: STATA Press, 1999.
Greene, William H., Econometric Analysis, 4th Ed.: Upper Saddle River, New Jersey: Prentice-Hall, 2000.
Griliches, Zvi, and Ariel Pakes, “Patents and R&D at the Firm Level: A First Look,” in Zvi Griliches, editor, R&D,
Patents, and Productivity, Chicago, Illinois: University of Chicago Press for NBER, 1984.
Grossman, Sanford J., and Oliver Hart, “The Costs and Benefits of Ownership: A Theory of Vertical and Lateral
Integration,” Journal of Political Economy 94 (August 1986): 691-719.
Ham, Rose Marie, and David C. Mowery, “Improving the Effectiveness of Public-Private R&D Collaboration: Case
Studies at a U.S. Weapons Laboratory,” Research Policy 26 (1998): 661-675.
Hart, Oliver, Andrei Shleifer, and Robert W. Vishny, “The Proper Scope of Government,” Quarterly Journal of
Economics 112 (November 1997): 1127-1162.
Hausman, Jerry, Bronwyn Hall, and Zvi Griliches, “Economic Models for Count Data with an Application to the
Patents-R&D Relationship,” Econometrica 52 (1984): 909-938.
Heckman, James J., “Dummy Endogenous Variables in a Simultaneous Equation System,” Econometrica 46
(1978): 931-959.
Holmstrom, Bengt, and John Roberts, “The Boundaries of the Firm Revisited,” Journal of Economic Perspectives
12 (Fall 1998): 73-94.
Jaffe, Adam B., and Josh Lerner, “Reinventing Public R&D: Patent Policy and the Commercialization of National
Laboratory Technologies,” Rand Journal of Economics 32 (Spring 2001): 167-198.
Jensen, Richard, and Marie Thursby, “Proofs and Prototypes for Sale: The Licensing of University Inventions,”
American Economic Review 91 (March 2001): 240-259.
Johnson, Norman L., and Samuel Kotz, Discrete Distributions, Boston: Houghton-Mifflin, 1969.
Klette, Tor Jakob, Jarle Moen, and Zvi Griliches, “Do Subsidies to Commercial R&D Reduce Market
Failures? Microeconomic Evaluation Studies,” Research Policy 29 (April 2000): 471-496.
Krugman, Paul, The Age of Diminished Expectations, revised and updated edition, Cambridge, Massachusetts:
39
MIT Press, 1994.
Maddala, G. S., Limited-Dependent and Qualitative Variables in Econometrics, Cambridge, UK: Cambridge
University Press, 1983.
Markusen, Ann, and Michael Oden, “National Laboratories as Business Incubators and Region Builders,”
Journal of Technology Transfer 21 (1996): 93-108.
Mowery, David C., and Nathan Rosenberg, Paths of Innovation: Technological Change in 20th Century
America. New York: Cambridge University Press, 1998.
National Aeronautics and Space Administration, Office of General Counsel, “Space Act Agreements,” 2001,
http://www.hq.nasa.gov/ogc/samanual.html.
National Research Council, Board on Science, Technology, and Economic Policy, Trends in Federal Support of
Research and Graduate Education. Washington, D.C., National Academy Press, 2001.
National Science Board, Science and Engineering Indicators, 1998. Washington D.C., U.S. Government Printing
Office, 1998.
National Science Foundation, Federal Funds for Research and Development. Washington D.C., U.S.
Government Printing Office: various years.
Olley, G. Steven, and Ariel Pakes, “The Dynamics of Productivity in the Telecommunications Industry,”
Econometrica 64 (1996): 1263-1298.
Schacht, Wendy H., “Patent Ownership and Federal Research and Development (R&D): A Discussion on the
Bayh-Dole Act and the Stephenson-Wydler Act,” Washington, DC: Congressional Research Service,
Document RL30320, December 11, 2000.
Scherer, F. Michael, “Firm Size, Market Structure, Opportunity, and the Output of Patented Inventions,” American
Economic Review 55 (December 1965): 1097-1123.
Shleifer, Andrei, “State versus Private Ownership,” Journal of Economic Perspectives 12 (Fall 1998): 133-150.
Standard and Poor ’s Compustat, Englewood, Colorado: McGraw-Hill, 1994.
U.S. General Accounting Office, GAO/RCED/NSIAD-96-78R, Federal R&D Laboratories. Washington D.C.,
U.S. Government Printing Office, 1996.
U.S. Department of Commerce, Technology Administration, Office of Technology Policy, Tech Transfer 2000:
Making Partnerships Work. Washington D.C., U.S. Government Printing Office, 2000.

40
U.S. National Institutes of Health, Office of Technology Transfer, “CRADAs and MTAs,” 2001,
http://ott.nih.gov/NewPages/crada-mn.html
U.S. Patents Database, Baltimore, Maryland: Community of Science, Inc., 1999.