Embed Size (px)
Citation preview
PHYSIOLOGICAL REVIEWS Vol. 55, No. 4, October 1975
Printed in U.S.A.
Dimensional Analysis and Theory of Biological Similarity
B. GtiNTHER*
Departamento de Medicina Experimental, Facultad de Medicina, Universidad de Chile, Santiago, Chile
I. Introduction. ...................................................... 659 II. Brief History. ...................................................... 660
III. Modern Theories of Biological Similarity. .............................. 661 IV. Different Similarity Criteria. ......................................... 662
A. Geometric similarity. ............................................. 662 B. Physical and biological similarities. ................................. 664
V. Organisms as Mixed Regimes, ........................................ 671 VI. Allometric Equations : Theoretical Foundation. ......................... 673
VII. Empirical Allome tric Equations. ...................................... 675 A. Morphometric studies. ............................................ 675 B. Physiometric studies. ............................................. 677
VI I I. Empirical Allometric Equations, Theoretical Reduced Exponents, and Optimality Principles. ........................................... 687
IX. Possible Relationships Between Two Allometric Equations. ............... 688 X. Dimensionless and Invariant Numbers. ................................ 689
A. Allometric canceling technique. .................................... 690 B. Matrix method .................................................. 691 C. Invariant number of mammalian circulatory system. .................. 691 D. Invariant number of respiratory system of mammals. ................. 692 E. Invariant number of cardiorespiratory system of mammals. ............ 692
XI. Iconic Treatment of Physiological Problems. ........................... 693 A. Block diagram of systemic circulation of mammals. ................... 693 B. Block diagram of gas transport system: blood, circulatory, and respiratory
systems. ....................................................... 694 C. Signal-flow diagram of cardiovascular system of mammals. ............. 695
XII. Summary. ......................................................... 695
I. INTRODUCTION
Structures and functions of all living beings, irrespective of their size, can be studied by means of some basic physical methods, viz., dimensional analysis and theories of similarity.
Unicellular and multicellular organisms have almost the same protoplasmic composition (proteins, lipids, carbohydrates, minerals, and water) and are sub- jected to similar physical and chemical influences from the environment. Conse- quently the organismic machinery can be considered from both a structural and a functional point of view as a harmonious assembly of parts, yielding at all instances
* Present address : Instituto de Ciencias Medico-Biologicas, Departamento de Fisiopato- logia, Universidad de Conception, Chile.
659

660 B. GijNTHER Volume 55
throughout the life of each organism a perfectly integrated whole, or in the words of Claude Bernard (3) an “ensemble harmonique.”
The theory of models, widely used in physics and technology, can also be successfully applied in biology for obtaining numerical solutions for any biological function definable in terms of the three-dimensional A4LT system (M = mass, L = length, T = time).
Furthermore, from only a few postulates it has been possible to derive a con- sistent tlieory of biological similarities, if organisms are considered as “mixed regimes” obeying simultaneously various similarity criteria, as for instance : I) rules that have been established for mechanical or dynamic processes and are valid for ItK Whulc uqanism; L”) kinematic events concerning organ functions; or 3) hydro- dynamic or transport processes, which should be applied when dealing with events at cellular or molecular levels.
Finally, a set of dimensionless and invariant numbers has been obtained algebraically that is valid for multivariable morphophysiological systems. These nllmeriral relationships are independent of the size of the organisms considered.
Therefore behind the complexity and astonishing variety of forms and func- tions quantitative criteria of similarity for all living beings have been disclosed.
II. BRIEF HISTORY
The rules of geometric similarity, in particular those applying to polygons, have been known since Euclid’s time (300 B.C.). Later, Archimedes (287-2 12 B.C.) established that for “similar” geometrical bodies the corresponding surfaces increase as the square and the volumes increase as the cube of linear dimensions.
More than 300 years ago Galileo (1564-1642) not only discussed geometrical similarity of terrestrial and aquatic animals of different sizes, but also introduced dynamical aspects, particularly regarding the strength of bones. Galileo concluded that neither terrestrial animals nor trees can grow beyond a certain size. He ad- vanced two solutions for the physical problems involved : I) a change of the relative proportions of an animal, and 2) harder and stronger materials are needed as the size of the animal increases. By way of illustration on the subject, Galileo pointed out that: “A dog could probably carry two or three such dogs upon his back; but I believe that a horse could not carry even one of his own size.”
Borelli (1608-l 679), the leader of the iatrophysical school of medicine, estab- lished that the “force” of a muscle varies in proportion to its cross-sectional area, whereas the “energy” that the muscle is able to deliver apparently varies in pro- portion to its volume. He also calculated that two animals of similar build, but of different size, can jump the same actual height and that the maximal velocity they can reach is constant.
Newton (1642-1727) established the general rules for “mechanical” similarity, since his physical similarity is the starting point for all modern theories on bio- logical similarity. However, the symbols of dimensional analysis used in physics as well as in biology were introduced by Maxwell (183 l-1879).
Spencer (1820-l 903) studied the growth-limiting factors and concluded that

October 1975 THEORY OF BIOLOGICAL SIMILARITY 661
assimilation processes occur at certain surfaces, so that as growth proceeds the ‘%urface-volume ratio” becomes progressively smaller, making any further increase in size impossible.
Von Hoesslin (38), based on the dimensional analysis of various functions, concluded that the “power” developed by similar animals of different size varies in
proportion to a characteristic surface and that the “work” performed is correlated to the corresponding volumes. He also established that all animals belonging to the same model are capable of attaining the same maximal speed and that the fre- quency of a particular movement is correlated to the size of the animal.
In 19 17 Thompson (75) introduced dimensional analysis and similarity cri- teria into general biology. He carefully studied the locomotion of terrestrial animals and the flight of birds and insects from a physical point of view. The scale effects and the principle of similarity are discussed in his fascinating book On Growth and Form, which has since become a classic.
Putter (6 1) published in 1917-l 920 several papers on the problem of physio- logical similarity, in his Studien iiber physiologische k’hnlichkeit. He made extensive use of empirical exponential equations for describing quantitative aspects of growth and of many other functions.
III. MODERN THEORIES OF BIOLOGICAL SIMILARITY
A preliminary note on the subject was submitted on January 10, 1927 to the French Academy of Sciences by Lambert and Teissier (47), and that same year they published the first extensive study entitled Thtbie de la similitude biologique (48)) which is the starting point for all subsequent developments.
It might be worthwhile to transcribe the main a priori ideas of these authors: “que certains lois physiologiques obtenues experimentalement ne sont que I’expression des PropritWs mlcaniques ou lnergetiques tr2s gt?Xrales et peuvent A?re e’tablies par voie dlductive
* a partzr des d&nitions des diverses grandeurs en jeu (longueur, masse, tern@, force, travail, puissance . . .).”
The French authors employed Newton’s dimensional analysis and the rules holding for any mechanical similarity in which X corresponds to the length ratio (L I/&) between prototype1 and model, 7 to the time ratio (Tl/ Tz), p to the mass ratio (Ml/M 2), and <p to the force ratio (Fl/‘Fz).
They further assumed: 1) the constancy of “density” of homologous organs and organisms and 2) that the time ratio (7) is equivalent to the length ratio (X).
It follows that :
This equation means that the “efficiencies” (Ki) of homologous transforma- tions are the same in homologous organisms.
From the dimensional analysis of any function definable in terms of the mass
(ML length (0, and time (T) system, it is possible to deduce the corresponding
l Prototype means a large- or small-scale organism to which a model is geometrically or physically related.

662 B. GtiNTHER Volume 5.5
power function of the length ratio (A), as shown in a reproduction of the original table :
Longueur ............... h = L Masse.. ................ p=M=‘h3 Temps.. ................ z = T--h Surface.. ............... s =Le=h2 Fdquence ............... f = T-l = h-4 Vitesse ................. v =LT-4 =l Accklhation. ............ Y =LT--2=1-” Force .................. y = MLT-2 = P Travail. ................ hergie
) ................. ) W= ML” T-2 = ‘h3
Puissance. .............. E = ML2T-3 = P D&bit.. ................. 6 =MT4 =P
Lambert and Teissier (48) emphasized the purely formal nature of the theory of biological similarity, because neither the mechanisms involved nor the causal relationships among variables are part of the theory. They discussed not only the theoretical foundations, but also the corresponding experimental findings, i.e., basal metabolic rate, heart frequency, respiratory rate, gestational period, growth processes, etc.
Subsequent developments (21, 23-28, 67-69) are discussed in this review.
IV. DIFFERENT SIMILARITY CRITERIA
A. Geometric Similarity
Two systems are said to be geometrically similar when parts of the model (m) have the same shape as the corresponding parts of the prototype. Hence, two points (PI and P2) that correspond to each other are homologous points. In consequence, in two solids (& and S,) the three-dimensional coordinates of two homologous points (PI and &) are xl, yl , and ~1 for PI, and x2, ~2, and ~2 for P2.
2’1 and P2 are homologous if the following condition holds:
Xl y1 a -c-c-= x (I) x2 y2 z2
where X is a constant ratio. In biology, complete geometrical similarity between prototype and model
animals is not observed frequently. For instance, an elephant is not a geometrically enlarged rat nor is a dog a miniaturized horse.
It is common to observe that xl/x2 = Xl and y1/y2 = Z~/ZZ = X2 ; or we may even deal with completely distorted geometrical relationships, where x 1/x2 = Xl , whereas yl/y2 = X2 and <l/z2 = Xa . These models have been extensively described by Thompson (75) in his remarkable study.

October I975 THEORY OF BIOLOGICAL SIMILARITY 663
t I i L2 I
I I-. L, L2
1
-a l-4
x=2
FIG. 1. Geometric representation of length ratio (X), area ratio (X2), and volume ratio
04.
It is possible to extend geometrical similarity criteria to the relationship between homologous areas belonging to both prototype and model :
(2)
For two solids, whose respective volumes are Vi and Vz, the similarity condi- tions can be defined as:
In conclusion, geometric similarity can be characterized by the constancy of the length ratios (A), the area ratios (X2), and the volume ratios (X3), as shown in Fig. 1.
In this paper body weight (IV) is used extensively as a reference system. If we assume that the density (p) of prototype (6) and model (m) is practically the same, because both organisms have a similar body composition, and assume further that gravitational acceleration (g) is practically constant on earth, we may write the following ratios :
w PC MP- VP- x3
Wm Mm Vm (4)
where M = mass. For geometrically similar animals Kleiber (46) advocated the following length
ratio :

664 B. GUNTHER
LP L, -=- Wp1’3 Wm1’3
Then, for an area ratio (A) Kleiber obtained:
AP An -=- w 213
P w 2/3 m
Finally, for the volume ratio (V) we have:
v, vrn -=- wp wn
Volume 55
(5)
(6)
(7)
B. Physical and Biological Simikarities
It must be emphasized that in the biological world physical similarity, which we shall discuss now, is assured by the systematic departure from geometric similar- ity (19). Furthermore, the organism changes geometrically, SO as to remain the same physiologically, and a constant efficiency of many body functions can only be achieved by systematic size-correlated alterations of physical shape (9).
Among the more important reference works on dimensional analysis and physical similarity are treatises of Birkhoff (7), Bridgman (8), Duncan (1 Z), Focken (13), Ipsen (41), Johnstone and Thring (42), Langhaar (49)) Levi-Civita and Amaldi (53), and Sedov (66).
Four kinds of criteria can be applied to define a physical similarity: I> dy- namic, 2) kinematic, 3) hydrodynamic, and 4) thermic. Therefore : I) two systems are said to be dynamically similar if homologous parts of the systems experience similar net forces; 2) kinematic similarity exists when the motions of two systems are similar: that is, if homologous particles lie at homologous points at homologous times; 3) for hydrodynamic similarity Ipsen (41) has established that “In similar flows, involving Reynolds number, the ratio of inertial to viscous forces must be the same at corresponding points” ; and a) thermic similarity exists between prototype and model when temperature distribution and heat flow at homologous areas are both similar.
In this review extensive use is made of the three-dimensional system intro- duced in physics by Maxwell, based on the concepts of mass (M), length (L), and time ( T).
Any variable (Q) can be defined in the model as a power function of the following kind :
Q 1 = Mla*L+ T,r (8)
For the prototype the same variable can be defined as:
Q 2 = M2*-L2@- T27 (9)
It is now possible to establish a quantitative relationship between both func- tions by means of Newton’s reduction coefficient (x) :
QJ x=- Q2 (N

October I975 THEORY OF BIOLOGICAL SIMILARITY 665
Finally, the mass ratio A&/A& = p, the length ratio Ll/Lz = X, and the time ratio Tr/Tz = r are introduced into equation 10, yielding:
The basic assumptions of the four independent physical similarity criteria are shown in Table 1, and from the dimensional analysis and the corresponding scale equations it is possible to obtain the general similarity equations.
1. Mechanical O?- dynamic similarity criteria
The mechanical similarity scale equations lead to p = X3 and 7 = P2, and if these values are introduced into equation I1 we obtain:
or x = ~3~~p.py
(12)
x= X3”+ Is+ WY w
and if instead of the length ratio (X = LI/L~) we use the mass ratio (p = M l/Mz) or the weight ratio (w = WI/W,), equation 13 becomes
which also appears in the last column of Table 1. For all other physical similarity criteria the algebraic procedure is identical and is summarized in Table 1.
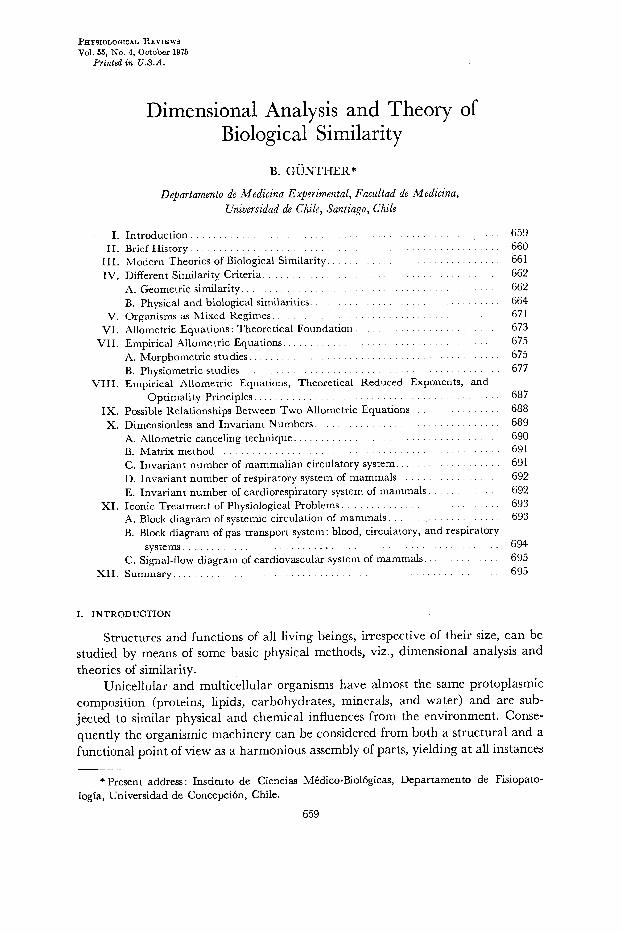
Table 2 contains 28 physical entities of physiological interest, their correspond- ing definitions, physical dimensions (MLT system), and the procedure for cal- culating the exponent of the weight ratio (u). In the last column, the reduced ex- ponent (6) is shown, in order to be able to compare the theoretically calculated exponents to the empirically obtained values, in accordance with the well-known allometric equation2 set up by Huxley (40), saying that:
y = a*Wb (15)
where y = any function that can be defined in accordance with the MLT system, a= empirical parameter, W = body weight, and b = reduced exponent.
The discrepancy between the theoretically predicted reduced exponents (eq. 14 and Table 2) and the experimental findings prompted Lambert and Teissier (47) to abandon the mechanical similarity criteria to seek a better theoretical foundation.
2. Kinematic or biological similarity
By assuming the constancy of body composition and the equivalence between the length and the time ratios, Lambert and Teissier (47, 48) proposed the following general equation :
X = @! + l/3/3 f l/37 (16)
2 Allometry has been derived from the Greek : iiXXos = different; &pou = measure.

TABL
E 1.
Fou
r ph
ysica
l sim
ilarit
y cr
iteria
of
biol
ogica
l im
porta
nce
in ac
cord
ance
with
m
ass
(AI),
len
gth
(L),
time
(T),
and
tem
pera
ture
(to
> sy
stem
and
as f
unct
ions
of
bod
y we
ight
ra
tio
(w>
Item
Si
mila
rity
Crite
ria
Post
ulat
es
Dim
ensio
nal
Anal
ysis
Scal
e Eq
uatio
ns
Gene
ral
Sim
ilarit
y Eq
uatio
ns
A Me
chan
ical
or dy
nami
c I)
Body
de
nsity
=
cons
t. 2)
Acce
lerati
on
of gra
v- vit
y =
cons
t.
B Ki
nema
tic
or bio
logica
l 1)
Body
de
nsity
=
cons
t. 2)
Leng
th
ratio
(L
l/Lz>
eq
ual
to tim
e ra
tio
WI/T
21
C Hy
drod
ynam
ic or
trans
- 1)
Reyn
olds
numb
er
= po
rt co
nst.
.u=
veloc
ity,
2) Ki
nema
tic
visco
sity
D =
diame
ter
= co
nst.
D Th
erma
l I)
Body
de
nsity
=
cons
t. [H
] =
ML2e
T-
2 2)
Spec
ific
heat
= co
nst.
8 =
t0Jt
02
3) He
at flo
w pe
r ar
ea
time
= co
nst.
M/V
= 1.0
LT
-2 =
1.0
M/V
= 1.0
wJ
52
= TO
-2
Re
u* D
=-
V
Cl y
= L2
’ T-1
M/V
= 1.0
H/
Met”
= 1.0
H/
AeT
= 1.0
px3
= 1.0
X
= W
a +
l/3/9
+
116~
x*7-
2 =
1.0
X
= W
a +
1138
+
li3y
.P
x2’ T
--l =
1.0
X
= c3
a +
l/3/3
+
2i3y
p*r3
=
1 .o
X =
(&p
+ l/3
@
+ 1i
3y
+ O
S
~2',=
-2*@
--1
= 1.
0
&h'T
-3
= 1.
0
October 1975 THEORY OF BIOLOGICAL SIMILARITY
TABLE 2. Dimensional analysis, physical entities, and calculation of reduced exponents corresponding to mechanical similarity criteria (eq. la>
667
Item Physical Entity Description Dimensions Theoretical
Reduced M T Exponent a s” Y UO
1 Acceleration
8
9
10
11
I2
13
I4
15
16
17
18 Momentum
19 Moment of
21 Power
22 Pressure ; stress
23 Resistance to flow
24 Surface tension
25 Torque
26 Velocity
27 Viscosity (dynamic)
Action
Area
Conductance
Compliance
Density
Elastic modulus
Energy ; work
Flow
Force
Frequency
Heat quantity
Impulse
Inertia
Length
Mass
Mass generation
Period
inertia
Volume
Rate of change of velocity
Work X time
Length squared
Flow per unit pressure
Distensibility
Mass per unit volume
Stress
Force X distance
Volume per unit time
Mass X acceleration
Inverse of time
Calories
Force X time
Resistance to change of
state
Fundamental unit of space
Quantity of matter
Production of a sub-
stance
Mass X velocity
Effectiveness of mass in
rotation
Time of one complete revolution
Work per unit time
Force per unit area
Pressure difference per unit flow
Force per unit length
Effectiveness to produce rotation
Distance per unit time
Resistance to change of form
Length cubed
0
1
0
-1
-1
1
1
1
0
1
0
1
1
1
0
1
1
1
1
0
1
1
1
1
1
0
1
0
1
2
2
4
4
-3
-1
2
3
1
0
2 1
0
1
0
0
1
2
0
2
-1
-4
0
2
1
-1
3
-2
-1
0
1
2
0
-2
-2
-1
-2
-1
-2
-1
0
0
0
-1
-1
0
1
-3
-2
-1
-2
-2
-1
-1
0
0.00
1.50
0.66
0.50
0.66
0.00
0.33
1.33
0.83
1 .oo
-0.16
1.33
1.16
1 .oo
0.33
1 .oo
0.83
1.16
1.66
0.16
1.16
0.33
-0.50
0.66
1.33
0.16
0.50
1 .oo
Interestingly, the reduced exponents (b) calculated according to equation 16 are in close agreement with the experimental findings. Nevertheless, the predictive value of the above-mentioned theory could be improved further by introducing the operational-time concept [Giinther and Martinoya (33)], thus finally yielding the

668 B. GUNTHER Volume 55
following equation :
x = oar + l/3/3 + 1/3Q--O.O65~ WI
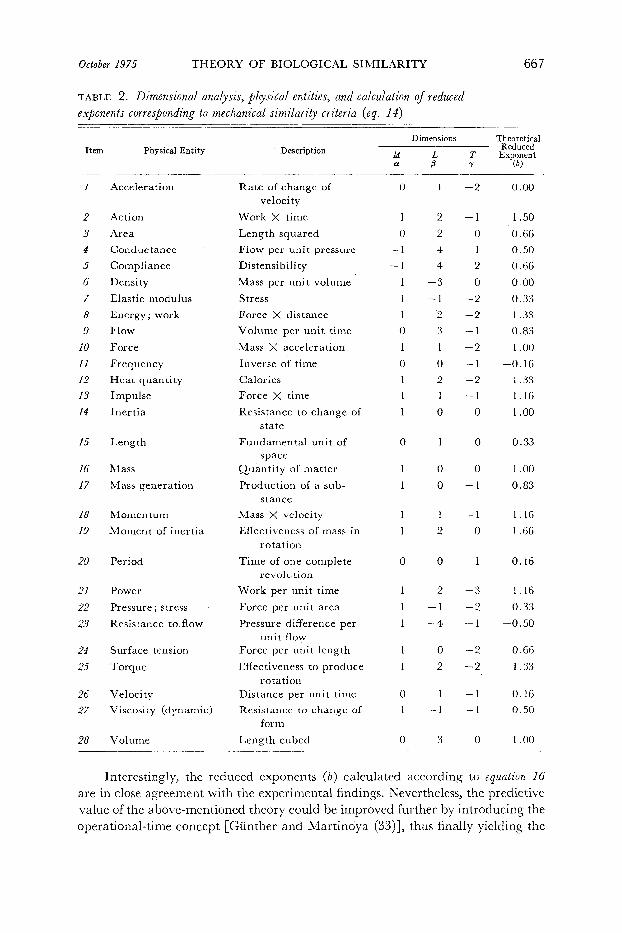
where - 0.065 = empirical correctioli factor of the operational-time exponent I’, whose numerical value is I = 1 when a clock is actually used during the experi- ment; I? = - 1 when we are dealing with an experimental frequency, and I? = 0 when no clock is used during the experiments.
The numerical correction factor (- 0.065) is empirical since it represents the difference between theoretical and experimental values of two functions that have been statistically well established in physiology, namely, basal metabolic rate and heart rate of mammals. For the metabolic rate we have in theory (eq. IS) an ex- ponent b = 0.66(6) and in actual practice b = 0.734, yielding a difference of 0.067; for heart frequency the difference is obtained from -0.33(3) and -0.27, which yields 0.063. In order to improve the predictive capacity of the original theory of similarity advocated by Lambert and Teissier (47, 48)) we have proposed for this correction factor of the operational time a mean value of -0.065.
In Table 3, dimensional analysis, calculation of the reduced exponent (b), and introduction of the operational-time concept for 16 different functions of biological interest are shown.
3. Hydrodynamic and transport sim ilar it ies
Hydrodynamic similarity is based on the constancy of the Reynolds’ number (Re) and of the kinematic viscosity (v) in both prototype and model (see Table 1, item C).
If the corresponding scale equation is introduced into Newton’s reduction coefficient (eq. 11) we obtain:
Table 4 shows the dimensional analysis of 16 variables and their corresponding reduced exponent (6) calculated according to equation 16.
The transport similarity then can be derived from the general equation:
dA - 2z dT
-KS d(fw) dx
where A = any quantity that is transported, T = time, K = diffusion constant, S = area through which the transport process takes place and that is perpendicular to the transport process, x = direction of transport, and V = volume.
The dimensional analysis of equation 19 leads to :
[K] = L2. T-’
and the corresponding scale equation reads as follows :
1.0 = X2*7+ or 7 = X2
These results are independent of the dimensions and the nature of the trans-
October 1975 THEORY OF BIOLOGICAL SIMILARITY
TABLE 3. I)imensional analysis of 16 diferent j‘knctions, determination of operational-time factor, and calculation of reduced exponent (b)
669
Item Functions
Physical Dimensions Reduced Opera- Exponent t ional- Numerical Theoretical
M T ~‘+--~g ;” Time Value of Reduced Factor -0.065 I Exponent
a Y + f/3Y 07
w
-____- -~ - -
2
3
4
5
6
7
8
9
10 II
12
13 14
I5
16
Area
Compliance
Energy ; work
Force
Frequency
Length
Mass
Mass flow
Period
Power
Pressure ; stress
Resistance to flow
Tension
Velocity
Volume
Volume flow
-
1
2
4
2
1
0
1
0
0
0
2 -1
-4
0
1
3
3
0
2
-2
-2
-1
0
0
-1
1
-3
-2 -1
-2 -1
0
-1
0.66 0 0 0.66
1 .oo 0 0 1 .oo
1 .oo 0 0 1 .oo
0.66 0 0 0.66
-0.33 -1 0.065 -0.27
0.33 0 0 0.33
1 .oo 0 0 1 .oo
0.66 -1 0.065 0.73
0.33 1 -0.065 0.27
0.66 -1 0.065 0.73
0.00 0 0 0.00
-0.66 1 -0.065 -0.73
0.33 0 0 0.33
0.00 -1 0.065 0.07
1 .oo 0 0 1 .oo
0.66 -1 0.065 0.73
ported item A. For this reason the general transport equation (eq. 19) is valid for either mass transport or for the transfer of momentum (24).
4. Thermal similarity
Two attempts have been made to apply similarity criteria to heat-generation and heat-loss processes in homeotherms (3 1, 52). In the first attempt, five funda- mental variables were employed [<mass (M), length (L), time (T), heat (H), and temperature (t)], whereas in the second only four variables were necessary (M, L, T, t) and only three postulates had to be established in order to get the correspond- ing reduction coefficients (see Table 1, item D).
\
Since p = X3 is valid for the first postulate, we can write the third postulate as x37-3 = 1.0, and consequently we obtain, surprisingly enough, Lambert and Teissier’s (48) original second postulate, namely r = X (Table 1, item B). Finally, we have to introduce this scale equation (7 = A) into the second scale equation in order to get 6 = X0.
Thus, the reduction coefficient (x) can be defined as:
x = &3(3cr + B + y + OS> WI
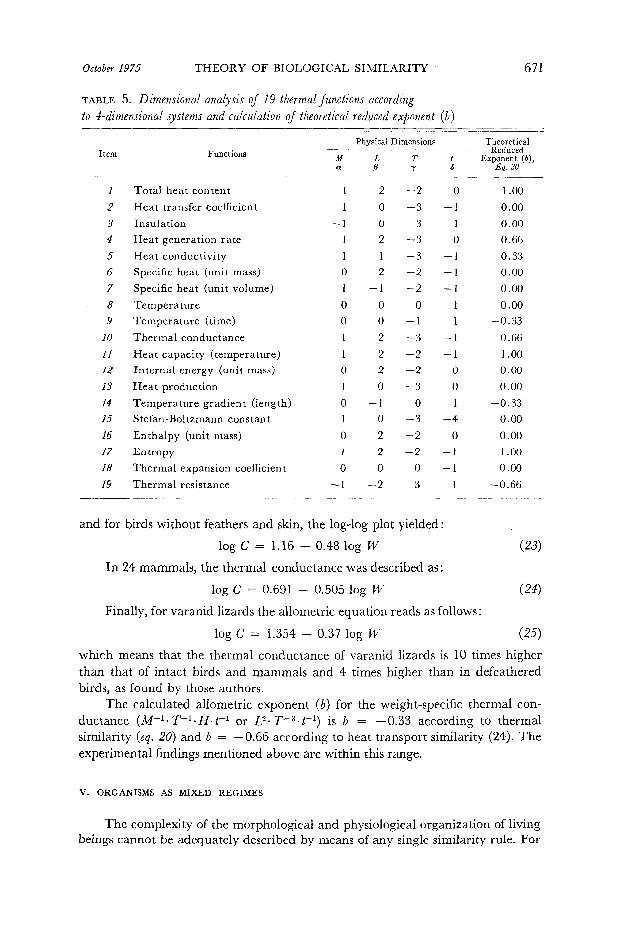
Table 5 shows the dimensional analysis of 19 thermal functions and their reduced exponents (b) calculated according to equation 20. We may add that the

670 B. GUNTHER Volume 55
TABLE 4. Dimensional analysis and calculation of theoretical reduced exponent (b) in accordance with transport or hydrodynamic similarity
Item Functions Physical Dimensions
Theoretical Reduced M T Exponent (b), Eq. 18 a s” Y
I
2
3 4 5 6 7 8 9
10 11 I2 13 I4 15 16
Area
Density
Diffusivity
Energy ; work
Force
Frequency
Length
Momentum
Power
Pressure
Surface tension
Velocity
Viscosity (dynamic)
Viscosity (kinematic)
Volume
Volume flow
0
0
1
0
0
2 0 -3 0
2 -1
2 -2 1 -2
0 -1
1 0
1 -1
2 -3 -1 -2
0 -2 1 -1
-1 -1
2 -1
3 0 3 -1
0.66 0.00 0.00 0.33 0.00
-0.66 0.33 0.66
-0.33 -0.66 -0.33 -0.33
0.00 0.00 1 .oo
0.33
introduction of the notion of operational time into equation 20 might perhaps im- prove the predictive value of the theory.
Unfortunately, only a few references on thermal characteristics could be found in the literature concerning interspecies measurements. Morrison and Ryser (58), in a systematic study on body temperature of mammals as a function of body weight, have concluded that body temperature is independent of body size, even though body weights covered a range of 1: 106. This experimental finding is in accordance with the theoretically predicted exponent (b = 0.00) for body tem- perature (Table 5, item 8).
Thermal insulation (L2. To H-l* t or M-l l T3 l t) of the winter fur of arctic animals in relation to body weight is practically invariant from the size of a fox (5 kg) to the size of a moose (> 500 kg), as has been shown by Scholander et al. (65). The theoretical exponent is b = 0.00 in accordance with equation 20 of thermal similari tv.
Conversely, the weight-specific thermal conductance (cal l g-l l h-l l “C-l) in birds, mammals, and lizards has been studied by Eerried and Kessel (37). For intact birds these authors found that the thermal conductance (C) can be defined as follows :
log c = 0.66 - 0.52 log W (34
the body weight (W) being given in grams. In birds without feathers they found:
log c = 0.86 - 0.44 log W (22)
October I975 THEORY OF BIOLOGICAL SIMILARITY 671
TABLE 5. Dimensional analysis of i’9 thermal functions according to a-dimensional systems and calculation of theoretical reduced exponent (b)
Item Functions Physical Dimensions Theoretical
Reduced *I4 T Exponent (b), a s” Y t3 Eq. 20
I Total heat content
2 Heat transfer coefficient
3 Insulation
4 Heat generation rate
5 Heat conductivity
6 Specific heat (unit mass)
7 Specific heat (unit volume)
8 Temperature
9 Temperature (time)
IO Thermal conductance
II Heat capacity (temperature)
I2 Internal energy (unit mass)
13 Heat production
14 Temperature gradient (length)
I5 Stefan-Boltzmann constant
16 Enthalpy (unit mass)
17 Entropy
18 Thermal expansion coefficient
I9 Thermal resistance
1
1
-1
1
1
0
1
0
0
1
1
0
1
0
1
0
1
0
-1
2
0
0
2
1
2
-1
0
0
2
2
2
0
-1
0
2
2
0
-2
-2
-3
3
-3
-3
-2
-2
0
-1
-3
-2
-2
-3
0
-3
-2
-2
0
3
0
-1
1
0
-1
-1
-1
1
1
-1
-1
0
0
1
-4
0
-1
-1
1
1 .oo
0.00
0.00
0.66
0.33
0.00
0.00
0.00
-0.33
0.66
1 .oo
0.00
0.00
-0.33
0.00
0.00
1 .oo
0.00
-0.66
and for birds without feathers and skin, the log-log plot yielded :
log C = 1.16 - 0.48 log W
In 24 mammals, the thermal conductance was described as:
log C = 0.691 - 0.505 log w
Finally, for varanid lizards the allometric equation reads as follows:
log c = 1.354 - 0.37 log w
which means that the thermal conductance of varanid lizards is 10 times higher than that of intact birds and mammals and 4 times higher than in defeathered birds, as found by those authors.
The calculated allometric exponent (6) for the weight-specific thermal con- ductance (M-lo T-VI- t-l or L2 l TG3. t-l) is b = - 0.33 according to thermal similarity (eq. 20) and b = -0.66 according to heat transport similarity (24). The experimental findings mentioned above are within this range.
V. ORGANISMS AS MIXED REGIMES
The complexity of the morphological and physiological organization of living beings cannot be adequately described by means of any single similarity rule. For

672 B. GUNTHER Volume 55
this reason, it is necessary to treat this kind of situation as “mixed regimes” in the technological sense [ Johnstone and Thring (42)].
The possible similarity range varies from the mechanical or dynamic similarity criterion (7 = X1j2) up to hydrodynamic or transport similarity (7 = X2), with the kinematic or main biological similarity (7 = X) placed halfway.
As a general rule, we may state that dynamic similarity is the main factor when we are analyzing mechanical problems, where gravitational forces pre- dominate-movements of the head, legs, and of the body in general, related to skeleton, joints, and tendons and caused by the contraction of striated musculature.
Kinematic or biological similarity criteria should be applied when we are dealing with the functions of organs (heart, lungs, liver, kidneys, etc.) and their association into systems (circulation, respiration, metabolism, absorption, excre- tion, etc.).
Finally, hydrodynamic or transport similarity is particularly valid at the cellular and molecular level; such as, for instance, the viscous properties of air and blood, the various diffusion processes at the air-blood barrier and at the capillary- cell exchange boundary, as well as heat transfer along the organism, from the mito- chondrial level up, the blood transport system, until the outer surface of the body is reached, where heat transfer is performed through radiation, convection, and evaporation.
In conclusion, no single similarity criterion can provide a satisfactory quanti- tative explanation for every single function of an organism that can be submitted to dimensional analysis.
The idea of mixed regimes had been formulated in 1838-1839 by Sarrus and Rameaux (64) in their communication to the Royal Academy of Medicine in Paris : Yorsque la nature peut atteindre un but par plusieurs moyen, elle n’emploie jamais exclusivement l’un d’eux jusqu’aux limites, elle les fait concourir de man&e que chacun de ces moyens tend a produire une part lgale de 19efet total. ”
The main differences between various similarity criteria are related to the coefficient for the time ratio exponent (y), whereas the parameters of the mass ratio exponent (a) and of the length ratio (p) are invariant, as shown below:
Similarity Criteria
Dynamic or mechanical Kinematic or biological Hydrodynamic or transport
Parameters of Exponents for
Mass a Length /3 Time y
1 l/3 l/6 1 113 l/3 1 l/3 z/3
McMahon (56) has proposed an alternative pathway to the problems of size, shape, and metabolic rate in mammals by applying elastic stability criteria in rela- tion to buckling and bending loads in animals of different size. The quasi-cylindri- cal elements that make up the whole animal have a length @)-to-diameter (d) ratio of approximately 10, and each length (I) increases as the $4 power of the cor- responding diameter (d). In consequence, the whole body surface should be pro- portional to the product of both factors (Id). Now, when length is expressed as a
October 1975 THEQRY OF BIOLOGICAL SIMILARITY 673
function of body weight (I a W4), and also diameters (da VV8), this yields for the surface area of the body IW8 or W”*63. Thus, the present model agrees with the experimental observations (see Table 12, item I).
A second assumption is necessary [McMahon (56)] based on the constancy of the tensile strength of a muscle (a = F/A) and of its shortening velocity (AZ/At), in order that the power output of a particular muscle depend only on its cross- sectional area (A). Since this area is a function of d2, then the maximal power out- put is proportional to ( W3/8)2 = ?V”*75, This fractional power of body weight is equivalent to Kleiber’s law of energy metabolism as a function of body weight.
Finally, from the proportionality of lung volumes (VL) to body weight (IV), and from the fact that alveolar ventilation (VA) goes as W”.75, the same author came to the conclusion that the respiratory frequency (pr) must scale as W-o*25, which is in close agreement with the empirical and theoretical allometric exponent for this function (see Table 11, item 9; Table 12, item IO).
In the approach of McMahon (56), three independent assumptions were necessary in order to deduce the numerical values of the allometric exponents (b) for the total surface area of the body, the metabolic rate, and the respiratory fre- quency. This is in contrast with the general theory of biological similarities, as mentioned above, since the latter calls for only one set of basic assumptions.
VI. ALLOMETRIC EQUATIONS : THEORETICAL FOUNDATION
Once the reduced exponents (b) have been calculated it is necessary to assess the validity of various similarity criteria; for this purpose the theoretically obtained values (b) should be compared to the empirical findings. The most simple, uni- versal, and convenient mathematical expression is represented by Huxley’s (40) allometric equation y = aW, where y = any function definable in terms of the MLT system, a = empirical parameter, IV = body weight, and b = reduced ex- ponent. The numerical values of both parameters can be easily obtained from the log-log plot of the experimental data, since the logarithmic expression is a straight line (log y = log a + b log IV). These equations are widely used because of the simplicity of their determination and the interpretability of their parameters (19).
Because of the biological importance of allometry, a brief discussion of the theoretical foundation of this equation might be justified. For this analysis we lean heavily on von Bertalanffy’s (6) enlightened treatment on the subject, which is particularly related to growth processes in general.
In a system, defined as a complex of interacting elements that in the present example are only of one kind, the “growth” of the system is directly proportional to the number of elements present:
dQ -Z dt WQ (26)
Depending on whether the constant al is positive or negative, the growth of the system is likewise positive or negative, and the system as a whole increases or decreases.

674 B. GUNTHER Volume 55
The solution of equation 26 is :
Q = Qo.8 W (27)
where Qo = number of elements at t = 0. This exponential law, found in many fields, is also known as the law of natural
growth. Furthermore, this type of equation can be used for studying the competi- tion between parts, assuming that the increase in each element depends only on this element itself. For two competing elements we have :
(28)
For one element, the integration leads to:
ln Q 1 = al-t + kl
where kl is the integration constant. The corresponding antilogarithm reads as follows :
Q = kl 1 e-e a1 t
and if ekl = Cl , we obtain finally for both elements:
Q ad 1 = Cl-e
Q a2t 2 = C2-e
(29)
In order to eliminate t, we obtain:
t = In Qr - In Cl = In & - In CZ (30)
a1 a2
The solution of this equ .ation is :
C
00
a = - .
c2: Q2
With C&2* = a, and if a = b, we finally have Huxley’s (40) allometric equation :
Q 1 = a*Qzb (31)
As has been stated by Gould (19), in his thorough review on the subject of allometry in ontogeny and phylogeny, the term “allometry” can be used to desig- nate proportion changes, correlated with variations in size either of body weight or of a specific part (organs), concerning the morphological, physiological, or chemi- cal characteristics of organisms. In addition, any increase in size requires form changes or changes of its proportions, in order to remain functionally efficient. But the increase in size means a decrease of the area-volume ratio, which can be com- pensated either by: 1) a differential increase of surfaces by complication of the structure (branching); 2) changes in shape (flattening); and 3) incorporation of inactive, inert, or nonrespiring organic matter, within the volume occupied.
October 1975 THEORY OF BIOLOGICAL SIMILARITY 675
In advanced animals we may find an increase of the complication of the internal structures (circulatory, respiratory, digestive, excretory systems), which eventually may lead to the required increase of the corresponding exchange areas.
VII. EMPIRICAL ALLOMETRIC EQUATIONS
Though widely scattered in the literature, many reports demonstrating the effective use of allometric equations have been published. In this report we em- phasize the close agreement between the empirically obtained exponents (b) of the allometric equation (r = a* Wb) and the calculated values of the reduced exponent (b), mostly in accordance with the kinematic similarity criterion, although other criteria are sometimes applied.
A. Morphometric Studies
A quite extensive literature on the subject has been excellently reviewed by Adolph (1). Furthermore, an allometric study on five species of primates has been reported by Stahl and Gummerson (72), from which we have selected some rep- resentative allometric equations (Table 6), in order to illustrate that gross somatic measurements, some characteristics of the skeleton, and the weights of numerous organs can be defined adequately by means of allometric criteria. The same holds for the organ weights in mammals, which have been correlated with the cor- responding body weights and plotted logarithmically to obtain the pertinent allometric equations (70).
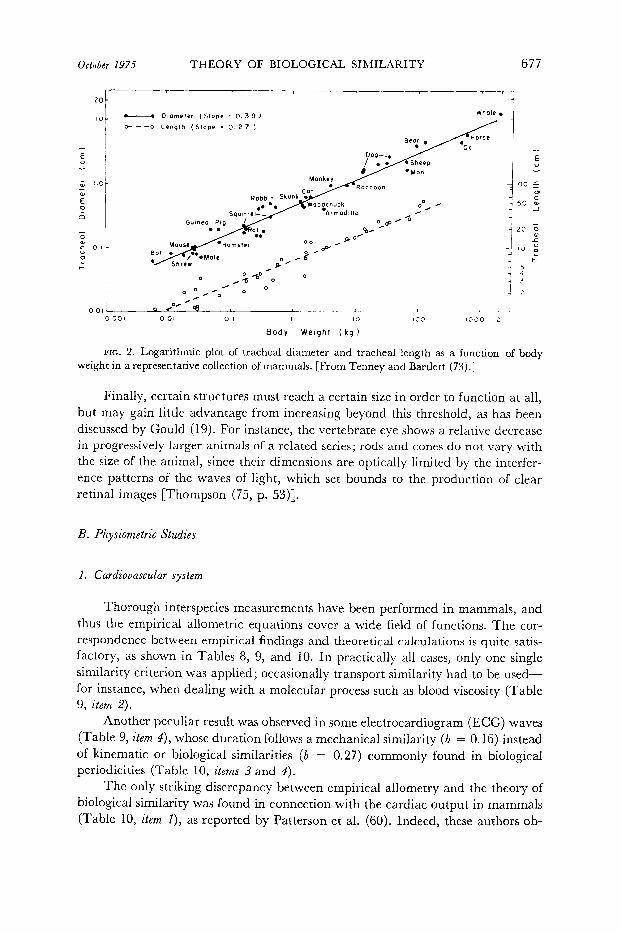
Due to the statistical nature of the empirical allometric equations and to the multifarious relationships among organs, we should not expect a better correlation. This can be illustrated by the extensive study of Tenney and Bartlett (73) on the tracheal dimensions in a variety of mammals (Fig. 2). These authors found that the
_ tracheal length is almost proportional to PV”e2? and the tracheal diameter is pro- portional to VV o.3g Since in both instances we are dealing with a linear dimension, . the theoretically expected exponent should be the same, namely, b = 0.33. This comparative study (73) yielded two values that are nearly equal to the expected figure.
The numerical data obtained for several organs are shown in Table 7; with the exception of the pituitary (b = 0.56), the adrenals (b = 0.80), and the brain (b = 0.70), for all the other organs the correlation with body weight is almost linear (b = l.O), as should be expected from a theoretical point of view.
However, as emphasized by Weibel (77) with regard to the factors determin- ing the diffusion capacity of the lung, other variables should be taken into account. These are the so-called “adaptation factors” (Ai), which eventually could be de- fined as power functions of body weight. In consequence, any biological charac- teristic, morphological or physiological, may be written as follows:

676 B. GUNTHER Volume 55
TABLE 6. Examples of allometric analysis of gross somatic, skeletal, and organ measurements in 5 species of adult primates
Item and Measurement Parameter (a) Exponent (b) Theoretical Exponent (b)
Gross somatic measurements, cm I Vertex-heel height 2 Trunk height 3 Chest circumference 4 Thoracic width
Skeletal lengths, cm 5 Humerus 6 Radius 7 Ulna 8 Femur 9 Fibula
Skeletal weights, g 10 Femur 11 Tibia I2 Fibula 13 Humerus I4 Ulna 15 Radius
Organ weights, g 16 Heart 17 Right lung 18 Empty stomach 19 Liver with gallbladder 20 Large intestine 21 Pancreas 22 Spleen
46.6 21.3 17.1
5.44
7.72 7.88 8.22 9.38 8.45
3.78 2.82 0.60 2.41 1.28 1 .oo
4.77 0.84' 3.30 1.02 5.80 0.96
30.9 0.80> 13.7 1 .oo
1.11 0.94 1.12 0.99,
0.30 0.28 0.37
0.33
0.32
0.35) 0.31 0.37 0.33 0.34 0.24
1.08) 1.02 1.04 1.07 1.15 1.17 1
1 .oo
1 .oo
Based on y = a* W6; W is body weight in kilograms; n = 35 animals. [From Stahl and Gummerson (72) .]
where Ai = adaptation functions (Al, A2 , As . . . A,) of endogenous or exogenous nature (metabolic rate; Po2; Pco2; temperature, etc).
Earlier work had suggested that organs, such as the kidneys, liver, and heart, may increase in size corresponding to the metabolic demands including a safety factor, viz., with an allometric exponent above 0.75, as has been pointed out by von Bertalanffy [quoted by Gould (19)].
For the endocrine glands, whose functions are mainly regulatory, the correla- tion with total body mass should not be of direct proportionality (b = 1.0).
The brain is another example of a marked discrepancy between the theoret- ically expected values (b = 1 .O) and the empirical findings (b = 0.70). As Rensch [quoted by Gould (19)] has pointed out, surface innervation is the major brain function, and consequently an interspecific value of b = 0.66 represents the surface dependency of brain growth. Furthermore, the cerebral cortex is a surface layer of gray matter that increases only by “surface” expansion while the internal white matter expands “volumetrically” [Le Gros Clark, quoted by Gould (19, p. 623)-J.
Otto ber 1975 THEORY OF BIOLOGICAL SIMILARITY
- Diameter (Slope - 0.39) Whale .
IO- o- - -0 Length (Slope : 0. 2 7 )
i;~ ~~~~~...~ er
0 O
0 .a a0 0 4
o 3
OYo 0
0 0
00 0
1 2
0.01’ 1 1 I 1 - - - - - - I
0 001 0.01 0. I I IO 100 1000 2
Body Weight. (kg )
FIG. 2. Logarithmic plot of tracheal diameter and tracheal length as a function of body weight in a representative collection of mammals. [From Tenney and Bartlett (73.1
Finally, certain structures must reach a certain size in order to function at all, but may gain little advantage from increasing beyond this threshold, as has been discussed by Gould (19). F or instance, the vertebrate eye shows a relative decrease in progressively larger animals of a related series; rods and cones do not vary with the size of the animal, since their dimensions are optically limited by the interfer- ence patterns of the waves of light, which set bounds to the production of clear retinal images [Thompson (75, p. 53)].
23. Phy siom etr ic Studies
1. Cardiovascular system
Thorough interspecies measurements have been performed in mammals, and thus the empirical allometric equations cover a wide field of functions. The cor- respondence between empirical findings and theoretical calculations is quite satis- factory, as shown in Tables 8, 9, and 10. In practically all cases, only one single similarity criterion was applied; occasionally transport similarity had to be used- for instance, when dealing with a molecular process such as blood viscosity (Table 9, item 2).
Another peculiar result was observed in some electrocardiogram (ECG) waves (Table 9, item 4), h w ose duration follows a mechanical similarity (b = 0.16) instead of kinematic or biological similarities (b = 0.27) commonly found in biological periodicities (Table 10, items 3 and 4).
The only striking discrepancy between empirical allometry and the theory of biological similarity was found in connection with the cardiac output in mammals (Table 10, item r>, as reported by Patterson et al. (60). Indeed, these authors ob-

678 B. GUNTHER
TABLE 7. Organ weights in mammals as functions of body weight
Vulwne 55
Item Organ Parameter (a) Exponent (b)
1 Adrenals
2 Brain
3 Heart
4 Kidneys
5 Liver
6 Lungs
7 Pancreas
8 Pituitary
9 Spleen
10 Thyroid
0.27 0.80
10 0.70
5.8 0.98
7.3 0.85
33.3 0.87
11.3 0.99
2.0 0.91
0.03 0.56
2.5 1.02
0.13 0.92
Based on y = a* Wb; y is organ weight in grams and W is body weight in kilograms. Theoretically calculated exponent is always b = 1 .OO. [From Stahl (70).]
TABLE 8. Allometric equations of cardiovascular variables in mammals
Item Function Parameter (a) Exponent (b) Theoretical -______ Reduced
Left Right Left ventricle
Right ventricle ventricle
Exponent ventricle lb)
-
Cardiac output, ml/min
End-systolic volume, ml
End-diastolic volume, ml
Heart weight, g
Heart rate, min-1
Stroke volume, ml
Stroke work, g-m
Total peripheral resistance, (dynes X s)/cm6
Ventricle weight, g
166 179 0.79 0.78 0.73
0.59 0.62 0.99 0.99 1 .oo
1,76 2.02 1.02 1.02 1 .oo 2.61 3.19 1.10 1.07 5. .oo
236 240 -0.25 -0.26 -0.27 0.66 0.75 1.05 1.04 1 .oo 0.59 0.12 1.15 1.14 1 .oo
487 X lo2 -0.76 -0.73
1.65 0.74 1.11 1.06 1 .oo
Based ony = a- W; W is body weight in kilograms. [From Holt et al. (39).]
tained exponent b = 0.9888, instead of the theoretically expected value of b = 0.73. The difference might be due to the fact that their data were obtained from a variety of sources, probably employing different techniques, with and without anesthesia, in animals under varying states of apprehension. In contrast, results agreeing with the theory were found by other investigators (see Table 8, item I; Table 9, item I; Table 10, item 8) : that is, when the same authors performed all the measurements, following strictly the same procedure in all interspecies deternrinations, the results are more reliable for the subsequent statistical treatment (Fig. 3).
2. Respiratory functions
Multiple aspects of the respiratory functions in mammals have been investi- gated, in order to establish the corresponding allometric equations. These experi-

October 1975 THEORY OF BIOLOGICAL SIMILARITY 679
TABLE 9. Empirical allometric equations of blood and circulatory system in mammals
Item Function Parameter (a) Exponent (b) Calculated
Exwgy; @A .
5
6 7
8
9
10
11
12
13
Blood flow, g X s-1
Blood viscosity rel. Hz0
Cross-sectional area of aorta, cm2
Duration, ms P wave PR interval QRS interval QT interval
Elasticity of aorta, dynes/cm6
Heart mass, g
Hemoglobin mass, g
Length of aorta, cm
Mean blood velocity (aorta), cm/s
Pulse time, s
Systemic arterial pressure, dynes/ cm2
Total blood volume, cm3
Total peripheral resistance, (dynes X s)/cm6
3.3 x 10-Z 0.74 0.73
2.3 X loo 0.067 o.o*
1.8 X lo-3 0.67 0.66
13.97 19.15 11.12 17.59
8.4 X lo8
6.6 x 10-S
1.3 x 10-Z
1.8 X loo
1.84 X 101
4.3 x 10-Z
1.2 x 10⁶
0.168 0.187 0.165 0.30 1 1.19
0.98
0.99
0.32
0.07
0.27
0.032
5.5 x 10-Z 0.99 1 .o
2.8 X lo6 -0.68 -0.73
0.16-0.27
-0.95
1 .o
1 .o
0.33
0.07
0.27
0.00
Based on y = a* Wb; IV is body weight in grams. [Gunther and Leon de la Barra (29).] * According to transport similarities.
mental studies were performed without any underlying theoretical framework that might inadvertently have influenced the final results. For this reason, the agree- ment between empirical results and theoretical predictions is particularly striking. On the other hand, in the present review the redundancy of experimental results has not been avoided in order to illustrate the similarity of results reported by in- dependent investigators. The correspondence between empirical allometric expo- nents (b) and the theoretically calculated reduced exponent (b) is shown in Tables 11, 12, and 13.
In general, the kinematic (biological) similarity criterion was applied with satisfactory results, with the exception of diffusion processes in the lung, where the “transport” similarity should be applied, if we consider that in this particular case we are dealing with a process located at the molecular level.
Tenney and Remmers (74) examined 26 representative mammals-from the shrew to the whale-and established an allometric correlation between lung volume and body weight with an empirical exponent b = 1.02, which agrees with the theoretically predicted value (b = 1.00) and with values established by other investigators (Table 12, item 16; Table 13, item 5). Furthermore, they found a linear correlation (double logarithmic plot) between alveolar surface area (Sa) and basal oxygen consumption (V02 a W”.74), as well as a linear relationship between alveolar diameters (microns) and the metabolic rate per unit body weight, which yields an allometric exponent of b = -0.7 1. It is interesting that the alveolar

680 B. GUNTHER Volume 5.5
TABLE 10. Allometric equations of cardiovascular functions in mammals and birds
Item Function Parameter (a) Exponent lb)
Theoret ical Exponent Ref. GO, Eq. 17
Cardiac output, liters/ min
Force of heart, dynes X 103
Heart frequency in mammals, mine1
Heart frequency in birds (body wt in g) , min-l
Heart work, erg X 103
Heart power, erg X s-1
Internal surface, left ventricle, cm2
Minute volume, ml/min
Plasma, colloid osmotic pressure cmH 20
Stroke volume, cm3
Tension in aortic wall (wt in g), (dynes X 103)/cm
Tension-time index per systole, dynes X s X lo3
Tension-time index per min, dynes X lo3
0.1017 0.9988 0.73 60 8.32 X lo5 0.69 0.66 43
241 -0.25 -0.27 71
I
2
3
4 763 -0.23 -0.27 10
5
6
7
8.91 X 10” 1.06 1 .oo 43 3.8 X lo5 0.77 0.73 43
6.17 0.68 0.66 43
8
9 204 0.75 0.73 43
23.2 0.075 0.00 81
10
II
0.74 1.03 1 .oo 43
2,436 0.35 0.33 79
I2 9.12 X 10⁴ 0.94 0.94 43
13 2.63 X lo7 0.66 0.66 43
Based ony = a* Wb; W is body weight in kilograms.
; ; RAT, , GUINEA I IPIG I I
i RA86lT I I I
I MAN, /HEART POWER (~0 iv
,I( /
Lrnl\UlHL
OUTPUT (0) I
- b = -w-.
i I I I I * ’ I I 1 1
2 s 1 0 1 2 3 log BODY WEIGHT (Kg) -
FIG. 3. Double logarithmic plot of various cardiovascular functions in mammals of different size. [Numerical data from JuiniE and Klensch (43, Table 1) .]
October 197.5 THEORY OF BIOLOGICAL SIMILARITY 681
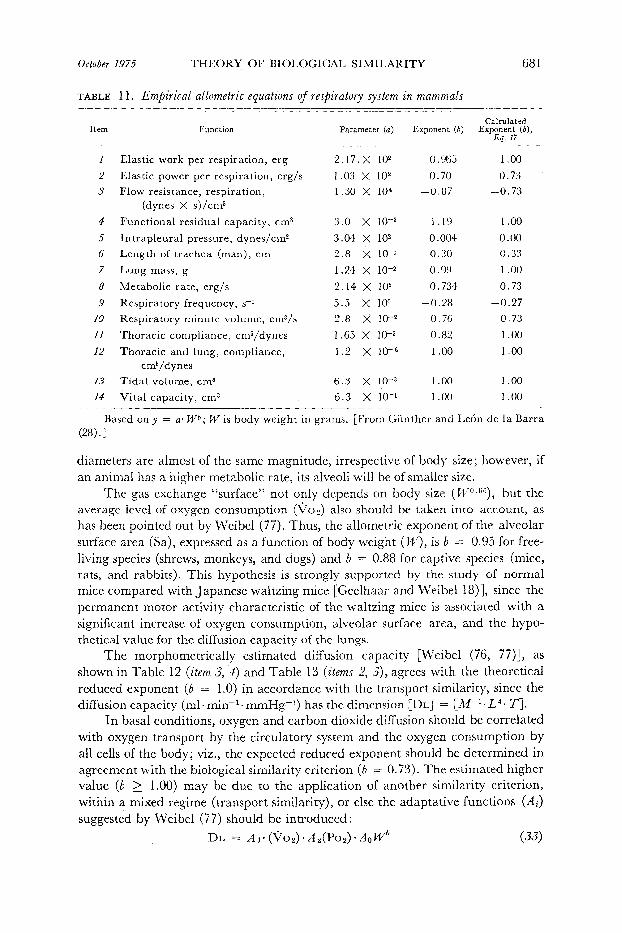
TABLE 1 1. Empirical allometrie equations of respiratory system in mammals -- ________~_____I__-
Calculated Item Function Parameter (a) Exponent (b) Ewge;; @),
. _____
1 Elastic work respiration, per erg 2.17.x 102 0.965 1 .oo 2 Elastic respiration, erg/s power per 1.03 x lo2 0.70 0.73 3 Flow resistance, respiration, 1.30 x lo* -0.87 -0.73
(dynes X s&m5
4 Functional residual capacity, cm3 3.0 x 1o-3 1.19 1 .oo
5 Intrapleural dynes/cm2 pressure, 3.04 x 10² 0.004 0.00 6 Length of trachea (man), cm 2.8 X 10-I 0.30 0.33 7 Lung mass, g 1.24 x 10-Z 0.99 1 .oo
8 Metabolic rate, erg/s 2.14 X 10⁶ 0.734 0.73 9 Respiratory frequency, s-1 5.5 x 100 -0.28 -0.27
10 Respiratory minute volume, cm3/s 2.8 X 1O-2 0.76 0.73 11 Thoracic compliance, cmb/dynes 1.65 X 10-S 0.82 1 .oo
12 Thoracic and lung, compliance, 1.2 x 1o-G 1 .oo 1 l oo cmb/dynes
13 Tidal volume, cm3 6.3 X 1O-3 1 .OO 1 .oo
I4 Vital capacity, cm3 6.3 X 10-i 1 .oo 1 .oo
Based on y = a* Wb; W is body weight in grams. [From Giinther and Le6n de la Barra
Gwl
diameters are almost of the same magnitude, irrespective of body size; however, if an animal has a higher metabolic rate, its alveoli will be of smaller size.
The gas exchange “surface” not only depends on body size (PV”eG6), but the average level of oxygen consumption (%,) also should be taken into account, as has been pointed out by Weibel (77). Th us, the allometric exponent of the alveolar surface area (Sa), expressed as a function of body weight (IV), is b = 0.95 for free- living species (shrews, monkeys, and dogs) and b = 0.88‘for captive species (mice, rats, and rabbits). This hypothesis is strongly supported by the study of normal mice compared with Japanese waltzing mice [Geelhaar and Weibel 18)], since the permanent motor activity characteristic of the waltzing mice is associated with a significant increase of oxygen consumption, alveolar surface area, and the hypo- thetical value for the diffusion capacity of the lungs.
The morphometrically estimated diffusion capacity [Weibel (76, 77)], as shown in Table 12 (item 3, 4) and Table 13 (items 2, 3), agrees with the theoretical reduced exponent (b = 1.0) in accordance with the transport similarity, since the diffusion capacity (ml l min-l l mmHg+) has the dimension [DL] = [M-l l L4' T].
In basal conditions, oxygen and carbon dioxide diffusion should be correlated with oxygen transport by the circulatory system and the oxygen consumption by all cells of the body; viz., the expected reduced exponent should be determined in agreement with the biological similarity criterion (b = 0.73). The estimated higher value (b 2 1.00) may be due to the application of another similarity criterion, within a mixed regime (transport similarity), or else the adaptative functions (Ai) suggested by Weibel (77) should be introduced :
DL = Al* (vo2)*A2(P02)'Aowb (33)
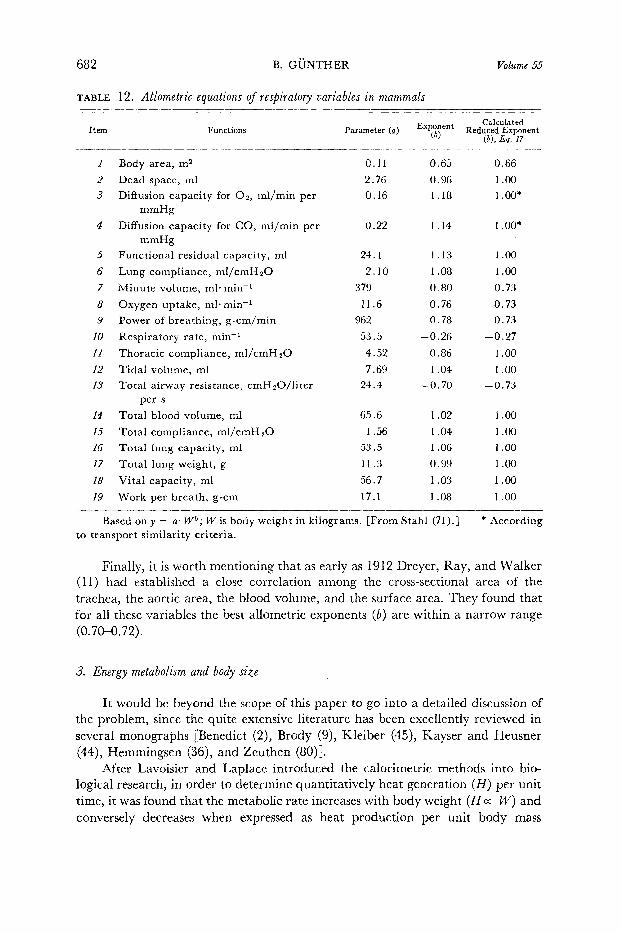
682 B. GUNTHER Volume 55
TABLE 12. Allometric equations of respiratory variables in mammals
Item Functions Parameter (a> Calculated Exponent
@I Reduced Exponent
W, 3. 17
1
2 3
4
5
6 7
8
9
10
11
a2
13
14
15
16
17
18
19
Body area, m2
Dead space, ml
Diffusion capacity for Oz9 ml/min per mmHg
Diffusion capacity for CO, ml/min per mmHg
Functional residual capacity, ml
Lung compliance, ml/cmH 20
Minute volume, ml* min-1
Oxygen uptake, ml* min-r
Power of breathing, g-cm/min
Respiratory rate, min-’
Thoracic compliance, ml/cmH 20
Tidal volume, ml
Total airway resistance, cmH *O/liter per s
Total blood volume, ml
Total compliance, ml/cmH 20
Total lung capacity, ml
Total lung weight, g
Vital capacity, ml
Work per breath, g-cm
0.11 0.65 0.66
2.76 0.96 1 .OO
0.16 1.18 1 .oo*
0.22
24.1 1.13 1 .OO
2.10 1.08 1 .oo
379 0.80 0.73
11.6 0.76 0.73
962 0.78 0.73
53.5 -0.26 -0.27
4.52 0.86 1 .oo
7.69 1.04 1.00
24.4 -0.70 -0.73
65.6 1.02 1 .oo 1.56 1.04 1 .oo
53.5 1.06 1 .oo 11.3 0.99 1 .oo
56.7 1.03 1 .oo
17.1 1.08 1 .oo
1.14 1 .oo*
Based on y = a* Wb; W is body weight in kilograms. [From Stahl (71).] to transport similarity criteria.
* According
Finally, it is worth mentioning that as early as 19 12 Dreyer, Ray, and Walker (11) had established a close correlation among the cross-sectional area of the trachea, the aortic area, the blood volume, and the surface area. They found that for all these variables the best allometric exponents (6) are within a narrow range (0.70-0.72).
3. Energy metabolism and body size
It would be beyond the scope of this paper to go into a detailed discussion of the problem, since the quite extensive literature has been excellently reviewed in several monographs [Benedict (2), Brody (9), Kleiber (45), Kayser and Heusner (44), Hemmingsen (36), and Zeuthen (80)].
After Lavoisier and Laplace introduced the calorimetric methods into bio- logical research, in order to determine quantitatively heat generation (H) per unit time, it was found that the metabolic rate increases with body weight (Ha r/v> and conversely decreases when expressed as heat production per unit body mass

THEORY OF IXOLOGICAL SIMILARITY 683 October 1975
TABLE 13. Comparison of empirical allometric equations for respiratory functions in mammals and birds
-____ _____-I__ -I____--- -----___- ------.__--- -l______l_ - Calculated
Item Function Parameter (a) Exponent (b) Exp;;e;; (b), Ref. .
I
2
3
4
9
IO
II
I2
Alveolar surface area, m2
Diffusion capacity (morphometric es- timation in mammals), ml O,/ min per mmHg
Diffusion capacity (birds, excluding
passerines (body wt in kg), ml CO/min per mmHg
Diffusion capacity of mammals (mor-
phometric estimation), m2 Free-living species Captive species
Lung volume, ml
Oxygen consumption, ml OJmin
Respiratory rate in mammals, min-l
Respiratory frequency of 45 species
of birds, min-’
Respiratory frequency, passerine birds, min-l
Respiratory frequency, nonpasserine birds, min-i
Thickness of air-blood barrier, pm
Tidal volume (mammals), ml
0 q 0038 0.98 0.66 76
0.0083 0.96 1 .oo* 76
0.55?
0.0122 0.96 0.66 0.0119 0.84 0.66
0.032 1.05 1 .oo
0.122 0.72 0.73
354 -0.28 -0.27
182 -0.33 -0.27
158 -0.28 -0.27 10
146 -0.31 -0.27 10
0.300 0.05 o.ot 76 0.0062 1 .Ol 1 .oo 1
1.14? 1 .oo* 51
76
76
76 1
10
Based on y = a* Wb; W is body weight in grams. * Calculated according to transport similarity . t Calculated according to cellular similarity.
@Y/W). A certain uniformity was attained when Sarrus and Rameaux in 1838- 1839, Rubner in 1883, and Richet in 1885 recommended application of the so- called “surface law” : that is, expression of the metabolic rate (kcal/h) per square meter and hour (H/m2 per h).
Although the surface rule has been generally accepted and is still widely used as a reference value (basal metabolism, cardiac index), this alleged biological law has been criticized severely by numerous investigators, since the experimental findings do not follow the postulated relationship of N o= IV21 a. As shown in Table 14 most investigators have found that the allometric exponent (0) varies around 0.75 not only in homeotherms (mammals and birds) but also in poikilotherms (amphibians and reptiles) and even in unicellular organisms. The total weight range studied is enormous ( lOIs), from the lo-l2 g unicellular organisms to the several-ton elephant (> lo6 g). The allametric exponent is practically the same (b = 0.751) and only a change of parameter (a) could be reported by Hemmingsen (36), as shown in Fig. 4.
The allometric exponent for the weight-specific metabolic rate (&‘W’) is pq70.73/J4/71.00 = f/j/7--0.2?) which has been confirmed by IMacMillen and Nelson (54)

684 B. GijNTHER
TABLE 14. Allometrie equations of basal metabolism in d$jTerent species
Votume 55
-
Item Unit of Measurement
jmphibians and rep tiles
kcallday
3irds Nonpasserine Passerine
ml OJmin ml OJmin
3asyurid mar- supials
cm3 Od(g* h)
Sbernating ani- mals
Summer Winter
kcaljday kcal/day
Homeotherms kcal* h-l
Mammals ml Oz/min
7 Placental mam- mals
cm3 02/(g- h)
8 Poikilotherms kcal* h-r
9 Unicellular orga- kcal* h-r nisms
Bdt’
kg
g g
g
Body T:zP, Parameter (a> Exponent
w Ref.
- 18 1.78 0.728 44
38 0.078 0.723 51 38 0.126 0.724 51
37.2 2.45 -0.261 54
37 63.6 0.62 10 2.09 0.69
44
39 2 x IO-2 ’ 0.751 36
38 0.057 0.75 0.061 0.76 0.064 0.734
37
20
20
3.8 -0.265
45 71
9
54
6i.9 X 1O-4 0.751
0.751
36
8.43 X lo-+ 36
Based on y = a* W? Theoretical reduced exponent is b = 0.73 in all instances or b = -0.27 for weight-specific metabolism.
both for placental mammals and for dasyurid marsupials, despite the fact that both have a parallel evolutionary history of 70 million years (see Table 14, items 3 and 7).
Only in hibernating animals, during summer and winter, Kayser and Heus- ner (44) found that the allometric exponent varied around 0.66 (see Table 14, item a), which might be interpreted as confirming the surface law.
However, if we accept that organisms should be considered as mixed regimes, the possible range for the reduced exponent (b) of metabolism can be defined from the mechanical (dynamical) similarity criterion (b = 1.16) to the kinematic (bio- logical) similarity (b = 0.66). Any experimental result within the range 0.66 < - b < 1.16 can be accepted as valid. -
It is interesting to note that van Bertalanffy (4, 5) had described three met- abolic types closely correlated to three growth types: I) in the first type, the met- abolic rate is proportional to the surface area (b = 0.66); 2) in the second type, metabolism is proportional to weight itself (b = 1 .OO) ; and 3) in the third type, the
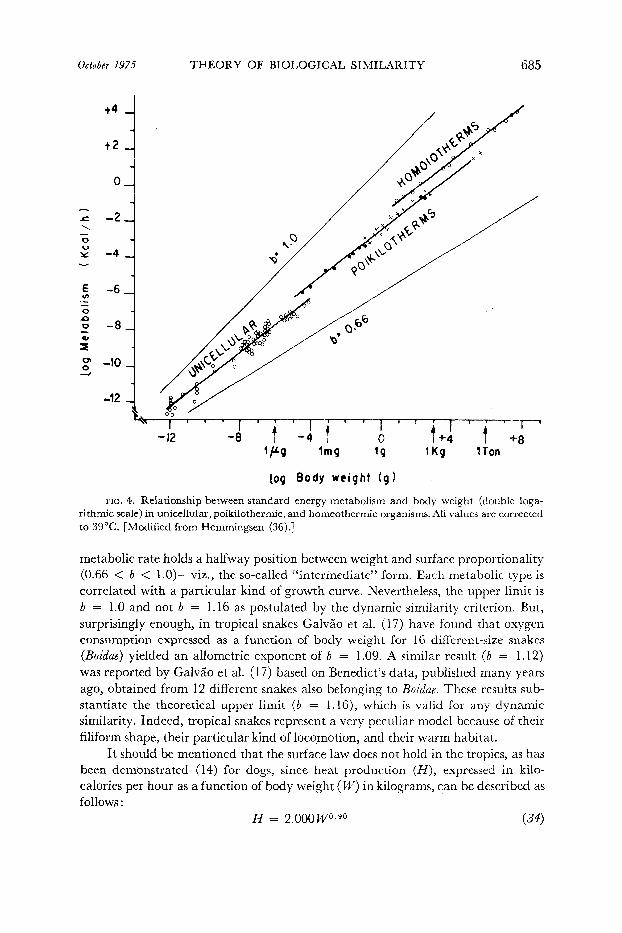
October 1975 THEORY QF BIOLOGICAL SIMILARITY 685
-6
-8
[og 6ody weight (g)
FIG. 4. Relationship between standard energy metabolism and body weight (double loga- rithmic scale) in unicellular, poikilothermic, and homeotherrnic organisms. All values are corrected to 39°C. [Modified from Hemmingsen (36).]
metabolic rate holds a halfway position between weight and surface proportionality (0.66 < b < l.O)- viz., the so-called “intermediate” form. Each metabolic type is correlated with a particular kind of growth curve. Nevertheless, the upper limit is b = 1.0 and not b = 1.16 as postulated by the dynamic similarity criterion. But, surprisingly enough, in tropical snakes GalvSo et al. (17) have found that oxygen consumption expressed as a function of body weight for 16 different-size snakes (Boidae) yielded an allometric exponent of b = 1.09. A similar result (b = 1.12) was reported by GalvZo et al. (17) based on Benedict’s data, published many years ago, obtained from 12 different snakes also belonging to Boidae. These results sub- stantiate the theoretical upper limit (b = 1.16), which is valid for any dynamic similarity. Indeed, tropical snakes represent a very peculiar model because of their filiform shape, their particular kind of locomotion, and their warm habitat.
It should be mentioned that the surface law does not hold in the tropics, as has been demonstrated (14) for dogs, since heat production (H), expressed in kilo- calories per hour as a function of body weight ( W) in kilograms, can be described as follows :
H= 2.000w”~go (34)

686 B. GtiNTHER Volume 55
For lean men living in the same tropical zone (Sao Paulo, Brazil) Galvao (15) found that
H= 2.083 Woe8 3 (35)
and for well-proportioned men he obtained the following allometric equation (16) :
H= 2.334W0’78 (36)
On the other hand, for well-proportioned men living in cold climates, Galvgo (16) calculated that
H= 4.088 W”-67 (37)
and in the latter case the allometric exponent is strictly surface proportional (b = 0.66). Galvgo concluded that the surface law was not a mere coincidence, but a thermal causal law, since in men and animals living in cold climates the metabolic rate is surface proportional, whereas in tropical zones much higher values were found (0.75 < b < 1 .OO); this may suggest that heat production becomes pro- portional to the metabolically active mass.
An alternative explanation for the three different metabolic types (0.66 < b < 1.00) could be visualized if the surface-volume relationship is studied at the cellular level. Davison [quoted by Gould (19)] has pointed out that an increase in body mass can be accomplished by either: I> cell enlargement, and consequently the cell surface could vary as the Fs power of weight; or 2) formation of additional cells of fixed size, and then cell surface could increase proportionately with weight.
Unicellular organisms may follow the first alternative (M a W”*66), multi- cellular organisms may approach the second alternative (A4 a Wl-O), or an inter- mediate form (0.66 < b < 1.00) could be the result of a compromise solution (mixed regime).
Recently Maldonado et al. (55) have studied cell diameters at the nuclear level in tissues of some homeotherms (mouse, dog, bovine) and poikilotherms (frogs, toads), keeping strictly invariant the fixation and staining techniques. From the statistical analysis of these measurements the correlation between cell diameter (D) and body weight (W) could be established.
For homeotherms, the allometric equation was:
D= 13.26 W”-028 (38)
For poikilotherms they found :
D= 16.79 W”-04g (39)
where the cell diameter (D) is expressed in microns and the body weight (W) in grams.
In conclusion, the cell diameter increases only slightly while the body size varies markedly, in accordance to the postulated assumption of the cellular similar- ity criterion. 3
3 Cellular similarity should be applied to processes at the cell level, approximately X0 or M/O*O.
where L& is not A, but

Otto ber 1975 THEORY OF BIOLOGICAL SIMILARITY 687
0.8
W
- 0.8
N= 80
Y = 1.02 x - 0.006
I = 0.99
I r I 1 I 1 I 1 I I -0.8 - cl.4 Q.0 0.4 0.8 ----z-- .
THEORETICAL EXPONENT (b)
FIG. 5. Correlation between experimental and theoretical reduced exponents (6) fix 8Q empirical allometric equations. [From Giinther (22) .]
VIII. EMPIRICAL ALLOMETRIC EQUATIONS, THEQRETICAL REDUCED EXPONENTS,
AND OPTIMALITY PRINCIPLES
In the light of the varied experimental evidence and of the almost universal applicability of the allometric equation in biology, it seemed worthwhile to study the possible correlation between the empirical allometric exponents and the cal- culated reduced exponents [Gunther (ZZ)]. F or any function the reduced exponent (b) was calculated according to equation 17 and compared with 80 empirical allo- metric exponents (b) found in the literature, which are reported in part in the present paper (see Tables 6-14). The corresponding regression equation reads as follows :
Y = 1.02x - 0.006 (40)
Since the correlation coefficient is r = 0.99, we may conclude that the cor- respondence between the empirical values and the theoretical predictions is satis- factory (Fig. 5).
According to Rosen (63), the allometric laws are closely related to ‘“optimal- ity” considerations- viz., the minimization processes defined on the set of all possi- ble relations. Hence, the allometric form functionals will appear as immediate consequences of optimality considerations. Assuming that this interpretation is
688 B. GUNTHER Volume 55
valid for each allometric equation, then the assemblage within a multivariable system should lead to a perfect morphological and functional adaptation among all these variables. Therefore, the just-described correlation between the theoret- ically calculated allometric exponents and the power functions derived from the statistical analysis of the empirical data should not be a surprise.
In addition, each organ is constructed in such a fashion that it will function in an optimal manner for efficiency, energy expenditure, and ease of maintenance (62). However, it is convenient to distinguish between the “absolute” optimum characterizing the adult form, and a number of “relative” optima found in a developing organism (growth), which is considered as an open system passing through a succession of relati.vely stable steady states until it ultimately attains a stable state (adult form). These systems are necessarily related by an allometric law, whereby the allometric parameters (a and b) are defined by Rosen (63) as “structure constants.” For instance, parameter a is essentially a ratio of initial values and exponent b is the ratio of a pair of rate constants.
The allometric formalism is independent of time: viz., the time “cancels out.)) Nevertheless, the absence of absolute time is more apparent than real, since one form functional (y) is no longer measured with regard to absolute time (t), but rather with respect to another form functional (x), a relationship that now plays the role of a “physiological clock.”
As a particular optimiration problem consider Wilson’s (78) study on the “minimum entropy production” as a design criterion for the respiratory system in man. He shows that calculated and observed values of pulmonary ventilation agree within the accuracy of the experimental data for oxygen consumptions below 2 liters/min.
IX. POSSIBLE RELATIONSHIPS BETWEEN TWO ALLOMETRIC EQUATIONS
As has been shown, single allometric equations are very useful for the quanti- tative description of interspecies morphometric and physiometric relationships. Nevertheless, it is possible to extend these applications to the algebraic treatment of the relations among organ weights, any particular function, and body weight (20). The need for this kind of treatment is illustrated by the following statement of Adolph (1) : “It seems likely that an organism is an integrated system by virtue of the fact that none of its properties is entirely uncorrelated, but that most are demon- strably interlinked.”
From a theoretical point of view four kinds of correlation can be established between pairs of allometric equations (22) :
A) The weight of two organs (~1 and ~2) can both be expressed as functions of body weight (VV).
B) Two independent functions (fl andfz) can be described quantitatively with regard to body weight (IV).
C) The weight of an organ (w) and any corresponding function (f) of this particular organ are both correlated with body weight (Mr).

October 1975 THEORY OF BIOLOGICAL SIMILARITY 689
SEVERAL INITIAL ALLOMETRIC FINAL ALLOMETRIC
ITEM RELATIONSHIPS EQUATIONS EQUATIONS
w4 = a, Wbl
I
A al
W= b, 4
’ b w2
=a,W 2 I ca,) b,/b2cwzJ
B f, =a, Wbl
al
f2 =a2 Wb2
f, = [a >b /‘b (f2’b1’b2
2 ’ 2
f =a, Wbl
f= al b,‘b2
b W =a2W 2
(a2)bl/bJw)
D f =a, w b,
W l W b,/b2
f b
=a,W 2
FIG. 6. Allometric type of relationships among organ weights (w), functions v), and body weight (W).
D) One function (f) h as b een determined both with regard to body weight (W) and with the corresponding organ weight (w).
Since in the first three instances all variables are expressed as functions of body weight (IV), the same algebraic treatment can be employed; in the last case the situation is slightly different and deserves another approach (Fig. 6). However, in all four instances the final equations are typical allometric equations, once the parameters are reduced to the simplest form.
X. DIMENSIONLESS AND INVARIANT NUMBERS
Dimensional analysis and similarity criteria lead finally to the disclosure of dimensionless and invariant numbers, namely to quantitative multivariable rela- tionships, that are valid for all animals belonging to a certain model, irrespective of body mass.
Two procedures have been recommended to obtain dimensionless products: I) the “allometric canceling technique” advocated by Stahl (67-69, 71), and 2) the “dimensional and solution matrix method” that we have applied to a wide va- riety of physiological problems (24, 29-32, 52).
690 B. G&VTHER Volume 55
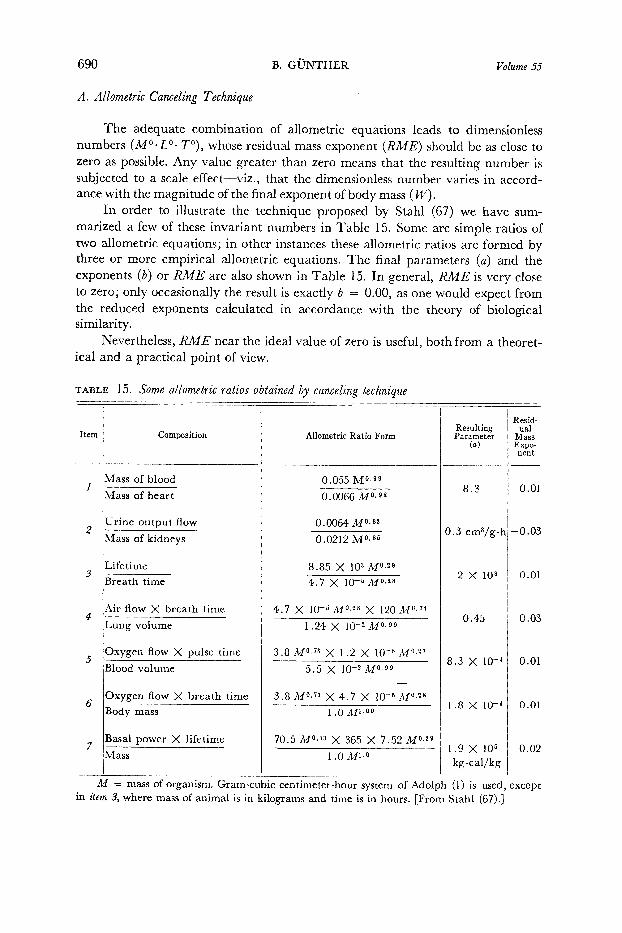
A. Allometric Canceling Technique
The adequate combination of allometric equations leads to dimensionless numbers (MO *Lo 0 TO), whose residual mass exponent (RIME) should be as close to zero as possible. Any value greater than zero means that the resulting number is subjected to a scale effect-viz., that the dimensionless number varies in accord- ance with the magnitude of the final exponent of body mass (IV).
In order to illustrate the technique proposed by Stahl (67) we have sum- marized a few of these invariant numbers in Table 15. Some are simple ratios of two allometric equations; in other instances these allometric ratios are formed by three or more empirical allometric equations. The final parameters (a) and the exponents (b) or RME are also shown in Table 15. In general, RME is very close to zero; only occasionally the result is exactly b = O,OO, as one would expect from the reduced exponents calculated in accordance with the theory of biological similarity.
Nevertheless, RME near the ideal value of zero is useful, both from a theoret- ical and a practical point of view.
TABLE 15. Some allometric ratios obtained by canceling technique -_____I__
Item
I
6
Composition
Mass of blood
Mass of heart
Urine output flow
Mass of kidneys
Life time
Breath time
Air flow X breath time
Lung volume
Oxygen flow X pulse time
Blood volume
Oxygen flow X breath time
Body mass
Basal power X lifetime
Mass
Allometric Ratio Form
0.055 MO* gg
0.0064 Mo.*2
0.0212 M”JJ6
8.85 X lo3 1MO.29
4.7 x 1O-6 M”a2*
4.7 X lo+’ M”o2* X 120 Mo.74
1.24 X 10-Z MO-99
3.8 Mo.73 x 1 .2 X lo+ MO.2’
5.5 x 1O-2 Moo99
3.8 MO”‘3 X 4.7 X lo+ M”e2*
1 .O Ml.O”
70.5 MO.‘3 X 365 X 7.52 MO.29
1 .O M1.O
Resulting Parameter
(4
8.3
0.3 cm3/g-h
8.3 X 10⁻⁴
1.8 X 1O-4
1.9 x lo6 kg-Cal/kg
M = mass of organism. Gram-cubic centimeter-hour system of Adolph (1) is used: in item 3, where mass of animal is in kilograms and time is in hours. [From Stahl (67).]
RZid- Mass Expo- nent
-0.03
-~ Except

October 1975 THEORY OF BIOLOGICAL SIMILARITY 691
B. Matrix Method
From a set of empirical allometric equations it is possible to establish exact numerical relationships that are adimensional and invariant for animals belonging to the same model. This assumption is based on the ?r theorem4 set up by Bucking- ham in 19 14, which is a formula for deciding how many dimensionless numbers to expect. According to Ipsen’s (41) definition: “The theorem states that the number of independent dimensionless groups is equal to the difference between the number of variables that go to make them up and the number of independent dimensions involved.” It does not depend on the number of dimensions actually used, but rather on the minimal number that might have been used. Buckingham’s 7r theorem only tells us that there must be at least a certain amount of dimensionless numbers involved.
The first step in this procedure is to select the empirical allometric equations that are of particular interest for the problem under study. Second, the variables- the allometric equations-are arranged in a “dimensional matrix” and then the corresponding “equations of conditions” are established (n = MO l Lo* TO). Finally, from the ‘%olution matrix” we obtain a complete set of 7r numbers whose adequate combination yields the “invariant numbers.” They are valuable for interspecies comparisons, because these dimensionless numbers are numerically constant; i.e., the product of the corresponding allometric equations does not change from one species to another. The invariant numbers are the same, irrespective of body size, provided that the residual mass exponent is zero; otherwise a scale effect may be observed.
C . Invariant Number of Mammalian Circulatory System
The combination of two invariant numbers (29) yielded a circulatory in- variant number (IC) that included six empirical allometric equations of inter- species validity :
Ic = p.~“. T3
- 308W”*01 iioZ*TPR*Qb -
where : P = systemic arterial pressure (dynes. cmB2) = 1 l 17 X lo5 W”*023 v = mean velocity of blood in the aorta
(cm l s-l) = 1.84 X lo1 W”.07 T = duration of one cardiac cycle (s) =z 4.3 X low2 W”*27 x702 = basal oxygen consumption (cm3 l s-l> = 1.06 X lo- 3 W” s7 3 TPR = total peripheral resistance
(dynesscmV5) = 3.35 X lo6 VV”s6*
4 Use of r to denote a dimen soever with the number 3.1 4159.
sionless product is conventional and has no relationship
(41)

692 B. GUNTHER Volume 55
Qb = total blood volume (cm3) = 5.5 X 10W2 W”*gg W = body weight (g) This dimensionless and invariant number (I,) is practically constant for all
mammals, since the scale effect is relatively small and the RME is only b = 0.01. For a 20-g mouse Ic = 3 17; for a 4-ton elephant Ic = 358, despite the enormous body weight ratio of 1 :ZOO,OOO.
The invariance of Ic indicates that this dimensionless number is not dependent on body size and that under basal conditions six allometric equations can be rep- resented by a single figure (I& because exact numerical relations exist among all these variables of the circulatory system of mammals.
D. Invariant Number of Respiratory System of Mammals
One of the invariant numbers valid for the respiratory system of mammals (IR) was obtained (32) through dimensional and solution matrices applied to the corresponding allometric equations :
IR = VE 0.03
(Cpv~~r~GH)1/2 = o*0233w (42)
where : VE = volume flow of expired air (cm3@) = 2.8 X 10S2 W”mT6 Cpv = thoracic and pulmonary compliance
(cm5 l dynes-‘) = 1.23 X lo-+ M/l-O0 I+ = respiratory frequency (s-l) = 5.5 X loo Wwo*28 GH = basal metabolic rate (ergs-‘) = 2.14 X lo5 W”+734 W = body weight (g) The small scale effect (RME = 0.03) results from substituting the four em-
pirical allometric equations in equation 42. As has been said, only when the four theoretically deduced exponents (b) are used may an RME of exactly zero be ex- pected.
E. Invariant Number of Cardiores-iratory System of Mammals
The product of the invariant numbers (Ic and IR) yields the following multi- variable relationship [Gunther (32)] :
I p.t3. y?&
CR = %2*TPR*Qb(Cpv$roGH)“2
= 7.176 W”*04 (43)
The resulting invariant number (I,,) represents a constant relationship among 10 variables of the circulatory and respiratory systems valid for all mam- mals. The residual mass exponent is slightly higher (b = 0.04) than in the original invariant numbers (Ic and &), but it is still small enough to be used as an inter- species index.
The disclosure of adimensional and invariant numbers seems to indicate that

October 1975 THEORY OP BIOLOGICAL SIMILARITY 693
among organs and functions exact numerical relationships should exist, irrespective of the size and nature of the model concerned.
XI. ICONIC TREATMENT OF PHYSIOLOGICAL PROBLEMS
A. Block Diagram of Systemic Ci?dation of A4ammals
The cardiovascular system of mammals can be analyzed as a causal chain of allometric equations, characterized in each instance by the corresponding reduced exponent (6).
The algorithmic treatment of a functional sequence of allometric equations has been derived from an iconic representation of algebraically interrelated func- tions, as reported previously by Milhorn (57), Guyton and Coleman (35), Gunther and Hodgson (34), and Gunther (22).
The sequence of this analysis may be characterized numerically in the follow- ing manner (Fig. 7) :
1) During the cardiac cycle, the telediastolic volume (VTD) is reduced (minus sign) in the amount of the stroke volume (Vs), while the telesystolic volume (VTS)
remains in the heart. All these volumes (see Table 3) theoretically should have the same reduced exponent (b = 1.00).
2) The product of the stroke volume (Vs) times the frequency of the heartbeat (I?h) yields the minute volume (MV). In the present case the following allometric operation should be made:
M/'l.O x w-o.27 = M/O"73
3) The minute volume (MV) times the total peripheral resistance (TPR) gives the mean systemic arterial pressure (Pas), as a result of:
M/o.73 x w-o.73 = pj,ro.oo
4) The mean systemic pressure (Pas) times the conductance of the arteriolar outflow (FK) yields again the minute volume (MV).
5) The minute volume (MV) times the d,uration of the diastolic period of
FIG. 7. Block diagram and allometric algorithm of cardio- vascular system of mammals. For description, see text. [From Giin- ther (24) .]

694 EL G‘ijNTHER Volume 55
the heart (TD) determines the amount of blood (AV) that is to fill the heart cham- bers during diasto le. This allometric product reads as follows:
wO.73 x wO.27 = j,$71.00
6) The telesystolic volume (VTS) plus the diastolic volume increment (AV) gives the telediastolic volume (VTD), and thus we return to the starting point of our analysis.
This sequence is valid for the cardiovascular system of the mammalian model, irrespective of the size of the animal, since all basic allometric equations were derived from interspecies experimental findings.
In each block the corresponding theoretical allometric reduced exponent (b) has been indicated, to illustrate the algorithmic sequence and to permit the alge- braic control.
B. Block Diagram of Gas Transport System: Blood, Circulatory, and Respiratory Systems
Figure 8 shows the algorithmic sequence of the gas transport systems until the cellular level is reached:
I) The respiratory minute volume both for inspired (VI) or expired (VE) air is the result of the tidal volume (VT) times the respiratory frequency (%‘r) per minute.
2) The oxygen uptake of the organism during 1 min (vo,) results from the difference between the quantity of oxygen present in the inspired air (VI X FI&
minus the quantity of oxygen in the expired air (VE X FE&, in agreement with the well-known respiratory equation :
x702 = 91 X F1oP - VE X FEDS
3) The aerobic metabolism of all cells belonging to an organism is associated with oxygen consumption (Vo2) and to carbon dioxide production (VCO~). As
CO2 is leaving the cells, it should have a negative sign. 4) The oxygen delivered to the cells (002) can be calculated in accordance
with Fick’s principle [VOW = MV (Ca,, - C&J.
FIG. 8. Block diagram and algorithm of allometric equations
corresponding to circulatory, res- piratory, and metabolic systems of mammals. For description, see
text. [From Gianther (24).]

October 1975 THEORY OF BIOLOGICAL SXMILAWITY 695
5) As mentioned previously (Fig. 7) the stroke volume (Vs) times the heart rate (l?h) yields the minute volume (MV) of blood ejected by the heart.
6) Carbon dioxide transport can also be described by Fick’s principle. 7) Finally, the total amount of carbon dioxide produced per minute (ho,)
divided by the CO2 fraction of the expired air (FEATS) yields the minute volume of expired air, in agreement with the well-known respiratory equation :
Within each block of the diagram (Fig. 8) we can find the corresponding allometric reduced exponents (b), in accordance with equation 17 and Table 3.
C. Signal-Flow Diagram of Cardiovascular System of Mammals
Instead of the block diagram, it is possible to use for the same purpose the signal-flow algebra developed by S. J. Mason in 1953 in order to describe the algorithm of allometric equations belonging, for instance, to the cardiovascular system of mammals.
According to Ogata (59), the signal-flow graph consists of a network in which “nodes” are connected by “directed branches,” where each node represents a system variable and each branch, connected between two nodes, acts as a signal multiplier. As we might expect, a signal-flow graph contains essentially the same information as the more conventional block diagram, but has great advantages with regard to the mathematical solutions of complicated networks with multiple- feedback circuits.
For example, let us consider the cardiovascular system of mammals as a “path” from the “source” represented in this case by the stroke volume (Vs) until reaching the “sink,” which is represented by the mean systemic arterial pressure (Pas). Figure 9A shows that the stroke volume (Vs) multiplied by the gain or transmittance, namely the heart rate (l?h), yields the minute volume (MV), and multiplied by the total peripheral resistance (TPR) it gives the systemic arterial pressure (Pas).
Figure 9B illustrates the algorithmic sequence of the algebraic operations, starting from the stroke volume (b = 1.00) to the systemic arterial pressure (b = 0.00); Figure 9C shows the total transmittance of the original cascaded branches; and Figure 9D confirms that the product of the three variables yields the correct dimensional answer (Fig. 9E).
XII. SUMMARY
From this review we may conclude the following : 1) The body weight of an organism is an adequate reference index for the
correlation of morphological and physiological characteristics. In comparative physiology, body weight can be recommended as a unifying
frame of reference, particularly if the ponderal scale includes several decades, in order to apply logarithmic scales for the variables involved.

696 B. GUNTHER Volume 55
0 A
0 B
0 c
VS ih h/W TPR Pi% 0 \ / v / I.0 -027 0.73 -0.73 a0
ihx,TPR 3 /
VS PCS
FIG. 9. Signal-flow diagrams of circulatory sys- tem, corresponding allometric exponents (b), and dimensional analysis. [From Giinther (24) .]
0 B Vsx ihxTPR= PC
2) The statistical analysis of the experimental data can be represented con- veniently by means of the logarithmic equivalent of Huxley’s allometric equation
(Y = a- W), which is the most simple and at the same time the most versatile mathematical expression for intra- or interspecies comparisons.
The exponents (b) for the allometric equations can be predicted for all bio- logical variables definable in terms of the 1MLT system of physics (M = mass, L = length, T = time) or of a four-dimensional system MLTt, where t = tem- perature.
3) By means of dimensional analysis and the theory of biological similarity a range of similarity criteria can be established: a> mechanical or dynamic similarity; b) kinematic or biological similarity; and c) hydrodynamic or transport similarity.
Most functions obey the so-called biological (kinematic) similarity, particu- larly when the concept of operational time is introduced into Lambert-Teissier’s original theory.
4) A satisfactory correlation (r = 0.99) for 80 empirical allometric exponents (b) describing morphological and physiological characteristics of living beings was found. These results are discussed in relation to Rosen’s optimality principles in biology.
5) Organisms should be considered as mixed regimes. This means that no single similarity criterion can predict the allometric exponent (b) of all functions that dimensionally belong to ML 5P or MLTt systems, despite the fact that in the great majority of cases kinematic similarity will satisfactorily predict the reduced exponent (b). Nevertheless, in some instances mechanical (dynamic) similarity must be applied, and in other circumstances hydrodynamic (transport) similarity.
6) Cellular or molecular levels are not in the domain of the present theory, since neither cell dimensions nor molecular processes (viz., blood viscosity, diffu- sion capacity) can be predicted by biological similarity criteria.
7) From the treatment of pairs of allometric equations new algebraic relation-
October 1975 THEORY OF BIOLOGICAL SIMILARITY 697
ship were deduced with the aim of using not only body weight as a reference system but also any organ weight or any function. In all instances new allometric equa- tions were obtained.
By means of the empirical canceling method of Stahl, or by dimensional and solution matrices, dimensionless and invariant numbers were obtained for the cardiovascular and respiratory systems of mammals. These invariant numbers may be used for characterizing multivariable systems, irrespective of the size of the organisms concerned.
8) ,411ometric equations can be associated into causal chains through an al- gorithmic treatment of a complete set of functional relationship, by means of block diagram or signal-flow diagram representations.
9) Dimensional analysis and similarity criteria constitute a valuable procedure for the prediction of multiple morphological and physiological parameters in animals.
I am indebted to Dr. Federico Leighton for helpful criticism and to Miss Alicia Vicente for typing and preparation of the manuscript. I thank the authors and publishers who kindly granted permission for reproduction of Figures 2, 5, and 7-9.
REFERENCES
1. ADOLPH, E. F. Q uantitative relations in the physio- logical constitution of mammals. Science 109: 579-585, 1949.
2. BENEDICT, F. G. Vital Energetics. A Study in Compara- tive Basal Metabolism. Washington, D. C. : Carnegie Inst. Washington Monograph 503, 1938.
3. BERNARD, C. Introduction a Z’ktude de la Mt!decine Expirimentule. Paris : Bailliere, 1865.
4. BERTALANFFY, L. VON. Quantitative laws in metabolism and growth. Quart. Rev. BioZ. 32 : 217-231, 1957.
5. BERTALANFFY, L. VON. Basic concepts in quantita- tive biology of metabolism. Helgoluender Wiss. Meere- suntersuch. 9: 5-37, 1964.
6. BERTALANFFY, L. VON. General Systems Theory, Formulations, Development, AppZicu tion. New York: Braziller, 1968.
7. BIRKHOFF, G. Hydrody numics, a Study in Logic, Fact and Similitude (2nd ed.). Princeton, N.J. : Princeton Univ. Press, 1960.
8. BRIDGMAN, P. W. Dimensional Analysis. New Haven, Conn. : Yale Univ. Press, 1922.
9. BRODY, S. Bioenergetics and Growth, with Special Refer- ence to the E#ciency Complex in Domestic Animals. New York : Reinhold, 1945.
10. CALDER, W. A. Respiratory and heart rates of birds at rest. Condor 70 : 358-365, 1968.
11. DREYER, G., W. RAY, AND W. A. WALKER. The size of the trachea in warm-blooded animals, and its relationship to the weight, the surface area, the blood volume, and the size of the aorta. PYOC. Roy. Sot., London, SY. B 86 : 56-65, 1912.
12. DUNCAN, W. J. Phy sicul Similarity and Dimensional Analysis. London : Arnold, 1953.
13. FOCKEN, C. M. Dimensional Methods and their Applicu- lions. London : Arnold, 1953.
14. GALVKO, P. E. Heat production in relation to body weight and body surface. Inapplicability of the surface
law on dogs of the tropical zone. Am. J. Physiol. 148: 478-489, 1947.
15. GALVKO, P. E. Human heat production in relation to body weight and body surface. I. Inapplicability of the surface law on lean men of the tropical zone. J. AppZ. Physiol. 1 : 385-394, 1948.
16. GALVXO, P. E. Human heat production in relation to body weight and body surface. II. Inapplicability of the surface law on well proportioned men of the tropi- cal zone. J. AppZ. Physiol. 1 : 395-401, 1948.
17. GALVAO, P. E., J. TARASANTCHI, AND P. GUERTZENSTEIN. Heat production of tropical snakes in relation to body weight and body surface. Am. J. Physiol. 209: 501-506, 1965.
18. GEELHAAR, A., AND E. R. WEIBEL. Morphometric estimation of pulmonary diffusion capacity. III. The effect of increased oxygen consumption in Japanese waltzing mice. Resp. Physiol. 11 : 354-366, 1971.
19. GOULD, S. J. Allometry and size in ontogeny and phylogeny. BioZ. Rev. 41 : 587-640, 1966.
20. GUERRA, E., AND B. GUNTHER. On the relation- ship of the organ weight, functions and body weight. Actu Physiol. Lutinoum. 7 : l-7, 1957.
21. GUNTHER, B. Stoffwechsel und Kiirpergrosse. Di- mensionsanalyse und Similaritatstheorien. In : Physio- Zogie des Menschen (2nd ed.), edited by 0. H. Gauer, K. Kramer, and R. Jung. Munich: Urban & Schwar- zenberg, 1971, p. 117-151.
22. GUNTHER, B. Allometric ratios, invariant numbers and the theory of biological similarities. Arch. Ges. Physiol. 331 : 283-293, 1972.
23. GUNTHER, B. Physiological time and its evolution. In : Biogenesis, Evolution, Homeostusis, edited by A. Locker. Berlin : Springer, 1973, p. 127-l 33.
24. GUNTHER, B. On theories of biological similarity. In : Fortschsitte der experimentellen und theoretischen Bio- physik, edited by W. Beier. Leipzig: Thieme, 1975, vol. 19, p. l-111.

698 B. GUNTHER Volume 55
25. GUNTHER, B., AND E. GUERRA. Biological simi- larities. Acta Physiol. Latinoam. 5 : 169-186, 1955.
26. GUNTHER, B., AND E. GUERRA. Theory of biologi- cal similarity applied to some data of comparative physiology. Acta Physiol. Latinoam. 7 : 95-103, 1957.
27. GUNTHER, B., AND B. LE6N DE LA BARRA. On the space-time continuum in biology. Acta Physiol. Latinoam. 16: 221-231, 1966.
28. GUNTHER, B., AND B. LE6N DE LA BARRA. A unified theory of biological similarities. J. Theoret. Biol. 13: 48-59, 1966.
29. GUNTHER, B., AND B. LE6N, DE LA BARRA. Physiometry of the mammalian circulatory system. Acta Physiol. Latinoam. 16 : 32-42, 1966.
30. GtiNTHER, B., AND B. LE6N DE LA BARRA. Theory of biological similarities, nondimensional parameters and invariant numbers. Bull. Math. Bio- phys. 28: 91-102, 1966.
31. GUNTHER, B., AND B. LE6N DE LA BARRA. Further notes on the principle of thermal similarity and homeothermy. Acta Physiol. Latinoam. 17: 22-28, 1967.
32. GUNTHER, B., AND B. LE6N DE LA BARRA. Comparative physiometry of the mechanics of breath- ing in mammals. Resp. Physiol. 2 : 129-l 34, 1967.
33. GUNTHER, B., AND C. MARTINOYA. Operational time and theory of biological similarities. J. Theoret. BioZ. 20: 107-111, 1968.
34. GUNTHER, B., AND G. HODGSON. FisioZogia Inte- grativa. Santiago: Ediciones Universidad de Chile, 1970.
35. GUYTON, A. C., AND T. G. COLEMAN. Long-term regulation of the circulation : inter-relationships with body fluid volumes. In : Physical Bases of Circulatory Transport: Regulation and Exchange, edited by E. B. Reeve and A. C. Guyton. Philadelphia: Saunders, 1967, p. 179-201.
36. HEMMINGSEN, A. M. Energy metabolism as re- lated to body size and respiratory surfaces, and its evolution. Cophenhagen : Rept. Steno Mem. Hosp. & Nord. Insulin Lab., 1960, vol. 9/2, p. l-l 10.
37. HERRIED, C. F. II, AND B. KESSEL. Thermal conductance in birds and mammals. Camp. Biochem. Physiol. 21 : 405-414, 1967.
38. HOESSLIN, H. VON. ober die Ursache der schein- baren Abhangigkeit des Umsatzes von der Grijsse der Korperoberflache. Arch. Anat. Physiol. 329-379, 1888.
39. HOLT, J. P., E. A. RHODE, AND H. KINES. Ven- tricular volumes and body weight in mammals. Am. J. Physiol. 215: 704-715, 1968.
40. HUXLEY, J. S. P 70 bZ ems of Relative Growth. London: Methuen, 1932.
41. IPSEN, D. C. Units, Dimensions, and Dimensionless f\sumbers. N ew Y 0rk : McGraw-Hi\\, 19%.
42. JOHNSTONE, R. E., AND M. W. THRING. Pilot Plants, Models and Scale-Up Methods in Chemical En- gineerinp. New York : McGraw-Hill, 1957.
43. JUZNI&, G., AND H. KLENSCH. Vergleichende physiologische Untersuchungen iiber das Verhalten der Indices ftir Energieaufwand und Leistung des Herzens. Arch. Ges Physiol. 280 : 38-45, 1964.
44. KAYSER, C., AND A. HEUSNER. Etude comparative du mitabolisme energgtique dans la serie animale. J. Physiol., Paris 56 : 489-524, 1964.
45. KLEIBER, M. The Fire of Life, New York: Wiley, 1961.
46. KLEIBER. M. Resniratorv exchange and metabolic
rate. In : Handbook of Physiology. Respiration. Washington, D. C. : Am. Physiol. Sot., 1965, sect. 3, vol. II, p. 927- 938.
47. LAMBERT, R., AND G. TEISSIER. Theorie de la similitude biologique. Compt. Rend. 184 : 12 1-I 23, 1927.
48. LAMBERT, R., AND G. TEISSIER. Theorie de la similitude biologique. Ann. Physiol. Physicochim. BioZ. 3: 212-246, 1927.
49. LANGHAAR, H. L. Dimensional Analysis and the Theory of Models. New York: Wiley, 1951.
50. LASIEWSKI, R. C., AND W. A. CALDER, JR. A preliminary allometric analysis of respiratory variables in resting birds. Resp. Physiol. 11 : 152-166, 1971.
51. LASIEWSKI, R. C., AND W .R. DAWSON. A re- examination of the relation between standard met- abolic rate and body weight in birds. Condor 69: 13-23, 1967.
52. LE6N DE LA BARRA, B., AND B. GUNTHER. Thermal similarity principle, dimensional analysis and homeothermy. Acta Physiol. Latinoam. 15 : 378-385, 1965.
53. LEVI-CIVITA, T., AND U. AMALDI. Lezioni di Meccanica Rationale. Bologna: Zanichelli, 1950, vol. I, p. 394.
54. MAcMILLEN, R. E., AND J. E. NELSON. Bio- energetics and body size in dasyurid marsupials. Am. J. Physiol. 217: 1246-1251, 1969.
55. MALDONADO, R., H. SAN JOSE, C. MAR- TINOYA, AND B. GUNTHER. Cell size and body weight in some homeotherms and poikilotherms. Acta Physiol. Latinoam. In press.
56. McMAHON, T. Size and shape in biology. Science 179: 1201-1204, 1973.
57. MILHORN, H. T., JR. The AppZication of Control Theory to Physiological Systems. Philadelphia : Saunders, 1966.
58. MORRISON, P. R., AND F. A. RYSER. Weight and body temperature in mammals. Science 116 : 231-232, 1952.
59. OGATA, K. Modern Control Engineering. Englewood Cliffs, N. J. : Prentice Hall, 1970, p. 120-l 28.
60. PATTERSON, J. L., JR., R. H. GOETZ, J. T. DOYLE, J. V. WARREN, 0. H. GAUER, D. K. DETWEILLER, S. I. SAID, H. HOERNICKE, M. MCGREGOR, E. N. KEEN, M. H. SMITH, JR., E. L. HARDIE, M. REYNOLDS, W. P. FLATT, AND D. R. WALDO. Cardiorespiratory dynamics in the ox and giraffe, with comparative observations on man and other mammals. Ann. N. Y. Acad. Sci. 127 : 393-413, 1965.
61. PUTTER, A. Studien iiber physiologische Ahnlich- keit. Arch. Ges. Physiol. 168: 209-246, 1917; 172: 367- 412, 1918; 180: 298-340, 1920.
62. ROSEN, R. The deCmtion of D’ Arty Thompsan’o theory of transformations from the theory of optimal design. BUZZ. Math. Biophys. 24 : 279-290, 1962.
63. ROSEN, R., Optimality Principles in Biology. New York: Plenum, 1967, chapt. 5, p. 71-86.
64. SARRUS AND RAMEAUX. Rapport sur un memoire adresse a 1’Academie royale de Medecine. BUZZ. Acad. Roy. Med. 3: 1094-l 100, 1838-1839.
65. SCHOLANDER, P. F., V. WALTERS, R. HOCK, AND L. IRVING. Body insulation of some arctic and tropical mammals and birds. BioZ. Bull. 99: 225-236, 1950.
66. SEDOV, L. I. Similarity and DimensionaZ Methods in Mechanics. New York : Academic, 1959.

October 1975 THEORY OF BIOLOGICAL SIMILARITY 699
57.
68.
69.
70.
71.
72.
73.
74.
STAHL, W. R. Similarity and dimensional methods in biology. Science 137 : 205-212, 1962. STAHL, W. R. Similarity analysis of biological sya- terns. Perspectives Bid. Med. 6 : 291-321, 1963. STAHL, W. R. The analysis of biological similarity. Advun. Bid. Med. Phys. 9: 356459, 1963. STAHL, W. R. Organ weights in primates and other mammals. Stiencc 150: 1039-1042,1965. STAHL, W. R. Scaling of respiratory variables in mammals. J. A#. Physid. 22 : 453460, 1967. STAHL, W. R., AND J. Y. GUMMERSON. System- atic allometry in five species of adult primates (system- atic allometry in primates). Growth 31 : 21-34, 1967. TENNEY, S. M., AND D. BARTLETT, JR. Compara- tive quantitative morphology of the mammalian lung: trachea. RCSJ. Phvsid. 3 : 130-I 35. 1967. TENNEY, S. M., AND J. E. REMMERS. Compara- tive quantitative morphology of the mammalian lung: diffusing area. Nature I97 : 54-56, 1963.
75.
76.
77.
78.
79.
80.
al.
THOMPSON, D. W. On Growth and Form (2nd ed.). Cambridge : Cambridge Univ. Press, 1952. WEIBEL, E. R. Morphometric estimation of pulmo- nary diffusion capacity. V. Comparative morphometry of alveolar lungs. Resp. Physid. 14 : 2643, 1972. WEIBEL, E. R. Morphological basis of alveolar- capillary gas exchange. Physid. Rev. 53 : 419495, 1973. WILSON, T. A. Minimum entropy production as a design criterion for breathing. Experientia 20 : 333, 1964. WOLINSKY, H., AND S. GLAGOV. A lamellar unit of aortic medial structure and function in mammals.
Circulation Res. 20 : 99-11 I, 1967. ZEUTHEN, E. Oxygen uptake as related to body size in organisms. Quart. Rev. Bid. 28: 1-12, 1953. ZWEIFACH, B. W., AND M. INTAGLIETTA. Measurement of plasma colloid osmotic pressure. II) Comparative study of different species. Microvuscukr
Res. 3 : 83-88, 1971.