Embed Size (px)
Citation preview
J. M. rnUssENt and A. J. H.VENDRIKttNijmegen University, Nijmegen, The Netherlands
Differential luminance sensitivityof the human visual system*
In this paper the differential sensitivity of the visual system is investigated by means oftwo simultaneously presented stimuli in a yes-no procedure. The sensitivity measure 0Iappears to be proportional to stimulus intensity (i.e., Weber's law). The curve displayingWeber's law is little affected by variation of the background intensity or of the adaptationlevel. An increment threshold experiment using only one stimulus yields a proportionalityof 0I with the square root of the background intensity. An additional experiment showsthat the sensitivity measure 0I for two flashes decreases first, from dark up to aparticular background intensity, and increases when the background tends to mask theflashes. So, in general, two background levels exist with the same differential sensitivity.The results cannot easily be explained by the simple quantum fluctuation concept. Amodel based partially on electrophysiological data from the literature is proposed whichencounters a particular adaptation mechanism, a transducer with a limited dynamicalrange, and a range setting mechanism.
Several theoretical models have beenproposed by a number of authors in orderto describe the differential sensitivity ofhuman senses. Various forms of thresholdmodels have been developed, all of themassuming that sensitivity is limited by afixed threshold. A thorough discussion ofthese models was given by Green and Swets(1966). In the past decade the theory ofsignal detection has' been successfullyapplied to sensory detection by human Os.This theory assumes that differentialsensitivity is limited by noise and that theo adopts a detection criterion. Thiscriterion can be shifted by the 0 to reachoptimum performance in a particularexperimental set-up. Many experimentswere carried out to investigate theapplicability of the theory by means ofchanging the signal-to-noise ratio of thestimulus (Swets, 1964). Although this kindof experiment yielded interestinginformation about the central nervousdecision mechanism, it may be not themost straightforward method to investigatethe properties of a sensory system.
Another procedure was performed byEijkman and Vendrik (1963). By usingstimuli with a noise level as low as possiblethey showed that the theory of signaldetection is useful to describe theexperimental data of the measurement ofthe absolute sensitivity of touch and
*This paper is based in part on a dissertationfor the PhD in the Faculty of Science, NijmegenUniversity, Nijmegen, TheNetherlands.
[Present address: Laboratory of Physics,Department of Ophthalmology, NijmegenUniversity, Geert Grooteplein Z 22, Nijmegen,The Netherlands.
ttDepartment of Medical Physics, NijmegenUniversity, Geert Grooteplein N 21, Nijmegen,The Netherlands.
warmth perception of the skin. In thatstudy it was assumed that absolutesensitivity is limited by internal noise,which was proposed to be a fluctuatingneural activity added to the nonfluctuatingneural activity evoked by the stimulus.Eijkman and Vendrik showed that certaincharacteristics of this internal noise can bederived.
Eijkman et al (1966) studied thedifferential sensitivity of the auditorysystem by using stimuli without purposelyadded noise. Differential sensitivity isdefined as the intensity increment whichyields a particular degree ofdiscriminability from the original stimulus.They investigated the validity of Weber'slaw, which states that differentialsensitivity is proportional to stimulusintensity. Eijkman et al (1966) studied thehypothesis that Weber's law can beexplained by multiplicative noise. Thisnoise is assumed to originate fromfluctuations of a gain factor in the sensory~j'~tem and thereby increases with stimulusstrength. A detection model for theauditory system based upon thishypothesis has been called the"multiplicative noise model." It appeared,however, that the experimental resultscould be described better by anothermodel, which has been called the"multirange meter model." In this modelthe relevant internal noise is of an additivenature. To explain Weber's law it has beenassumed that a gain factor within thesensory system is adapted to the range ofintensities used. This gain-adaptingmechanism may be considered to be a kindof habituation effect. The 0 focuses hisattention on the range of stimulusintensities in order to be able to use asubtle discrimination system with a limited
dynamical range, in contrast to a coarsesystem, which may be used in case ofunknown stimuli. The consequence of thisrange-setting mechanism is that, if aconstant noise power is present beyond it,the noise "translated" to the inputbecomes signal dependent, l.e., dependenton the overall level of stimulus intensitiesused in a particular experiment, but not onthe actual value of the stimulus intensity ina single trial.
Thijssen and Vendrik (1968) evaluatedthe consequences, which result from theassumptions included in both of theabove-mentioned detection models, onpsychometric curves and ROCs (receiveroperating characteristics). These two typesof curves represent two possible ways ofelaborating the data of discriminationexperiments. They showed how theapplicability of the models can beinvestigated by studying the properties ofthe curves. Moreover, they confirmed theresult of Eijkman et al (1966) regarding thepreference of the multirange meter modelfor the auditory system. The transducerfunction relating stimulus intensity withneural activity, upon which a decision isbased, was shown to be intensitydependent. This result has been confirmedindependently by Treisman and Irwin(1967), who compared monaural andbinaural detection. Thijssen and Vendrik(1968) also presented data on visualdiscrimination. The conclusion was that forthe visual system the multirange metermodel is to be preferred, i.e., the noiselimiting the discrimination sensitivity isadditive.
The present paper concerns aninvestigation of the applicability of Weber'slaw to the differential sensitivity of thevisual system under various conditions ofthe adaptation level. The conventionalmethod of increment thresholddetermination is not adequate fromdetection theoretical point of view. Withthis method it is assumed that the 0 is ableto take a sample identical both in durationand location with the stimulus from acontinuously presented background, whichhas not been proven to be true(cf. Leshowitz et al, 1968). Moreover, inthe interpretation of the data it is oftenassumed that the transducer function isequal for background light and flash light(Treisman, 1966; Treisman & Leshowitz,1969). The latter assumption is unlikely, ascan be concluded both frompsychophysical and electrophysiologicalevidence (Craik, 1940; Stevens & Stevens,1963; Sakman & Creutzfeld, 1969). Thepresent experiments are designed to studythe effect of stimulus intensity andbackground level or adaptation levelseparately. The stimuli were accompanied
58 Copyright 1971, PsychonomicJoumals, Inc., Austin, Texas Perception & Psychophysics, 1971, Vol. 10 (1)
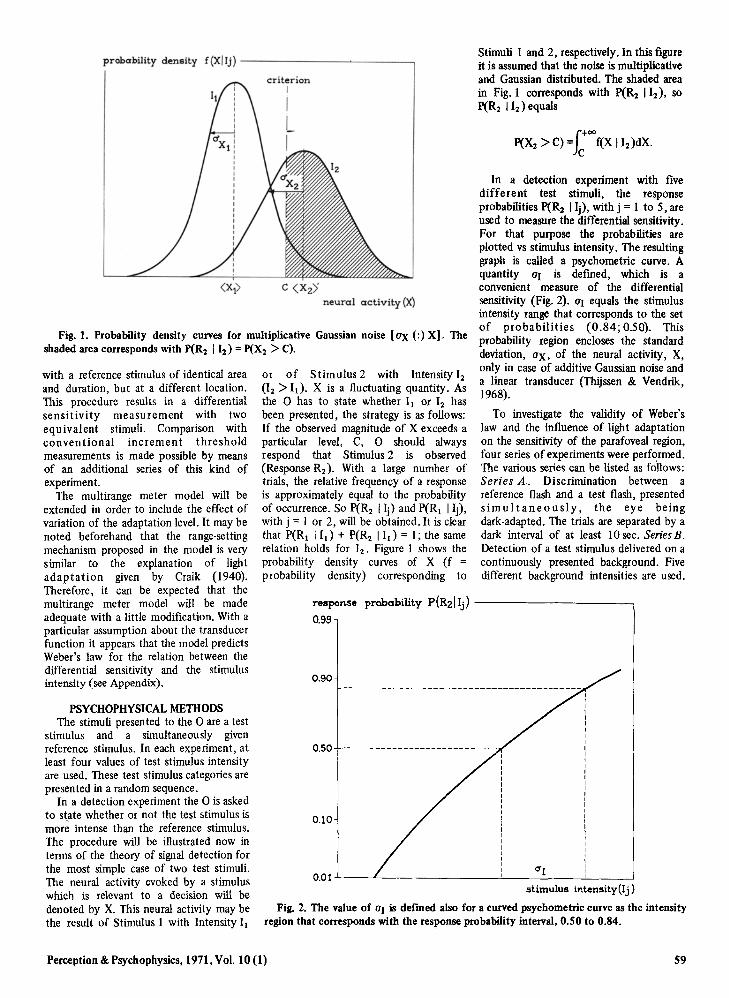
In a detection experiment with fivedifferent test stimuli, the responseprobabilities p(R 2 I Ij), with j = 1 to 5, areused to measure the differential sensitivity.For that purpose the probabilities areplotted vs stimulus intensity. The resultinggraph is called a psychometric curve. Aquantity aJ is defined, which is aconvenient measure of the differentialsensitivity (Fig. 2). OJ equals the stimulusintensity range that corresponds to the setof probabilities (0.84; 0.50). Thisprobability region encloses the standarddeviation, aX, of the neural activity, X,only in case of additive Gaussian noise anda linear transducer (Thijssen & Vendrik,1968).
To investigate the validity of Weber'slaw and the influence of light adaptationon the sensitivity of the parafoveal region,four series of experiments were performed.The various series can be listed as follows:Series A. Discrimination between areference flash and a test flash, presentedsimultaneously, the eye beingdark-adapted. The trials are separated by adark interval of at least 10 sec. SeriesB.Detection of a test stimulus delivered on acontinuously presented background. Fivedifferent background intensities are used.
Stimuli 1 and 2, respectively. In this figureit is assumed that the noise is multiplicativeand Gaussian distributed. The shaded areain Fig. 1 corresponds with P(R2 112 ) , sop(R2 I12 ) equals
.(+00p(X2 >C) =J
cf(X I12 )dX.
O.Q1-'----L--- -----J__-=-__-...!...-__-.J
o~o ----------------------------
0.90
0.10
C <XZlneural activity (X)
criterionI
ILI
cTr
stimulus intensity (1j)
Fig. 2. The value of aJ is defined also for a curved psychometric curve as the intensityregion that corresponds with the response probability interval, 0.50 to 0.84.
or of Stimulus 2 with Intensity 12(12 ) Ij ), X is a fluctuating quantity. Asthe 0 has to state whether II or 12 hasbeen presented, the strategy is as follows:If the observed magnitude of X exceeds aparticular level, C, 0 should alwaysrespond that Stimulus 2 is observed(Response R2 ) . With a large number oftrials, the relative frequency of a responseis approximately equal to the probabilityof occurrence. So p(R2 I Ij) and P(RI I Ij),with j =1 or 2, will be obtained. It is clearthat P(RI lId + P(R2 lId = I; the samerelation holds for 12 , Figure I shows theprobability density curves of X (f =probability density) corresponding to
response probability p{Rzllj)----------0.99
probability density f(Xllj) -----------_--,
Fig. 1. Probability density curves for multiplicative Gaussian noise [ax (:) xt 0 Theshaded area corresponds with P(R2 I12 ) = P(X2 > C).
PSYCHOPHYSICAL METHODSThe stimuli presented to the 0 are a test
stimulus and a simultaneously givenreference stimulus. In each experiment, atleast four values of test stimulus intensityare used. These test stimulus categories arepresented in a random sequence.
In a detection experiment the 0 is askedto state whether or not the test stimulus ismore intense than the reference stimulus.The procedure will be illustrated now interms of the theory of signal detection forthe most simple case of two test stimuli.The neural activity evoked by a stimuluswhich is relevant to a decision will bedenoted by X. This neural activity may bethe result of Stimulus 1 with Intensity II
with a reference stimulus of identical areaand duration, but at a different location.This procedure results in a differentialsensitivity measurement with twoequivalent stimuli. Comparison withconventional increment thresholdmeasurements is made possible by meansof an additional series of this kind ofexperiment.
The multirange meter model will beextended in order to include the effect ofvariation of the adaptation level. It may benoted beforehand that the range-settingmechanism proposed in the model is verysimilar to the explanation of lightadaptation given by Craik (1940).Therefore, it can be expected that themultirange meter model will be madeadequate with a little modification. With aparticular assumption about the transducerfunction it appears that the model predictsWeber's law for the relation between thedifferential sensitivity and the stimulusintensity (see Appendix).
Perception & Psychophysics, 1971, Vol. 10 (1) 59
8III
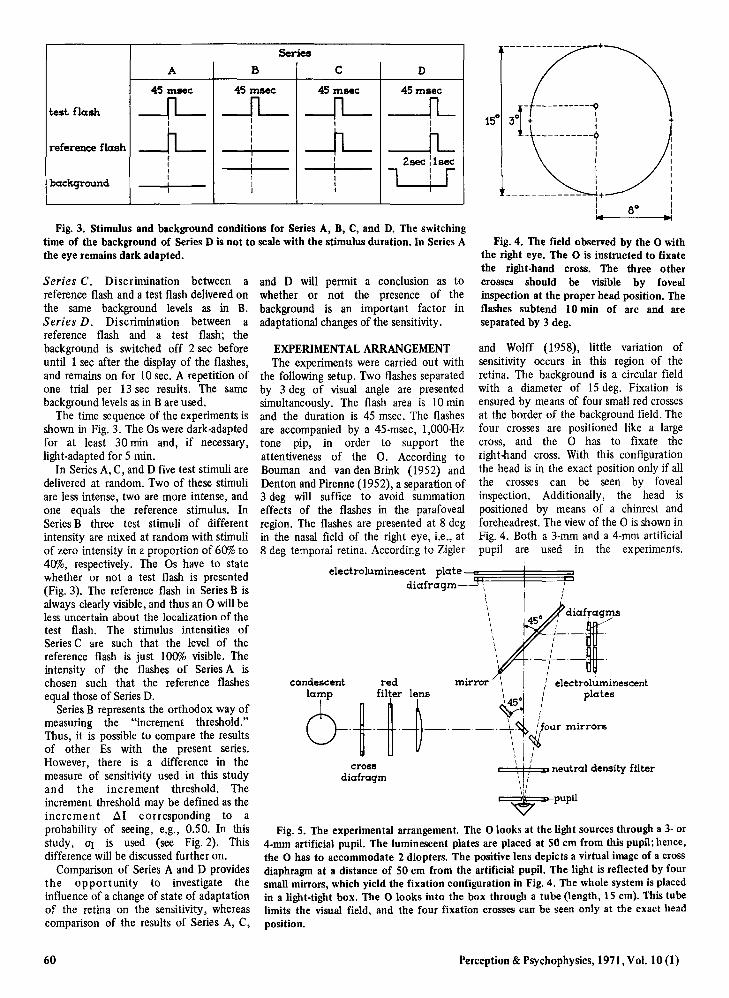
Fig. 4. The field observed by the 0 withthe right eye. The 0 is instructed to fixatethe right-hand cross. The three othercrosses should be visible by fovealinspection at the proper head position. Theflashes subtend 10 min of arc and areseparated by 3 deg.
and Wolff (1958), little variation ofsensitivity occurs in this region of theretina. The background is a circular fieldwith a diameter of 15 deg. Fixation isensured by means of four small red crossesat the border of the background field. Thefour crosses are positioned like a largecross, and the 0 has to fixate theright-hand cross. With this configurationthe head is in the exact position only if allthe crosses can be seen by fovealinspection. Additionally, the head ispositioned by means of a chinrest andforeheadrest. The view of the 0 is shown inFig. 4. Both a 3-mm and a 4-mm artificialpupil are used in the experiments.
electroluminescent plate-----:::q~§§~~~~5diafragm~\
I\\\\\\\\\\\
diafraqms
~-f,-/~-t·
candescent red mirror" I ! electroluminescentlamp filter lens :"45 0 i ( plates
6- ~ ~ ~ I
+11--'-'-1.1t 'mtrrore
cross ~\. neutral density filterdiafraqm \ I
\ I
~PUPil
Fig. S. The experimental arrangement. The 0 looks at the light sources through a 3- or4-mm artificial pupil. The luminescent plates are placed at 50 em from this pupil; hence,the 0 has to accommodate 2 diopters. The positive lens depicts a virtual imageof a crossdiaphragm at a distance of SOcm from the artificial pupil. The light is reflected by foursmall mirrors, which yield the fixation configuration in Fig. 4. The whole system is placedin a light-tight box. The 0 looks into the box through a tube (length, 1S em). This tubelimits the visual field, and the four fixation crosses can be seen only at the exact headposition.
and D will permit a conclusion as towhether or not the presence of thebackground is an important factor inadaptational changes of the sensitivity.
EXPERIMENTAL ARRANGEMENTThe experiments were carried out with
the following setup. Two flashes separatedby 3 deg of visual angle are presentedsimultaneously. The flash area is 10 minand the duration is 45 msec. The flashesare accompanied by a 45·msec, 1,000·Hztone pip, in order to support theattentiveness of the O. According toBouman and van den Brink (1952) andDenton and Pirenne (1952), a separation of3 deg will suffice to avoid summationeffects of the flashes in the parafovealregion. The flashes are presented at 8 degin the nasal field of the right eye, i.e., at8 deg temporal retina. According to Zigler
Series
A B C D
45 ml!Iee 45 msec 45 msee 45msec
test flash ----fl- ----fl- ----fl- --fL, 1 1 I,
-h- ,-h-
,, --fLreference flash ,i
f 1 , 2sec :lsec,I II l
,Ibackground
I I 1 II I I II I I 1
Fig. 3. Stimulus and background conditions for Series A, B, C, and D. The switchingtime of the background of Series D is not to scale with the stimulus duration. In Series Athe eye remains dark adapted.
Series C. Discrimination between areference flash and a test flash delivered onthe same background levels as in B.Series D. Discrimination between areference flash and a test flash; thebackground is switched off 2 sec beforeuntil 1 sec after the display of the flashes,and remains on for 10 sec. A repetition ofone trial per 13 sec results. The samebackground levels as in B are used.
The time sequence of the experiments isshown in Fig. 3. The Os were dark-adaptedfor at least 30 min and, if necessary,light-adapted for 5 min.
In Series A, C, and D five test stimuli aredelivered at random. Two of these stimuliare less intense, two are more intense, andone equals the reference stimulus. InSeries B three test stimuli of differentintensity are mixed at random with stimuliof zero intensity in a proportion of 60% to40%, respectively. The Os have to statewhether or not a test flash is presented(Fig. 3). The reference flash in Series B isalways clearly visible, and thus an 0 will beless uncertain about the localization of thetest flash. The stimulus intensities ofSeries C are such that the level of thereference flash is just 100% visible. Theintensity of the flashes of Series A ischosen such that the reference flashesequal those of SeriesD.
Series B represents the orthodox way ofmeasuring the "increment threshold."Thus, it is possible to compare the resultsof other Es with the present series.However, there is a difference in themeasure of sensitivity used in this studyand the increment threshold. Theincrement threshold may be defined as theincrement ~I corresponding to aprobability of seeing, e.g., 0.50. In thisstudy, al is used (see Fig. 2). Thisdifference will be discussed further on.
Comparison of Series A and D providesthe opportunity to investigate theinfluence of a change of state of adaptationof the retina on the sensitivity, whereascomparison of the results of Series A, C,
60 Perception & Psychophysics, 1971, Vol. 10 (1)
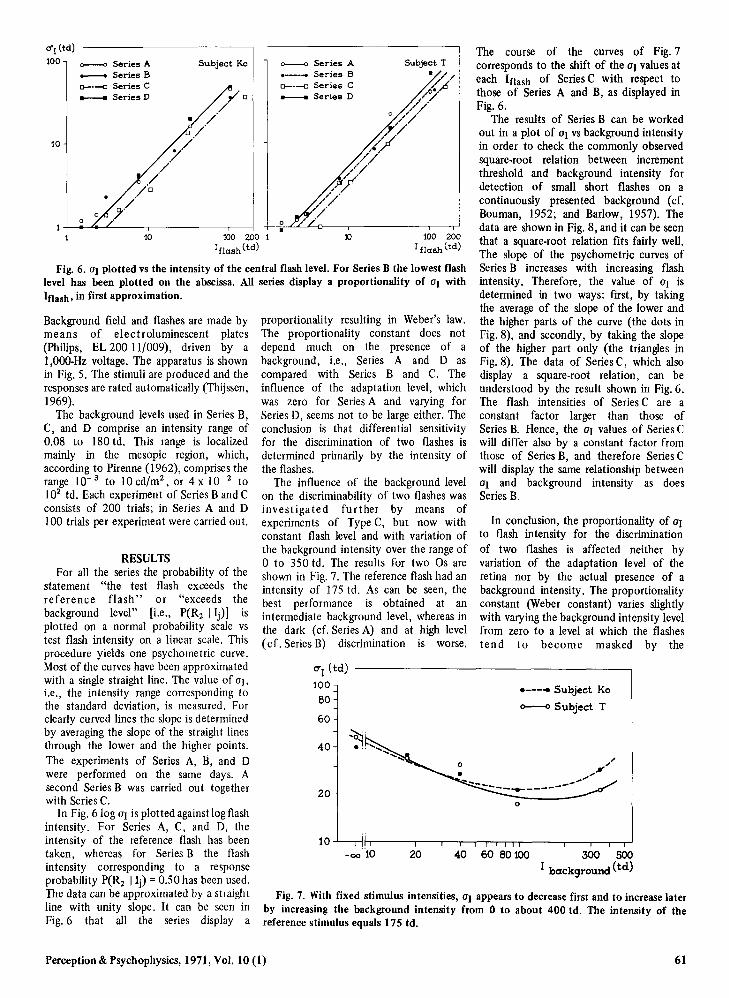
Fig. 6. at plotted vs the intensity of the central flash level. For Series B the lowest flashlevel has been plotted on the abscissa. All series display a proportionality of at withIOash, in first approximation.
300 500I background (td)
.---.. Subject Ko
0---0 Subject T
o
60 80100
In conclusion, the proportionality of aIto flash intensity for the discriminationof two flashes is affected neither byvariation of the adaptation level of theretina nor by the actual presence of abackground intensity. The proportionalityconstant (Weber constant) varies slightlywith varying the background intensity levelfrom zero to a level at which the flashesten d to become masked by the
The course of the curves of Fig. 7corresponds to the shift of the at values ateach IOash of Series C with respect tothose of Series A and B, as displayed inFig. 6.
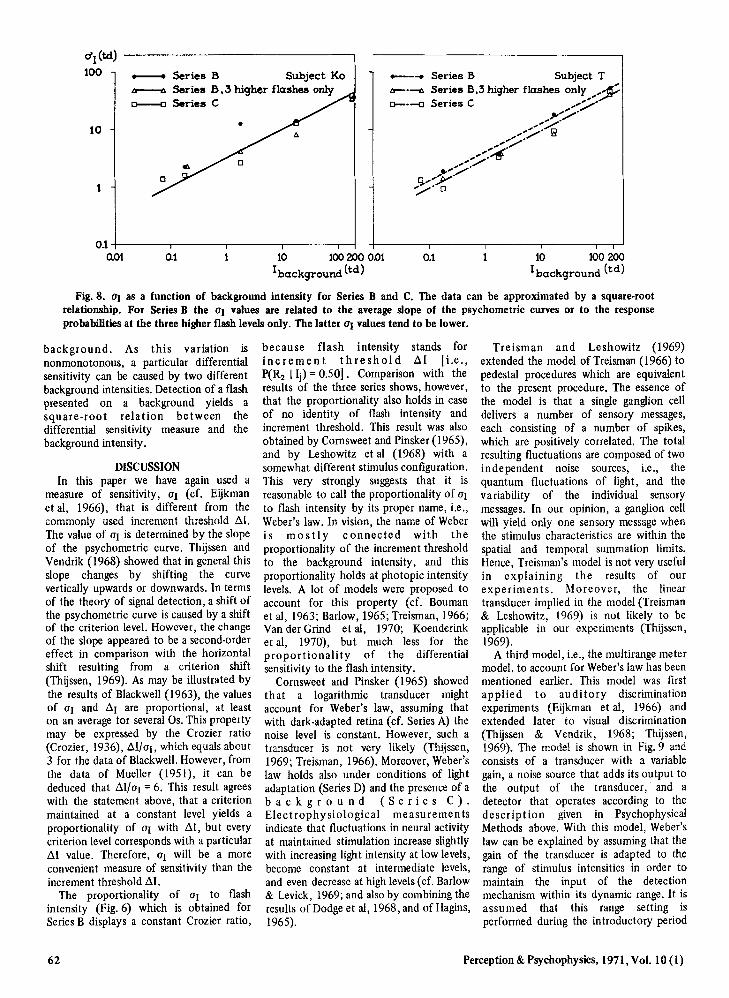
The results of Series B can be workedout in a plot of at vs background intensityin order to check the commonly observedsquare-root relation between incrementthreshold and background intensity fordetection of small short flashes on acontinuously presented background (cr.Bouman, 1952; and Barlow, 1957). Thedata are shown in Fig. 8, and it can be seenthat a square-root relation fits fairly well.The slope of the psychometric curves ofSeries B increases with increasing flashintensity. Therefore, the value of at isdetermined in two ways: first, by takingthe average of the slope of the lower andthe higher parts of the curve (the dots inFig. 8), and secondly, by taking the slopeof the higher part only (the triangles inFig. 8). The data of Series C, which alsodisplay a square-root relation, can beunderstood by the result shown in Fig. 6.The flash intensities of Series C are aconstant factor larger than those ofSeries B. Hence, the at values of Series Cwill differ also by a constant factor fromthose of Series B, and therefore Series Cwill display the same relationship betweenat and background intensity as doesSeries B.
-,,,.1>"/-- ~,----- ...... ------
40
100 200r flash (td)
20
10
40
20
CTr (td)
10080
60
0----0 Series A.---_e Series B0-.-0 Series C__ Series D
o
Fig. 7. With fixed stimulus intensities, at appears to decrease first and to increase laterby increasing the background intensity from 0 to about 400 td. The intensity of thereference stimulus equals 175 td.
proportionality resulting in Weber's law.The proportionality constant does notdepend much on the presence of abackground, i.e., Series A and D ascompared with Series Band C. Theinfluence of the adaptation level, whichwas zero for Series A and varying forSeries D, seems not to be large either. Theconclusion is that differential sensitivityfor the discrimination of two flashes isdetermined primarily by the intensity ofthe flashes.
The influence of the background levelon the discriminability of two flashes wasinvestigated further by means ofexperiments of Type C, but now withconstant flash level and with variation ofthe background intensity over the range ofo to 350 td. The results for two as areshown in Fig. 7. The reference flash had anintensity of 175 td. As can be seen, thebest performance is obtained at anintermediate background level, whereas inthe dark (cf. Series A) and at high level(cf. Series B) discrimination is worse.
100 200 1rfl a s h (td)
Subject Ko
10
o
o---<l Series A_ SeriesB
0--'--0 Series C__ SeriesD
1 +- ...L.---,--------,---!
1
10
0'1 (td]
100
RESULTSFor all the series the probability of the
statement "the test flash exceeds thereference flash" or "exceeds thebackground level" [i.e., P(R 2 Ilj)] isplotted on a normal probability scale vstest flash intensity on a linear scale. Thisprocedure yields one psychometric curve.Most of the curves have been approximatedwith a single straight line. The value of Uj,
i.e., the intensity range corresponding tothe standard deviation, is measured. Forclearly curved lines the slope is determinedby averaging the slope of the straight linesthrough the lower and the higher points.The experiments of Series A, B, and Dwere performed on the same days. Asecond Series B was carried out togetherwith Series C.
In Fig. 610g at is plotted against log flashintensity. For Series A, C, and D, theintensity of the reference flash has beentaken, whereas for Series B the flashintensity corresponding to a responseprobability P(R 2 I Ij) =0.50 has been used.The data can be approximated by a straightline with unity slope. It can be seen inFig. 6 that all the series display a
Background field and flashes are made bymeans of electroluminescent plates(philips, EL 200 11/009), driven by a1,000-Hz voltage. The apparatus is shownin Fig. 5. The stimuli are produced and theresponses are rated automatically (Thijssen,1969).
The background levels used in Series B,C, and D comprise an intensity range of0.08 to 180 td. This range is localizedmainly in the mesopic region, which,according to Pirenne (1962), comprises therange 10- 3 to 10 cd/m 2 , or 4 X 10- 2 to102 td. Each experiment of Series Band Cconsists of 200 trials; in Series A and D100 trials per experiment were carried out.
Perception & Psychophysics, 1971, Vol. 10 (1) 61
10
- Series B Subject Ko/!I'--'ti Series B.:3 higher flashes only0----0 Series C
•
_-... Series B Subject T_.--t;. Series B,3 higher flashes only ~1>-'-0 Series C ......;;:.
»>",:~
," ../," ../
," ..~...... /..../.g.......y./' 0
10 100200lbackground (td)
0.110 100 200 0.01lbackground (td)
0.10.1+-----,,...-------,---...-------,--1
0.01
Fig. 8. 01 as a function of background intensity for Series Band C. The data can be approximated by a square-rootrelationship. For Series B the 01 values are related to the average slope of the psychometric curves or to the responseprobabilities at the three higher flash levelsonly. The latter 01 values tend to be lower.
background. As this variation isnonmonotonous, a particular differentialsensitivity can be caused by two differentbackground intensities. Detection of a flashpresented on a background yields asquare-root relation between thedifferential sensitivity measure and thebackground intensity.
DISCUSSIONIn this paper we have again used a
measure of sensitivity, uJ (cf. Eijkmanet al, 1966), that is different from thecommonly used increment threshold ~I.
The value of UI is determined by the slopeof the psychometric curve. Thijssen andVendrik (1968) showed that in general thisslope changes by shifting the curvevertically upwards or downwards. In termsof the theory of signaldetection, a shift ofthe psychometric curve is caused by a shiftof the criterion level. However, the changeof the slope appeared to be a second-ordereffect in comparison with the horizontalshift resulting from a criterion shift(Thijssen, 1969). As may be illustrated bythe results of Blackwell(1963), the valuesof UJ and ~J are proportional, at leaston an average tor severalas. This propertymay be expressed by the Crozier ratio(Crozier, 1936), ~I/Oj, which equals about3 for the data of Blackwell.However, fromthe data of Mueller (1951), it can bededuced that ~I/UJ =6. This result agreeswith the statement above, that a criterionmaintained at a constant level yields aproportionality of OJ with ~I, but everycriterion levelcorresponds with a particular~I value. Therefore, OJ will be a moreconvenient measure of sensitivity than theincrement threshold ~I.
The proportionality of UJ to flashintensity (Fig. 6) which is obtained forSeries B displays a constant Crozier ratio,
because flash intensity stands forincrement threshold ~I [I.e...P(R2 I Ij) =0.50]. Comparison with theresults of the three series shows, however,that the proportionality also holds in caseof no identity of flash intensity andincrement threshold. This result was alsoobtained by Cornsweet and Pinsker (1965),and by Leshowitz et al (1968) with asomewhat different stimulus configuration.This very strongly suggests that it isreasonable to call the proportionality of OJto flash intensity by its proper name, i.e.,Weber's law. In vision, the name of Weberis mostly connected with theproportionality of the increment thresholdto the background intensity, and thisproportionality holds at photopic intensitylevels. A lot of models were proposed toaccount for this property (cf. Boumanet al, 1963; Barlow, 1965; Treisman, 1966;Van der Grind et al, 1970; Koenderinket ai, 1970), but much less for theproportionality of the differentialsensitivity to the flash intensity.
Cornsweet and Pinsker (1965) showedthat a logarithmic transducer mightaccount for Weber's law, assuming thatwith dark-adapted retina (cf. Series A) thenoise level is constant. However, such atransducer is not very likely (Thijssen,1969; Treisman, 1966). Moreover, Weber'slaw holds also under conditions of lightadaptation (Series D) and the presence of abackground (Series C).Electrophysiological measure men tsindicate that fluctuations in neural activityat maintained stimulation increase slightlywith increasing light intensity at low levels,become constant at intermediate levels,and even decrease at high levels(cf. Barlow& Levick, 1969; and also by combining theresults of Dodge et al, 1968, and of Hagins,1965).
Treisman and Leshowitz (1969)extended the model of Treisman (1966) topedestal procedures which are equivalentto the present procedure. The essence ofthe model is that a single ganglion celldelivers a number of sensory messages,each consisting of a number of spikes,which are positively correlated. The totalresulting fluctuations are composed of twoindependent noise sources, i.e., thequantum fluctuations of light, and thevariability of the individual sensorymessages. In our opinion, a ganglion cellwill yield only one sensory message whenthe stimulus characteristics are within thespatial and temporal summation limits.Hence, Treisman's model is not very usefulin explaining the results of ourexperiments. Moreover, the lineartransducer implied in the model (Treisman& Leshowitz, 1969) is not likely to beapplicable in our experiments (Thijssen,1969).
A third model, i.e., the multirange metermodel, to account for Weber's law has beenmentioned earlier. This model was firstapplied to auditory discriminationexperiments (Eijkman et al, 1966) andextended later to visual discrimination(Thijssen & Vendrik, 1968; Thijssen,1969). The model is shown in Fig. 9 andconsists of a transducer with a variablegain, a noise source that adds its output tothe output of the transducer, and adetector that operates according to thedescription given in PsychophysicalMethods above. With this model, Weber'slaw can be explained by assuming that thegain of the transducer is adapted to therange of stimulus intensities in order tomaintain the input of the detectionmechanism within its dynamic range. It isassumed that this range setting isperformed during the introductory period
62 Perception & Psychophysics, 1971, Vol. 10 (1)
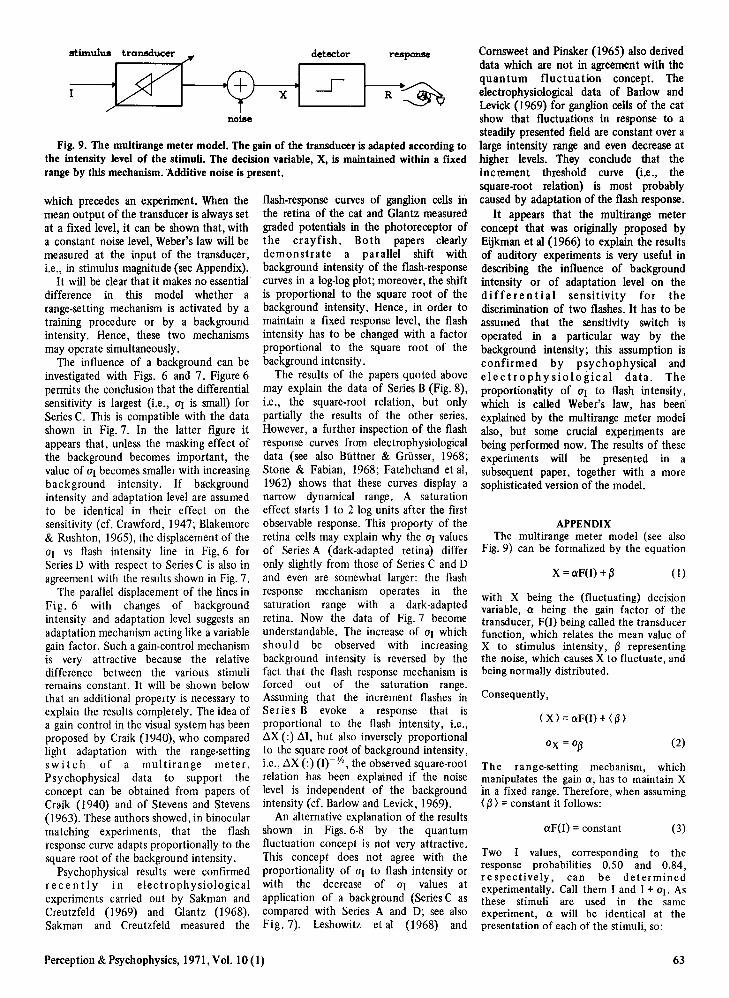
Fig. 9. The multirange meter model. The gain of the transducer is adapted according tothe intensity level of the stimuli. The decision variable, X, is maintained within a fixedrange by this mechanism. Additive noise is present.
detector
~ x~-"noise
(I)
(2)
x =o:F(I)+~
ax = a~
( X ) =o:F(I)+( ~ )
o:F(I) =constant (3)
Consequently,
with X being the (fluctuating) decisionvariable, 0: being the gain factor of thetransducer, F(I) being called the transducerfunction, which relates the mean value ofX to stimulus intensity, ~ representingthe noise, which causes X to fluctuate, andbeing normally distributed.
Cornsweet and Pinsker (l965) also deriveddata which are not in agreement with thequantum fluctuation concept. Theelectrophysiological data of Barlow andLevick (l969) for ganglion cells of the catshow that fluctuations in response to asteadily presented field are constant over alarge intensity range and even decrease athigher levels. They conclude that theincrement threshold curve (i.e., thesquare-root relation) is most probablycaused by adaptation of the flash response.
It appears that the multirange meterconcept that was originally proposed byEijkman et al (1966) to explain the resultsof auditory experiments is very useful indescribing the influence of backgroundintensity or of adaptation level on thedifferential sensitivity for thediscrimination of two flashes. It has to beassumed that the sensitivity switch isoperated in a particular way by thebackground intensity; this assumption isconfirmed by psychophysical andelectrophysiological data. Theproportionality of aJ to flash intensity,which is called Weber's law, has beenexplained by the multirange meter modelalso, but some crucial experiments arebeing performed now. The results of theseexperiments will be presented in asubsequent paper, together with a moresophisticated version of the model.
APPENDIXThe multirange meter model (see also
Fig. 9) can be formalized by the equation
Two values, corresponding to theresponse probabilities 0.50 and 0.84,respectively, can be determinedexperimentally. Call them I and 1+ ar. Asthese stimuli are used in the sameexperiment, 0: will be identical at thepresentation of each of the stimuli, so:
The range-setting mechanism, whichmanipulates the gain 0:, has to maintain Xin a fixed range. Therefore, when assuming(~ )=constant it follows:
response
~~
flash-response curves of ganglion cells inthe retina of the cat and Glantz measuredgraded potentials in the photoreceptor ofthe crayfish. Both papers clearlydemonstrate a parallel shift withbackground intensity of the flash-responsecurves in a log-logplot; moreover, the shiftis proportional to the square root of thebackground intensity. Hence, in order tomaintain a fixed response level, the flashintensity has to be changed with a factorproportional to the square root of thebackground intensity.
The results of the papers quoted abovemay explain the data of Series B (Fig. 8),i.e., the square-root relation, but onlypartially the results of the other series.However, a further inspection of the flashresponse curves from electrophysiologicaldata (see also Buttner & Grusser, 1968;Stone & Fabian, 1968; Fatehchand et ai,1962) shows that these curves display anarrow dynamical range. A saturationeffect starts 1 to 2 log units after the firstobservable response. This proporty of theretina cells may explain why the aJ valuesof Series A (dark-adapted retina) differonly slightly from those of Series C and Dand even are somewhat larger: the flashresponse mechanism operates in thesaturation range with a dark-adaptedretina. Now the data of Fig. 7 becomeunderstandable. The increase of aJ whichshould be observed with increasingbackground intensity is reversed by thefact that the flash response mechanism isforced out of the saturation range.Assuming that the increment flashes inSe r ie s B evoke a response that isproportional to the flash intensity, i.e.,LiX(:) LiI, but also inversely proportionalto the square root of background intensity,i.e., LiX (:) (1)- Yz , the observed square-rootrelation has been explained if the noiselevel is independent of the backgroundintensity (cf. Barlow and Levick, 1969).
An alternative explanation of the resultsshown in Figs. 6-8 by the quantumfluctuation concept is not very attractive.This concept does not agree with theproportionality of ar to flash intensity orwith the decrease of ar values atapplication of a background (Series C ascompared with Series A and D; see alsoFig. 7). Leshowitz et al (1968) and
which precedes an experiment. When themean output of the transducer is always setat a fixed level, it can be shown that, witha constant noise level, Weber's law will bemeasured at the input of the transducer,i.e., in stimulus magnitude (see Appendix).
It will be clear that it makes no essentialdifference in this model whether arange-setting mechanism is activated by atraining procedure or by a backgroundintensity. Hence, these two mechanismsmay operate simultaneously.
The influence of a background can beinvestigated with Figs. 6 and 7. Figure 6permits the conclusion that the differentialsensitivity is largest (I.e., aJ is small) forSeries C. This is compatible with the datashown in Fig. 7. In the latter figure itappears that, unless the masking effect ofthe background becomes important, thevalue of arbecomes smaller with increasingbackground intensity. If backgroundintensity and adaptation level are assumedto be identical in their effect on thesensitivity (cf. Crawford, 1947; Blakemore& Rushton, 1965), the displacement of thear vs flash intensity line in Fig. 6 forSeries D with respect to Series C is also inagreement with the results shown in Fig. 7.
The parallel displacement of the lines inFig. 6 with changes of backgroundintensity and adaptation level suggests anadaptation mechanism acting like a variablegain factor. Such a gain-control mechanismis very attractive because the relativedifference between the various stimuliremains constant. It will be shown belowthat an additional property is necessary toexplain the results completely. The idea ofa gain control in the visual system has beenproposed by Craik {I 940), who comparedlight adaptation with the range-settingswitch of a multirange meter.Psychophysical data to support theconcept can be obtained from papers ofCraik (1940) and of Stevens and Stevens{I 963). These authors showed, in binocularmatching experiments, that the flashresponse curve adapts proportionally to thesquare root of the background intensity.
Psychophysical results were confirmedr e c e n t1yin electrophysiologicalexperiments carried out by Sakman andCreutzfeld {I 969) and Glantz {I 968).Sakman and Creutzfeld measured the
Perception & Psychophysics, 1971, Vol. 10 (1) 63
( X> =aF(I) + «(j >
(X +~X >=aF(I + aI) +«(j) (4)
Now ( X + ~X} - ( X} = constant becausein every experiment the regioncorresponding to P (0.50,0.84) is taken,and therefore ~X equals aX, which isconstant in this model. With Eq, 4 thedifference can be written:
a[F(I + ail - F(I)I =aX =constant
and with Eq. 3:
[F(I + aI) - F(I) I/F(I) = constant
or:
[F(I + aI) I/F(I) =constant (5)
When a power function [l.e., F(I) =In I isinserted in Eq. 5 (cf. Treisman, 1966) itfollows:
or:
(1 + aI/I)n = constant.
Hence, aliI has to be constant, so Weber'slaw is valid. This result is independent ofthe value of n.
REFERENCESBARLOW, H. B. Increment thresholds at low
intensities considered as signal noisediscriminations. Journal of Physiology, 1957,136,469488.
BARLOW, H. B. Optic nerve impulses andWeber's law. In: Cold Spring Harbor symposiaon quantitative biology. Cold Spring Harbor,LJ., N.Y., 1965,30,539-546.
BARLOW, H. B., & LEVICK, W. R. Three factorslimiting reliable detection of light by retinalganglion cells of the cat. Journal ofPhysiology, 1969,200,1-24.
BLACKWELL, H. R. Neural theories of simplevisual discrimination. Journal of the OpticalSociety of America, 1963,53,129-160.
BLAKEMORE, C. B., & RUSHTON, W. A. H.The rod increment threshold during darkadaptation in normal and rod monochromat.Journal of Physiology, 1965, 181,629-640.
BOUMAN, M. A. Peripheral contrast thresholdsfor various and different wavelengths foradapting field and test stimulus. Journal of the
Optical Society of America, 1952, 42,820-831.
BOUMAN, M. A., & van den BRINK, G. On theintegrative capacity in time and space of thehuman peripheral retina. Journal of theOptical Society of America, 1952, 42,617-620.
BOUMAN, M. A., VOS, J. J., & WALRAVEN, P.1. Fluctuation theory of luminance andchromaticity discrimination. Journal of theOptical Society of America, 1963, 53,121-128.
BU'ITNER, U., & GROSSER, O. J. QuantitativeUntersuchungen d e r raiimlichenErregungssummation im rezeptiven Feldretinaler Neurone der Katze. 1. Kybernetik,1968,4,81-94.
CORNSWEET, T. N., & PINSKER, H. M.Luminance discrimination of brief flashesunder various conditions of adaptation.Journal of Physiology, 1965, 176,294-310.
CRAlK, K. J. W. The effect of adaptation onsubjective brightness. Proceedings of the RoyalSociety, B, 1940, 128,232-247.
CRAWFORD, B. H. Visual adaptation in relationto brief conditioning stimuli. Proceedings ofthe Royal Society, B, 1947, 134,283-302.
CROZIER, W. J. On the variability of criticalillumination for flicker fusion and intensitydiscrimination. Journal of General Physiology ,1936,19,503-522.
DENTON, E. J., & PIRENNE, M. H. Spatialsummation at the absolute threshold ofperipheral vision. Journal of Physiology, 1952,116, 32P-33P.
DODGE, F. A., KNIGHT, B. W., & TOYODA, J.Voltage noise in Limulus visual cells. Science,1968, 160,88-90.
EIJKMAN, E., THIJSSEN, J. M., & VENDRIK,A. J. H. Weber's law, power law, and internalnoise. Journal of the Acoustical Society ofAmerica, 1966,40,1164-1173.
EIJKMAN, E., & VENDRIK, A. J. H. Detectiontheory applied to the absolute sensitivity ofsensory systems. Biophysiological Journal,1963,3,65-78.
FATEHCHAND, R., LAUFER, M., &SVAETICHIN, G. Retinal receptor potentialsand their linear relationship to light intensity.Science, 1962, 137,666-667.
GLANTZ, R. M. Light adaptation in thephotoreceptor of the crayfish. VisionResearch, 1968,8,1407-1421.
GREEN, D. M., & SWETS, J. S. Signal detectiontheory and psychophysics. New York: Wiley,1966.
HAGINS, W. A. Electrical signs of informationflow in photoreceptors. In: Cold SpringHarbor symposia on quantitative biology,1965. Cold Spring Harbor, 1.1., N.Y., 1965,30,403-418.
KOENDERINK, J. J., VAN de GRIND, W. A., &BOUMAN, M. A. Models of retinal signalprocessing at high luminances. Kybernetik,1970,6,227-237.
LESHOWITZ. B., TAUB, H. B., & RAAB, D. H.Visual signals in the presence of continuousand pulsed background. Perception &Psychophysics, 1968,4,207-213.
MUELLER, C_G. Frequency of seeing functionsfor intensity discrimination at various levels ofadapting intensity. Journal of GeneralPhysiology, 1951, 34, 463-474.
PIRENNE, M. H. The visual process.In H. Davson (Ed.), The eye.Vol. 2. New York and London: AcademicPress, 1962.
SAKMAN, B., & CREUTZFELD, O. D. Scotopicand mesopic light adaptation in the eat'sretina.Pflugers Archiv, 1969, 313, 168-185.
STEVENS, J. C., & STEVENS, S. S. Brightnessfunction: Effects of adaptation. Journal of theOptical Society of America, 1963, 53,375-385.
STONE, J., & FABIAN, M. Summing propertiesof the eat's retinal ganglion cells. VisionResearch, 1968, 8, 1023-1040.
SWETS, J. A. Signal detection and recognition byhuman observers: Contemporary readings.New York: Wiley, 1964.
THIJSSEN. J. M. Differential luminancesensitivity of the human visual system. Adetection theoretical model based onpsychophysical and electrophysiological data.Thesis Nijmegen University, 1969. (Nijmegen:Drukkerij Gebr. Janssen N.V.)
THIJSSEN, J. M., & VENDRIK, A. J. H. Internalnoise and transducer function in sensorydetection experiments: Evaluation ofpsychometric curves and of ROC curves.Perception & Psychophysics, 1968, 3,387-400.
TRElSMAN, M. A statistical decision model forsensory discrimination which predicts Weber'slaw and other sensory laws: Some results of acomputer simulation. Perception &Psychophysics, 1966, 1,203-230.
TREISMAN, M., & IRWIN, R. J. Auditoryintensity discriminal scale. I. Evidence derivedfrom binaural intensity summation. Journal ofthe Acoustical Society of America, 1967,42,586-592.
TREISMAN, M., & LESHOWITZ, B. The effectsof duration, area, and background intensity onthe visual intensity difference threshold givenby the forced choice procedure: Derivationsfrom a statistical decision model for sensorydiscrimination. Perception & Psychophysics,1969,6,281-296.
VAN de GRIND, KOENDERINK, J. J., &BOUMAN, M. A. Models of the processing ofquantum signals by the human peripheralretina. Kybernetik , 1970,6,213'227.
ZIGLER, M. J., & WOLF, E. Uniocular andbinocular scotopic parafoveal sensitivity.American Journal of Psychology. 1958, 71,186-198.
(Accepted for publication November 1, 1970.)
64 Perception & Psychophysics, 1971, Vol. 10 (1)