Embed Size (px)
Citation preview
ORIGINAL RESEARCH ARTICLE
Delayed luminance and chromatic contrast sensitivityin infants with spontaneously regressed retinopathyof prematurity
Rain G. Bosworth • Shira L. Robbins •
David B. Granet • Karen R. Dobkins
Received: 4 March 2013 / Accepted: 28 May 2013
� Springer-Verlag Berlin Heidelberg 2013
Abstract
Background The current study assessed whether
contrast sensitivity is affected in preterm infants with
a history of spontaneously regressed retinopathy of
prematurity (ROP, Stages 1–3). Specifically, we
employed luminance (light/dark) and chromatic (red/
green) stimuli, which are mediated by the magnocel-
lular (M) and parvocellular (P) subcortical pathways,
respectively.
Methods Contrast sensitivity (CS) was measured
using forced-choice preferential looking testing in 21
infants with a history of ROP and 41 control preterm
infants who were born prematurely but did not develop
ROP, tested between 8 and 47 weeks (2–11 months)
postterm age. Infants were presented with chromatic
and luminance drifting sinusoidal gratings, which
appeared randomly on the left or right side of the
monitor in each trial. The contrast of the stimuli varied
across trials and was defined in terms of root mean
squared cone contrast for long- and medium-wave-
length cones.
Results Between 8 and 25 weeks postterm, ROP
infants had significantly worse CS, and there was a
trend for greater impairment for luminance than
chromatic CS. This delay was not seen at older ages
between 26 and 47 weeks postterm.
Conclusions These findings are consistent with the
concept that early maturation of the M pathway is
vulnerable to biological insult, as in the case of ROP,
to a greater extent than in the P pathway.
Keywords Premature � Infant � Retinopathy of
prematurity � Chromatic � Luminance � Contrast
sensitivity
Introduction
With recent technological and scientific advances in
neonatal medicine, the survival rate of infants who are
born prematurely is on the rise, as is the number of
infants who are at risk for retinopathy of prematurity
(ROP). ROP is an ocular disorder that occurs when
premature birth of an infant leads to a biochemical
chain of events that cause abnormal patterns of blood
vessel growth in the retina. It is estimated to occur in
approximately 16–19 % of all premature births and in
over 50 % of infants weighing less than 1,700 g at
birth [1, 2]. ROP affects the development of the
structure and function of the peripheral and central
retina [3–8], and some of these effects persist into
adolescence and early adulthood [5, 6, 9, 10].
R. G. Bosworth (&) � K. R. Dobkins
Department of Psychology, 0109, University of
California, San Diego, 9500 Gilman Drive, La Jolla,
CA 92093, USA
e-mail: [email protected]
S. L. Robbins � D. B. Granet
Department of Ophthalmology, Ratner Children’s Eye
Center, University of California, San Diego, CA, USA
123
Doc Ophthalmol
DOI 10.1007/s10633-013-9395-9

Children who were born very prematurely and had a
history of severe ROP have been reported to have
deficits in spatial acuity [11–15] and contrast sensi-
tivity [16–20]. It is still not clear whether less severe
ROP (stage 1–3), which accounts for approximately
85–90 % of all ROP cases [21, 22], causes specific
visual deficits beyond the complications of extreme
prematurity. In some studies with older children,
acuity and contrast sensitivity are impaired only in
severe cases of ROP, which typically coincide with
neurological abnormalities, while mild ROP shows no
additional impairment beyond prematurity alone;
however, contrast sensitivity testing in these studies
has been done using the static Pelli-Robson test, which
may not be sensitive to changes in visual sensitivity in
mild ROP [16, 17, 20, 23, 24].
Whether ROP impairs color vision is more contro-
versial, with a few studies reporting higher incidence
of color deficits in children with severe ROP, com-
pared to preterm controls [19, 25, 26] and other studies
failing to replicate this finding, even with severe ROP
[20, 23, 27, 28]. These studies used pseudoisochro-
matic plates or hue-matching tests designed as rapid
screening tests for inherited cone anomalies (i.e.,
protanopia and deuteranopia) and are not psychophys-
ical assessments of color sensitivity. One study using
computerized psychophysical measurement of con-
trast thresholds for chromatic red–green and blue–
yellow gratings found no evidence of color deficits in
children (aged 7–13 years) with a history of mild ROP
[29].
In contrast to results from these perceptual studies,
electroretinographical recordings have shown that
even mild ROP causes cellular dysfunction of both
rod and cone responses [7, 30, 31] and have been
reviewed in [32]. Multifocal ERG recordings in
children show that mild ROP decreases and delays
cone photoreceptor response, and this delay was
greatest for central fovea and became smaller with
increasing eccentricity [6]. Optical coherence tomog-
raphy studies, which use ultra-high-resolution adaptive
optical imaging to study the central retina, have
demonstrated subtle abnormalities of the macula,
including broader and shallower foveal pits, an abnor-
mal vascular layer over the fovea, and increased inner
and outer nuclear layer thickness in patients who had
ROP, suggesting that ROP alters the neurovascular
development and the redistribution of retinal cells in
this region [8]. These neurovascular effects may
contribute to subtle visual sensitivity deficits observed
in subjects with mild ROP.
The aim of the current study is to address whether or
not infants who had mild-to-moderate ROP have
impaired contrast sensitivity using psychophysical
assessment. We investigated the development of visual
contrast sensitivity to luminance (light/dark) and
chromatic (red/green) patterns using the forced-choice
preferential looking technique [33] in a selected
population of infants who were monitored in the
neonatal intensive care unit and whose medical reports
indicated that the ROP had regressed, not requiring
treatment, with no plus disease, macular ectopia, or
retinal detachment, and no or only mild brain hemor-
rhaging at the time of birth. This specific population
allowed examination of effects of ROP on visual
sensitivity, without the confounding mechanical
effects of cellular loss and scarring associated with
severe ROP. The utility of our luminance and chro-
matic stimuli in detecting visual deficits in regressed
ROP lies in the fact that our stimuli are designed to
differentially tap visual function of the two primary
visual retinogeniculate-cortical pathways—the mag-
nocellular (M) and parvocellular (P) pathways. Dis-
tinctions between these two primary visual pathways
have been supported by anatomical, physiological, and
behavioral evidence, with differentiation beginning
with distinct retinal ganglion cell types (parasol and
midget cells) projecting separately to distinct magno-
cellular (M) and parvocellular (P) layers in the lateral
geniculate nucleus (LGN) and providing relatively
segregated input to cortical areas [34–39].1 The two
pathways show marked differences in the relative
sensitivities to luminance and chromatic (red/green)
contrast. Specifically, M cells are far more sensitive to
luminance contrast than the P cells and are not selective
for chromatic properties, whereas P cells are far more
sensitive to chromatic contrast than the M cells (e.g.,
[41–43]). Based on these differences, the claim has
often been made that magnocellular and parvocellular
pathways provide the neural substrate for luminance
and chromatic contrast sensitivity, respectively. The
current study is the first to investigate whether these
1 There also exists a third pathway, the ‘‘koniocellular’’
pathway, which originates in the blue-ON bistratified cells of
the retina, and is thought to encode ‘‘blue/yellow’’ chromatic
information, which is not discussed here (see [40] for a review).
Doc Ophthalmol
123
two pathways are differentially affected in infants with
regressed ROP.
Methods
Subjects
Preterm infants with and without a history of ROP
were referred to our laboratory for vision testing
through the Neonatal Intensive Care Unit at the
University of California San Diego (UCSD) Medical
Center and the Ratner Children’s Eye Center at UCSD.
Preterm infants were also recruited via mass mailings
of 3,000–4,000 generic letters sent each month to new
parents residing in San Diego County, and parents who
were interested called our laboratory to schedule
testing. Background information from subjects was
obtained from a combination of parental interviews
and medical records obtained with parental permis-
sion. Appropriate Institutional Review Board approval
was obtained. Informed consent was obtained from a
parent before testing, and procedures adhered to the
tenets of the Declaration of Helsinki (Code of Ethics of
the World Medical Association).
The ROP group consisted of 21 preterm infants (12
males and 9 females) who had been diagnosed with
stages 1–3 ROP, in zones 2 or 3, which had spontane-
ously regressed by the time of testing and did not require
treatment. They had no form of macular dragging, folds
or retinal detachment, based on ophthalmological
exams performed by one pediatric ophthalmologist
(SLR). The number of infants with stages of ROP was
as follows: stage 1 (8), asymmetric stage 1 and stage 2 in
each eye (3), stage 2 (5), asymmetric stage 2 and stage 3
in each eye (2), and stage 3 (3), with diagnosis made in
accordance with the guidelines of International Classi-
fication of Retinopathy of Prematurity. Eight infants
with ROP had a history of sepsis. Brain ultrasound
results for the infants with ROP were as follows: normal
(6), questionable results showing some bleeding and
were later cleared or resolved with repeated imaging
(4), intraventricular hemorrhaging (IVH) grade 1–2 (5),
IVH grade 3 (2), and unconfirmed (2, but parents
reported no abnormal brain scans). No consistent
pattern of results or statistically significant differences
were linked to the degree of ROP or the presence of
brain damage in this small sample, and we were unable
to compare groups of stages as this was confounded
with age differences. The control infants consisted of 41
preterm infants with no brain damage or ROP (21 males
and 20 females).
Because we employed red/green isoluminant stim-
uli, we excluded infants with a greater than 50 %
chance of colorblindness, for example, male infants
whose maternal grandfather was known to be color-
blind. To further ensure that all our infants were
generally healthy, we included only infants who,
between the time of hospital discharge to the time of
testing, had no history of hospitalizations, surgery,
congenital or hereditary conditions, convulsions, sei-
zures, illnesses, or cranial/neurological abnormalities.
The means, standard deviations, and ranges of
postterm age (age since term), postnatal age (age since
birth), gestational age at birth (all in weeks), and birth
weights are presented in Table 1. ROP infants in our
study were born between 23 and 33 weeks gestational
age, with gestational age determined by medical report
of due date (in comparison with birth date), typically
based on the first ultrasound or on the last menstrual
period. Control infants in our sample were born
between 30 and 34 weeks gestational age. The mean
postterm ages at the time of testing for the ROP and
control groups were very closely matched (20.0 vs.
18.8 weeks, respectively), and postnatal age at the
time of test was similar, but not identical, for the ROP
and control groups (32.9 vs. 26.4 weeks, respectively).
It was impossible to match the two groups in both
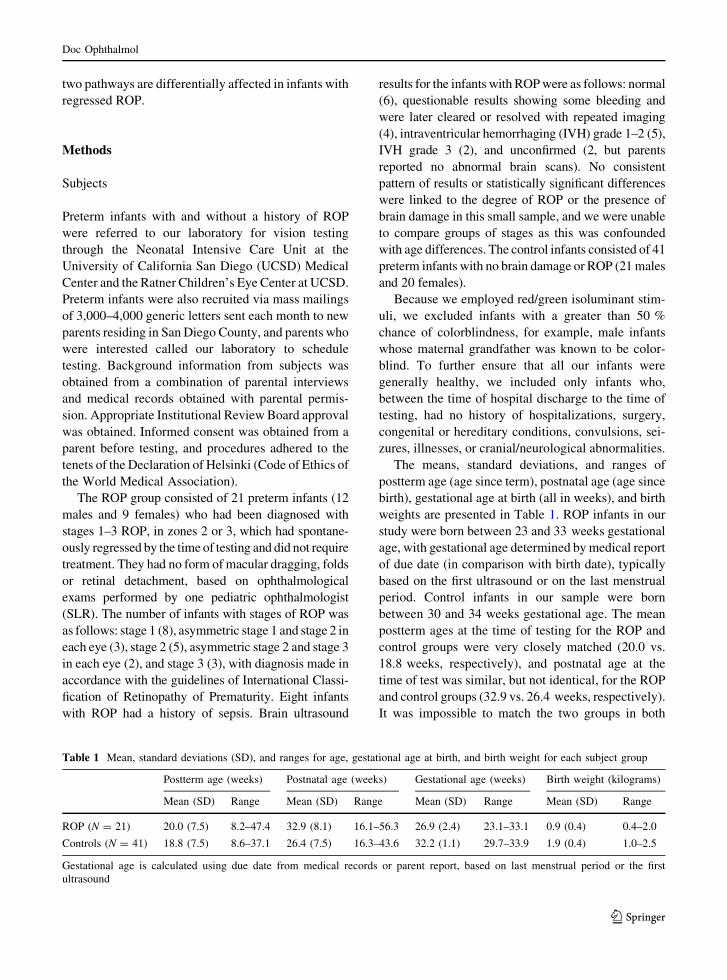
Table 1 Mean, standard deviations (SD), and ranges for age, gestational age at birth, and birth weight for each subject group
Postterm age (weeks) Postnatal age (weeks) Gestational age (weeks) Birth weight (kilograms)
Mean (SD) Range Mean (SD) Range Mean (SD) Range Mean (SD) Range
ROP (N = 21) 20.0 (7.5) 8.2–47.4 32.9 (8.1) 16.1–56.3 26.9 (2.4) 23.1–33.1 0.9 (0.4) 0.4–2.0
Controls (N = 41) 18.8 (7.5) 8.6–37.1 26.4 (7.5) 16.3–43.6 32.2 (1.1) 29.7–33.9 1.9 (0.4) 1.0–2.5
Gestational age is calculated using due date from medical records or parent report, based on last menstrual period or the first
ultrasound
Doc Ophthalmol
123
postterm and postnatal ages because the ROP group
was overall more premature, since there is a higher
prevalence of ROP with greater prematurity. We chose
to compare the two groups at roughly the same range
of postterm ages because it was very difficult to get
ROP preterms to present for testing at very young
postnatal ages. We feel strongly that the greater
prematurity in the ROP group is not an issue for two
reasons. First, the ranges of gestational age at birth
overlapped quite a bit between groups (as did the
postnatal and postterm ages). Second, gestational age
at birth was not a significant predictor of contrast
sensitivity for either ROP or controls (discussed below
in Data Analysis), and thus, this group difference in
prematurity is unlikely to account for impairments in
contrast sensitivity we observed in the ROP groups.
Apparatus and stimuli
Luminance (light/dark) and chromatic (red/green) stim-
uli were presented on an Iiyama Vision Master Pro 510
monitor (1,024 9 768 pixels, 100 Hertz) generated by a
ViSaGe video system (Cambridge Research Systems)
and a Dell Dimension XPS computer. The luminance of
the monitor was linearized and calibrated using a
spectroradiometer (PhotoResearch PR650). Stimuli
were horizontally oriented sinusoidal gratings with a
spatial frequency of 0.27 cycles/degree moving upward
or downward at a temporal frequency of 4.2 Hz. These
parameters were chosen because they are near the peak
of the spatial and temporal contrast sensitivity functions
for young infants [44–47]. The stimuli subtended 11 by
11� and were centered 15� to the left or right of the
middle of the video monitor. The mean chromaticity of
the gratings and the background was CIE = 0.486,
0.442. The mean luminance of gratings and the back-
ground was 21.3 cd/m2. Contrast of stimuli is described
in terms of cone contrast, i.e., the amount of response
modulation produced in the long- and medium-wave-
length-selective cones in the eye (see [47] or [48] for
methodological details).
Determining red/green isoluminance
The red/green chromatic stimulus in the main exper-
iment was presented at the mean isoluminance value
obtained from 18 adults, using standard motion
photometry [49–51]. In the motion photometry, adults
fixated on a small dot in the center of a moving red/
green grating and adjusted the luminance contrast in
the grating until the percept of motion was least
salient. Each adult subject’s isoluminance point was
determined from the mean of 25 trials. The stimulus
conditions for the motion photometry procedure were
identical to those employed in the main experiments
(i.e., same size, orientation, spatiotemporal fre-
quency). The justification for using the adult mean
isoluminance value in our infant experiments is based
on previous experiments demonstrating that infant and
adult mean isoluminance points are highly similar to
red/green stimuli [51–58]. Moreover, Brown and
colleagues argue quantitatively that the variability of
isoluminance points across infant subjects is compa-
rable to the variability across adult subjects, when
measurement error is taken into account [54]. In
previous studies, we have calculated that the amount
of luminance error likely to exist in our red/green
stimuli is below luminance contrast threshold for
infants (see [51] for a discussion).
Obtaining contrast sensitivities
For each infant, a luminance and chromatic contrast
threshold was obtained using the method of constant
stimuli and forced-choice preferential looking (FPL)
([33]; see [51, 59] for details). The FPL procedure
relies on the fact that infants prefer to look at a
patterned stimulus on the one side of a display rather
than a blank, homogeneous field on the opposite side.
In each trial, a grating stimulus moved randomly either
upward or downward and appeared randomly on the
left or right side of the video monitor. Testing was
conducted binocularly. The experimenter held the
infant in front of the monitor at a viewing distance of
38 cm and was unable to see the stimulus (see Fig. 1).
The experimenter viewed a video of the infant and
used cues such as the infant’s head turning and gazing
behavior to judge the left versus right location of the
stimulus. Because the mean luminance and chroma-
ticity of the stimulus is the same as that of the
background, when the contrast in the stimulus is at or
below ‘‘contrast threshold,’’ it blends into the back-
ground and cannot be seen.
Typically, five contrast values (1.25–25 % cone
contrast) were presented for each luminance and
chromatic condition. Luminance and chromatic con-
ditions, as well as the direction of motion, location of
the stimuli, and all contrast levels, were randomized
Doc Ophthalmol
123
across trials. Stimuli remained present on the video
monitor until the experimenter made the left/right
judgment, which was typically less than 2 s. The
experimenter’s answer was entered into the computer
by pressing keys on the keyboard by the parent (who
did not view the stimulus). Computer beeps provided
feedback as to whether the experimenter’s inference of
the infant’s response was correct. Data from each
infant were obtained over the course of 2 days within a
5-day period. The average number of trials for
luminance and chromatic conditions, respectively,
were 85 (±27) and 87 (±27) for the control infants and
73 (±21) and 76 (±21) for the ROP infants. For each
infant, a psychometric curve was fit to the chromatic
and luminance data using Weibull functions and
maximum likelihood analysis [60, 61]. Threshold
was defined as the contrast yielding 75 % correct
performance. Contrast sensitivity (CS) was computed
as the inverse of threshold times 100 and then logged
since log, but not linear, sensitivity data conform to the
normal distributions [62].
Data analyses
In order to inspect raw data and compare develop-
mental trajectories, we plotted all individual log CS
values as a function of postterm and postnatal ages
(Figs. 2, 3). We then fit linear regression lines
separately to log luminance CS and chromatic CS as
a function of log postterm and as a function of
postnatal age for ROP and control subjects.
We hypothesized that if contrast sensitivity is
impaired due to ROP, then infants with a history ROP
should show lower overall performance when compared
to controls (i.e., preterms without ROP). To test this
hypothesis, we compared the two groups while account-
ing for variance in our dependent measure due to
individual differences in prematurity and log postterm
age with a multivariate analysis of covariance. We
entered subject group (ROP vs. control) as an indepen-
dent variable, stimulus type (luminance vs. chromatic)
as a repeated subjects variable, and gestational age at
birth as well as log postterm age as covariates. Next, we
tested the homogeneity-of-slopes assumption, to con-
firm that the effects of the covariates did not differ for the
subject groups. Results of this indicated that the effect of
log postterm age on CS was different for the two groups,
and this effect was significant (p = 0.05; values
reported in Results below). Hence, we employed a
separate-slopes general linear model (GLM), which
includes the interaction terms between the covariate and
independent variables. Because gestational age at birth
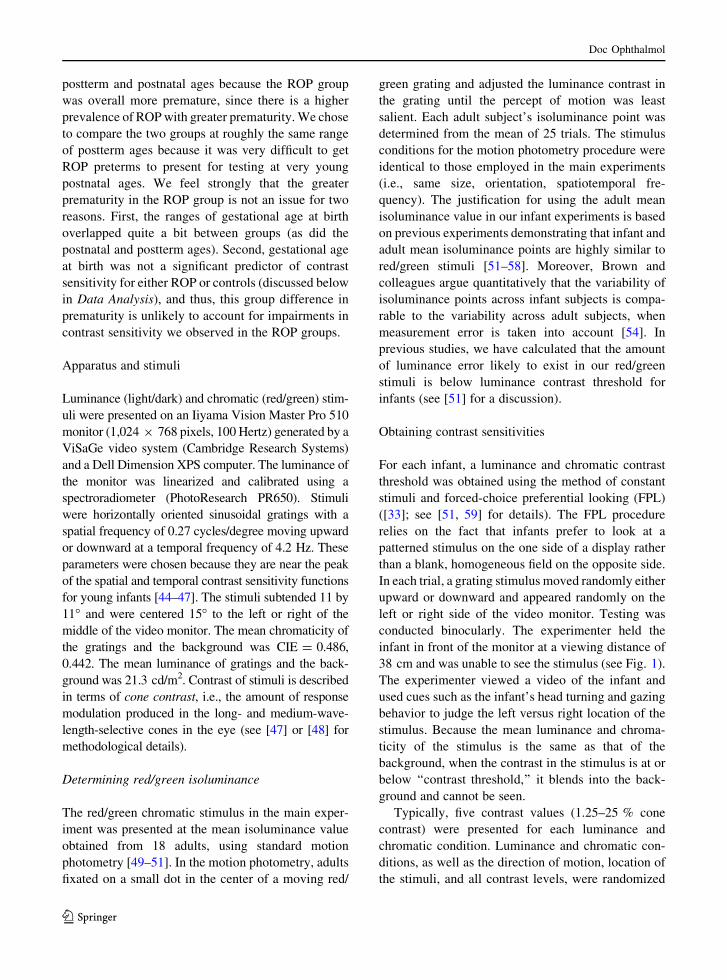
Fig. 1 Example of infant testing using forced-choice prefer-
ential looking
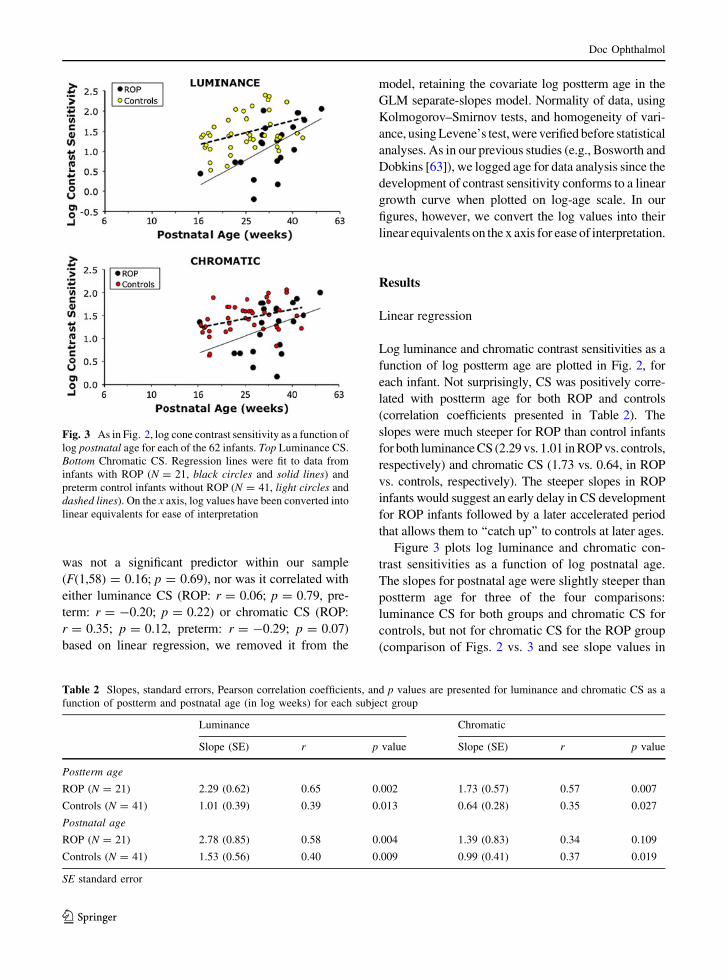
Fig. 2 Log cone contrast sensitivity as a function of log
postterm age for each of the 62 infants. Top Luminance CS.
Bottom Chromatic CS. Regression lines were fit to data from
infants with ROP (N = 21, black circles and solid lines) and
preterm control infants without ROP (N = 41, light circles and
dashed lines). On the x axis, log values have been converted into
linear equivalents for ease of interpretation
Doc Ophthalmol
123
was not a significant predictor within our sample
(F(1,58) = 0.16; p = 0.69), nor was it correlated with
either luminance CS (ROP: r = 0.06; p = 0.79, pre-
term: r = -0.20; p = 0.22) or chromatic CS (ROP:
r = 0.35; p = 0.12, preterm: r = -0.29; p = 0.07)
based on linear regression, we removed it from the
model, retaining the covariate log postterm age in the
GLM separate-slopes model. Normality of data, using
Kolmogorov–Smirnov tests, and homogeneity of vari-
ance, using Levene’s test, were verified before statistical
analyses. As in our previous studies (e.g., Bosworth and
Dobkins [63]), we logged age for data analysis since the
development of contrast sensitivity conforms to a linear
growth curve when plotted on log-age scale. In our
figures, however, we convert the log values into their
linear equivalents on the x axis for ease of interpretation.
Results
Linear regression
Log luminance and chromatic contrast sensitivities as a
function of log postterm age are plotted in Fig. 2, for
each infant. Not surprisingly, CS was positively corre-
lated with postterm age for both ROP and controls
(correlation coefficients presented in Table 2). The
slopes were much steeper for ROP than control infants
for both luminance CS (2.29 vs. 1.01 in ROP vs. controls,
respectively) and chromatic CS (1.73 vs. 0.64, in ROP
vs. controls, respectively). The steeper slopes in ROP
infants would suggest an early delay in CS development
for ROP infants followed by a later accelerated period
that allows them to ‘‘catch up’’ to controls at later ages.
Figure 3 plots log luminance and chromatic con-
trast sensitivities as a function of log postnatal age.
The slopes for postnatal age were slightly steeper than
postterm age for three of the four comparisons:
luminance CS for both groups and chromatic CS for
controls, but not for chromatic CS for the ROP group
(comparison of Figs. 2 vs. 3 and see slope values in
Fig. 3 As in Fig. 2, log cone contrast sensitivity as a function of
log postnatal age for each of the 62 infants. Top Luminance CS.
Bottom Chromatic CS. Regression lines were fit to data from
infants with ROP (N = 21, black circles and solid lines) and
preterm control infants without ROP (N = 41, light circles and
dashed lines). On the x axis, log values have been converted into
linear equivalents for ease of interpretation
Table 2 Slopes, standard errors, Pearson correlation coefficients, and p values are presented for luminance and chromatic CS as a
function of postterm and postnatal age (in log weeks) for each subject group
Luminance Chromatic
Slope (SE) r p value Slope (SE) r p value
Postterm age
ROP (N = 21) 2.29 (0.62) 0.65 0.002 1.73 (0.57) 0.57 0.007
Controls (N = 41) 1.01 (0.39) 0.39 0.013 0.64 (0.28) 0.35 0.027
Postnatal age
ROP (N = 21) 2.78 (0.85) 0.58 0.004 1.39 (0.83) 0.34 0.109
Controls (N = 41) 1.53 (0.56) 0.40 0.009 0.99 (0.41) 0.37 0.019
SE standard error
Doc Ophthalmol
123
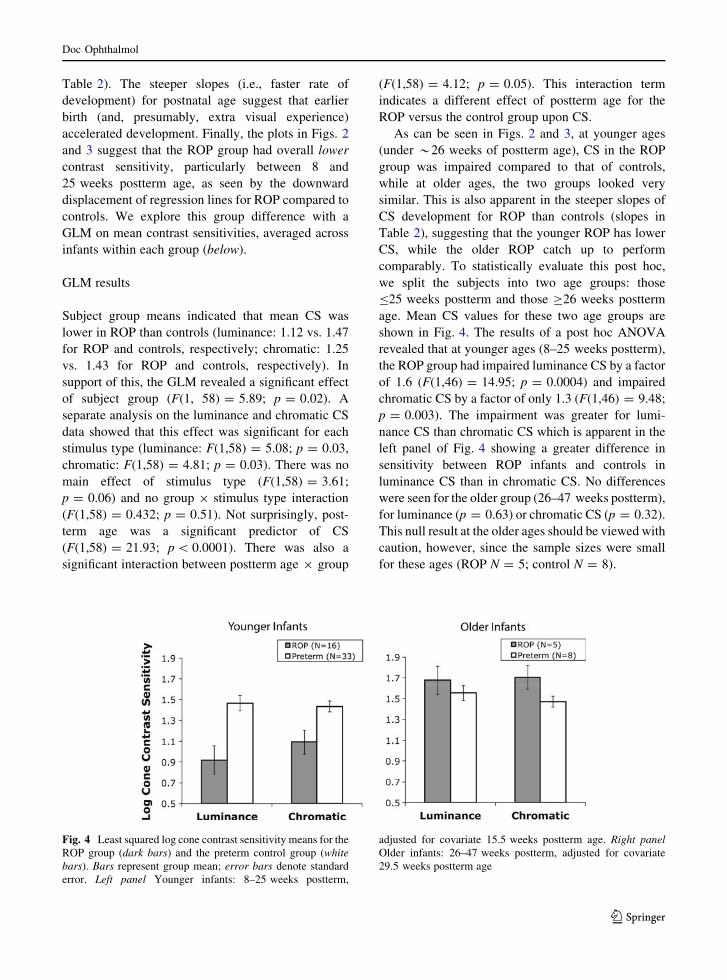
Table 2). The steeper slopes (i.e., faster rate of
development) for postnatal age suggest that earlier
birth (and, presumably, extra visual experience)
accelerated development. Finally, the plots in Figs. 2
and 3 suggest that the ROP group had overall lower
contrast sensitivity, particularly between 8 and
25 weeks postterm age, as seen by the downward
displacement of regression lines for ROP compared to
controls. We explore this group difference with a
GLM on mean contrast sensitivities, averaged across
infants within each group (below).
GLM results
Subject group means indicated that mean CS was
lower in ROP than controls (luminance: 1.12 vs. 1.47
for ROP and controls, respectively; chromatic: 1.25
vs. 1.43 for ROP and controls, respectively). In
support of this, the GLM revealed a significant effect
of subject group (F(1, 58) = 5.89; p = 0.02). A
separate analysis on the luminance and chromatic CS
data showed that this effect was significant for each
stimulus type (luminance: F(1,58) = 5.08; p = 0.03,
chromatic: F(1,58) = 4.81; p = 0.03). There was no
main effect of stimulus type (F(1,58) = 3.61;
p = 0.06) and no group 9 stimulus type interaction
(F(1,58) = 0.432; p = 0.51). Not surprisingly, post-
term age was a significant predictor of CS
(F(1,58) = 21.93; p \ 0.0001). There was also a
significant interaction between postterm age 9 group
(F(1,58) = 4.12; p = 0.05). This interaction term
indicates a different effect of postterm age for the
ROP versus the control group upon CS.
As can be seen in Figs. 2 and 3, at younger ages
(under *26 weeks of postterm age), CS in the ROP
group was impaired compared to that of controls,
while at older ages, the two groups looked very
similar. This is also apparent in the steeper slopes of
CS development for ROP than controls (slopes in
Table 2), suggesting that the younger ROP has lower
CS, while the older ROP catch up to perform
comparably. To statistically evaluate this post hoc,
we split the subjects into two age groups: those
B25 weeks postterm and those C26 weeks postterm
age. Mean CS values for these two age groups are
shown in Fig. 4. The results of a post hoc ANOVA
revealed that at younger ages (8–25 weeks postterm),
the ROP group had impaired luminance CS by a factor
of 1.6 (F(1,46) = 14.95; p = 0.0004) and impaired
chromatic CS by a factor of only 1.3 (F(1,46) = 9.48;
p = 0.003). The impairment was greater for lumi-
nance CS than chromatic CS which is apparent in the
left panel of Fig. 4 showing a greater difference in
sensitivity between ROP infants and controls in
luminance CS than in chromatic CS. No differences
were seen for the older group (26–47 weeks postterm),
for luminance (p = 0.63) or chromatic CS (p = 0.32).
This null result at the older ages should be viewed with
caution, however, since the sample sizes were small
for these ages (ROP N = 5; control N = 8).
Fig. 4 Least squared log cone contrast sensitivity means for the
ROP group (dark bars) and the preterm control group (whitebars). Bars represent group mean; error bars denote standard
error. Left panel Younger infants: 8–25 weeks postterm,
adjusted for covariate 15.5 weeks postterm age. Right panelOlder infants: 26–47 weeks postterm, adjusted for covariate
29.5 weeks postterm age
Doc Ophthalmol
123
Discussion
This study is the first psychophysical examination to
determine whether ROP affects luminance and chro-
matic contrast sensitivities, which are mediated pre-
dominantly by the M and P pathways, respectively.
The results from this study suggest that between 8 and
25 weeks (2–6 months), ROP infants show an early
delay in both pathways with the effect appearing
somewhat greater for the M, than P, pathway. In a
small sample of older infants, between 26 and
47 weeks (6–11 months) of age, no impairment was
seen, which suggests that for the conditions tested in
the current study (i.e., low spatial frequencies, mid-
range temporal frequency), there is no lasting effect
due to ROP. It is possible that we failed to detect
smaller deficits at this later age because of our small
sample size at the oldest age (N = 5 ROP infants) and
because age confounds as the postnatal age of the ROP
group was somewhat older than that of the controls (43
vs. 37 weeks of age). Given that older infants are
expected to have higher CS, the older age of the ROP
group could have counteracted any deficits in this
group due to ROP. However, this is unlikely because
at this older age, the ROP and preterm controls
perform similarly to full terms on this measure in a
previous study from our laboratory [63].
There are a number of possible explanations for the
early delay in contrast sensitivity in ROP patients. It
has been recently shown that even mild ROP causes
long-term structural changes to the retina and deficits
in rod and possibly cone, photoreceptor, and postre-
ceptor retinal function that persist long after the acute
phase ROP resolves. Fulton et al. [7] found small
dysfunction in cone responsivity using multifocal
ERG’s in patients with mild, regressed ROP that was
not treated [6] and greater dysfunction in those who
had more severe ROP that required treatment [30],
which the authors attribute to cellular dysfunction,
rather than cellular loss. ROP has been found to disrupt
the formation of the vascular tissue, the foveal pit
shape, and the displacement of inner retinal layer cells
away from the fovea [3, 8, 30, 64], and these changes
are likely to affect or delay the developmental changes
in foveal cone density and the postreceptor neurons,
which are supported by a rat model of ROP [65]. Any
of these abnormalities may cause delays or deficits in
acuity or contrast sensitivity by disrupting the light-
guiding and pigment absorption properties of the
photoreceptors.
Other clinical measures of contrast or acuity, using
Teller acuity cards with infants or optotypes in
children, have been frequently applied as functional
outcome measures in ROP. It is widely accepted that
infants and children who had severe ROP during the
neonatal period, with or without treatment, generally
have poor outcomes on these measures [66–68], and
there is a positive correlation between the severity of
retinal residua of ROP and degree of visual acuity
deficits in eyes that had severe ROP during the
neonatal period [12]. Typically, studies show children
who had spontaneously regressed ROP have mild
deficits in peripheral visual field perimetry [69] and
spatial acuity [11, 17, 20, 67, 70]. The current study
suggests an early delay in contrast sensitivity for low
spatial frequencies in infants who had spontaneously
regressed ROP (stages 1–3 in zones 2 and 3), and these
early delays before 26 weeks of postterm age do not
seem to be persistent. This is in line with the finding by
Harris et al. [71] that early postreceptor dysfunction in
infants with mild ROP also improved with age. They
propose that in patients with mild (but not severe) ROP
who have photoreceptor damage, there is reorganiza-
tion of postreceptor retinal circuitry that allows
recovery of visual function.
In the current study, we found a trend for greater
impairment of luminance than chromatic CS, implying
greater M, than P, pathway disruption. We can
theorize why the M pathway could be selectively
affected to a greater extent than the P pathway due to
ROP. It is possible that the failure of the choroid to
meet the metabolic demands of photoreceptors will
impact larger parasol cells first before the midget
retinal ganglion cells, which provide input to the M
and P layers of the LGN, respectively. In addition, the
vulnerability of the M pathway may be linked to the
fact that the ROP damage occurs during a period of
critical maturation for the M cells, which happens
earlier (and when ROP has the greatest impact) than
for P cells. We and others have previously reported
earlier development for the M, than P, pathway, for
both perceptual studies [44, 55] and EEG studies [72].
Studies of anatomical growth and synapse formation
in infant primates also support earlier anatomical and
neurophysiological M pathway development [73–82],
and this is seen in human infants as well [83].
Doc Ophthalmol
123

It is relevant to note that the M pathway provides
the bulk of the input to the dorsal stream, which is
posited to be vulnerable to physical insults and genetic
abnormalities (for a review see [84]). Several studies
have shown deficits, possibly due to ROP or neuro-
logical insult, or both, in extremely preterm children
for dorsal stream functions such as local and global
motion thresholds [85, 86]; representational momen-
tum [87]; biological motion detection [88]; and
motion-based form segmentation [89]. The trend
observed in the current study is in line with the notion
of magnocellular/dorsal pathway vulnerability that
has been noted for other genetic conditions that have
biological underpinnings such as autism [90, 91],
dyslexia [92], and Williams syndrome [93, 94]. On the
other hand, few studies have contrasted M and P
pathway functioning, as was done in the current study;
thus, more work is needed to see whether the M
pathway is indeed more vulnerable to ROP.
Although the current data suggest a trend toward
greater effects of ROP on the M than the P pathway, it
may be the case that actual impairments in chromatic CS
are greater than we observed but were overridden by the
fact that the ROP infants were more premature and
tested at an older postnatal age than the controls, and we
have previously shown that early birth may accelerate
the development of the P pathway [63]. Thus, it may be
the case that their additional time outside the womb
accelerated their visual development, and this counter-
acted any detrimental effects of ROP at the older ages.
Nonetheless, it should be considered based on the
current study and our previous work with healthy
preterm infants that the M pathway could be relatively
more biologically governed, and vulnerable to physical
insult, while the P pathway could be relatively more
amenable to visual experience.
There are other explanations for the overall CS
deficit seen in our sample of infants with spontane-
ously regressed ROP. First, it is possible that other
neurological abnormalities account for the lower CS
seen in our sample. None of our subjects had severe
brain damage but roughly half of our sample had mild
bleeding and mild IVH. These mild cerebral condi-
tions could have caused subtle undetected abnormal-
ities which could explain decreased CS. It has been
shown that children with neurological abnormalities at
birth have poorer visual acuities later [95–97]. We also
cannot rule out that refractive errors account for the
decrease in performance in the ROP infants relative to
the preterm infants without ROP (the controls).
However, it seems unlikely, as the incidence of
refractive errors (myopia, high hyperopia, astigma-
tism, and anisometropia) is high in premature infants
with and without ROP [16, 98–100]. In the case of
refractive error, chromatic aberrations may cause the
chromatic stimuli to contain some luminance error
(i.e., and not be isoluminant), which would inflate
chromatic contrast sensitivities. Finally, there is also a
possibility that the impairment in CS reflects deficits in
signals within the rod photoreceptors. The trend for
greater impairment in the M, than P, pathway is
noteworthy given that electrophysiological and psy-
chophysical studies suggest an important rod input to
the subcortical M pathway [43, 101–105].
In sum, results from this study show mild, but
significant, contrast sensitivity deficits during young
infancy, but these seem to resolve after 10 months of
age. These results do not undermine, nor contradict,
the need to screen this population since they are at risk
for amblyopia, strabismus, refractive error, and cog-
nitive disabilities during early and late childhood (see
[106] for a review).
Acknowledgments This work was supported by NIH grant
EY19035 (RGB/KRD).
Conflict of interest None.
References
1. Hakeem AH, Mohamed GB, Othman MF (2012) Reti-
nopathy of prematurity: a study of prevalence and risk
factors. Middle East Afr J Ophthalmol 19(3):289–294
2. Richardson DK, Gray JE, Gortmaker SL, Goldmann DA,
Pursley DM, McCormick MC (1998) Declining severity
adjusted mortality: evidence of improving neonatal
intensive care. Pediatrics 102(4 Pt 1):893–899
3. Yanni SE, Wang J, Chan M, Carroll J, Farsiu S, Leffler JN,
Spencer R, Birch EE (2012) Foveal avascular zone and
foveal pit formation after preterm birth. Br J Ophthalmol
96(7):961–966
4. Barnaby AM, Hansen RM, Moskowitz A, Fulton AB
(2007) Development of scotopic visual thresholds in reti-
nopathy of prematurity. Invest Ophthalmol Vis Sci
48(10):4854–4860
5. Hansen RM, Fulton AB (2000) Background adaptation in
children with a history of mild retinopathy of prematurity.
Invest Ophthalmol Vis Sci 41(1):320–324
6. Reisner DS, Hansen RM, Findl O, Petersen RA, Fulton AB
(1997) Dark-adapted thresholds in children with histories
of mild retinopathy of prematurity. Invest Ophthalmol Vis
Sci 38(6):1175–1183
Doc Ophthalmol
123
7. Fulton AB, Hansen RM, Moskowitz A, Barnaby AM
(2005) Multifocal erg in subjects with a history of reti-
nopathy of prematurity. Doc Ophthalmol 111(1):7–13
8. Hammer DX, Iftimia NV, Ferguson RD, Bigelow CE,
Ustun TE, Barnaby AM, Fulton AB (2008) Foveal fine
structure in retinopathy of prematurity: an adaptive optics
fourier domain optical coherence tomography study.
Invest Ophthalmol Vis Sci 49(5):2061–2070
9. Fulton AB, Hansen RM, Petersen RA, Vanderveen DK
(2001) The rod photoreceptors in retinopathy of prema-
turity: an electroretinographic study. Arch Ophthalmol
119(4):499–505
10. Moskowitz A, Hansen R, Fulton A (2005) Early ametropia
and rod photoreceptor function in retinopathy of prema-
turity. Optom Vis Sci 82(4):307–317
11. Dobson V, Quinn GE, Summers CG, Saunders RA, Phelps
DL, Tung B, Palmer EA (1994) Effect of acute-phase
retinopathy of prematurity on grating acuity development
in the very low birth weight infant. The cryotherapy for
retinopathy of prematurity cooperative group. Invest
Ophthalmol Vis Sci 35(13):4236–4244
12. Dobson V, Quinn GE, Summers CG, Hardy RJ, Tung B
(2006) Visual acuity at 10 years in cryotherapy for reti-
nopathy of prematurity (Cryo-Rop) study eyes: effect of
retinal residua of retinopathy of prematurity. Arch Oph-
thalmol 124(2):199–202
13. Snir M, Nissenkorn I, Sherf I, Cohen S, Ben Sira I (1988)
Visual acuity, strabismus, and amblyopia in premature
babies with and without retinopathy of prematurity. Ann
Ophthalmol 20(7):256–258
14. Fledelius HC (1996) Pre-term delivery and subsequent
ocular development. A 7–10 year follow-up of children
screened 1982–84 for Rop. 1. Visual function, slit-lamp
findings, and fundus appearance. Acta Ophthalmol Scand
74(3):288–293
15. Laws D, Shaw DE, Robinson J, Jones HS, Ng YK, Fielder
AR (1992) Retinopathy of prematurity: a prospective
study. Review at six months. Eye (Lond) 6(Pt 5):477–483
16. Cooke RW, Foulder-Hughes L, Newsham D, Clarke D
(2004) Ophthalmic impairment at 7 years of age in chil-
dren born very preterm. Arch Dis Child Fetal Neonatal Ed
89(3):F249–F253
17. Larsson E, Rydberg A, Holmstrom G (2006) Contrast
sensitivity in 10 year old preterm and full term children: a
population based study. Br J Ophthalmol 90(1):87–90
18. Powls A, Botting N, Cooke RW, Stephenson G, Marlow N
(1997) Visual impairment in very low birthweight chil-
dren. Arch Dis Child Fetal Neonatal Ed 76(2):F82–F87
19. Dowdeswell HJ, Slater AM, Broomhall J, Tripp J (1995)
Visual deficits in children born at less than 32 weeks’
gestation with and without major ocular pathology and
cerebral damage. Br J Ophthalmol 79(5):447–452
20. O’Connor AR, Stephenson T, Johnson A, Tobin MJ,
Moseley MJ, Ratib S, Ng Y, Fielder AR (2002) Long-term
ophthalmic outcome of low birth weight children with and
without retinopathy of prematurity. Pediatrics 109(1):12–18
21. Palmer EA, Flynn JT, Hardy RJ, Phelps DL, Phillips CL,
Schaffer DB, Tung B (1991) Incidence and early course
of retinopathy of prematurity. The cryotherapy for reti-
nopathy of prematurity cooperative group. Ophthalmology
98(11):1628–1640
22. Good WV, Hardy RJ, Dobson V, Palmer EA, Phelps DL,
Quintos M, Tung B (2005) The incidence and course of
retinopathy of prematurity: findings from the early treat-
ment for retinopathy of prematurity study. Pediatrics
116(1):15–23
23. O’Connor AR, Stephenson TJ, Johnson A, Tobin MJ, Ratib
S, Moseley M, Fielder AR (2004) Visual function in low
birthweight children. Br J Ophthalmol 88(9):1149–1153
24. Holmstrom G, Larsson E (2008) Long-term follow-up of
visual functions in prematurely born children–a prospec-
tive population-based study up to 10 years of age. J Aapos
12(2):157–162
25. Dobson V, Quinn GE, Abramov I, Hardy RJ, Tung B,
Siatkowski RM, Phelps DL (1996) Color vision measured
with pseudoisochromatic plates at five-and-a-half years in
eyes of children from the cryo-rop study. Invest Ophthal-
mol Vis Sci 37(12):2467–2474
26. Abramov I, Hainline L, Lemerise E, Brown AK (1985)
Changes in visual functions of children exposed as infants
to prolonged illumination. J Am Optom Assoc 56(8):
614–619
27. Ecsedy M, Varsanyi B, Szigeti A, Szrnka G, Nemeth J,
Recsan Z (2011) Cone function in children with a history
of preterm birth. Doc Ophthalmol 122(3):141–148
28. McLoone E, O’Keefe M, McLoone S, Lanigan B (2006)
Long term functional and structural outcomes of laser
therapy for retinopathy of prematurity. Br J Ophthalmol
90(6):754–759
29. Jackson TL, Ong GL, McIndoe MA, Ripley LG (2003)
Monocular chromatic contrast threshold and achromatic
contrast sensitivity in children born prematurely. Am J
Ophthalmol 136(4):710–719
30. Fulton AB, Hansen RM, Moskowitz A (2008) The cone
electroretinogram in retinopathy of prematurity. Invest
Ophthalmol Vis Sci 49(2):814–819
31. Hansen R, Moskowitz A, Fulton A (2009) Multifocal erg
responses in infants. Invest Ophthalmol Vis Sci 50(1):470–
475
32. Fulton AB, Hansen RM, Moskowitz A, Akula JD (2009)
The neurovascular retina in retinopathy of prematurity.
Prog Retin Eye Res 28(6):452–482
33. Teller DY, Boothe R (1979) Development of vision in
infant primates. Trans Ophthalmol Soc UK 99(3):333–337
34. Yabuta NH, Callaway EM (1998) Functional streams and
local connections of layer 4c neurons in primary visual cortex
of the macaque monkey. J Neurosci 18(22):9489–9499
35. Sawatari A, Callaway EM (1996) Convergence of magno-
and parvocellular pathways in layer 4b of macaque pri-
mary visual cortex. Nature 380(6573):442–446
36. Ungerleider LG, Haxby JV (1994) ‘What’ and ‘Where’ in
the human brain. Curr Opin Neurobiol 4(2):157–165
37. Zeki SM, Watson JD, Lueck CJ, Friston KJ, Kennard C,
Frackowiak RS (1991) A direct demonstration of func-
tional specialization in human visual cortex. J Neurosci
11(3):641–649
38. DeYoe EA, Van Essen DC (1988) Concurrent processing
streams in monkey visual cortex. Trends Neurosci
11(5):219–226
39. Livingstone MS, Hubel DH (1988) Segregation of form,
color, movement, and depth: anatomy, physiology, and
perception. Science 240(4853):740–749
Doc Ophthalmol
123
40. Hendry SHC, Reid RC (2000) The koniocellular pathway
in primate vision. Annu Rev Neurosci 23:127–153
41. Hicks TP, Lee BB, Vidyasagar TR (1983) The responses of
cells in macaque lateral geniculate nucleus to sinusoidal
gratings. J Physiol (Lond) 337(183):183–200
42. Derrington AM, Lennie P (1984) Spatial and temporal
contrast sensitivities of neurones in lateral geniculate
nucleus of macaque. J Physiol (Lond) 357(219):219–
240
43. Lee BB, Pokorny J, Smith VC, Martin PR, Valberg A
(1990) Luminance and chromatic modulation sensitivity
of macaque ganglion cells and human observers. J Opt Soc
Am [a] 7(12):2223–2236
44. Banks MS, Salapatek P (1978) Acuity and contrast sensi-
tivity in 1-, 2-, and 3-month-old human infants. Invest
Ophthalmol Vis Sci 17(4):361–365
45. Hartmann EE, Banks MS (1992) Temporal contrast sen-
sitivity in human infants. Vision Res 32(6):1163–1168
46. Rasengane TA, Allen D, Manny RE (1997) Development
of temporal contrast sensitivity in human infants. Vision
Res 37(13):1747–1754
47. Dobkins KR, Anderson CM, Lia B (1999) Infant temporal
contrast sensitivity functions (Tcsfs) mature earlier for
luminance than for chromatic stimuli: evidence for pre-
cocious magnocellular development? Vision Res 39(19):
3223–3239
48. Gunther KL, Dobkins KR (2002) Individual differences in
chromatic (red/green) contrast sensitivity are constrained
by the relative number of L- versus M-cones in the eye.
Vision Res 42(11):1367–1378
49. Rydberg T, Jonsson A, Roder M, Melander A (1994)
Hypoglycemic activity of glyburide (Glibenclamide)
metabolites in humans. Diabetes Care 17(9):1026–1030
50. Teller DY, Lindsey DT (1993) Motion nulling techniques
and infant color vision. In: Granrud C (ed) Visual per-
ception and cognition in infancy. Lawrence Erlbaum
Associates, Hillsdale, pp 47–74
51. Dobkins KR, Teller DY (1996) Infant motion: detection
(M:D) ratios for chromatically defined and luminance-
defined moving stimuli. Vision Res 36(20):3293–3310
52. Pereverzeva M, Hui-Lin Chien S, Palmer J, Teller DY
(2002) Infant photometry: are mean adult isoluminance
values a sufficient approximation to individual infant
values? Vision Res 42(13):1639–1649
53. Bieber ML, Volbrecht VJ, Werner JS (1995) Spectral
efficiency measured by heterochromatic flicker photome-
try is similar in human infants and adults. Vision Res
35(10):1385–1392
54. Morrone MC, Burr DC, Fiorentini A (1993) Development
of infant contrast sensitivity to chromatic stimuli. Vision
Res 33(17):2535–2552
55. Maurer D, Lewis TL, Cavanagh P, Anstis S (1989) A new
test of luminous efficiency for babies. Invest Ophthalmol
Vis Sci 30(2):297–303
56. Teller DY, Lindsey DT (1989) Motion nulls for white
versus isochromatic gratings in infants and adults. J Opt
Soc Am A 6(12):1945–1954
57. Brown AM, Lindsey DT, McSweeney EM, Walters MM
(1995) Infant luminance and chromatic contrast sensitiv-
ity: optokinetic nystagmus data on 3-month-olds. Vision
Res 35(22):3145–3160
58. Dobkins KR, Anderson CM, Kelly JP (2001) Development
of psychophysically-derived detection contours in L- and
M- cone contrast space. Vision Res 41(14):1791–1807
59. Dobkins KR, Teller DY (1996) Infant contrast detectors
are selective for direction of motion. Vision Res
36(2):281–294
60. Weibull W (1951) A statistical distribution function of
wide applicability. J Appl Mech 18:292–297
61. Watson AB (1979) Probability summation over time.
Vision Res 19(5):515–522
62. Graham NVS (1989) Visual pattern analyzers. Oxford
University Press, New York
63. Bosworth RG, Dobkins KR (2009) Chromatic and lumi-
nance contrast sensitivity in fullterm and preterm infants.
J Vis 9(15):11–16
64. Isenberg SJ (1986) Macular development in the premature
infant. Am J Ophthalmol 101(1):74–80
65. Fulton AB, Reynaud X, Hansen RM, Lemere CA, Parker
C, Williams TP (1999) Rod photoreceptors in infant rats
with a history of oxygen exposure. Invest Ophthalmol Vis
Sci 40(1):168–174
66. CRYO-ROP (2001) Contrast sensitivity at age 10 years in
children who had threshold retinopathy of prematurity.
Arch Ophthalmol 119(8):1129–1133
67. Holmstrom G, el Azazi M, Kugelberg U (1999) Ophthal-
mological follow up of preterm infants: a population
based, prospective study of visual acuity and strabismus.
Br J Ophthalmol 83(2):143–150
68. O’Connor AR, Spencer R, Birch EE (2007) Predicting
long-term visual outcome in children with birth weight
under 1001 G. J Aapos 11(6):541–545
69. Quinn GE, Dobson V, Hardy RJ, Tung B, Phelps DL,
Palmer EA (1996) Visual fields measured with double-arc
perimetry in eyes with threshold retinopathy of prematu-
rity from the cryotherapy for retinopathy of prematurity
trial. The cryo-retinopathy of prematurity cooperative
group. Ophthalmology 103(9):1432–1437
70. Luna B, Dobson V, Biglan AW (1990) Development of
grating acuity in infants with regressed stage 3 retinopathy of
prematurity. Invest Ophthalmol Vis Sci 31(10):2082–2087
71. Harris ME, Moskowitz A, Fulton AB, Hansen RM (2011)
Long-term effects of retinopathy of prematurity (Rop) on rod
and rod-driven function. Doc Ophthalmol 122(1):19–27
72. Hammarrenger B, Lepore F, Lippe S, Labrosse M, Guil-
lemot JP, Roy MS (2003) Magnocellular and parvocellular
developmental course in infants during the first year of life.
Doc Ophthalmol 107(3):225–233
73. Wadhwa S, Bijlani V (1988) Cytodifferentiation and
developing neuronal circuitry in the human lateral genic-
ulate nucleus. Int J Dev Neurosci 6(1):59–75
74. Williams RW, Rakic P (1988) Elimination of neurons from
the rhesus monkey’s lateral geniculate nucleus during
development. J Comp Neurol 272(3):424–436
75. Kogan CS, Zangenehpour S, Chaudhuri A (2000) Devel-
opmental profiles of Smi-32 immunoreactivity in monkey
striate cortex. Brain Res Dev Brain Res 119(1):85–95
76. Mates SL, Lund JS (1983) Developmental changes in the
relationship between type 2 synapses and spiny neurons in
the monkey visual cortex. J Comp Neurol 221(1):98–105
77. Lund JS, Harper TR (1991) Postnatal development of
thalamic recipient neurons in the monkey striate cortex:
Doc Ophthalmol
123
III. Somatic inhibitory synapse acquisition by spiny stel-
late neurons of layer 4c. J Comp Neurol 309(1):141–149
78. Lund JS, Holbach SM (1991) Postnatal development of
thalamic recipient neurons in the monkey striate cortex: I.
Comparison of spine acquisition and dendritic growth of
layer 4c alpha and beta spiny stellate neurons. J Comp
Neurol 309(1):115–128
79. Distler C, Bachevalier J, Kennedy C, Mishkin M, Un-
gerleider LG (1996) Functional development of the corti-
cocortical pathway for motion analysis in the macaque
monkey: a 14c–2-deoxyglucose study. Cereb Cortex 6(2):
184–195
80. Lachica EA, Casagrande VA (1988) Development of pri-
mate retinogeniculate axon arbors. Vis Neurosci 1(1):
103–123
81. Florence SL, Casagrande VA (1990) Development of
geniculocortical axon arbors in a primate. Vis Neurosci
5(3):291–309
82. Movshon JA, Kiorpes L, Hawken MJ, Skoczenski AM,
Cavanaugh JR, Graham NV (1997) Sensitivity of Lgn
neurons in infant macaque monkey. In: Investigative
ophthalmology and vision science. Ft. Lauderdale, Florida,
p S498
83. Burkhalter A, Bernardo KL, Charles V (1993) Develop-
ment of local circuits in human visual cortex. J Neurosci
13(5):1916–1931
84. Atkinson J, Braddick O (2011) From genes to brain
development to phenotypic behavior: ‘‘Dorsal-Stream
Vulnerability’’ in relation to spatial cognition, attention,
and planning of actions in Williams Syndrome (Ws) and
other developmental disorders. Prog Brain Res 189:
261–283
85. MacKay TL, Jakobson LS, Ellemberg D, Lewis TL, Ma-
urer D, Casiro O (2005) Deficits in the processing of local
and global motion in very low birthweight children.
Neuropsychologia 43(12):1738–1748
86. Taylor NM, Jakobson LS, Maurer D, Lewis TL (2009)
Differential vulnerability of global motion, global form,
and biological motion processing in full-term and preterm
children. Neuropsychologia 47(13):2766–2778
87. Taylor NM, Jakobson LS (2010) Representational
momentum in children born preterm and at term. Brain
Cogn 72(3):464–471
88. Pavlova M, Sokolov A, Birbaumer N, Krageloh-Mann I
(2006) Biological motion processing in adolescents with
early periventricular brain damage. Neuropsychologia
44(4):586–593
89. Jakobson LS, Frisk V, Downie AL (2006) Motion-defined
form processing in extremely premature children. Neuro-
psychologia 44(10):1777–1786
90. Spencer J, O’Brien J, Riggs K, Braddick O, Atkinson J,
Wattam-Bell J (2000) Motion processing in autism: evi-
dence for a dorsal stream deficiency. NeuroReport
11(12):2765–2767
91. McCleery JP, Allman E, Carver LJ, Dobkins KR (2007)
Abnormal magnocellular pathway visual processing in
infants at risk for autism. Biol Psychiatry 62(9):1007–1014
92. Stein J, Walsh V (1997) To see but not to read; the mag-
nocellular theory of dyslexia. Trends Neurosci 20(4):
147–152
93. Atkinson J, Braddick O, Rose FE, Searcy YM, Wattam-
Bell J, Bellugi U (2006) Dorsal-stream motion processing
deficits persist into adulthood in Williams Syndrome.
Neuropsychologia 44(5):828–833
94. Bellugi U, Marks S, Bihrle A, Sabo H (1988) Dissociation
between language and cognitive functions in Williams
Syndrome. In: Bishop D, Mogford K (eds) Language
development in exceptional circumstances. Erlbaum,
Hillsdale, pp 177–189
95. Fledelius HC (1996) Central nervous system damage and
retinopathy of prematurity—an ophthalmic follow-up of
prematures born in 1982–84. Acta Paediatr 85(10):
1186–1191
96. Larsson EK, Rydberg AC, Holmstrom GE (2005) A pop-
ulation-based study on the visual outcome in 10-year-old
preterm and full-term children. Arch Ophthalmol 123(6):
825–832
97. Atkinson J, Braddick O, Anker S, Nardini M, Birtles D,
Rutherford MA, Mercuri E, Dyet LE, Edwards AD, Cowan
FM (2008) Cortical vision, Mri and developmental out-
come in preterm infants. Arch Dis Child Fetal Neonatal Ed
93(4):F292–F297
98. Saunders KJ, McCulloch DL, Shepherd AJ, Wilkinson AG
(2002) Emmetropisation following preterm birth. Br J
Ophthalmol 86(9):1035–1040
99. Snir M, Friling R, Weinberger D, Sherf I, Axer-Siegel R
(2004) Refraction and keratometry in 40 week old pre-
mature (corrected age) and term infants. Br J Ophthalmol
88(7):900–904
100. O’Connor AR, Stephenson TJ, Johnson A, Tobin MJ,
Ratib S, Fielder AR (2006) Change of refractive state and
eye size in children of birth weight less than 1701 G. Br J
Ophthalmol 90(4):456–460
101. Lee BB, Smith VC, Pokorny J, Kremers J (1997) Rod
inputs to macaque ganglion cells. Vision Res 37(20):
2813–2828
102. Virsu V, Lee BB (1983) Light adaptation in cells of
macaque lateral geniculate nucleus and its relation to
human light adaptation. J Neurophysiol 50:864–878
103. Purpura K, Kaplan E, Shapley RM (1988) Background
light and the contrast gain of primate P and M retinal
ganglion cells. Proc Natl Acad Sci USA 85(12):4534–4537
104. D’Zmura M, Lennie P (1986) Shared pathways for rod and
cone vision. Vision Res 26(8):1273–1280
105. Sun H, Pokorny J, Smith VC (2001) Rod-cone interactions
assessed in inferred magnocellular and parvocellular
postreceptoral pathways. J Vis 1(1):42–54
106. O’Connor AR, Fielder AR (2007) Visual outcomes and
perinatal adversity. Semin Fetal Neonatal Med 12(5):
408–414
Doc Ophthalmol
123