Embed Size (px)
Citation preview
DIANA ESADE
2014 ResultsEconomic Diana (GDP)
1Campus ESADE Madrid. February 24, 2015.
Employement Diana (EAPS)
The DIANA ESADE is an instrument that has been indicating, since 2010, the degree to which forecasting institutions converge or diverge when predicting the Gross Domestic Product (GDP) of the Spanish economy. This year, the institutions' predictions with regard to the unemployment rate that the Economically Active Population Survey (EAPS) by the National Statistics Institute (INE) will finally disclose are incorporated into the study for the third time.
Now that the 2014 financial year has ended and the real GDP and results of the year's EAPS are known, we present a new edition of the DIANA ESADE in its dual versions: The Economic Diana and the Employment Diana.
WHAT IS DIANA ESADE?
2
Predictions from all types of institutions in relation to developments in the Spanish economy and its unemployment rate are constantly appearing in the media.
Entrepreneurs and managers need them to make their own forecasts.
The sheer quantity of the forecasts, which do not always agree with each other, makes this task more difficult.
The predictions are rarely compared to the actual data subsequently observed.
This is the main reason behind ESADE's decision to draw up an indicator of the reliability of estimates of the most important domestic and international institutions.
The economic forecasts and unemployment rate ESADE DIANA are not so much a "judge" as a "notary" in this respect.
More than establishing a ranking, we are interested in finding out the absolute deviation associated with each institution.
WHY THIS INDICATOR
3
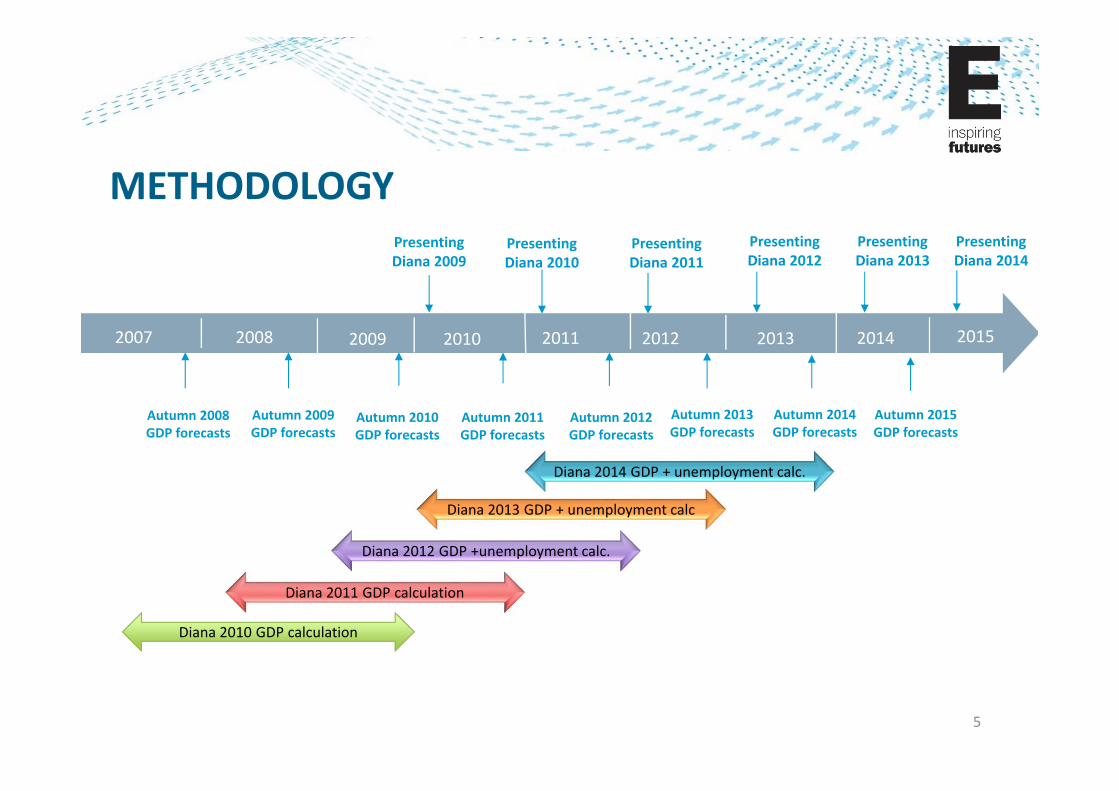
The input data for DIANA ESADE are the economic and unemployment forecasts drawn up by the leading public and private institutions in Spain, which publish their results throughout the year. The forecasting panel that the Spanish Savings Banks Foundation (FUNCAS) produces in September is used as the source.
The FUNCAS Panel is the result of a bimonthly survey of the 18 analysis services covered. On the basis of the replies to the survey, the Panel provides "consensus" forecasts that are calculated as the arithmetical average of the 18 individual predictions. To complete the panel and provide a comparison, the forecasts from the Government, the Bank of Spain and major international organisations are incorporated.
On the basis of these forecasts:• The DIANA ESADE is updated annuallywhen the annual GDP figures are released by the INE.• As of three years ago, ESADE also publishes the Employment DIANA, based on annual data from the EAPS.• There is a key moment for GDP and EAPS estimates: the autumn forecasts. This is the time when most companies and managers draw up their budgets and the forecasts are therefore subject to increased public attention.
METHODOLOGY
4
METHODOLOGY
2007 2008 20132010 2011 2012
PresentingDiana 2009
PresentingDiana 2011
Autumn 2009 GDP forecasts
PresentingDiana 2010
PresentingDiana 2012
2009
Autumn 2008 GDP forecasts
Autumn 2010 GDP forecasts
Autumn 2011 GDP forecasts
Autumn 2012 GDP forecasts
Autumn 2013 GDP forecasts
Diana 2010 GDP calculationDiana 2010 GDP calculation
Diana 2011 GDP calculation
Diana 2012 GDP +unemployment calc.
Diana 2013 GDP + unemployment calc
Autumn 2014 GDP forecasts
PresentingDiana 2013
2014 2015
PresentingDiana 2014
Autumn 2015 GDP forecasts
Diana 2014 GDP + unemployment calc.
5
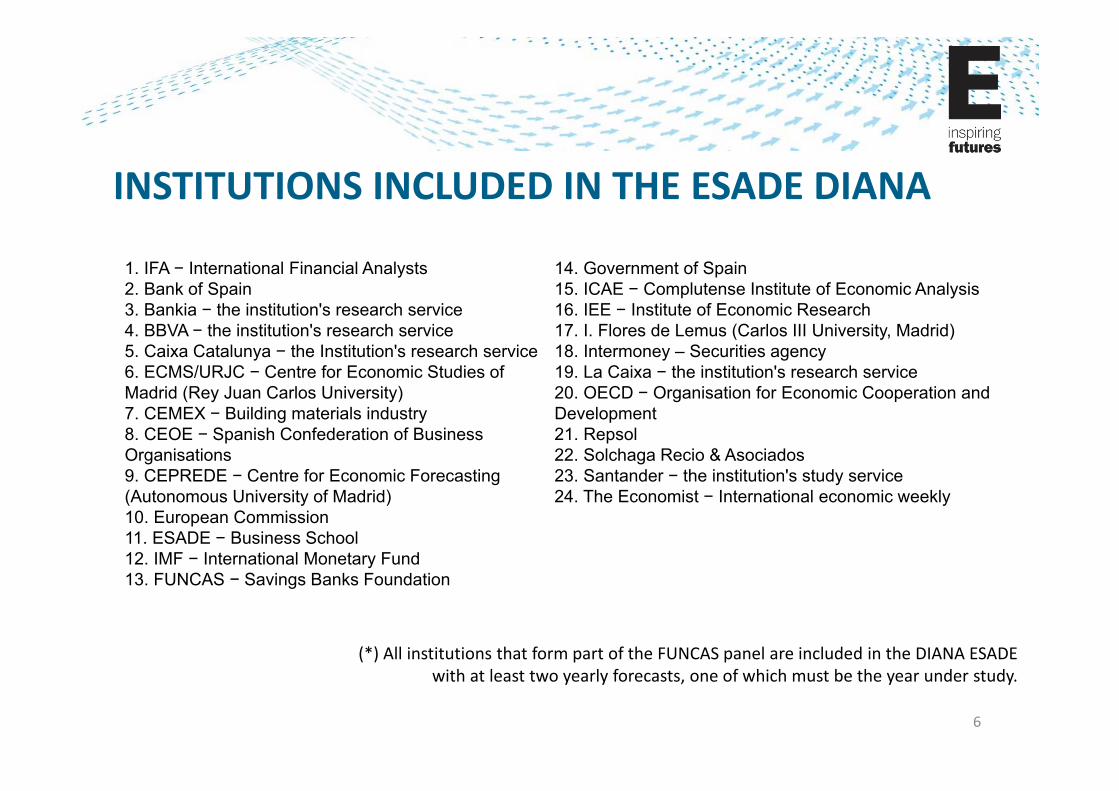
1. IFA − International Financial Analysts2. Bank of Spain3. Bankia − the institution's research service4. BBVA − the institution's research service5. Caixa Catalunya − the Institution's research service6. ECMS/URJC − Centre for Economic Studies of Madrid (Rey Juan Carlos University)7. CEMEX − Building materials industry8. CEOE − Spanish Confederation of Business Organisations9. CEPREDE − Centre for Economic Forecasting (Autonomous University of Madrid)10. European Commission 11. ESADE − Business School12. IMF − International Monetary Fund13. FUNCAS − Savings Banks Foundation
INSTITUTIONS INCLUDED IN THE ESADE DIANA
(*) All institutions that form part of the FUNCAS panel are included in the DIANA ESADE with at least two yearly forecasts, one of which must be the year under study.
14. Government of Spain 15. ICAE − Complutense Institute of Economic Analysis16. IEE − Institute of Economic Research17. I. Flores de Lemus (Carlos III University, Madrid) 18. Intermoney – Securities agency19. La Caixa − the institution's research service20. OECD − Organisation for Economic Cooperation and Development21. Repsol22. Solchaga Recio & Asociados23. Santander − the institution's study service24. The Economist − International economic weekly
6
JAN FEB MAR APR MAY JUN JUL
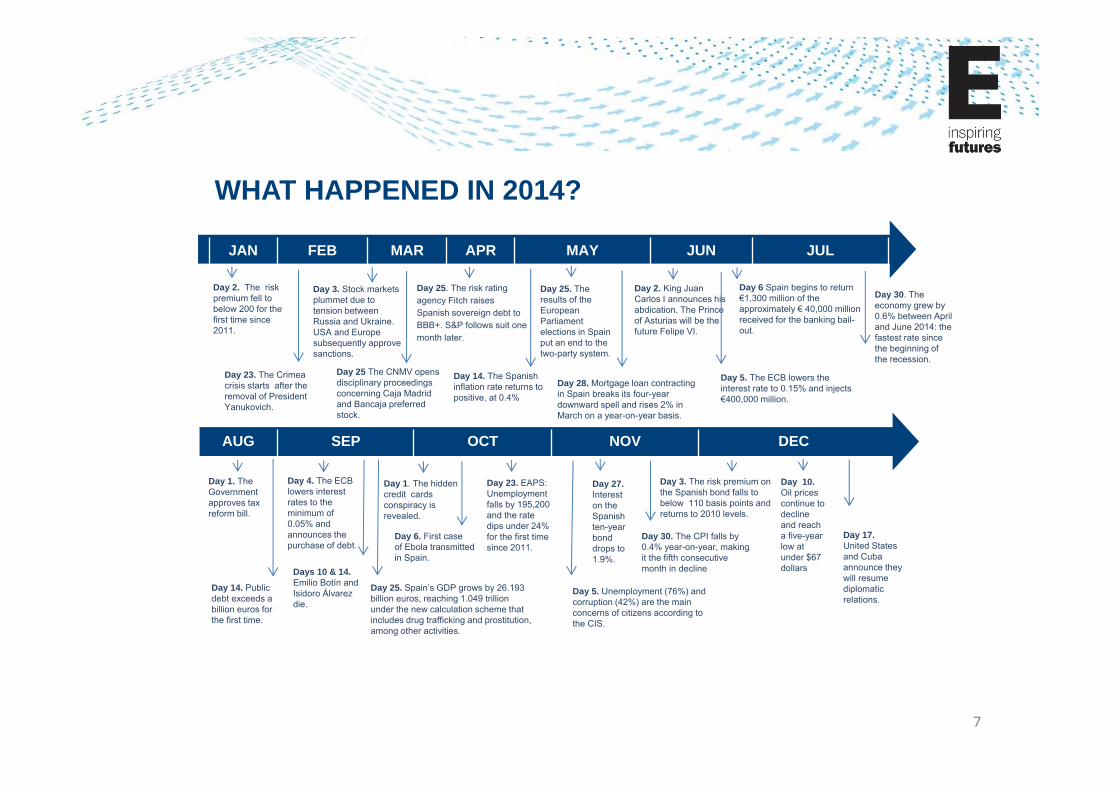
Day 2. The risk premium fell to below 200 for the first time since 2011.
AUG SEP OCT NOV DEC
Day 23. The Crimea crisis starts after the removal of President Yanukovich.
Day 3. Stock markets plummet due to tension between Russia and Ukraine. USA and Europe subsequently approve sanctions.
Day 25. The risk rating agency Fitch raises Spanish sovereign debt to BBB+. S&P follows suit one month later.
Day 25. The results of the European Parliament elections in Spain put an end to the two-party system.
Day 28. Mortgage loan contracting in Spain breaks its four-year downward spell and rises 2% in March on a year-on-year basis.
Day 2. King Juan Carlos I announces his abdication. The Prince of Asturias will be the future Felipe VI.
Day 5. The ECB lowers the interest rate to 0.15% and injects €400,000 million.
Day 30. The economy grew by 0.6% between April and June 2014: the fastest rate since the beginning of the recession.
Day 6 Spain begins to return€1,300 million of the approximately € 40,000 millionreceived for the banking bail-out.
Day 1. The Government approves tax reform bill.
Day 4. The ECB lowers interest rates to the minimum of 0.05% and announces the purchase of debt.
Day 6. First case of Ebola transmittedin Spain.
Day 1. The hidden credit cards conspiracy is revealed.
Day 25. Spain’s GDP grows by 26.193 billion euros, reaching 1.049 trillion under the new calculation scheme that includes drug trafficking and prostitution, among other activities.
Day 10. Oil prices continue to decline and reach a five-year low at under $67 dollars
Day 17.United States and Cuba announce they will resume diplomatic relations.
Day 27.Interest on the Spanish ten-year bond drops to 1.9%.
Day 30. The CPI falls by 0.4% year-on-year, making it the fifth consecutive month in decline
Day 23. EAPS: Unemployment falls by 195,200 and the rate dips under 24% for the first time since 2011.
Day 3. The risk premium on the Spanish bond falls to below 110 basis points and returns to 2010 levels.
WHAT HAPPENED IN 2014?
Day 25 The CNMV opens disciplinary proceedings concerning Caja Madrid and Bancaja preferred stock.
Day 14. Public debt exceeds a billion euros for the first time.
Day 14. The Spanish inflation rate returns to positive, at 0.4%
Days 10 & 14.Emilio Botín and Isidoro Álvarez die.
Day 5. Unemployment (76%) and corruption (42%) are the main concerns of citizens according to the CIS.
7

ECONOMIC DIANA (GDP)
8
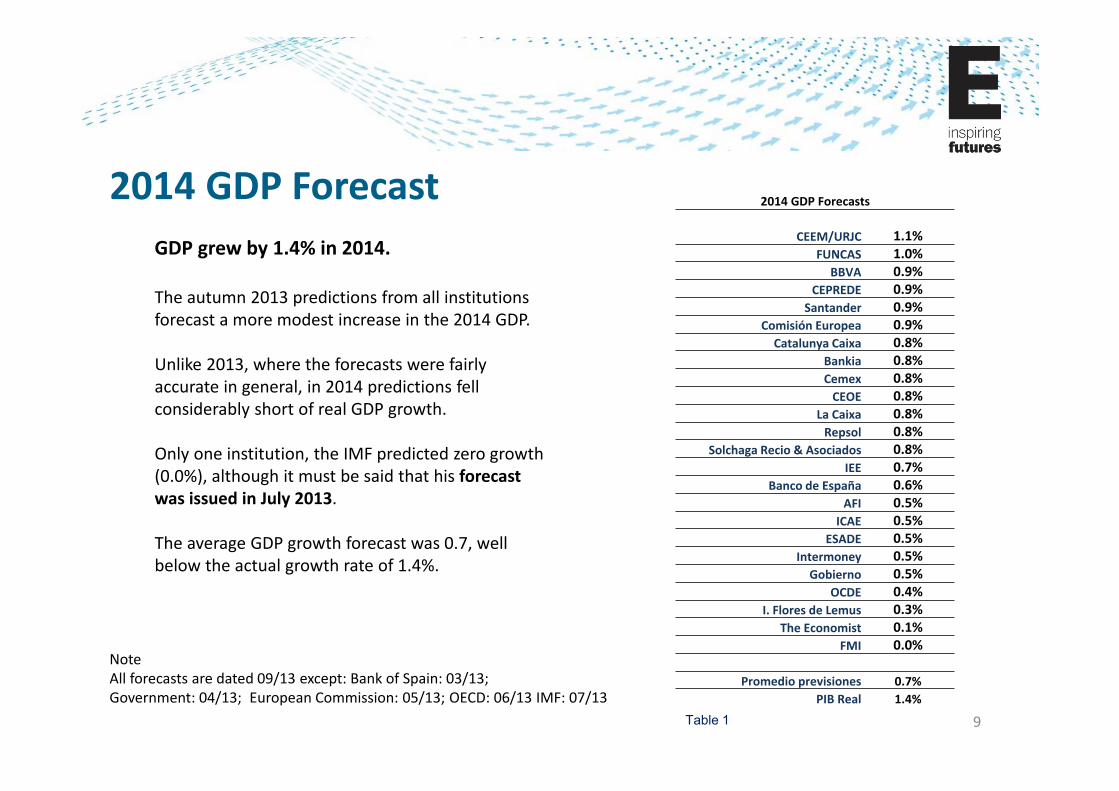
2014 GDP ForecastGDP grew by 1.4% in 2014.
The autumn 2013 predictions from all institutions forecast a more modest increase in the 2014 GDP.
Unlike 2013, where the forecasts were fairly accurate in general, in 2014 predictions fell considerably short of real GDP growth.
Only one institution, the IMF predicted zero growth (0.0%), although it must be said that his forecast was issued in July 2013.
The average GDP growth forecast was 0.7, well below the actual growth rate of 1.4%.
NoteAll forecasts are dated 09/13 except: Bank of Spain: 03/13; Government: 04/13; European Commission: 05/13; OECD: 06/13 IMF: 07/13
2014 GDP Forecasts
CEEM/URJC 1.1%FUNCAS 1.0%
BBVA 0.9%CEPREDE 0.9%
Santander 0.9%Comisión Europea 0.9%Catalunya Caixa 0.8%
Bankia 0.8%Cemex 0.8%CEOE 0.8%
La Caixa 0.8%Repsol 0.8%
Solchaga Recio & Asociados 0.8%IEE 0.7%
Banco de España 0.6%AFI 0.5%
ICAE 0.5%ESADE 0.5%
Intermoney 0.5%Gobierno 0.5%
OCDE 0.4%I. Flores de Lemus 0.3%
The Economist 0.1%FMI 0.0%
Promedio previsiones 0.7%PIB Real 1.4%
9Table 1
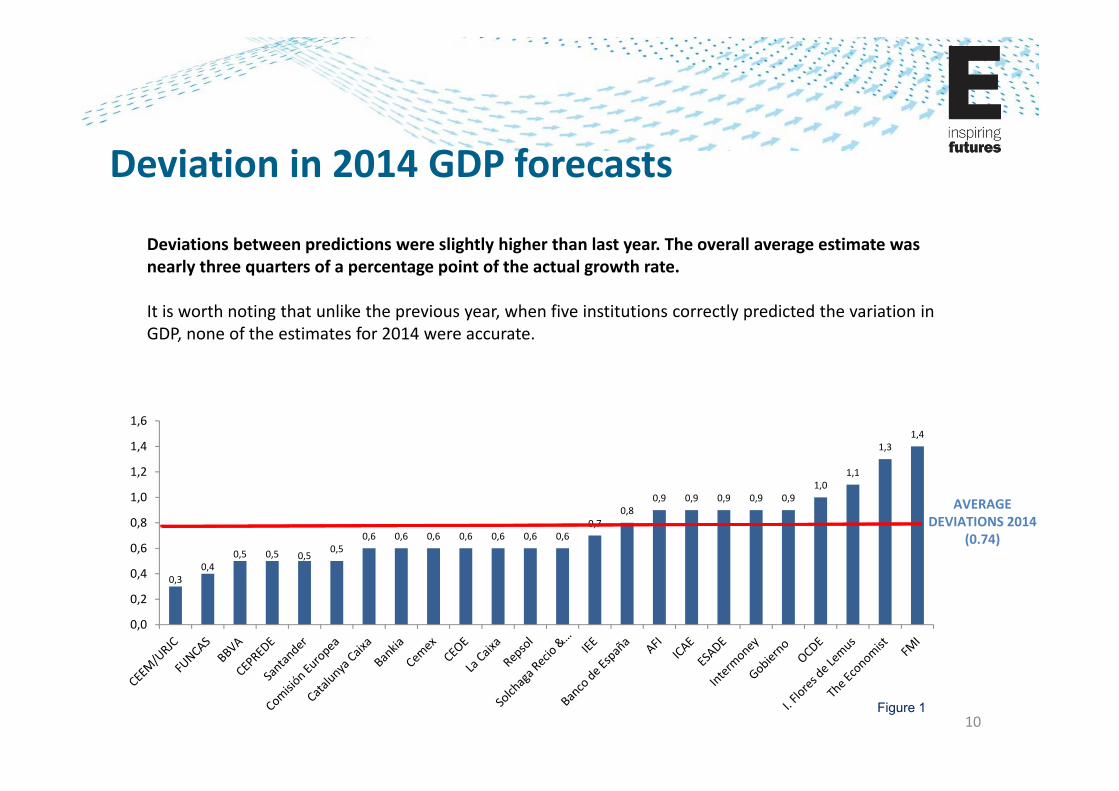
Deviation in 2014 GDP forecasts
Deviations between predictions were slightly higher than last year. The overall average estimate was nearly three quarters of a percentage point of the actual growth rate.
It is worth noting that unlike the previous year, when five institutions correctly predicted the variation in GDP, none of the estimates for 2014 were accurate.
AVERAGE DEVIATIONS 2014
(0.74)
0,30,4
0,5 0,5 0,50,5
0,6 0,6 0,6 0,6 0,6 0,6 0,60,7
0,80,9 0,9 0,9 0,9 0,9
1,01,1
1,31,4
0,0
0,2
0,4
0,6
0,8
1,0
1,2
1,4
1,6
10Figure 1
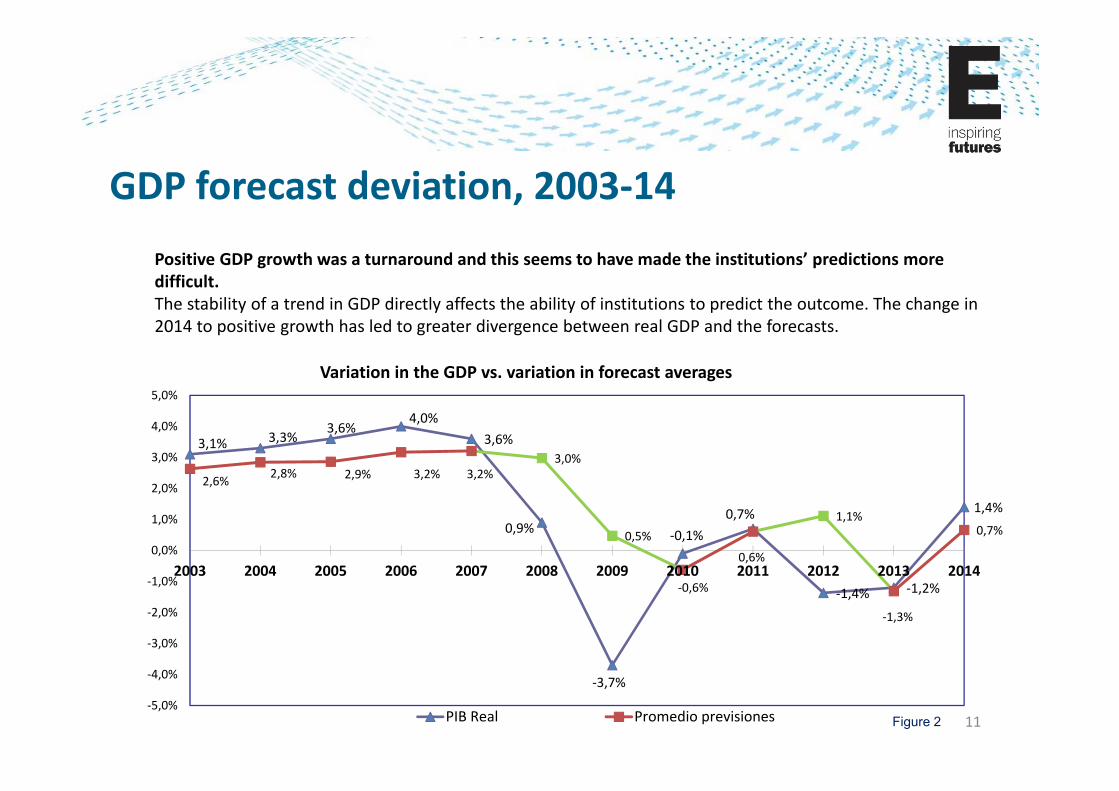
GDP forecast deviation, 2003‐14Positive GDP growth was a turnaround and this seems to have made the institutions’ predictions more difficult.The stability of a trend in GDP directly affects the ability of institutions to predict the outcome. The change in 2014 to positive growth has led to greater divergence between real GDP and the forecasts.
3,1% 3,3%3,6%
4,0%3,6%
0,9%
‐3,7%
‐0,1%0,7%
‐1,4% ‐1,2%
1,4%
2,6% 2,8% 2,9% 3,2% 3,2%3,0%
0,5%
‐0,6%
0,6%
1,1%
‐1,3%
0,7%
‐5,0%
‐4,0%
‐3,0%
‐2,0%
‐1,0%
0,0%
1,0%
2,0%
3,0%
4,0%
5,0%
2003 2004 2005 2006 2007 2008 2009 2010 2011 2012 2013 2014
Variation in the GDP vs. variation in forecast averages
PIB Real Promedio previsiones 11Figure 2
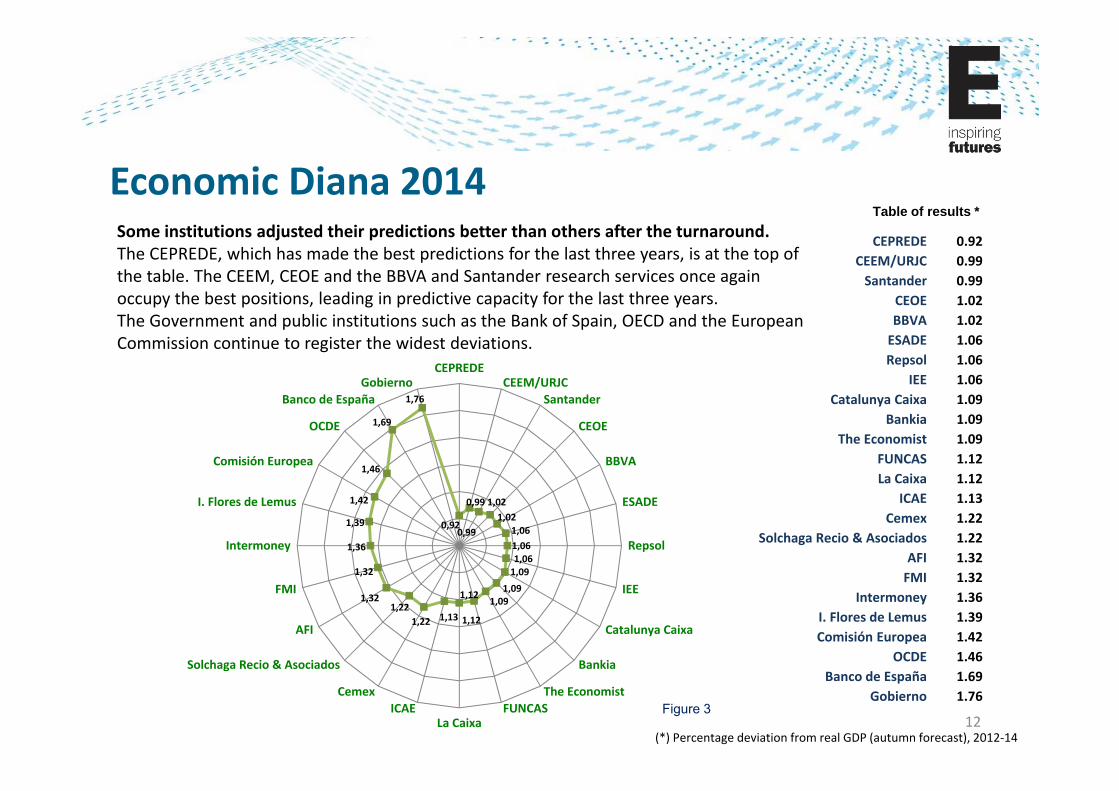
Economic Diana 2014Some institutions adjusted their predictions better than others after the turnaround.The CEPREDE, which has made the best predictions for the last three years, is at the top of the table. The CEEM, CEOE and the BBVA and Santander research services once again occupy the best positions, leading in predictive capacity for the last three years. The Government and public institutions such as the Bank of Spain, OECD and the European Commission continue to register the widest deviations.
(*) Percentage deviation from real GDP (autumn forecast), 2012‐14
Table of results *
CEPREDE 0.92CEEM/URJC 0.99Santander 0.99
CEOE 1.02BBVA 1.02ESADE 1.06Repsol 1.06
IEE 1.06Catalunya Caixa 1.09
Bankia 1.09The Economist 1.09
FUNCAS 1.12La Caixa 1.12
ICAE 1.13Cemex 1.22
Solchaga Recio & Asociados 1.22AFI 1.32FMI 1.32
Intermoney 1.36I. Flores de Lemus 1.39Comisión Europea 1.42
OCDE 1.46Banco de España 1.69
Gobierno 1.76
12
0,920,99
0,99 1,021,02
1,061,061,061,09
1,091,091,12
1,121,131,221,22
1,32
1,32
1,36
1,39
1,42
1,46
1,69
1,76
CEPREDECEEM/URJC
Santander
CEOE
BBVA
ESADE
Repsol
IEE
Catalunya Caixa
Bankia
The EconomistFUNCAS
La CaixaICAE
Cemex
Solchaga Recio & Asociados
AFI
FMI
Intermoney
I. Flores de Lemus
Comisión Europea
OCDE
Banco de EspañaGobierno
Figure 3
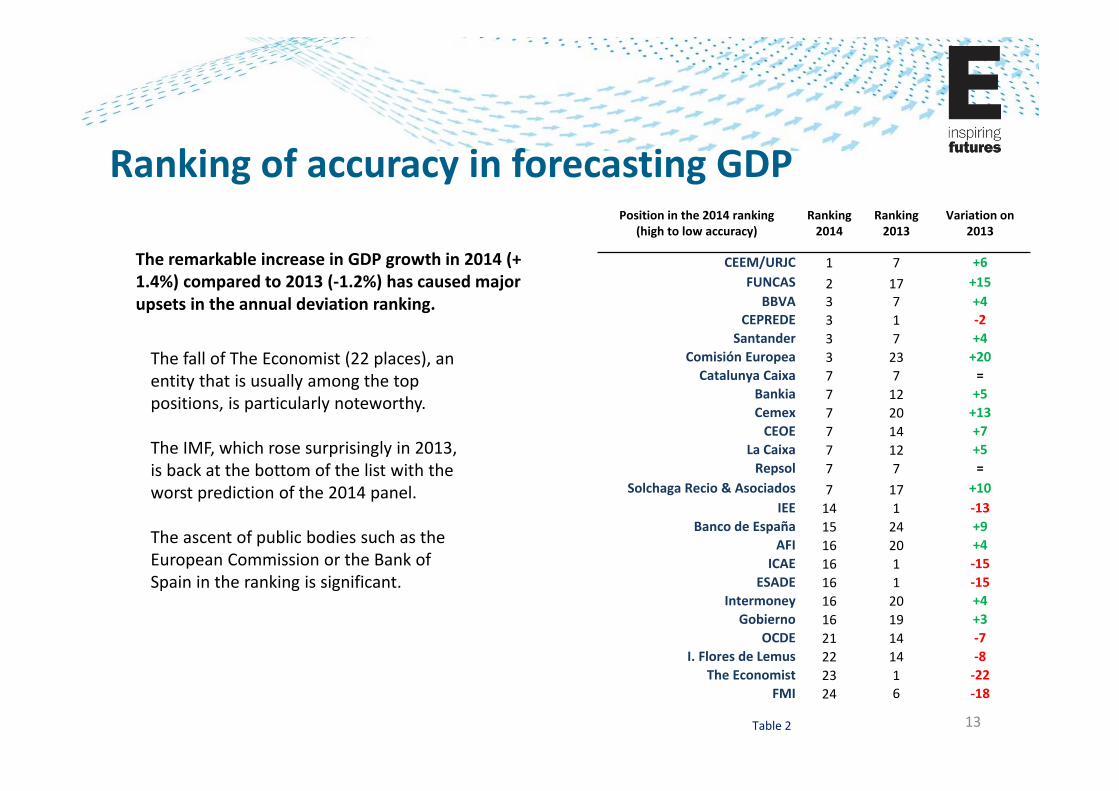
The remarkable increase in GDP growth in 2014 (+ 1.4%) compared to 2013 (‐1.2%) has caused major upsets in the annual deviation ranking.
The fall of The Economist (22 places), an entity that is usually among the top positions, is particularly noteworthy.
The IMF, which rose surprisingly in 2013, is back at the bottom of the list with the worst prediction of the 2014 panel.
The ascent of public bodies such as the European Commission or the Bank of Spain in the ranking is significant.
Position in the 2014 ranking (high to low accuracy)
Ranking 2014
Ranking 2013
Variation on2013
CEEM/URJC 1 7 +6FUNCAS 2 17 +15
BBVA 3 7 +4CEPREDE 3 1 ‐2
Santander 3 7 +4Comisión Europea 3 23 +20Catalunya Caixa 7 7 =
Bankia 7 12 +5Cemex 7 20 +13CEOE 7 14 +7
La Caixa 7 12 +5Repsol 7 7 =
Solchaga Recio & Asociados 7 17 +10IEE 14 1 ‐13
Banco de España 15 24 +9AFI 16 20 +4
ICAE 16 1 ‐15ESADE 16 1 ‐15
Intermoney 16 20 +4Gobierno 16 19 +3
OCDE 21 14 ‐7I. Flores de Lemus 22 14 ‐8
The Economist 23 1 ‐22FMI 24 6 ‐18
Ranking of accuracy in forecasting GDP
13Table 2
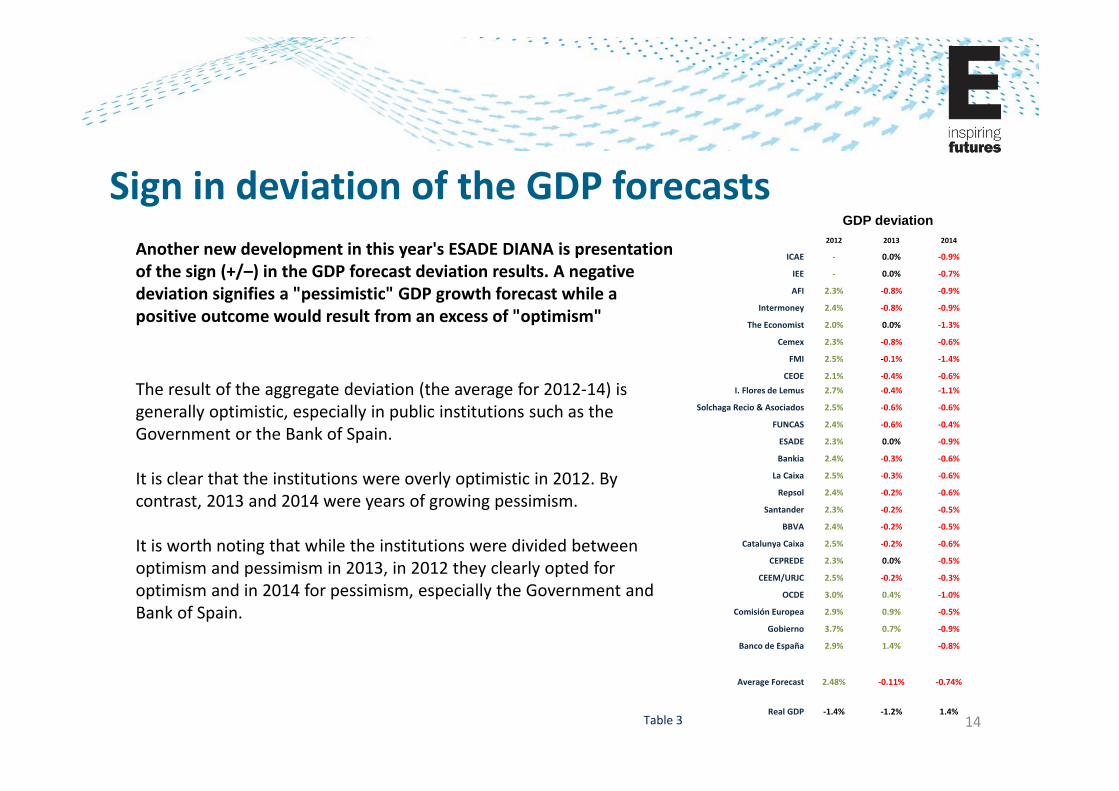
Sign in deviation of the GDP forecastsAnother new development in this year's ESADE DIANA is presentation of the sign (+/–) in the GDP forecast deviation results. A negative deviation signifies a "pessimistic" GDP growth forecast while a positive outcome would result from an excess of "optimism"
The result of the aggregate deviation (the average for 2012‐14) is generally optimistic, especially in public institutions such as the Government or the Bank of Spain.
It is clear that the institutions were overly optimistic in 2012. By contrast, 2013 and 2014 were years of growing pessimism.
It is worth noting that while the institutions were divided between optimism and pessimism in 2013, in 2012 they clearly opted for optimism and in 2014 for pessimism, especially the Government and Bank of Spain.
2012 2013 2014
ICAE ‐ 0.0% ‐0.9%
IEE ‐ 0.0% ‐0.7%
AFI 2.3% ‐0.8% ‐0.9%
Intermoney 2.4% ‐0.8% ‐0.9%
The Economist 2.0% 0.0% ‐1.3%
Cemex 2.3% ‐0.8% ‐0.6%
FMI 2.5% ‐0.1% ‐1.4%
CEOE 2.1% ‐0.4% ‐0.6%I. Flores de Lemus 2.7% ‐0.4% ‐1.1%
Solchaga Recio & Asociados 2.5% ‐0.6% ‐0.6%
FUNCAS 2.4% ‐0.6% ‐0.4%
ESADE 2.3% 0.0% ‐0.9%
Bankia 2.4% ‐0.3% ‐0.6%
La Caixa 2.5% ‐0.3% ‐0.6%
Repsol 2.4% ‐0.2% ‐0.6%
Santander 2.3% ‐0.2% ‐0.5%
BBVA 2.4% ‐0.2% ‐0.5%
Catalunya Caixa 2.5% ‐0.2% ‐0.6%
CEPREDE 2.3% 0.0% ‐0.5%
CEEM/URJC 2.5% ‐0.2% ‐0.3%
OCDE 3.0% 0.4% ‐1.0%
Comisión Europea 2.9% 0.9% ‐0.5%
Gobierno 3.7% 0.7% ‐0.9%
Banco de España 2.9% 1.4% ‐0.8%
Average Forecast 2.48% ‐0.11% ‐0.74%
Real GDP ‐1.4% ‐1.2% 1.4%
GDP deviation
14Table 3
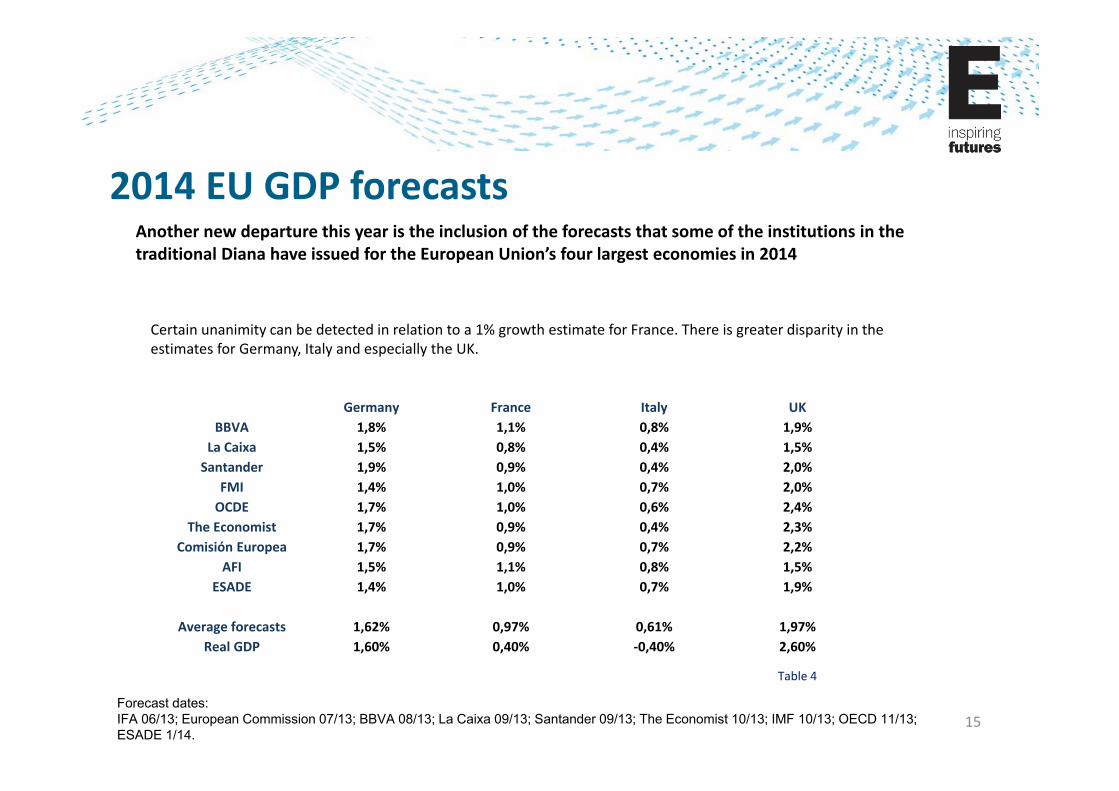
2014 EU GDP forecastsAnother new departure this year is the inclusion of the forecasts that some of the institutions in the traditional Diana have issued for the European Union’s four largest economies in 2014
Certain unanimity can be detected in relation to a 1% growth estimate for France. There is greater disparity in the estimates for Germany, Italy and especially the UK.
Germany France Italy UKBBVA 1,8% 1,1% 0,8% 1,9%
La Caixa 1,5% 0,8% 0,4% 1,5%Santander 1,9% 0,9% 0,4% 2,0%
FMI 1,4% 1,0% 0,7% 2,0%OCDE 1,7% 1,0% 0,6% 2,4%
The Economist 1,7% 0,9% 0,4% 2,3%Comisión Europea 1,7% 0,9% 0,7% 2,2%
AFI 1,5% 1,1% 0,8% 1,5%ESADE 1,4% 1,0% 0,7% 1,9%
Average forecasts 1,62% 0,97% 0,61% 1,97%Real GDP 1,60% 0,40% ‐0,40% 2,60%
15Forecast dates:IFA 06/13; European Commission 07/13; BBVA 08/13; La Caixa 09/13; Santander 09/13; The Economist 10/13; IMF 10/13; OECD 11/13; ESADE 1/14.
Table 4
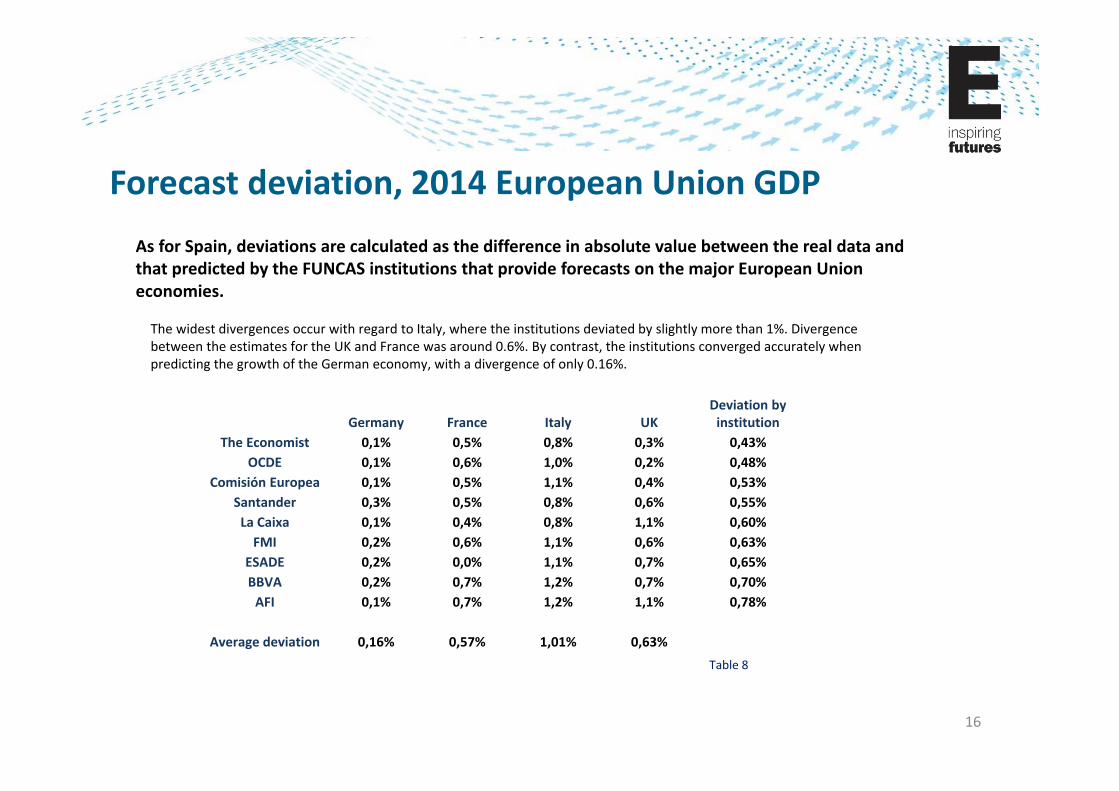
Forecast deviation, 2014 European Union GDPAs for Spain, deviations are calculated as the difference in absolute value between the real data and that predicted by the FUNCAS institutions that provide forecasts on the major European Union economies.
The widest divergences occur with regard to Italy, where the institutions deviated by slightly more than 1%. Divergence between the estimates for the UK and France was around 0.6%. By contrast, the institutions converged accurately when predicting the growth of the German economy, with a divergence of only 0.16%.
Germany France Italy UKDeviation byinstitution
The Economist 0,1% 0,5% 0,8% 0,3% 0,43%OCDE 0,1% 0,6% 1,0% 0,2% 0,48%
Comisión Europea 0,1% 0,5% 1,1% 0,4% 0,53%Santander 0,3% 0,5% 0,8% 0,6% 0,55%La Caixa 0,1% 0,4% 0,8% 1,1% 0,60%FMI 0,2% 0,6% 1,1% 0,6% 0,63%
ESADE 0,2% 0,0% 1,1% 0,7% 0,65%BBVA 0,2% 0,7% 1,2% 0,7% 0,70%AFI 0,1% 0,7% 1,2% 1,1% 0,78%
Average deviation 0,16% 0,57% 1,01% 0,63%
16
Table 8
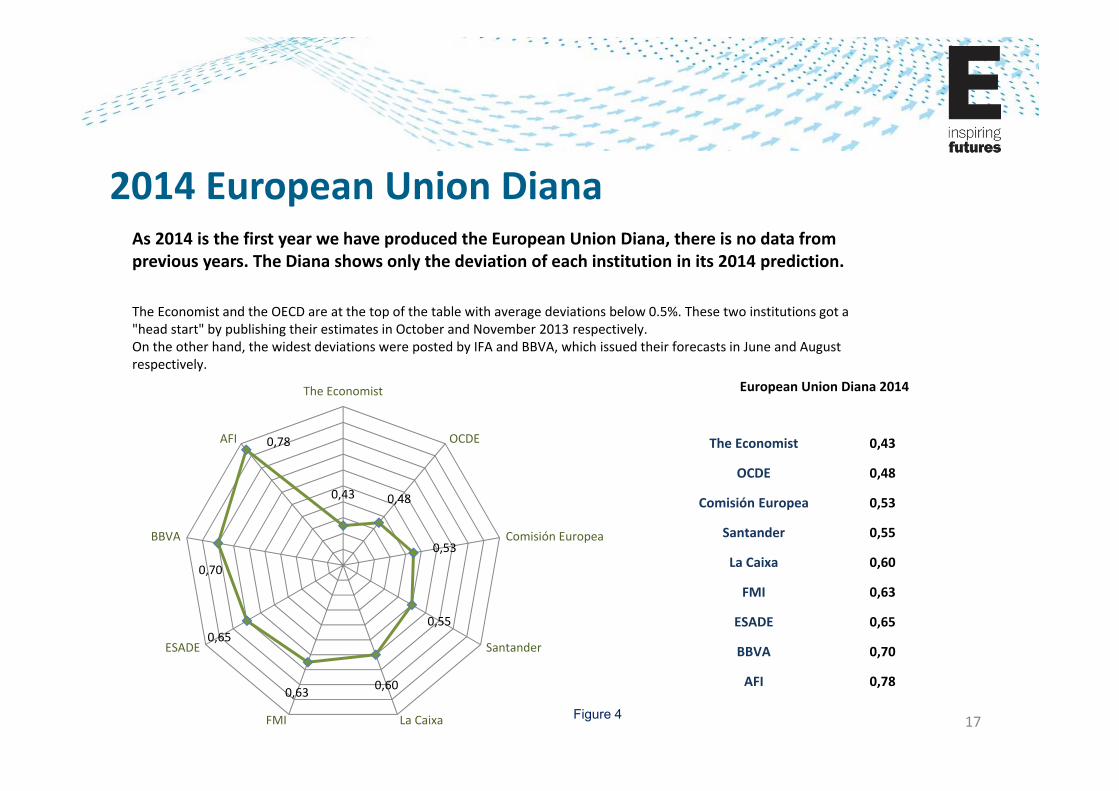
2014 European Union DianaAs 2014 is the first year we have produced the European Union Diana, there is no data from previous years. The Diana shows only the deviation of each institution in its 2014 prediction.
The Economist and the OECD are at the top of the table with average deviations below 0.5%. These two institutions got a "head start" by publishing their estimates in October and November 2013 respectively. On the other hand, the widest deviations were posted by IFA and BBVA, which issued their forecasts in June and August respectively.
European Union Diana 2014
The Economist 0,43
OCDE 0,48
Comisión Europea 0,53
Santander 0,55
La Caixa 0,60
FMI 0,63
ESADE 0,65
BBVA 0,70
AFI 0,78
17Figure 4
0,43 0,48
0,53
0,55
0,600,63
0,65
0,70
0,78
The Economist
OCDE
Comisión Europea
Santander
La CaixaFMI
ESADE
BBVA
AFI

EMPLOYMENT DIANA (EAPS)
18
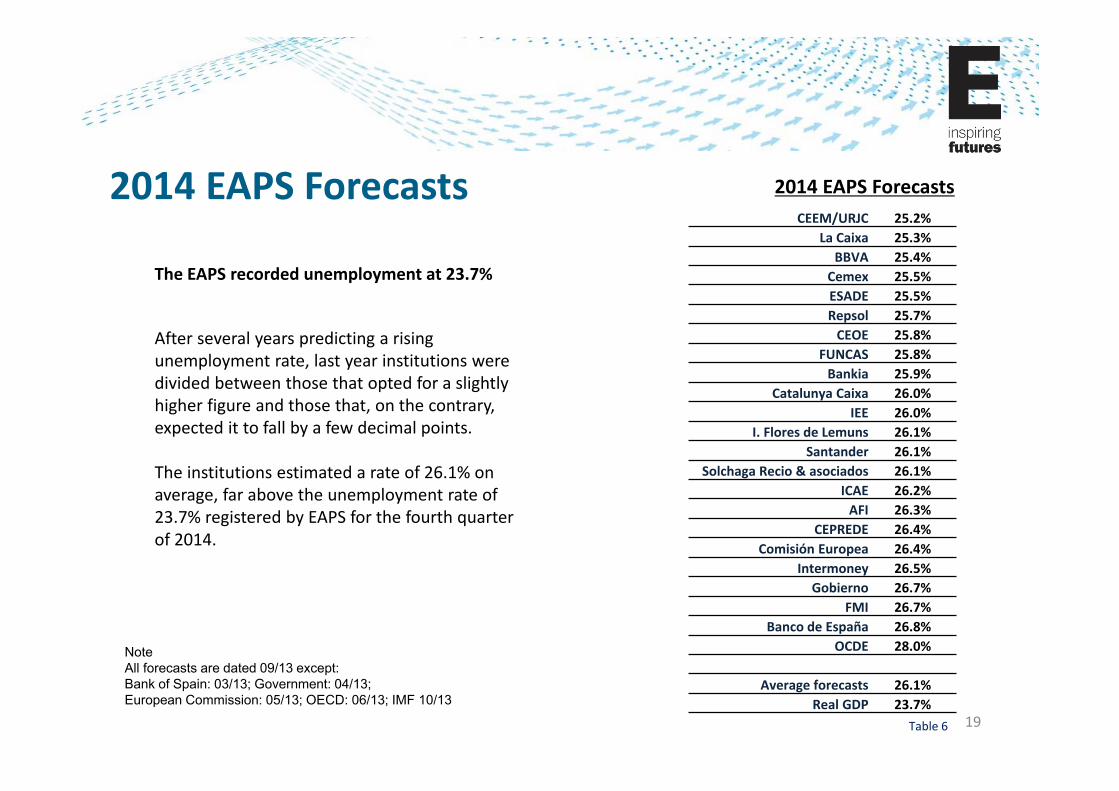
2014 EAPS Forecasts
The EAPS recorded unemployment at 23.7%
After several years predicting a rising unemployment rate, last year institutions were divided between those that opted for a slightly higher figure and those that, on the contrary, expected it to fall by a few decimal points.
The institutions estimated a rate of 26.1% on average, far above the unemployment rate of 23.7% registered by EAPS for the fourth quarter of 2014.
CEEM/URJC 25.2%La Caixa 25.3%
BBVA 25.4%Cemex 25.5%ESADE 25.5%Repsol 25.7%CEOE 25.8%
FUNCAS 25.8%Bankia 25.9%
Catalunya Caixa 26.0%IEE 26.0%
I. Flores de Lemuns 26.1%Santander 26.1%
Solchaga Recio & asociados 26.1%ICAE 26.2%AFI 26.3%
CEPREDE 26.4%Comisión Europea 26.4%
Intermoney 26.5%Gobierno 26.7%
FMI 26.7%Banco de España 26.8%
OCDE 28.0%
Average forecasts 26.1%Real GDP 23.7%
2014 EAPS Forecasts
NoteAll forecasts are dated 09/13 except:Bank of Spain: 03/13; Government: 04/13; European Commission: 05/13; OECD: 06/13; IMF 10/13
19Table 6
1,5 1,6 1,7 1,8 1,82 2,1 2,1 2,2 2,3 2,3 2,4 2,4 2,4 2,5 2,6 2,7 2,7 2,8
3 3 3,1
4,3
0
0,5
1
1,5
2
2,5
3
3,5
4
4,5
5
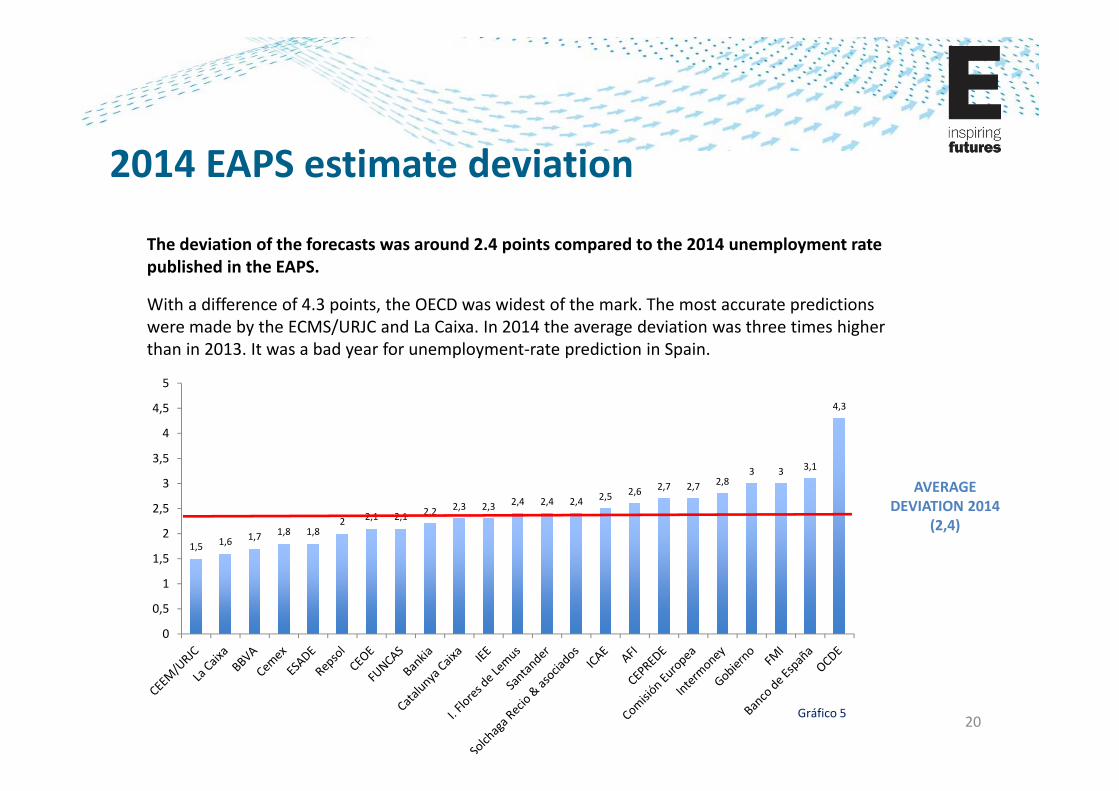
2014 EAPS estimate deviation
The deviation of the forecasts was around 2.4 points compared to the 2014 unemployment rate published in the EAPS.
With a difference of 4.3 points, the OECD was widest of the mark. The most accurate predictions were made by the ECMS/URJC and La Caixa. In 2014 the average deviation was three times higher than in 2013. It was a bad year for unemployment‐rate prediction in Spain.
AVERAGE DEVIATION 2014
(2,4)
20Gráfico 5
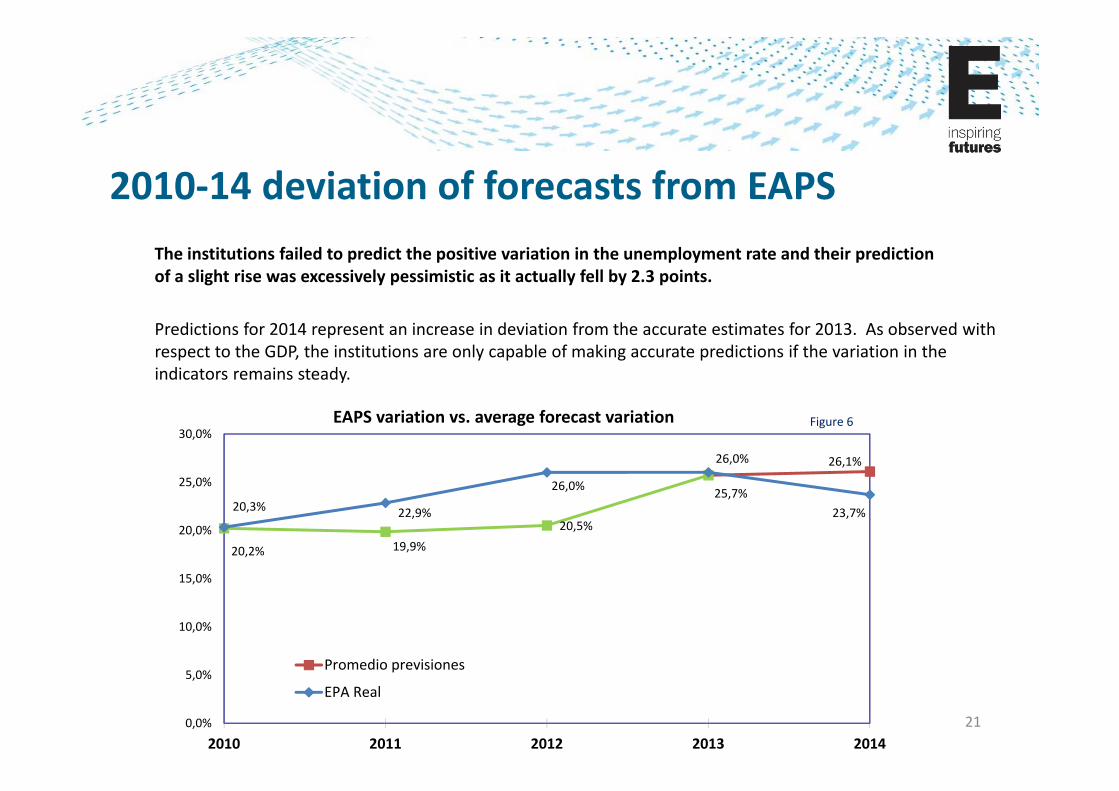
2010‐14 deviation of forecasts from EAPSThe institutions failed to predict the positive variation in the unemployment rate and their prediction of a slight rise was excessively pessimistic as it actually fell by 2.3 points.
Predictions for 2014 represent an increase in deviation from the accurate estimates for 2013. As observed with respect to the GDP, the institutions are only capable of making accurate predictions if the variation in the indicators remains steady.
20,2% 19,9%20,5%
25,7%
26,1%
20,3% 22,9%
26,0%
26,0%
23,7%
0,0%
5,0%
10,0%
15,0%
20,0%
25,0%
30,0%
2010 2011 2012 2013 2014
EAPS variation vs. average forecast variation
Promedio previsiones
EPA Real
21
Figure 6
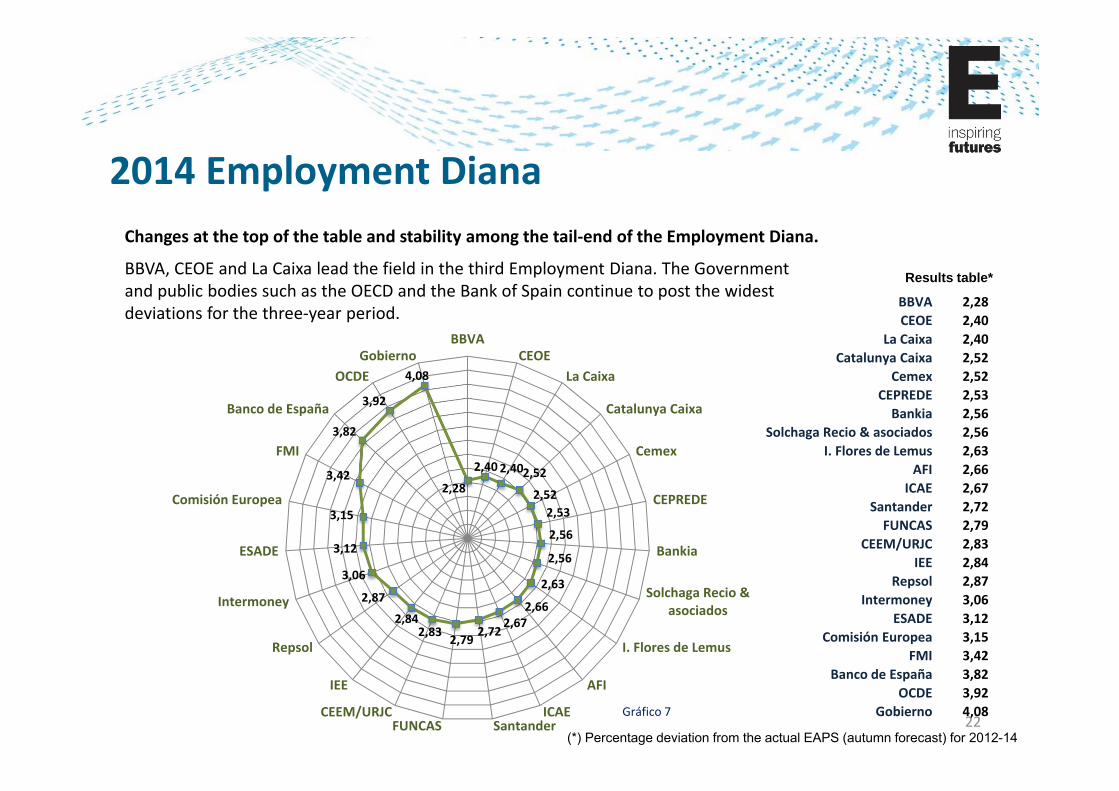
2014 Employment DianaChanges at the top of the table and stability among the tail‐end of the Employment Diana.
BBVA, CEOE and La Caixa lead the field in the third Employment Diana. The Government and public bodies such as the OECD and the Bank of Spain continue to post the widest deviations for the three‐year period.
(*) Percentage deviation from the actual EAPS (autumn forecast) for 2012-14
Results table*
BBVA 2,28CEOE 2,40
La Caixa 2,40Catalunya Caixa 2,52
Cemex 2,52CEPREDE 2,53Bankia 2,56
Solchaga Recio & asociados 2,56I. Flores de Lemus 2,63
AFI 2,66ICAE 2,67
Santander 2,72FUNCAS 2,79
CEEM/URJC 2,83IEE 2,84
Repsol 2,87Intermoney 3,06
ESADE 3,12Comisión Europea 3,15
FMI 3,42Banco de España 3,82
OCDE 3,92Gobierno 4,08
22
2,28
2,40 2,402,52
2,522,53
2,56
2,56
2,63
2,662,67
2,722,792,83
2,84
2,87
3,06
3,12
3,15
3,42
3,82
3,92
4,08
BBVACEOE
La Caixa
Catalunya Caixa
Cemex
CEPREDE
Bankia
Solchaga Recio &asociados
I. Flores de Lemus
AFI
ICAESantanderFUNCAS
CEEM/URJC
IEE
Repsol
Intermoney
ESADE
Comisión Europea
FMI
Banco de España
OCDEGobierno
Gráfico 7
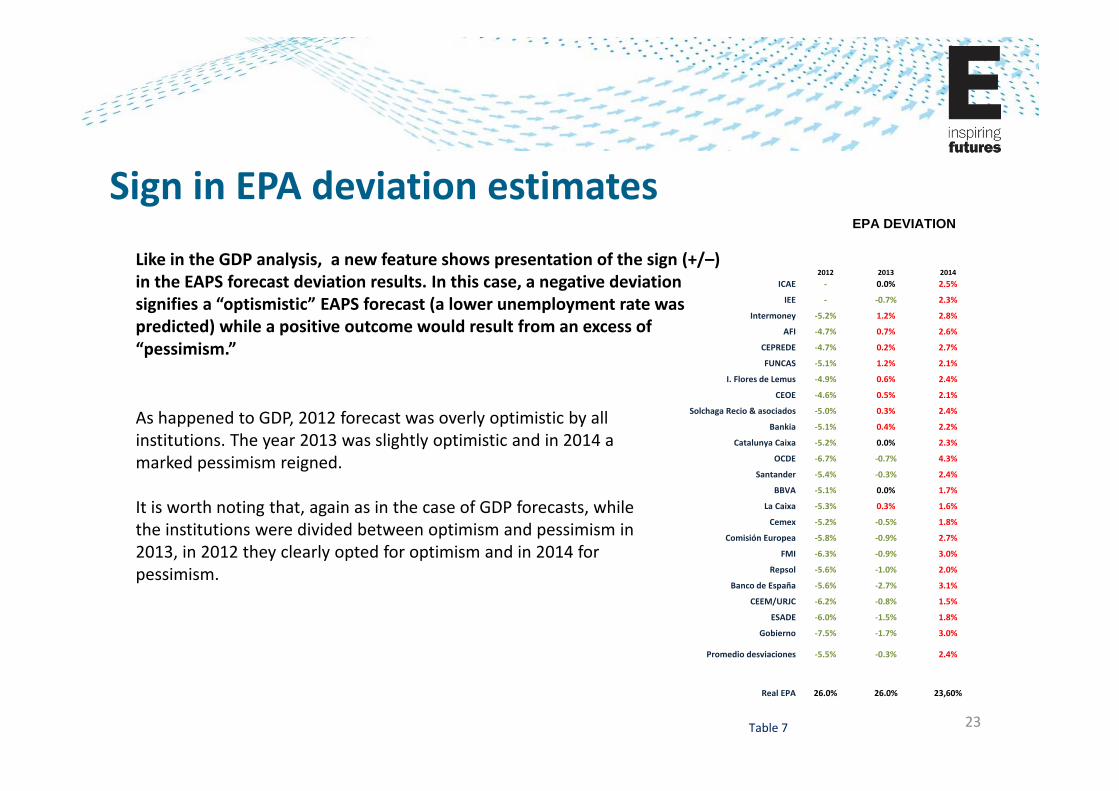
Sign in EPA deviation estimatesLike in the GDP analysis, a new feature shows presentation of the sign (+/–) in the EAPS forecast deviation results. In this case, a negative deviationsignifies a “optismistic” EAPS forecast (a lower unemployment rate waspredicted) while a positive outcome would result from an excess of “pessimism.”
As happened to GDP, 2012 forecast was overly optimistic by all institutions. The year 2013 was slightly optimistic and in 2014 a marked pessimism reigned.
It is worth noting that, again as in the case of GDP forecasts, while the institutions were divided between optimism and pessimism in 2013, in 2012 they clearly opted for optimism and in 2014 for pessimism.
2012 2013 2014ICAE ‐ 0.0% 2.5%
IEE ‐ ‐0.7% 2.3%
Intermoney ‐5.2% 1.2% 2.8%
AFI ‐4.7% 0.7% 2.6%
CEPREDE ‐4.7% 0.2% 2.7%
FUNCAS ‐5.1% 1.2% 2.1%
I. Flores de Lemus ‐4.9% 0.6% 2.4%
CEOE ‐4.6% 0.5% 2.1%
Solchaga Recio & asociados ‐5.0% 0.3% 2.4%
Bankia ‐5.1% 0.4% 2.2%
Catalunya Caixa ‐5.2% 0.0% 2.3%
OCDE ‐6.7% ‐0.7% 4.3%
Santander ‐5.4% ‐0.3% 2.4%
BBVA ‐5.1% 0.0% 1.7%
La Caixa ‐5.3% 0.3% 1.6%
Cemex ‐5.2% ‐0.5% 1.8%
Comisión Europea ‐5.8% ‐0.9% 2.7%
FMI ‐6.3% ‐0.9% 3.0%
Repsol ‐5.6% ‐1.0% 2.0%
Banco de España ‐5.6% ‐2.7% 3.1%
CEEM/URJC ‐6.2% ‐0.8% 1.5%
ESADE ‐6.0% ‐1.5% 1.8%
Gobierno ‐7.5% ‐1.7% 3.0%
Promedio desviaciones ‐5.5% ‐0.3% 2.4%
Real EPA 26.0% 26.0% 23,60%
EPA DEVIATION
23Table 7
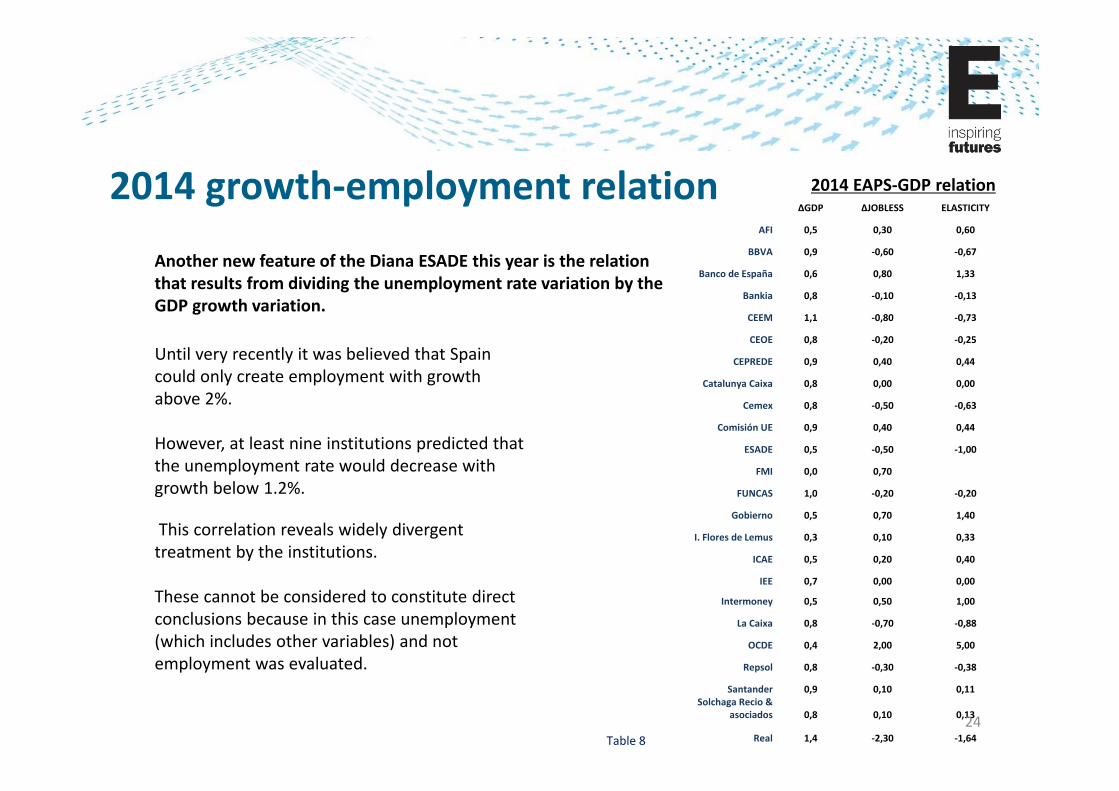
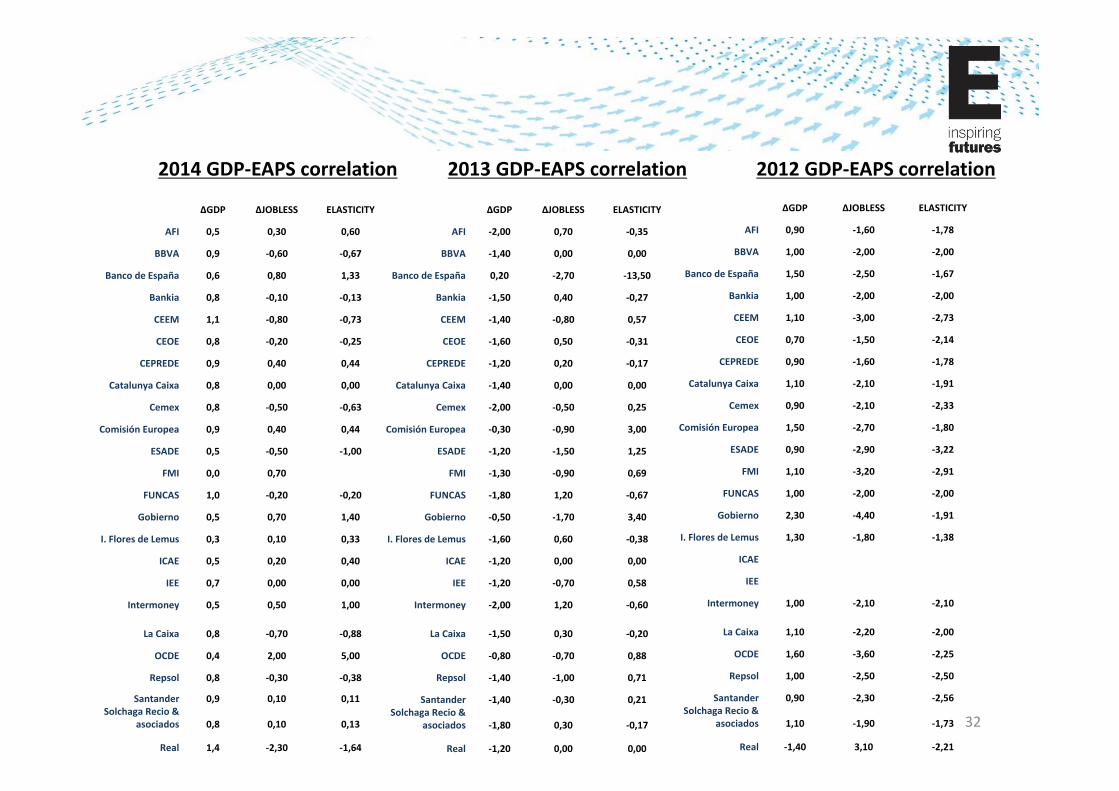
2014 growth‐employment relation
Another new feature of the Diana ESADE this year is the relation that results from dividing the unemployment rate variation by the GDP growth variation.
Until very recently it was believed that Spain could only create employment with growth above 2%.
However, at least nine institutions predicted that the unemployment rate would decrease with growth below 1.2%.
This correlation reveals widely divergent treatment by the institutions.
These cannot be considered to constitute direct conclusions because in this case unemployment (which includes other variables) and not employment was evaluated.
ΔGDP ΔJOBLESS ELASTICITY
AFI 0,5 0,30 0,60
BBVA 0,9 ‐0,60 ‐0,67
Banco de España 0,6 0,80 1,33
Bankia 0,8 ‐0,10 ‐0,13
CEEM 1,1 ‐0,80 ‐0,73
CEOE 0,8 ‐0,20 ‐0,25
CEPREDE 0,9 0,40 0,44
Catalunya Caixa 0,8 0,00 0,00
Cemex 0,8 ‐0,50 ‐0,63
Comisión UE 0,9 0,40 0,44
ESADE 0,5 ‐0,50 ‐1,00
FMI 0,0 0,70
FUNCAS 1,0 ‐0,20 ‐0,20
Gobierno 0,5 0,70 1,40
I. Flores de Lemus 0,3 0,10 0,33
ICAE 0,5 0,20 0,40
IEE 0,7 0,00 0,00
Intermoney 0,5 0,50 1,00
La Caixa 0,8 ‐0,70 ‐0,88
OCDE 0,4 2,00 5,00
Repsol 0,8 ‐0,30 ‐0,38
Santander 0,9 0,10 0,11Solchaga Recio &
asociados 0,8 0,10 0,13
Real 1,4 ‐2,30 ‐1,64
2014 EAPS‐GDP relation
24Table 8
We remember that there is a website available to the media where you can download the DIANA:
http://www.esade.edu/diana
TOOL FOR MEDIA
AUTHORSEnrique Verdeguer, Director, ESADE Madrid
Maria Angels Valls, ESADE professor, researcher at the ESADE Institute for Labor Studies
Javier Capapé, Researcher, ESADEgeo
Tomás Guerrero, Researcher, ESADEgeo
25
DIANA ESADEAnnex
2626
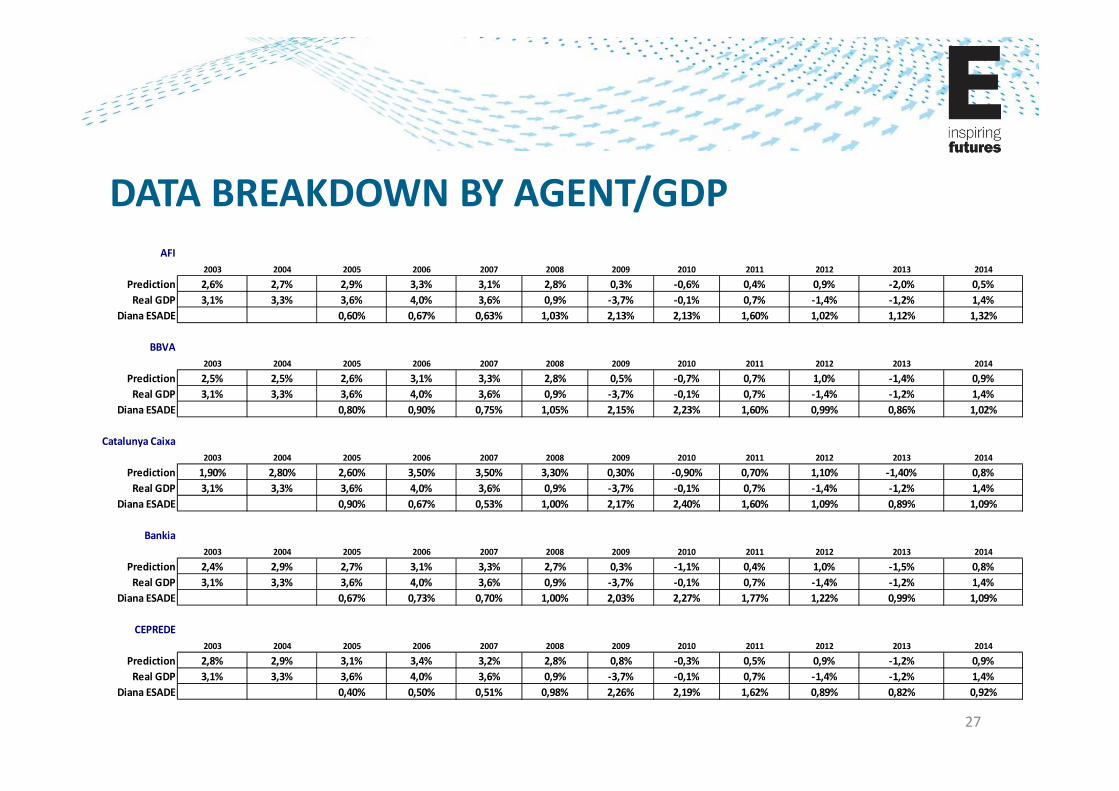
DATA BREAKDOWN BY AGENT/GDPAFI
2003 2004 2005 2006 2007 2008 2009 2010 2011 2012 2013 2014
Prediction 2,6% 2,7% 2,9% 3,3% 3,1% 2,8% 0,3% ‐0,6% 0,4% 0,9% ‐2,0% 0,5%Real GDP 3,1% 3,3% 3,6% 4,0% 3,6% 0,9% ‐3,7% ‐0,1% 0,7% ‐1,4% ‐1,2% 1,4%
Diana ESADE 0,60% 0,67% 0,63% 1,03% 2,13% 2,13% 1,60% 1,02% 1,12% 1,32%
BBVA2003 2004 2005 2006 2007 2008 2009 2010 2011 2012 2013 2014
Prediction 2,5% 2,5% 2,6% 3,1% 3,3% 2,8% 0,5% ‐0,7% 0,7% 1,0% ‐1,4% 0,9%Real GDP 3,1% 3,3% 3,6% 4,0% 3,6% 0,9% ‐3,7% ‐0,1% 0,7% ‐1,4% ‐1,2% 1,4%
Diana ESADE 0,80% 0,90% 0,75% 1,05% 2,15% 2,23% 1,60% 0,99% 0,86% 1,02%
Catalunya Caixa2003 2004 2005 2006 2007 2008 2009 2010 2011 2012 2013 2014
Prediction 1,90% 2,80% 2,60% 3,50% 3,50% 3,30% 0,30% ‐0,90% 0,70% 1,10% ‐1,40% 0,8%Real GDP 3,1% 3,3% 3,6% 4,0% 3,6% 0,9% ‐3,7% ‐0,1% 0,7% ‐1,4% ‐1,2% 1,4%
Diana ESADE 0,90% 0,67% 0,53% 1,00% 2,17% 2,40% 1,60% 1,09% 0,89% 1,09%
Bankia2003 2004 2005 2006 2007 2008 2009 2010 2011 2012 2013 2014
Prediction 2,4% 2,9% 2,7% 3,1% 3,3% 2,7% 0,3% ‐1,1% 0,4% 1,0% ‐1,5% 0,8%Real GDP 3,1% 3,3% 3,6% 4,0% 3,6% 0,9% ‐3,7% ‐0,1% 0,7% ‐1,4% ‐1,2% 1,4%
Diana ESADE 0,67% 0,73% 0,70% 1,00% 2,03% 2,27% 1,77% 1,22% 0,99% 1,09%
CEPREDE2003 2004 2005 2006 2007 2008 2009 2010 2011 2012 2013 2014
Prediction 2,8% 2,9% 3,1% 3,4% 3,2% 2,8% 0,8% ‐0,3% 0,5% 0,9% ‐1,2% 0,9%Real GDP 3,1% 3,3% 3,6% 4,0% 3,6% 0,9% ‐3,7% ‐0,1% 0,7% ‐1,4% ‐1,2% 1,4%
Diana ESADE 0,40% 0,50% 0,51% 0,98% 2,26% 2,19% 1,62% 0,89% 0,82% 0,92%
27
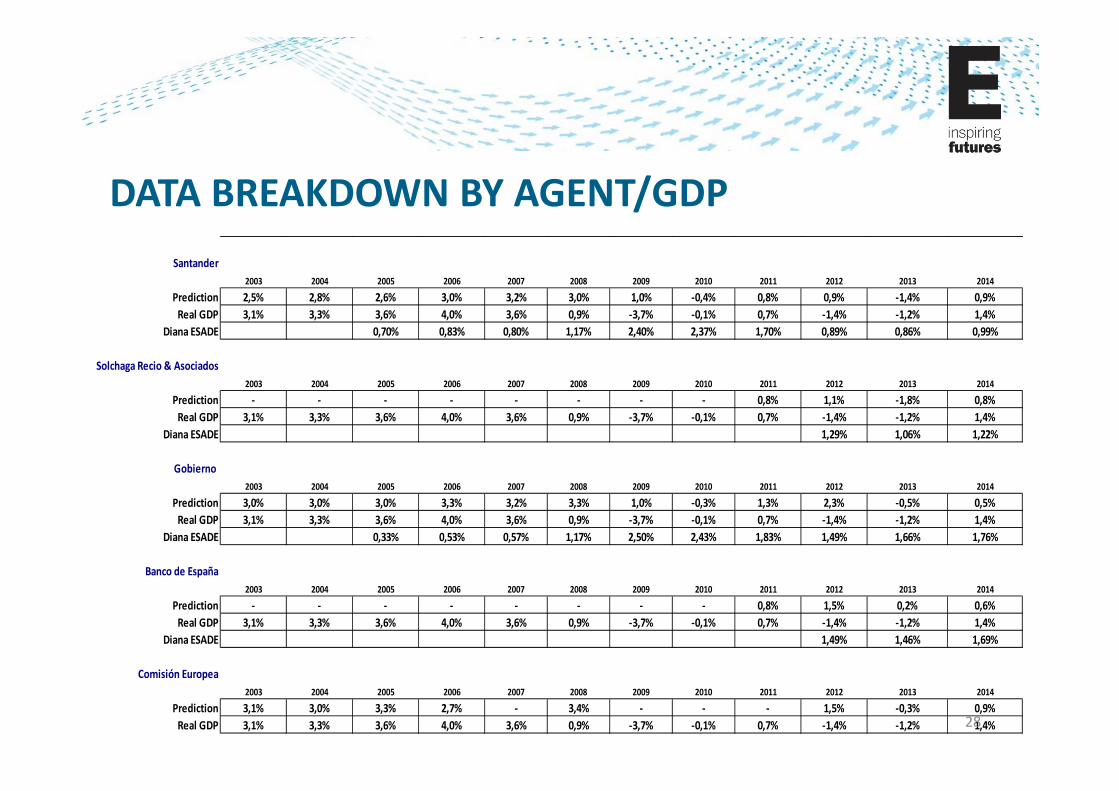
DATA BREAKDOWN BY AGENT/GDPSantander
2003 2004 2005 2006 2007 2008 2009 2010 2011 2012 2013 2014
Prediction 2,5% 2,8% 2,6% 3,0% 3,2% 3,0% 1,0% ‐0,4% 0,8% 0,9% ‐1,4% 0,9%Real GDP 3,1% 3,3% 3,6% 4,0% 3,6% 0,9% ‐3,7% ‐0,1% 0,7% ‐1,4% ‐1,2% 1,4%
Diana ESADE 0,70% 0,83% 0,80% 1,17% 2,40% 2,37% 1,70% 0,89% 0,86% 0,99%
Solchaga Recio & Asociados2003 2004 2005 2006 2007 2008 2009 2010 2011 2012 2013 2014
Prediction ‐ ‐ ‐ ‐ ‐ ‐ ‐ ‐ 0,8% 1,1% ‐1,8% 0,8%Real GDP 3,1% 3,3% 3,6% 4,0% 3,6% 0,9% ‐3,7% ‐0,1% 0,7% ‐1,4% ‐1,2% 1,4%
Diana ESADE 1,29% 1,06% 1,22%
Gobierno 2003 2004 2005 2006 2007 2008 2009 2010 2011 2012 2013 2014
Prediction 3,0% 3,0% 3,0% 3,3% 3,2% 3,3% 1,0% ‐0,3% 1,3% 2,3% ‐0,5% 0,5%Real GDP 3,1% 3,3% 3,6% 4,0% 3,6% 0,9% ‐3,7% ‐0,1% 0,7% ‐1,4% ‐1,2% 1,4%
Diana ESADE 0,33% 0,53% 0,57% 1,17% 2,50% 2,43% 1,83% 1,49% 1,66% 1,76%
Banco de España2003 2004 2005 2006 2007 2008 2009 2010 2011 2012 2013 2014
Prediction ‐ ‐ ‐ ‐ ‐ ‐ ‐ ‐ 0,8% 1,5% 0,2% 0,6%Real GDP 3,1% 3,3% 3,6% 4,0% 3,6% 0,9% ‐3,7% ‐0,1% 0,7% ‐1,4% ‐1,2% 1,4%
Diana ESADE 1,49% 1,46% 1,69%
Comisión Europea2003 2004 2005 2006 2007 2008 2009 2010 2011 2012 2013 2014
Prediction 3,1% 3,0% 3,3% 2,7% ‐ 3,4% ‐ ‐ ‐ 1,5% ‐0,3% 0,9%Real GDP 3,1% 3,3% 3,6% 4,0% 3,6% 0,9% ‐3,7% ‐0,1% 0,7% ‐1,4% ‐1,2% 1,4%28
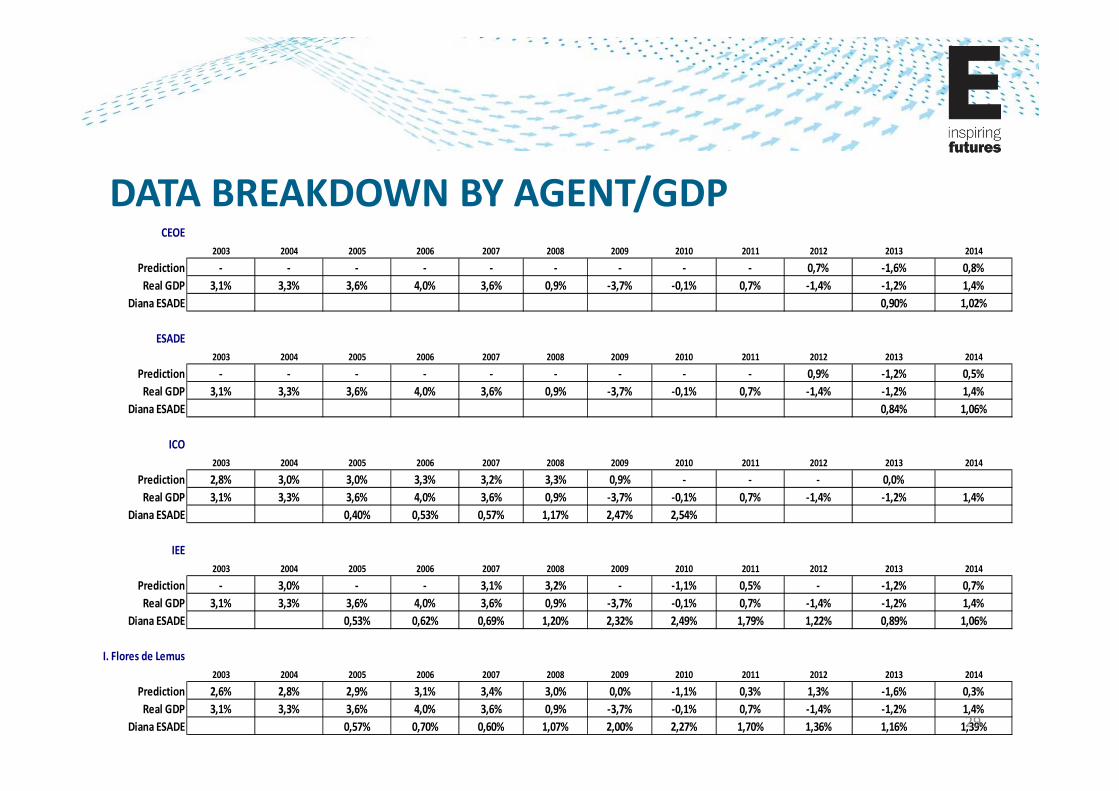
DATA BREAKDOWN BY AGENT/GDPCEOE
2003 2004 2005 2006 2007 2008 2009 2010 2011 2012 2013 2014
Prediction ‐ ‐ ‐ ‐ ‐ ‐ ‐ ‐ ‐ 0,7% ‐1,6% 0,8%Real GDP 3,1% 3,3% 3,6% 4,0% 3,6% 0,9% ‐3,7% ‐0,1% 0,7% ‐1,4% ‐1,2% 1,4%
Diana ESADE 0,90% 1,02%
ESADE2003 2004 2005 2006 2007 2008 2009 2010 2011 2012 2013 2014
Prediction ‐ ‐ ‐ ‐ ‐ ‐ ‐ ‐ ‐ 0,9% ‐1,2% 0,5%Real GDP 3,1% 3,3% 3,6% 4,0% 3,6% 0,9% ‐3,7% ‐0,1% 0,7% ‐1,4% ‐1,2% 1,4%
Diana ESADE 0,84% 1,06%
ICO2003 2004 2005 2006 2007 2008 2009 2010 2011 2012 2013 2014
Prediction 2,8% 3,0% 3,0% 3,3% 3,2% 3,3% 0,9% ‐ ‐ ‐ 0,0%Real GDP 3,1% 3,3% 3,6% 4,0% 3,6% 0,9% ‐3,7% ‐0,1% 0,7% ‐1,4% ‐1,2% 1,4%
Diana ESADE 0,40% 0,53% 0,57% 1,17% 2,47% 2,54%
IEE2003 2004 2005 2006 2007 2008 2009 2010 2011 2012 2013 2014
Prediction ‐ 3,0% ‐ ‐ 3,1% 3,2% ‐ ‐1,1% 0,5% ‐ ‐1,2% 0,7%Real GDP 3,1% 3,3% 3,6% 4,0% 3,6% 0,9% ‐3,7% ‐0,1% 0,7% ‐1,4% ‐1,2% 1,4%
Diana ESADE 0,53% 0,62% 0,69% 1,20% 2,32% 2,49% 1,79% 1,22% 0,89% 1,06%
I. Flores de Lemus2003 2004 2005 2006 2007 2008 2009 2010 2011 2012 2013 2014
Prediction 2,6% 2,8% 2,9% 3,1% 3,4% 3,0% 0,0% ‐1,1% 0,3% 1,3% ‐1,6% 0,3%Real GDP 3,1% 3,3% 3,6% 4,0% 3,6% 0,9% ‐3,7% ‐0,1% 0,7% ‐1,4% ‐1,2% 1,4%
Diana ESADE 0,57% 0,70% 0,60% 1,07% 2,00% 2,27% 1,70% 1,36% 1,16% 1,39%29
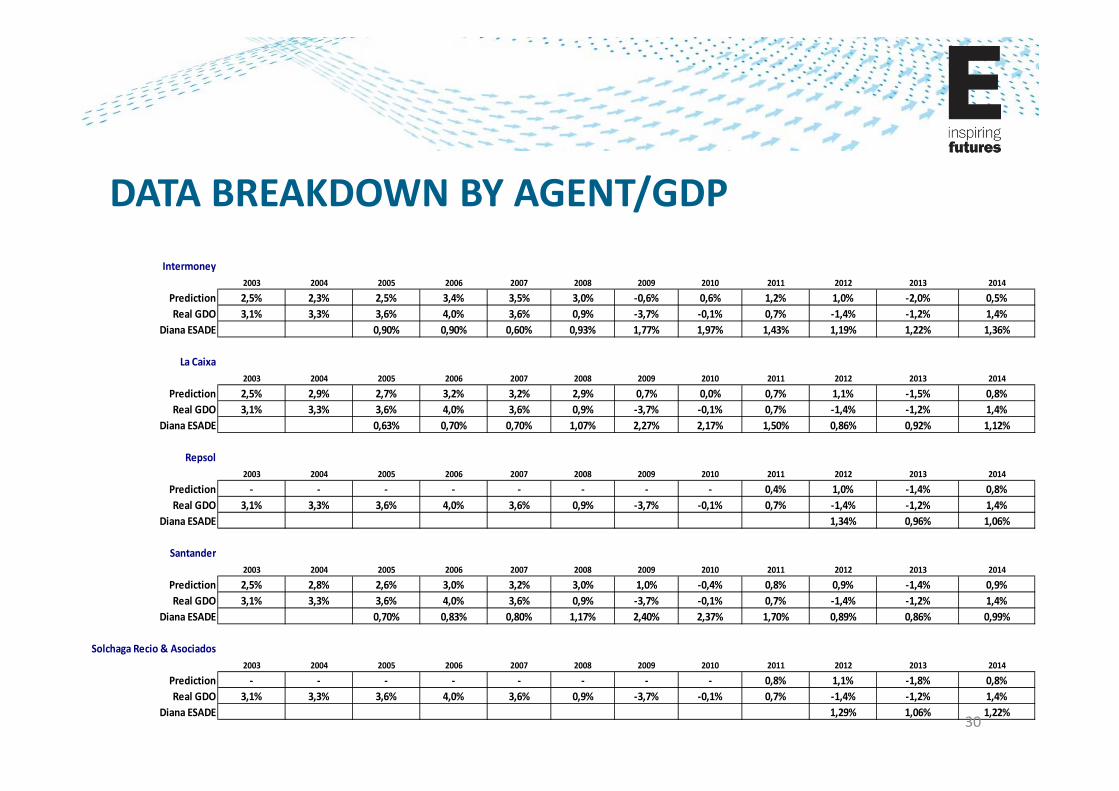
DATA BREAKDOWN BY AGENT/GDPIntermoney
2003 2004 2005 2006 2007 2008 2009 2010 2011 2012 2013 2014
Prediction 2,5% 2,3% 2,5% 3,4% 3,5% 3,0% ‐0,6% 0,6% 1,2% 1,0% ‐2,0% 0,5%Real GDO 3,1% 3,3% 3,6% 4,0% 3,6% 0,9% ‐3,7% ‐0,1% 0,7% ‐1,4% ‐1,2% 1,4%
Diana ESADE 0,90% 0,90% 0,60% 0,93% 1,77% 1,97% 1,43% 1,19% 1,22% 1,36%
La Caixa2003 2004 2005 2006 2007 2008 2009 2010 2011 2012 2013 2014
Prediction 2,5% 2,9% 2,7% 3,2% 3,2% 2,9% 0,7% 0,0% 0,7% 1,1% ‐1,5% 0,8%Real GDO 3,1% 3,3% 3,6% 4,0% 3,6% 0,9% ‐3,7% ‐0,1% 0,7% ‐1,4% ‐1,2% 1,4%
Diana ESADE 0,63% 0,70% 0,70% 1,07% 2,27% 2,17% 1,50% 0,86% 0,92% 1,12%
Repsol2003 2004 2005 2006 2007 2008 2009 2010 2011 2012 2013 2014
Prediction ‐ ‐ ‐ ‐ ‐ ‐ ‐ ‐ 0,4% 1,0% ‐1,4% 0,8%Real GDO 3,1% 3,3% 3,6% 4,0% 3,6% 0,9% ‐3,7% ‐0,1% 0,7% ‐1,4% ‐1,2% 1,4%
Diana ESADE 1,34% 0,96% 1,06%
Santander2003 2004 2005 2006 2007 2008 2009 2010 2011 2012 2013 2014
Prediction 2,5% 2,8% 2,6% 3,0% 3,2% 3,0% 1,0% ‐0,4% 0,8% 0,9% ‐1,4% 0,9%Real GDO 3,1% 3,3% 3,6% 4,0% 3,6% 0,9% ‐3,7% ‐0,1% 0,7% ‐1,4% ‐1,2% 1,4%
Diana ESADE 0,70% 0,83% 0,80% 1,17% 2,40% 2,37% 1,70% 0,89% 0,86% 0,99%
Solchaga Recio & Asociados2003 2004 2005 2006 2007 2008 2009 2010 2011 2012 2013 2014
Prediction ‐ ‐ ‐ ‐ ‐ ‐ ‐ ‐ 0,8% 1,1% ‐1,8% 0,8%Real GDO 3,1% 3,3% 3,6% 4,0% 3,6% 0,9% ‐3,7% ‐0,1% 0,7% ‐1,4% ‐1,2% 1,4%
Diana ESADE 1,29% 1,06% 1,22%30
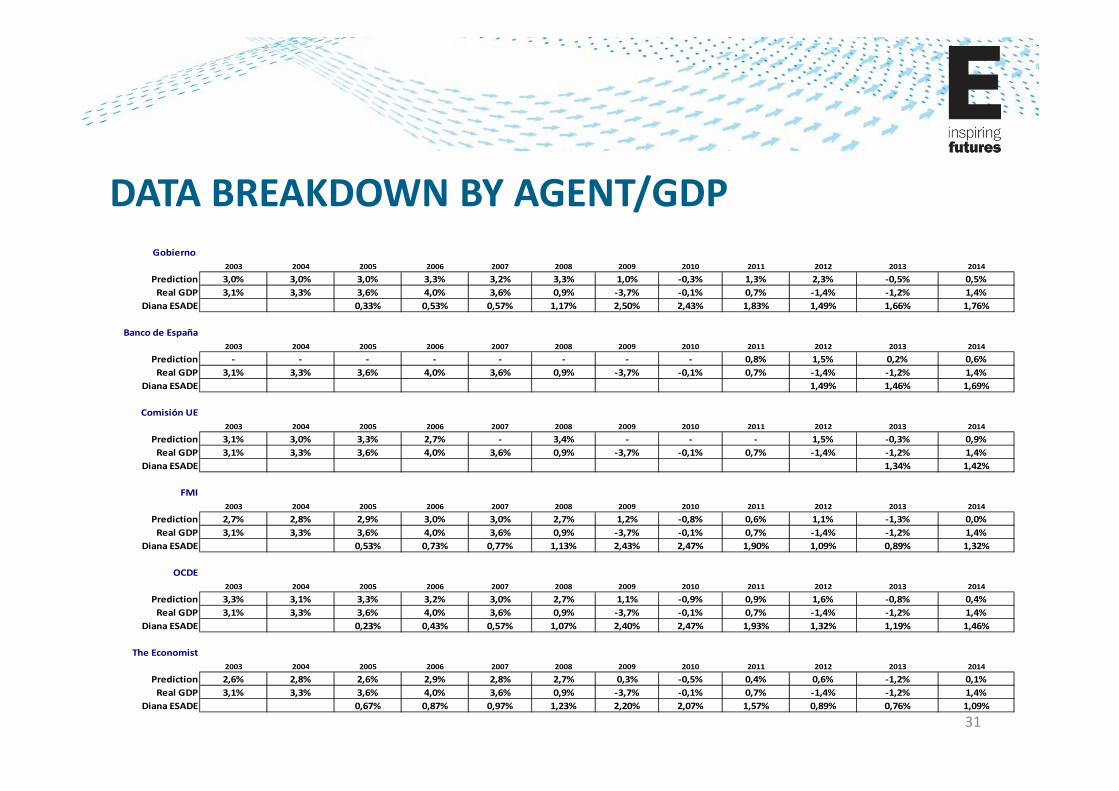
DATA BREAKDOWN BY AGENT/GDPGobierno
2003 2004 2005 2006 2007 2008 2009 2010 2011 2012 2013 2014
Prediction 3,0% 3,0% 3,0% 3,3% 3,2% 3,3% 1,0% ‐0,3% 1,3% 2,3% ‐0,5% 0,5%Real GDP 3,1% 3,3% 3,6% 4,0% 3,6% 0,9% ‐3,7% ‐0,1% 0,7% ‐1,4% ‐1,2% 1,4%
Diana ESADE 0,33% 0,53% 0,57% 1,17% 2,50% 2,43% 1,83% 1,49% 1,66% 1,76%
Banco de España2003 2004 2005 2006 2007 2008 2009 2010 2011 2012 2013 2014
Prediction ‐ ‐ ‐ ‐ ‐ ‐ ‐ ‐ 0,8% 1,5% 0,2% 0,6%Real GDP 3,1% 3,3% 3,6% 4,0% 3,6% 0,9% ‐3,7% ‐0,1% 0,7% ‐1,4% ‐1,2% 1,4%
Diana ESADE 1,49% 1,46% 1,69%
Comisión UE2003 2004 2005 2006 2007 2008 2009 2010 2011 2012 2013 2014
Prediction 3,1% 3,0% 3,3% 2,7% ‐ 3,4% ‐ ‐ ‐ 1,5% ‐0,3% 0,9%Real GDP 3,1% 3,3% 3,6% 4,0% 3,6% 0,9% ‐3,7% ‐0,1% 0,7% ‐1,4% ‐1,2% 1,4%
Diana ESADE 1,34% 1,42%
FMI2003 2004 2005 2006 2007 2008 2009 2010 2011 2012 2013 2014
Prediction 2,7% 2,8% 2,9% 3,0% 3,0% 2,7% 1,2% ‐0,8% 0,6% 1,1% ‐1,3% 0,0%Real GDP 3,1% 3,3% 3,6% 4,0% 3,6% 0,9% ‐3,7% ‐0,1% 0,7% ‐1,4% ‐1,2% 1,4%
Diana ESADE 0,53% 0,73% 0,77% 1,13% 2,43% 2,47% 1,90% 1,09% 0,89% 1,32%
OCDE2003 2004 2005 2006 2007 2008 2009 2010 2011 2012 2013 2014
Prediction 3,3% 3,1% 3,3% 3,2% 3,0% 2,7% 1,1% ‐0,9% 0,9% 1,6% ‐0,8% 0,4%Real GDP 3,1% 3,3% 3,6% 4,0% 3,6% 0,9% ‐3,7% ‐0,1% 0,7% ‐1,4% ‐1,2% 1,4%
Diana ESADE 0,23% 0,43% 0,57% 1,07% 2,40% 2,47% 1,93% 1,32% 1,19% 1,46%
The Economist2003 2004 2005 2006 2007 2008 2009 2010 2011 2012 2013 2014
Prediction 2,6% 2,8% 2,6% 2,9% 2,8% 2,7% 0,3% ‐0,5% 0,4% 0,6% ‐1,2% 0,1%Real GDP 3,1% 3,3% 3,6% 4,0% 3,6% 0,9% ‐3,7% ‐0,1% 0,7% ‐1,4% ‐1,2% 1,4%
Diana ESADE 0,67% 0,87% 0,97% 1,23% 2,20% 2,07% 1,57% 0,89% 0,76% 1,09%
31
32
ΔGDP ΔJOBLESS ELASTICITY
AFI 0,90 ‐1,60 ‐1,78
BBVA 1,00 ‐2,00 ‐2,00
Banco de España 1,50 ‐2,50 ‐1,67
Bankia 1,00 ‐2,00 ‐2,00
CEEM 1,10 ‐3,00 ‐2,73
CEOE 0,70 ‐1,50 ‐2,14
CEPREDE 0,90 ‐1,60 ‐1,78
Catalunya Caixa 1,10 ‐2,10 ‐1,91
Cemex 0,90 ‐2,10 ‐2,33
Comisión Europea 1,50 ‐2,70 ‐1,80
ESADE 0,90 ‐2,90 ‐3,22
FMI 1,10 ‐3,20 ‐2,91
FUNCAS 1,00 ‐2,00 ‐2,00
Gobierno 2,30 ‐4,40 ‐1,91
I. Flores de Lemus 1,30 ‐1,80 ‐1,38
ICAE
IEE
Intermoney 1,00 ‐2,10 ‐2,10
La Caixa 1,10 ‐2,20 ‐2,00
OCDE 1,60 ‐3,60 ‐2,25
Repsol 1,00 ‐2,50 ‐2,50
Santander 0,90 ‐2,30 ‐2,56Solchaga Recio &
asociados 1,10 ‐1,90 ‐1,73
Real ‐1,40 3,10 ‐2,21
ΔGDP ΔJOBLESS ELASTICITY
AFI ‐2,00 0,70 ‐0,35
BBVA ‐1,40 0,00 0,00
Banco de España 0,20 ‐2,70 ‐13,50
Bankia ‐1,50 0,40 ‐0,27
CEEM ‐1,40 ‐0,80 0,57
CEOE ‐1,60 0,50 ‐0,31
CEPREDE ‐1,20 0,20 ‐0,17
Catalunya Caixa ‐1,40 0,00 0,00
Cemex ‐2,00 ‐0,50 0,25
Comisión Europea ‐0,30 ‐0,90 3,00
ESADE ‐1,20 ‐1,50 1,25
FMI ‐1,30 ‐0,90 0,69
FUNCAS ‐1,80 1,20 ‐0,67
Gobierno ‐0,50 ‐1,70 3,40
I. Flores de Lemus ‐1,60 0,60 ‐0,38
ICAE ‐1,20 0,00 0,00
IEE ‐1,20 ‐0,70 0,58
Intermoney ‐2,00 1,20 ‐0,60
La Caixa ‐1,50 0,30 ‐0,20
OCDE ‐0,80 ‐0,70 0,88
Repsol ‐1,40 ‐1,00 0,71
Santander ‐1,40 ‐0,30 0,21Solchaga Recio &
asociados ‐1,80 0,30 ‐0,17
Real ‐1,20 0,00 0,00
ΔGDP ΔJOBLESS ELASTICITY
AFI 0,5 0,30 0,60
BBVA 0,9 ‐0,60 ‐0,67
Banco de España 0,6 0,80 1,33
Bankia 0,8 ‐0,10 ‐0,13
CEEM 1,1 ‐0,80 ‐0,73
CEOE 0,8 ‐0,20 ‐0,25
CEPREDE 0,9 0,40 0,44
Catalunya Caixa 0,8 0,00 0,00
Cemex 0,8 ‐0,50 ‐0,63
Comisión Europea 0,9 0,40 0,44
ESADE 0,5 ‐0,50 ‐1,00
FMI 0,0 0,70
FUNCAS 1,0 ‐0,20 ‐0,20
Gobierno 0,5 0,70 1,40
I. Flores de Lemus 0,3 0,10 0,33
ICAE 0,5 0,20 0,40
IEE 0,7 0,00 0,00
Intermoney 0,5 0,50 1,00
La Caixa 0,8 ‐0,70 ‐0,88
OCDE 0,4 2,00 5,00
Repsol 0,8 ‐0,30 ‐0,38
Santander 0,9 0,10 0,11Solchaga Recio &
asociados 0,8 0,10 0,13
Real 1,4 ‐2,30 ‐1,64
2014 GDP‐EAPS correlation 2013 GDP‐EAPS correlation 2012 GDP‐EAPS correlation
33
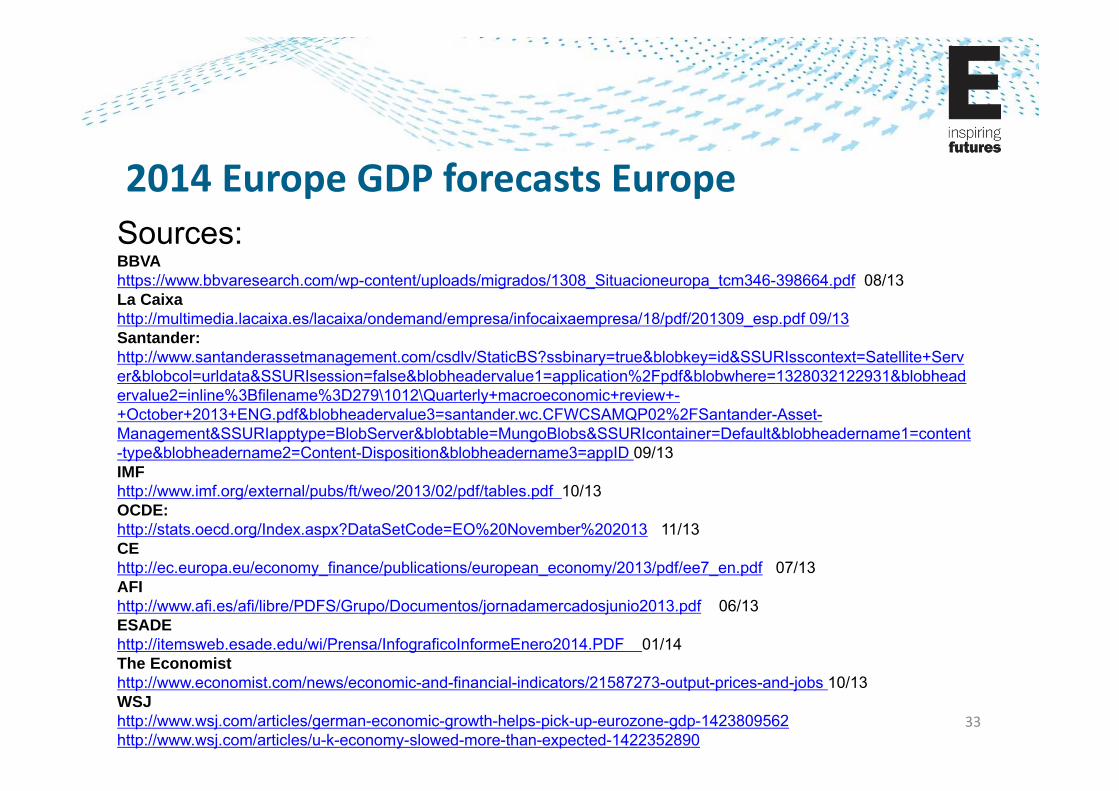
Sources:BBVAhttps://www.bbvaresearch.com/wp-content/uploads/migrados/1308_Situacioneuropa_tcm346-398664.pdf 08/13La Caixahttp://multimedia.lacaixa.es/lacaixa/ondemand/empresa/infocaixaempresa/18/pdf/201309_esp.pdf 09/13Santander: http://www.santanderassetmanagement.com/csdlv/StaticBS?ssbinary=true&blobkey=id&SSURIsscontext=Satellite+Server&blobcol=urldata&SSURIsession=false&blobheadervalue1=application%2Fpdf&blobwhere=1328032122931&blobheadervalue2=inline%3Bfilename%3D279\1012\Quarterly+macroeconomic+review+-+October+2013+ENG.pdf&blobheadervalue3=santander.wc.CFWCSAMQP02%2FSantander-Asset-Management&SSURIapptype=BlobServer&blobtable=MungoBlobs&SSURIcontainer=Default&blobheadername1=content-type&blobheadername2=Content-Disposition&blobheadername3=appID 09/13IMFhttp://www.imf.org/external/pubs/ft/weo/2013/02/pdf/tables.pdf 10/13OCDE:http://stats.oecd.org/Index.aspx?DataSetCode=EO%20November%202013 11/13CEhttp://ec.europa.eu/economy_finance/publications/european_economy/2013/pdf/ee7_en.pdf 07/13AFIhttp://www.afi.es/afi/libre/PDFS/Grupo/Documentos/jornadamercadosjunio2013.pdf 06/13ESADEhttp://itemsweb.esade.edu/wi/Prensa/InfograficoInformeEnero2014.PDF 01/14The Economisthttp://www.economist.com/news/economic-and-financial-indicators/21587273-output-prices-and-jobs 10/13WSJhttp://www.wsj.com/articles/german-economic-growth-helps-pick-up-eurozone-gdp-1423809562http://www.wsj.com/articles/u-k-economy-slowed-more-than-expected-1422352890
2014 Europe GDP forecasts Europe
1) Calculating the deviation
Economic Diana
The deviation obtained is used directly in GDP points. For example, if an institution predicts 2% and the real figure is 0.5%, its deviation is 1.5 GDP points. The same applies if the forecast falls short. If the forecast is 1.5% and the real figure is 3%, then the deviation is likewise 1.5 GDP points.
This means that the data is easily understood and we measure by how many GDP points an institution has deviated from the real data, whether that deviation is positive or negative.
Employment Diana
Deviation obtained from the EAPS is used. As in the GDP Diana, we measure by the points by which an institution tends to deviate.
INFORMATION ON THE METHOD
34
2) Comparison between institutions
Assessment of the various entities is independent of those included in the list. We are interested in providing useful information to managers and entrepreneurs to help them estimate the extent to which a forecast holds true or− if they want to take it into account− by how many GDP points it usually deviates from what actually happens later.
By working with the direct difference in absolute value between prediction and reality, the calculation is not affected either by the degree of accuracy/error of others or by the relationship between organisationsincluded in the calculation.
We have provided an additional table by institution so that if anyone is interested in knowing the details of how the deviations were produced, they can easily find out.
INFORMATION ON THE METHOD
35
3) The dates on which the predictions are made (over three years)
We have chosen to include a period of three years. We believe that this period offers a medium‐term perspective that enables quite quick improvement in the event that the year’s prediction is wrong, while being sufficiently steady to allow judgements to be made on an entity’s predictive capacity.
The DIANA ESADE takes the prediction that each institution makes for the following year, compares it with the actual data that is ultimately produced and calculates the difference. The same criteria as that used for the two previous years are applied and the average of the three reveals the deviation associated with each institution.
INFORMATION ON THE METHOD
36

The FUNCAS Panel has been operating for several years and has proven to be the most up‐to‐date forecast source.
The number of institutions on the FUNCAS Panel is high enough to be representative, relevant and comprehensive.
DIANA ESADE will only include national or international publications or journals from outside the panel that are considered indispensable and have their own research service or expert panel.
WHY IS THE FUNCAS PANEL USED AS THE SOURCE?
37