Embed Size (px)
Citation preview
1
DHH Region 7
2
2014 LouisianaCaring Communities Youth Survey
Sponsored by
Cecil J. Picard Center for Child Development and Lifelong Learning,University of Louisiana at Lafayette
Bach Harrison, L.L.C.
The LCCYS was conducted by
This report was created by
John White, State Superintendent of Education
Dr. Rochelle Head-Dunham, Assistant Secretary/Medical Director, OBH, DHH
3
Introduction 4
The Risk and Protective Factor Model of Prevention 5
Data-Driven Strategic Planning: Risk and Protective Factor Model 6
Prevention Planning: Risk and Protective Factor Model 7
Prevention Planning: Strategic Prevention Framework (SPF) Model 7
Using CCYS Data for Prevention Planning 9
Understanding the Charts in this Report 10
Charts and Tables in this Report:
Drug Use Profiles 13Gateway Drug Use, Other Illicit Drug Use, Severe Substance Use Indicators
Antisocial Behavior and Gambling Profiles 22
Risk and Protective Factor Profiles 30
Alcohol Environmental Risk Factors 40
Mental Health and Suicide Indicators 49
Additional Data for Prevention Planning 56Violence and Bullying Indicators, Perceived Perception of Risk, Parent/Peer Disapproval, and 30-Day Use
Risk and Protective Scale Definitions 58
Contacts for Prevention 60
Table of Contents
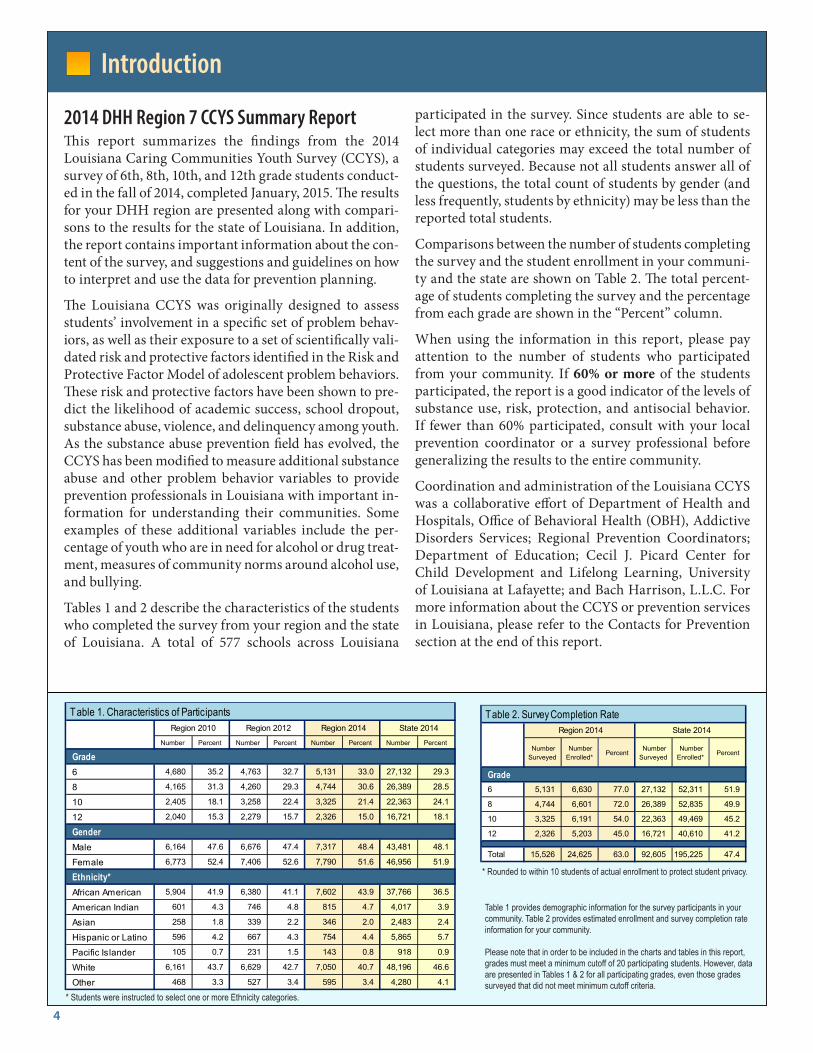
Table 1 provides demographic information for the survey participants in your community. Table 2 provides estimated enrollment and survey completion rate information for your community.
Please note that in order to be included in the charts and tables in this report, grades must meet a minimum cutoff of 20 participating students. However, data are presented in Tables 1 & 2 for all participating grades, even those grades surveyed that did not meet minimum cutoff criteria.
* Students were instructed to select one or more Ethnicity categories.
* Rounded to within 10 students of actual enrollment to protect student privacy.
4
2014 DHH Region 7 CCYS Summary ReportThis report summarizes the findings from the 2014 Louisiana Caring Communities Youth Survey (CCYS), a survey of 6th, 8th, 10th, and 12th grade students conduct-ed in the fall of 2014, completed January, 2015. The results for your DHH region are presented along with compari-sons to the results for the state of Louisiana. In addition, the report contains important information about the con-tent of the survey, and suggestions and guidelines on how to interpret and use the data for prevention planning.
The Louisiana CCYS was originally designed to assess students’ involvement in a specific set of problem behav-iors, as well as their exposure to a set of scientifically vali-dated risk and protective factors identified in the Risk and Protective Factor Model of adolescent problem behaviors. These risk and protective factors have been shown to pre-dict the likelihood of academic success, school dropout, substance abuse, violence, and delinquency among youth. As the substance abuse prevention field has evolved, the CCYS has been modified to measure additional substance abuse and other problem behavior variables to provide prevention professionals in Louisiana with important in-formation for understanding their communities. Some examples of these additional variables include the per-centage of youth who are in need for alcohol or drug treat-ment, measures of community norms around alcohol use, and bullying.
Tables 1 and 2 describe the characteristics of the students who completed the survey from your region and the state of Louisiana. A total of 577 schools across Louisiana
participated in the survey. Since students are able to se-lect more than one race or ethnicity, the sum of students of individual categories may exceed the total number of students surveyed. Because not all students answer all of the questions, the total count of students by gender (and less frequently, students by ethnicity) may be less than the reported total students.
Comparisons between the number of students completing the survey and the student enrollment in your communi-ty and the state are shown on Table 2. The total percent-age of students completing the survey and the percentage from each grade are shown in the “Percent” column.
When using the information in this report, please pay attention to the number of students who participated from your community. If 60% or more of the students participated, the report is a good indicator of the levels of substance use, risk, protection, and antisocial behavior. If fewer than 60% participated, consult with your local prevention coordinator or a survey professional before generalizing the results to the entire community.
Coordination and administration of the Louisiana CCYS was a collaborative effort of Department of Health and Hospitals, Office of Behavioral Health (OBH), Addictive Disorders Services; Regional Prevention Coordinators; Department of Education; Cecil J. Picard Center for Child Development and Lifelong Learning, University of Louisiana at Lafayette; and Bach Harrison, L.L.C. For more information about the CCYS or prevention services in Louisiana, please refer to the Contacts for Prevention section at the end of this report.
Introduction
Table 2. Survey Completion Rate
Number Surveyed
Number Enrolled*
Percent Number Surveyed
Number Enrolled*
Percent
Grade 6 5,131 6,630 77.0 27,132 52,311 51.9
8 4,744 6,601 72.0 26,389 52,835 49.9
10 3,325 6,191 54.0 22,363 49,469 45.2
12 2,326 5,203 45.0 16,721 40,610 41.2 blank Total 15,526 24,625 63.0 92,605 195,225 47.4
Region 2014 State 2014
Table 1. Characteristics of Participants Number Percent Number Percent Number Percent Number Percent
6 4,680 35.2 4,763 32.7 5,131 33.0 27,132 29.3
8 4,165 31.3 4,260 29.3 4,744 30.6 26,389 28.5
10 2,405 18.1 3,258 22.4 3,325 21.4 22,363 24.1
12 2,040 15.3 2,279 15.7 2,326 15.0 16,721 18.1
Male 6,164 47.6 6,676 47.4 7,317 48.4 43,481 48.1
Female 6,773 52.4 7,406 52.6 7,790 51.6 46,956 51.9
African American 5,904 41.9 6,380 41.1 7,602 43.9 37,766 36.5
American Indian 601 4.3 746 4.8 815 4.7 4,017 3.9
Asian 258 1.8 339 2.2 346 2.0 2,483 2.4
Hispanic or Latino 596 4.2 667 4.3 754 4.4 5,865 5.7
Pacific Islander 105 0.7 231 1.5 143 0.8 918 0.9
White 6,161 43.7 6,629 42.7 7,050 40.7 48,196 46.6
Other 468 3.3 527 3.4 595 3.4 4,280 4.1
Ethnicity*
Region 2010 Region 2012 Region 2014 State 2014
Grade
Gender
5
The Risk and Protective Factor Model of Prevention
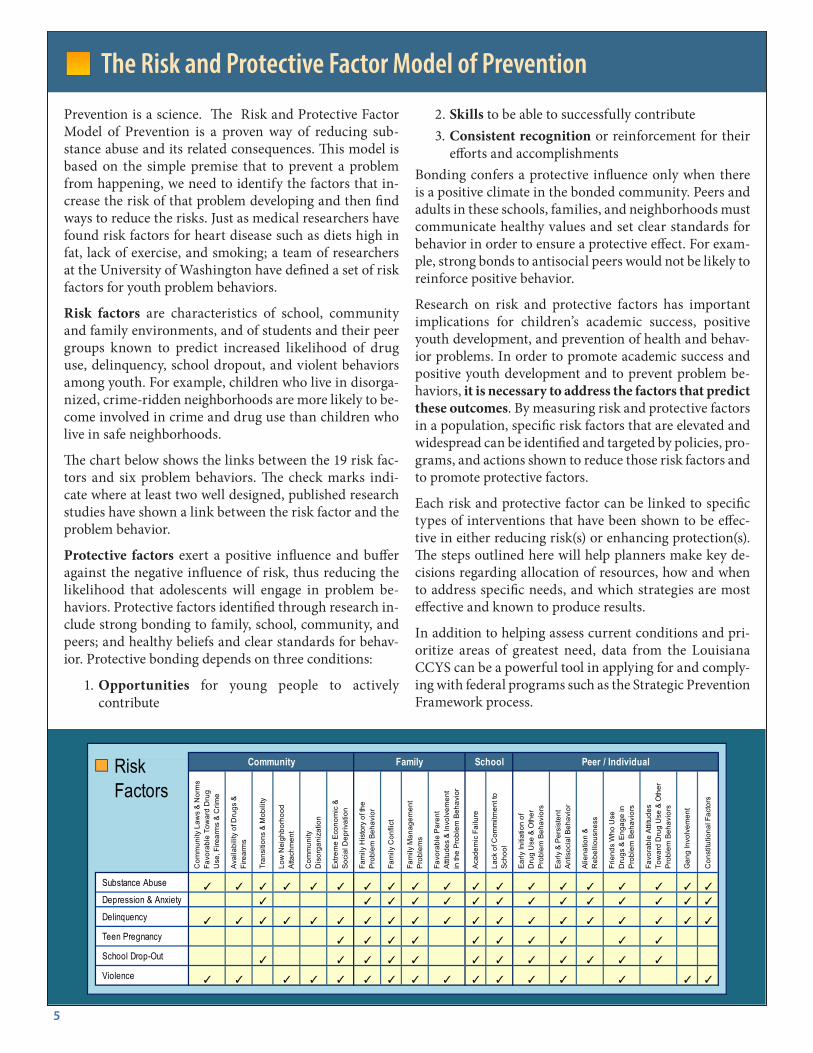
2. Skills to be able to successfully contribute3. Consistent recognition or reinforcement for their
efforts and accomplishmentsBonding confers a protective influence only when there is a positive climate in the bonded community. Peers and adults in these schools, families, and neighborhoods must communicate healthy values and set clear standards for behavior in order to ensure a protective effect. For exam-ple, strong bonds to antisocial peers would not be likely to reinforce positive behavior.
Research on risk and protective factors has important implications for children’s academic success, positive youth development, and prevention of health and behav-ior problems. In order to promote academic success and positive youth development and to prevent problem be-haviors, it is necessary to address the factors that predict these outcomes. By measuring risk and protective factors in a population, specific risk factors that are elevated and widespread can be identified and targeted by policies, pro-grams, and actions shown to reduce those risk factors and to promote protective factors.
Each risk and protective factor can be linked to specific types of interventions that have been shown to be effec-tive in either reducing risk(s) or enhancing protection(s). The steps outlined here will help planners make key de-cisions regarding allocation of resources, how and when to address specific needs, and which strategies are most effective and known to produce results.
In addition to helping assess current conditions and pri-oritize areas of greatest need, data from the Louisiana CCYS can be a powerful tool in applying for and comply-ing with federal programs such as the Strategic Prevention Framework process.
Prevention is a science. The Risk and Protective Factor Model of Prevention is a proven way of reducing sub-stance abuse and its related consequences. This model is based on the simple premise that to prevent a problem from happening, we need to identify the factors that in-crease the risk of that problem developing and then find ways to reduce the risks. Just as medical researchers have found risk factors for heart disease such as diets high in fat, lack of exercise, and smoking; a team of researchers at the University of Washington have defined a set of risk factors for youth problem behaviors.
Risk factors are characteristics of school, community and family environments, and of students and their peer groups known to predict increased likelihood of drug use, delinquency, school dropout, and violent behaviors among youth. For example, children who live in disorga-nized, crime-ridden neighborhoods are more likely to be-come involved in crime and drug use than children who live in safe neighborhoods.
The chart below shows the links between the 19 risk fac-tors and six problem behaviors. The check marks indi-cate where at least two well designed, published research studies have shown a link between the risk factor and the problem behavior.
Protective factors exert a positive influence and buffer against the negative influence of risk, thus reducing the likelihood that adolescents will engage in problem be-haviors. Protective factors identified through research in-clude strong bonding to family, school, community, and peers; and healthy beliefs and clear standards for behav-ior. Protective bonding depends on three conditions:
1. Opportunities for young people to actively contribute
Risk Factors
Fav
orab
le P
aren
t A
ttitu
des
& In
volv
emen
t in
the
Pro
blem
Beh
avio
r
Community Peer / IndividualSchoolFamily
Com
mun
ity L
aws
& N
orm
s F
avor
able
Tow
ard
Dru
g U
se, F
irear
ms
& C
rime
Con
stitu
tiona
l Fac
tors
Gan
g In
volv
emen
t
Fav
orab
le A
ttitu
des
Tow
ard
Dru
g U
se &
Oth
er P
robl
em B
ehav
iors
Lac
k of
Com
mitm
ent t
o S
choo
l
Aca
dem
ic F
ailu
re
Com
mun
ity D
isor
gani
zatio
n
Low
Nei
ghbo
rhoo
d A
ttach
men
t
Frie
nds
Who
Use
Dru
gs &
Eng
age
in P
robl
em B
ehav
iors
Alie
natio
n &
Reb
ellio
usne
ss
Ear
ly &
Per
sist
ent
Ant
isoc
ial B
ehav
ior
Ear
ly In
itiat
ion
of D
rug
Use
& O
ther
Pro
blem
Beh
avio
rs
Tra
nsiti
ons
& M
obili
ty
Ava
ilabi
lity
of D
rugs
& F
irear
ms
Fam
ily M
anag
emen
t P
robl
ems
Fam
ily C
onfli
ct
Fam
ily H
isto
ry o
f the
Pro
blem
Beh
avio
r
Ext
rem
e E
cono
mic
& S
ocia
l Dep
rivat
ion
School Drop-Out
Violence
Substance Abuse
Delinquency
Teen Pregnancy
Depression & Anxiety
6
Why conduct the Louisiana Caring Communities Youth Survey? Data from the CCYS are important for building an understanding of the substance use priorities in your community, and can help your community develop a data driven strategic prevention plan to address the areas of greatest need. The Substance Abuse and Mental Health Services Administration (SAMHSA) Center for Substance Abuse Prevention (CSAP) has emphasized data driven strategic planning guidelines using the Risk and Protective Factor Model, and more recently, the Strategic Prevention Framework (SPF) Model through incentive grants provid-ed to states. These two planning models share much in common and utilize many of the same planning steps and tasks. Specifically, both planning models advocate the col-lection and use of data to identify needs, resources and community capacity. Based on these data, communities can establish substance abuse prevention priorities to be addressed. Next, both models encourage the implementa-tion of strategically chosen evidence-based programs and interventions to address the identified priorities. Finally, the two models promote the collection of evaluation data to ensure the desired outcomes are achieved. An overview of the basic planning steps and tasks for both the Risk and Protective Factor Model and SPF Model is provided below.1
Step 1: Profile Population Needs, Resources, and Readiness to Address the Problems and Gaps in Service Delivery
• Community Needs Assessment: While planning prevention services, communities need to understand the factors that cause substance use and abuse in their community. Communities are urged to collect and use multiple data sources, including archival and social indicators, assessment of existing resources, key informant interviews, as well as survey data in order to establish prevention priorities for their community. CSAP encourages states to consider administering a survey to assess adolescent substance use, anti-social behavior, and many of the risk and protective factors that predict adolescent problem behaviors. The results of the CCYS (presented in this Profile Report and in results reported at the State level) are particularly useful in helping to identify the prevention needs in your community.
• Community Resource Assessment: It is likely that existing agencies and programs are already addressing some of the prioritized risk and protective factors. It is important to identify the assets and resources already available in the community and any gaps in services and capacity.
• Community Readiness Assessment: It is very important for states and communities to have the commitment and support of their members and ample resources to implement effective prevention efforts. Therefore, the readiness and capacity of communities and resources to act should also be assessed.
Step 2: Mobilize and/or Build Capacity to Address Needs: Engagement of key stakeholders at the State and community levels is critical to plan and implement suc-cessful prevention activities that will be sustained over time. Some of the key tasks to mobilize the state and communities are to work with leaders and stakeholders to build coalitions, provide training, leverage resources, and help sustain prevention activities.
Step 3: Develop a Comprehensive Strategic Plan: States and communities should develop a strategic plan that ar-ticulates not only a vision for the prevention activities, but also strategies for organizing and implementing preven-tion efforts. The strategic plan should be based on docu-mented needs, build on identified resources/strengths, set measurable objectives, and identify how progress will be monitored. Plans should be adjusted with ongoing needs assessment and monitoring activities. The issue of sus-tainability should be kept in mind throughout each step of planning and implementation.
Step 4: Implement Evidence-based Prevention Programs and Infrastructure Development Activities: By understanding risk and protective factors in a popu-lation, as well as other causal factors at work in the com-munity, prevention programs can be implemented that will reduce the most influential causes of substance abuse in your community. For example, if academic failure is identified as a prioritized risk factor in a community, then mentoring, tutoring, and increased opportunities and re-wards for classroom participation can be provided to im-prove academic performance. After completing Steps 1, 2, and 3, communities will be able to choose prevention programs that fit the Strategic Framework of the commu-nity, match the population served, and are scientifically proven to work.
Step 5: Monitor Process, Evaluate Effectiveness, Sustain Effective Programs/Activities, and Improve or Replace Those That Fail: Finally, ongoing monitoring and evalua-tion are essential to determine if the outcomes desired are achieved and to assess program effectiveness, assess ser-vice delivery quality, identify successes, encourage needed improvement, and promote sustainability of effective pol-icies, programs, and practices. 1 ADAPTED FROM CSAP’S STRATEGIC PREVENTION FRAMEWORK STATE INCENTIVE
GRANTS REQUEST FOR APPLICATION (2010)
Data-Driven Strategic Planning: Risk and Protective Factor Model
7
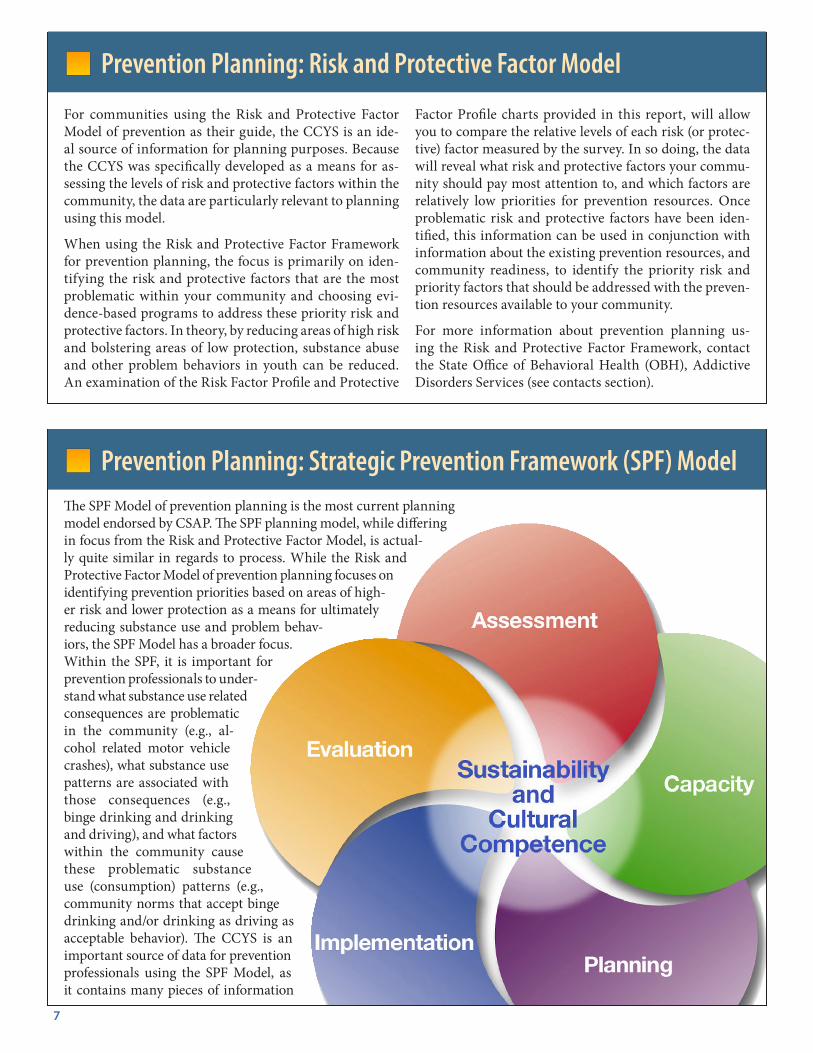
Prevention Planning: Strategic Prevention Framework (SPF) ModelThe SPF Model of prevention planning is the most current planning model endorsed by CSAP. The SPF planning model, while differing in focus from the Risk and Protective Factor Model, is actual-ly quite similar in regards to process. While the Risk and Protective Factor Model of prevention planning focuses on identifying prevention priorities based on areas of high-er risk and lower protection as a means for ultimately reducing substance use and problem behav-iors, the SPF Model has a broader focus. Within the SPF, it is important for prevention professionals to under-stand what substance use related consequences are problematic in the community (e.g., al-cohol related motor vehicle crashes), what substance use patterns are associated with those consequences (e.g., binge drinking and drinking and driving), and what factors within the community cause these problematic substance use (consumption) patterns (e.g., community norms that accept binge drinking and/or drinking as driving as acceptable behavior). The CCYS is an important source of data for prevention professionals using the SPF Model, as it contains many pieces of information
For communities using the Risk and Protective Factor Model of prevention as their guide, the CCYS is an ide-al source of information for planning purposes. Because the CCYS was specifically developed as a means for as-sessing the levels of risk and protective factors within the community, the data are particularly relevant to planning using this model.
When using the Risk and Protective Factor Framework for prevention planning, the focus is primarily on iden-tifying the risk and protective factors that are the most problematic within your community and choosing evi-dence-based programs to address these priority risk and protective factors. In theory, by reducing areas of high risk and bolstering areas of low protection, substance abuse and other problem behaviors in youth can be reduced. An examination of the Risk Factor Profile and Protective
Factor Profile charts provided in this report, will allow you to compare the relative levels of each risk (or protec-tive) factor measured by the survey. In so doing, the data will reveal what risk and protective factors your commu-nity should pay most attention to, and which factors are relatively low priorities for prevention resources. Once problematic risk and protective factors have been iden-tified, this information can be used in conjunction with information about the existing prevention resources, and community readiness, to identify the priority risk and priority factors that should be addressed with the preven-tion resources available to your community.
For more information about prevention planning us-ing the Risk and Protective Factor Framework, contact the State Office of Behavioral Health (OBH), Addictive Disorders Services (see contacts section).
Prevention Planning: Risk and Protective Factor Model
8
Prevention Planning: SPF Model (cont’d)
regarding substance use and the causal factors that predict substance use. However, as a result of the broad focus of the SPF, it is highly recommended that prevention profes-sionals using the SPF Model for prevention planning obtain other sources of data in addition to the CCYS in develop-ing a strategic plan for their community. In particular, the CCYS has limited data regarding substance use conse-quences within the community, therefore prevention staff are encouraged to seek consequence related data from both local (e.g., local law enforcement) and state sources (e.g., the State Epidemiological Workgroup).
Among the CCYS data that prevention professionals are likely to find useful in their SPF needs assessment process are substance use trends among youth, and risk and protec-tive factor data relevant to the substance use consequenc-es and consumption patterns identified as problematic in the community. While not all of the risk and protective factors within the Risk and Protective Factor Model are likely to be relevant to your community’s substance use
consumption and consequence priorities, many likely will be useful for planning purposes. Prevention professionals should closely examine the risk and protective factor data available through CCYS to determine which are relevant to understanding the causal influences that lead to the specific substance use consequence priorities in their community.
Additionally, several items have been added to the CCYS to better identify causal factors related to problematic al-cohol consumption because the Louisiana State SPF SIG Strategic Plan identified alcohol consumption and conse-quences as the highest priorities for the state overall. These additional items were added to the CCYS in order to aid those communities identified as alcohol problem hot spots through the state needs assessment process. However, given that alcohol is by far the most widely consumed substance across the entire state, these data should be helpful for other communities that experience high levels of alcohol use and consequences. Data for these items can be found in Table 10 of this report.
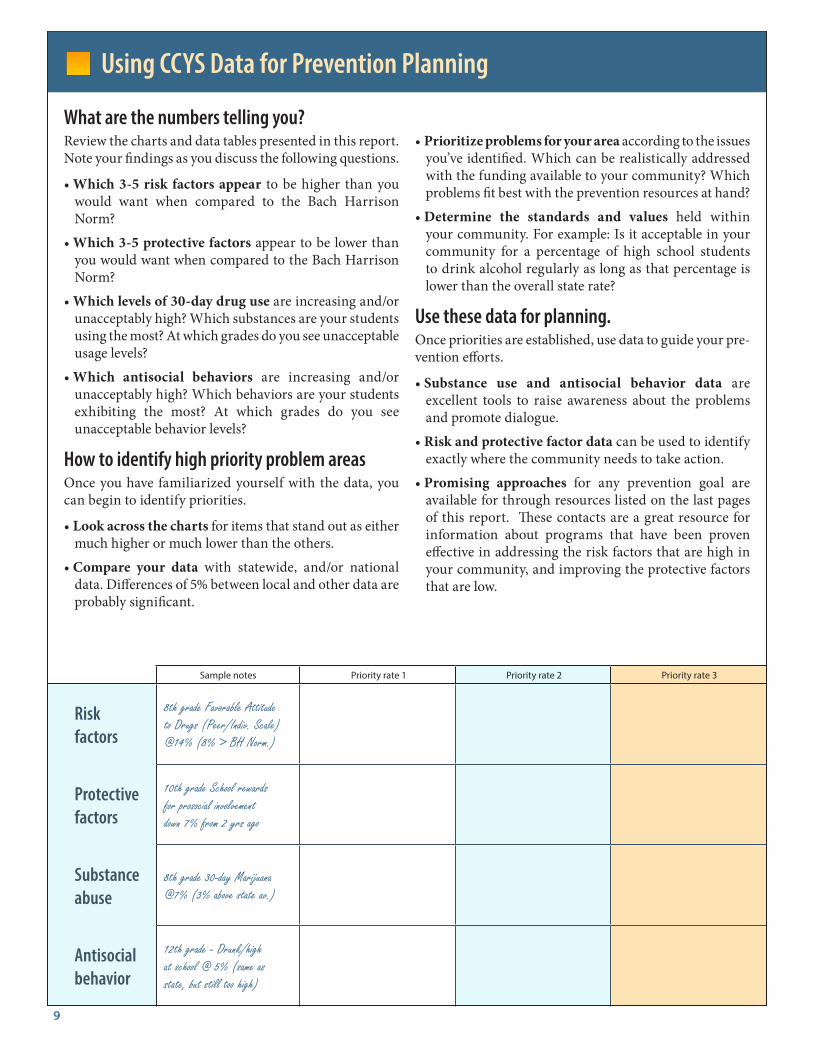
Sample notes Priority rate 1 Priority rate 2 Priority rate 3
Risk factors
8th grade Favorable Attitude to Drugs (Peer/Indiv. Scale) @14% (8% > BH Norm.)
Protective factors
10th grade School rewards for prosocial involvement down 7% from 2 yrs ago
Substance abuse
8th grade 30-day Marijuana @7% (3% above state av.)
Antisocial behavior
12th grade - Drunk/high at school @ 5% (same as state, but still too high)
9
What are the numbers telling you?Review the charts and data tables presented in this report. Note your findings as you discuss the following questions.
• Which 3-5 risk factors appear to be higher than you would want when compared to the Bach Harrison Norm?
• Which 3-5 protective factors appear to be lower than you would want when compared to the Bach Harrison Norm?
• Which levels of 30-day drug use are increasing and/or unacceptably high? Which substances are your students using the most? At which grades do you see unacceptable usage levels?
• Which antisocial behaviors are increasing and/or unacceptably high? Which behaviors are your students exhibiting the most? At which grades do you see unacceptable behavior levels?
How to identify high priority problem areasOnce you have familiarized yourself with the data, you can begin to identify priorities.
• Look across the charts for items that stand out as either much higher or much lower than the others.
• Compare your data with statewide, and/or national data. Differences of 5% between local and other data are probably significant.
• Prioritize problems for your area according to the issues you’ve identified. Which can be realistically addressed with the funding available to your community? Which problems fit best with the prevention resources at hand?
• Determine the standards and values held within your community. For example: Is it acceptable in your community for a percentage of high school students to drink alcohol regularly as long as that percentage is lower than the overall state rate?
Use these data for planning.Once priorities are established, use data to guide your pre-vention efforts.
• Substance use and antisocial behavior data are excellent tools to raise awareness about the problems and promote dialogue.
• Risk and protective factor data can be used to identify exactly where the community needs to take action.
• Promising approaches for any prevention goal are available for through resources listed on the last pages of this report. These contacts are a great resource for information about programs that have been proven effective in addressing the risk factors that are high in your community, and improving the protective factors that are low.
Using CCYS Data for Prevention Planning
10
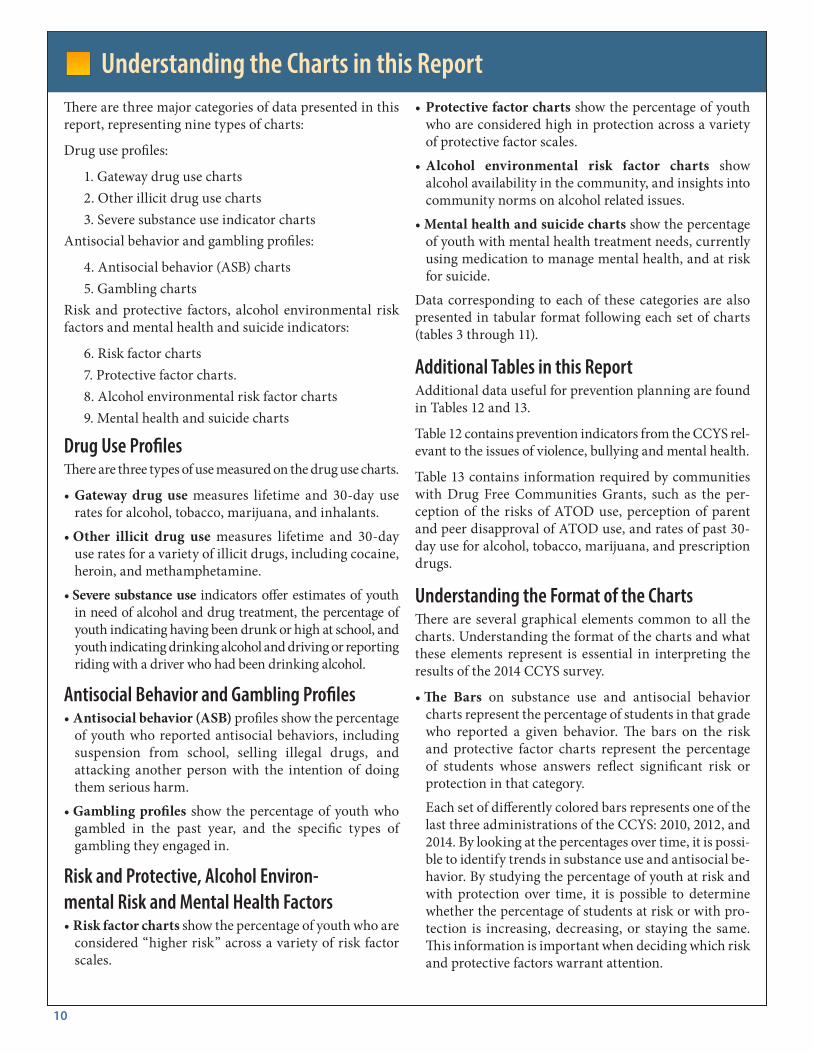
Understanding the Charts in this Report• Protective factor charts show the percentage of youth
who are considered high in protection across a variety of protective factor scales.
• Alcohol environmental risk factor charts show alcohol availability in the community, and insights into community norms on alcohol related issues.
• Mental health and suicide charts show the percentage of youth with mental health treatment needs, currently using medication to manage mental health, and at risk for suicide.
Data corresponding to each of these categories are also presented in tabular format following each set of charts (tables 3 through 11).
Additional Tables in this ReportAdditional data useful for prevention planning are found in Tables 12 and 13.
Table 12 contains prevention indicators from the CCYS rel-evant to the issues of violence, bullying and mental health.
Table 13 contains information required by communities with Drug Free Communities Grants, such as the per-ception of the risks of ATOD use, perception of parent and peer disapproval of ATOD use, and rates of past 30-day use for alcohol, tobacco, marijuana, and prescription drugs.
Understanding the Format of the ChartsThere are several graphical elements common to all the charts. Understanding the format of the charts and what these elements represent is essential in interpreting the results of the 2014 CCYS survey.
• The Bars on substance use and antisocial behavior charts represent the percentage of students in that grade who reported a given behavior. The bars on the risk and protective factor charts represent the percentage of students whose answers reflect significant risk or protection in that category.
Each set of differently colored bars represents one of the last three administrations of the CCYS: 2010, 2012, and 2014. By looking at the percentages over time, it is possi-ble to identify trends in substance use and antisocial be-havior. By studying the percentage of youth at risk and with protection over time, it is possible to determine whether the percentage of students at risk or with pro-tection is increasing, decreasing, or staying the same. This information is important when deciding which risk and protective factors warrant attention.
There are three major categories of data presented in this report, representing nine types of charts:
Drug use profiles:
1. Gateway drug use charts 2. Other illicit drug use charts3. Severe substance use indicator charts
Antisocial behavior and gambling profiles:
4. Antisocial behavior (ASB) charts5. Gambling charts
Risk and protective factors, alcohol environmental risk factors and mental health and suicide indicators:
6. Risk factor charts 7. Protective factor charts. 8. Alcohol environmental risk factor charts9. Mental health and suicide charts
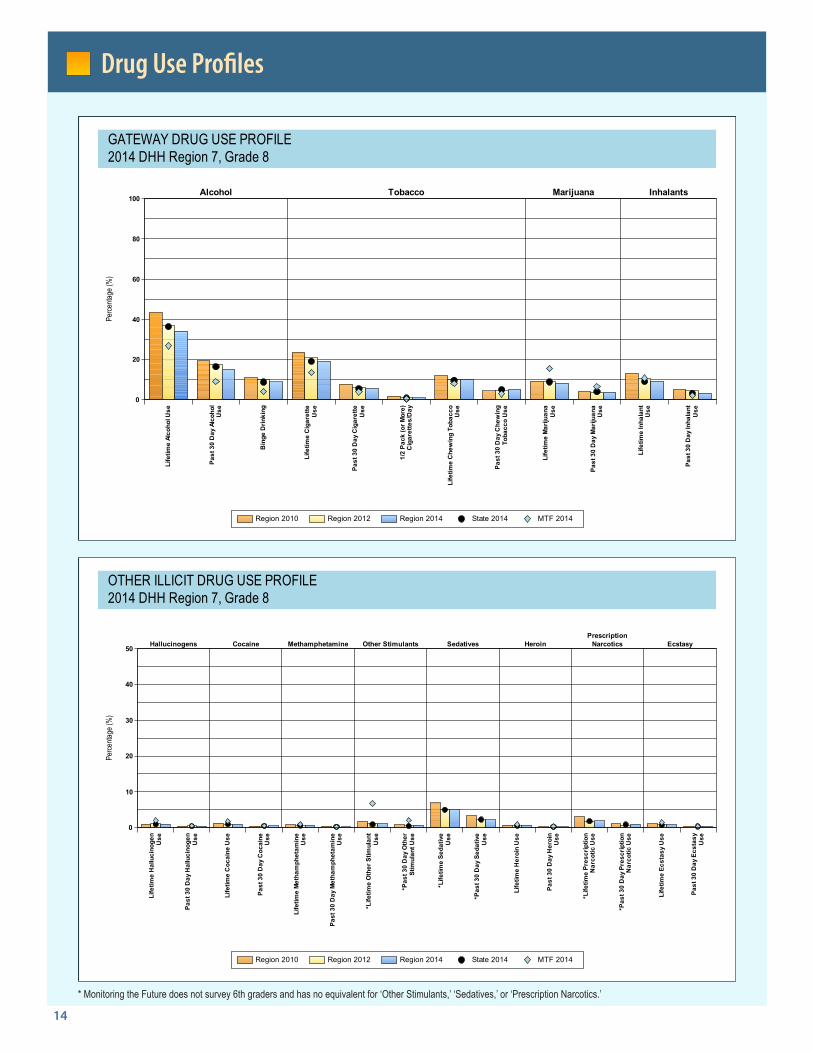
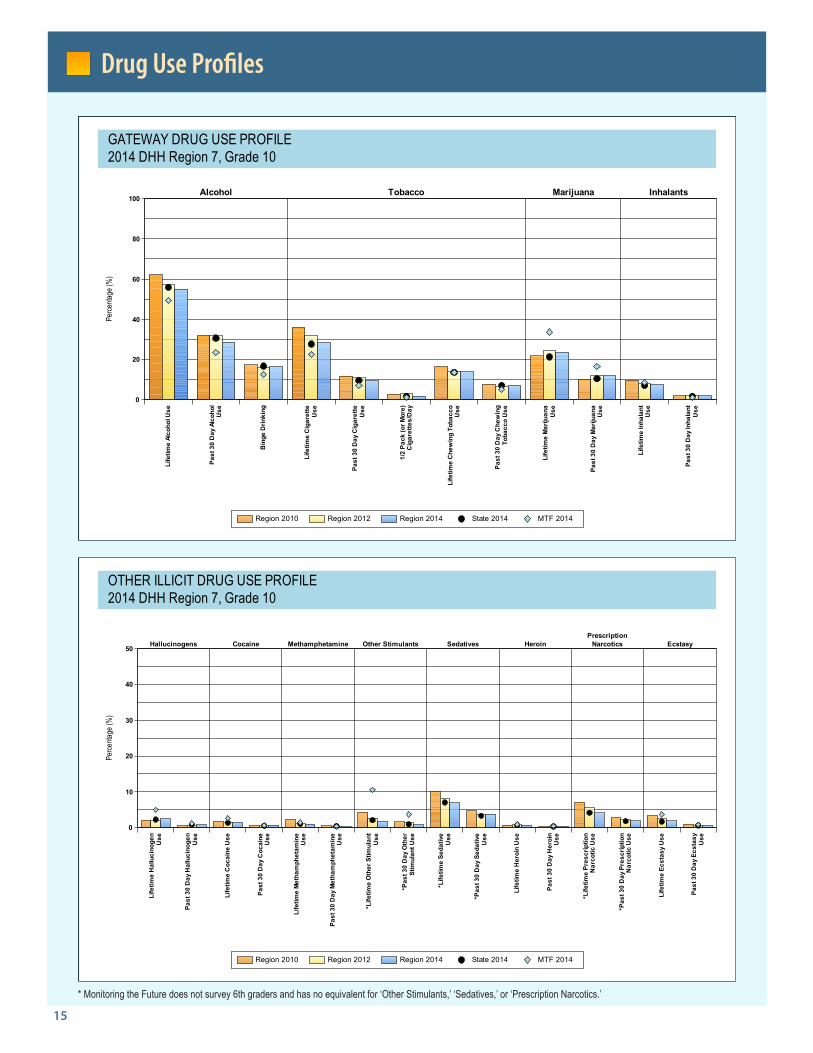
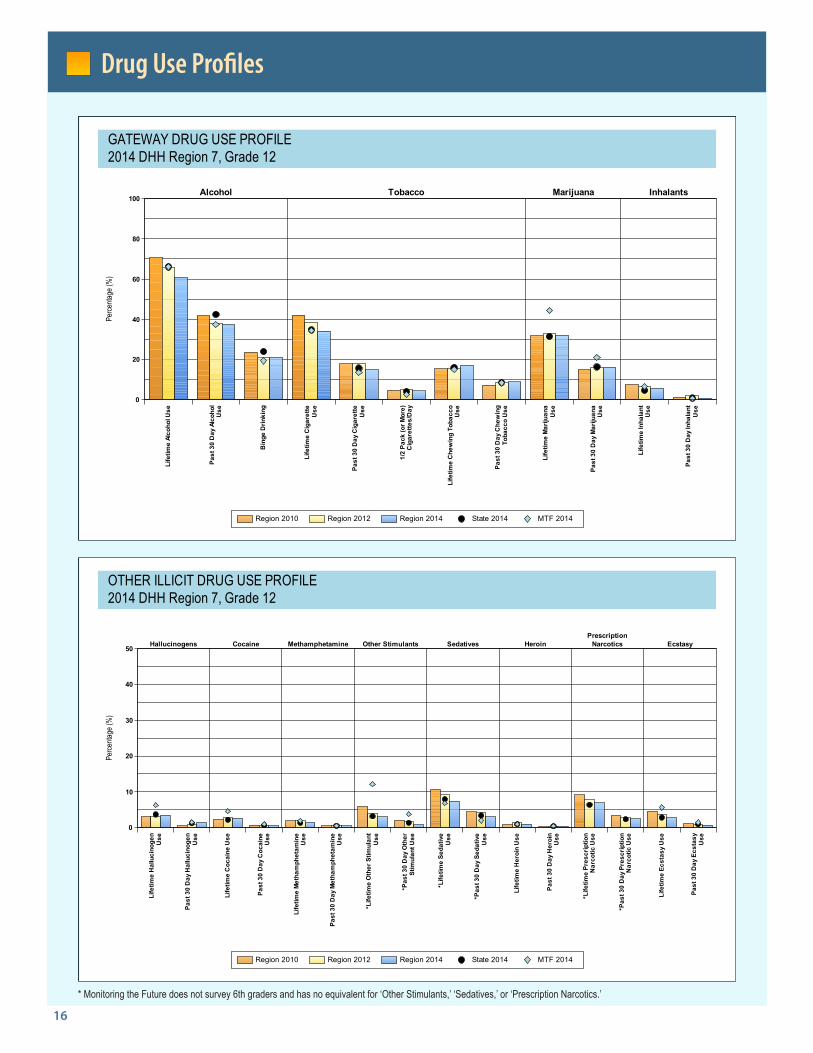
Drug Use ProfilesThere are three types of use measured on the drug use charts.
• Gateway drug use measures lifetime and 30-day use rates for alcohol, tobacco, marijuana, and inhalants.
• Other illicit drug use measures lifetime and 30-day use rates for a variety of illicit drugs, including cocaine, heroin, and methamphetamine.
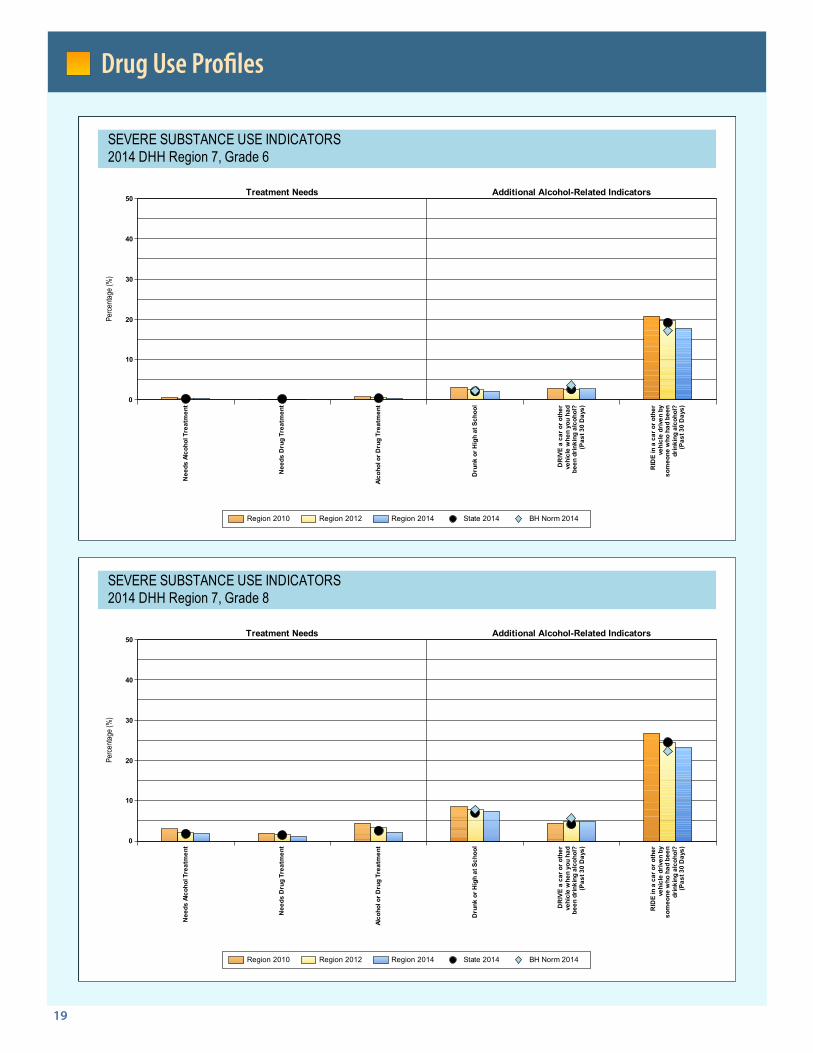
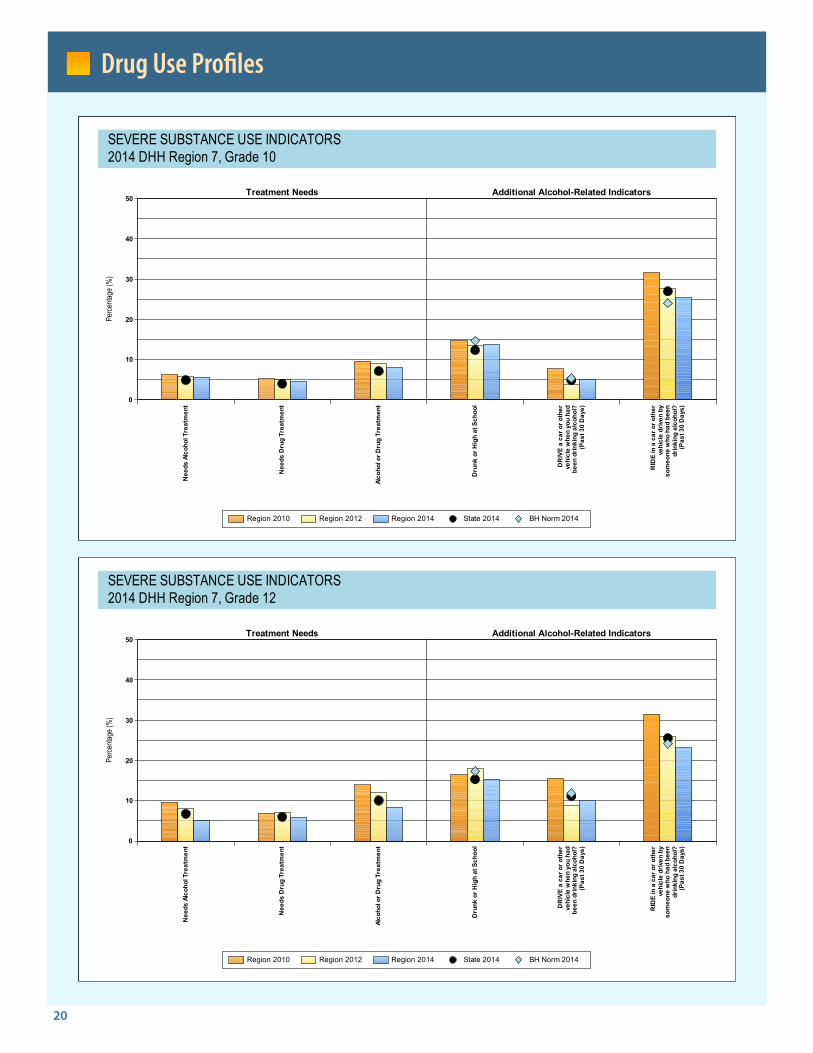
• Severe substance use indicators offer estimates of youth in need of alcohol and drug treatment, the percentage of youth indicating having been drunk or high at school, and youth indicating drinking alcohol and driving or reporting riding with a driver who had been drinking alcohol.
Antisocial Behavior and Gambling Profiles• Antisocial behavior (ASB) profiles show the percentage
of youth who reported antisocial behaviors, including suspension from school, selling illegal drugs, and attacking another person with the intention of doing them serious harm.
• Gambling profiles show the percentage of youth who gambled in the past year, and the specific types of gambling they engaged in.
Risk and Protective, Alcohol Environ-mental Risk and Mental Health Factors • Risk factor charts show the percentage of youth who are
considered “higher risk” across a variety of risk factor scales.
11
Understanding the Charts in this Report (cont’d)
460,000 students. The results were weighted to make the contribution of each state and region proportional to its share of the national population. Bach Harrison ana-lysts then calculated rates for antisocial behavior and for students at risk and with protection. The results appear on the charts as BH Norm. In order to keep the Bach Harrison Norm relevant, it is updated approximately every two years as new data become available.
A comparison to state-wide and national results pro-vides additional information for your community in determining the relative importance of levels of alcohol, tobacco and other drug (ATOD) use, antisocial behavior, risk, and protection. Information about other students in the state and the nation can be helpful in determin-ing the seriousness of a given level of problem behavior. Scanning across the charts, it is important to observe the factors that differ the most from the Bach Harrison Norm. This is the first step in identifying the levels of risk and protection that are higher or lower than those in other communities. The risk factors that are higher than the Bach Harrison Norm and the protective fac-tors that are lower than the Bach Harrison Norm are probably the factors your community should consider addressing when planning prevention programs.
• Dots and Diamonds provide points of comparison to larger samples. The dots on the charts represent the percentage of all of the youth surveyed across Louisiana who reported substance use, problem behavior, elevated risk, or elevated protection.
For the 2014 CCYS Survey, there were 92,605 partici-pants in grades 6, 8, 10, and 12, out of 195,225 enrolled, a participation rate of 47.4%. The fact that over 90,000 students across the state participated in the CCYS make the state dot a good estimate of the rates of ATOD use and levels of risk and protective factors of youth in Louisiana. The survey results provide considerable in-formation for communities to use in planning preven-tion services.
The diamonds represent national data from either the Monitoring the Future (MTF) Survey or the Bach Harrison Norm. The Bach Harrison Norm was devel-oped by Bach Harrison L.L.C. to provide states and communities with the ability to compare their results on risk, protection, and antisocial measures with more national measures. Survey participants from eight state-wide surveys and five large regional surveys across the nation were combined into a database of approximately
12
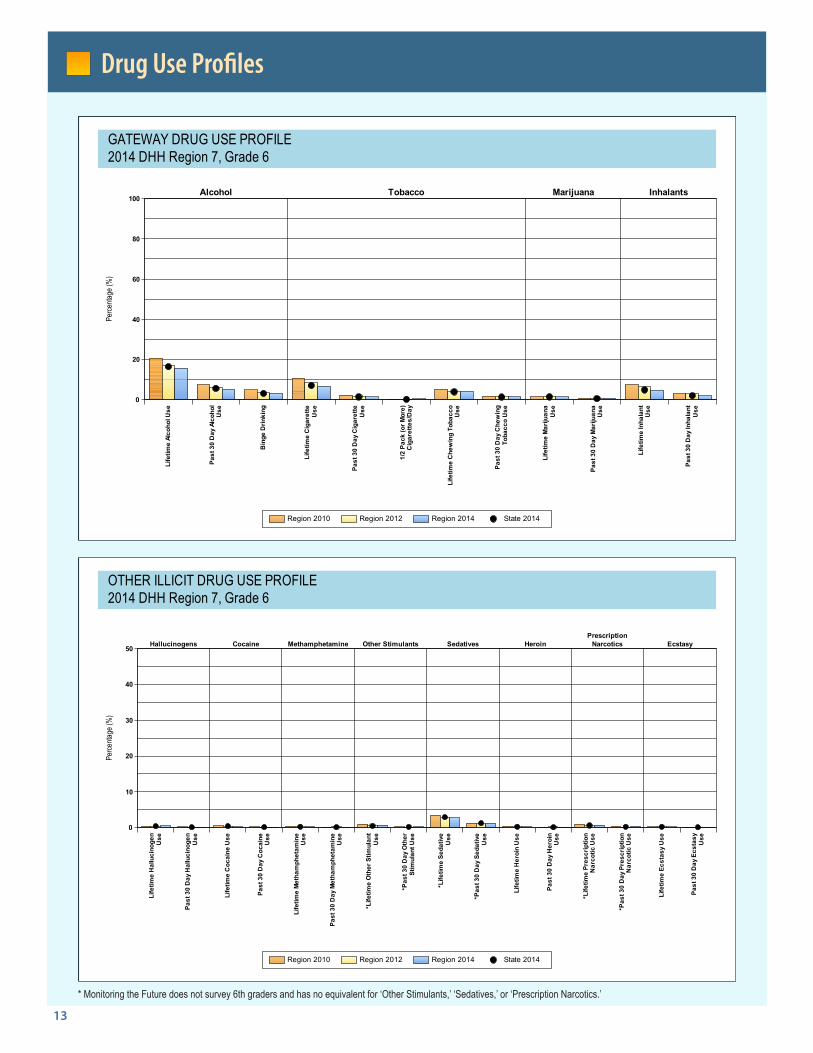
The charts and tables that follow present the substance use rates for your community for 6th, 8th, 10th and 12th grade students who completed the survey. The first set of substance use charts cover the “Gateway Drugs” most commonly used by youth (alcohol, tobacco, marijuana and inhalants). The second set of substance use charts include a variety of important, but less commonly used illicit drugs such as cocaine, heroin, methamphetamine, and prescription narcotics. Finally, the last set of sub-stance use charts present indicators of severe (or extreme-ly dangerous) substance use, including the youth in need of substance abuse treatment, the percentage indicating they used substances in school, and students involved in drinking and driving.
Each chart represents students from a single grade. The bars on each chart represent the percentage of students in the indicated sample (e.g. school, parish, or region) report-ing substance use, and related behaviors or perceptions. The dots on the charts represent the same data for all students of that grade surveyed in the state of Louisiana. The diamonds represent national data included to allow a comparison of your data to a national sample of students, either the Monitoring the Future (MTF) Survey (lifetime use and 30-day use), or the Bach Harrison Norm (heavy use and severe substance use). The Bach Harrison Norm is available for grades 6 through 12 while MTF only surveys grades 8, 10, and 12.
A comparison to state and national results provides addi-tional information for your community in determining the relative importance of levels of ATOD use. Information about other students in the region and the nation can be helpful in determining the seriousness of a given level of problem behavior. Scanning across the charts will help you gain a better understanding of the substance use (consumption) issues affecting your community.
The following definitions and descriptions provide in-formation for the substance use and severe substance use charts that follow.
• Lifetime use is a measure of the percentage of students who tried the particular substance at least once in their lifetime and is used to show the percentage of students who have had experience with a particular substance.
• 30-day use is a measure of the percentage of students who used the substance at least once in the 30 days prior to taking the survey and is a more sensitive indicator of the level of current use of the substance.
• Heavy use includes binge drinking (having five or more drinks in a row during the two weeks prior to the survey) and smoking one-half a pack or more of cigarettes per day.
• Severe Substance Use indicators include student responses regarding drinking alcohol and driving, riding with a drinking driver, being drunk or high at school, and the need for substance abuse treatment (alcohol, drug, and the total in need of any treatment -alcohol or drug).
The need for treatment is defined as students who have used alcohol or drugs on 10 or more occasions in their lifetime and marked at least three of the following items specific to their drug or alcohol use in the past year:
◦ Spent more time using than intended;
◦ Neglected some of your usual responsibilities because of use
◦ Wanted to cut down on use
◦ Others objected to your use
◦ Frequently thought about using
◦ Used alcohol or drugs to relieve feelings such as sadness, anger, or boredom
Students could mark whether these items related to their drug use and/or their alcohol use.
Drug Use Profiles
Charts and Tables in this Report:
Gateway Drug Use, Other Illicit Drug Use, Severe Substance Use Indicators
13
Drug Use Profiles
0
10
20
30
40
50
Perce
ntage
(%)
Hallucinogens Cocaine Methamphetamine Other Stimulants Sedatives HeroinPrescription
Narcotics Ecstasy
Life
time
Hal
luci
noge
nU
se
Past
30
Day
Hal
luci
noge
nU
se
Life
time
Coc
aine
Use
Past
30
Day
Coc
aine
Use
Life
time
Met
ham
phet
amin
eU
se
Past
30
Day
Met
ham
phet
amin
eU
se
*Life
time
Oth
er S
timul
ant
Use
*Pas
t 30
Day
Oth
erSt
imul
ant U
se
* Life
time
S eda
tive
Use
*Pas
t 30
Day
Sed
a tiv
eU
se
Life
time
Her
oin
Use
Past
30
Da y
He r
oin
Us e
*Life
time
Pres
crip
tion
Nar
cot ic
Use
*Pas
t 30
Day
Pre
scrip
tion
Nar
cotic
Use
Life
time
Ecst
asy
Use
Past
30
Day
Ecs
tasy
Us e
Region 2010 Region 2012 Region 2014 State 2014
OTHER ILLICIT DRUG USE PROFILE 2014 DHH Region 7, Grade 6
0
20
40
60
80
100
Perce
ntage
(%)
Alcohol Tobacco Marijuana Inhalants
Life
time
Alco
hol U
se
Past
30
Day
Alc
ohol
Use
Bin
ge D
rinki
ng
Life
t ime
Ci g
aret
teU
se
Past
30
Da y
Cig
aret
t eU
se
1/2
Pack
(or M
ore)
Cig
aret
tes/
Day
Life
time
Che
win
g To
bacc
oU
se
Past
30
Day
Che
win
gTo
bacc
o U
se
Life
time
Mar
ijuan
aU
se
Past
30
Day
Mar
ijuan
aU
se
Life
time
Inha
lant
Use
Past
30
Day
Inha
lant
Use
Region 2010 Region 2012 Region 2014 State 2014
GATEWAY DRUG USE PROFILE 2014 DHH Region 7, Grade 6
* Monitoring the Future does not survey 6th graders and has no equivalent for ‘Other Stimulants,’ ‘Sedatives,’ or ‘Prescription Narcotics.’
14
Drug Use Profiles
0
10
20
30
40
50
Perce
ntage
(%)
Hallucinogens Cocaine Methamphetamine Other Stimulants Sedatives HeroinPrescription
Narcotics Ecstasy
Life
time
Hal
luci
noge
nU
se
Past
30
Day
Hal
luci
noge
nU
se
Life
time
Coc
aine
Use
Past
30
Day
Coc
aine
Use
Life
time
Met
ham
phet
amin
eU
se
Past
30
Day
Met
ham
phet
amin
eU
se
*Life
time
Oth
er S
timul
ant
Use
*Pas
t 30
Day
Oth
erSt
imul
ant U
se
* Lif e
time
S eda
tive
Use
*Pas
t 30
Day
Sed
a tiv
eU
se
Life
time
Her
oin
Use
Past
30
Day
Her
oin
Use
*Life
time
Pres
crip
tion
Nar
cotic
Use
*Pas
t 30
Day
Pre
scrip
tion
Nar
cotic
Use
Life
time
Ecst
asy
Use
Past
30
Day
Ecs
tasy
Use
Region 2010 Region 2012 Region 2014 State 2014 MTF 2014
OTHER ILLICIT DRUG USE PROFILE 2014 DHH Region 7, Grade 8
0
20
40
60
80
100
Perce
ntage
(%)
Alcohol Tobacco Marijuana Inhalants
Life
time
Alco
hol U
se
Past
30
Day
Alc
ohol
Use
Bin
ge D
rinki
ng
Life
time
Cig
aret
teU
se
Past
30
Day
Cig
aret
teU
se
1/2
Pack
(or M
ore)
Cig
aret
tes/
Day
Life
time
Che
win
g To
bacc
oU
se
Past
30
Day
Che
win
gTo
bacc
o U
se
Life
time
Mar
ijuan
aU
se
Past
30
Day
Mar
ijuan
aU
se
Life
time
Inha
lant
Us e
Past
30
Day
Inha
lant
Use
Region 2010 Region 2012 Region 2014 State 2014 MTF 2014
GATEWAY DRUG USE PROFILE 2014 DHH Region 7, Grade 8
* Monitoring the Future does not survey 6th graders and has no equivalent for ‘Other Stimulants,’ ‘Sedatives,’ or ‘Prescription Narcotics.’
15
Drug Use Profiles
0
10
20
30
40
50
Perce
ntage
(%)
Hallucinogens Cocaine Methamphetamine Other Stimulants Sedatives HeroinPrescription
Narcotics Ecstasy
Life
time
Hal
luci
noge
nU
se
Past
30
Day
Hal
luci
noge
nU
se
Life
time
Coc
aine
Use
Past
30
Day
Coc
aine
Use
Life
time
Met
ham
phet
amin
eU
se
Past
30
Day
Met
ham
phet
amin
eU
se
*Life
time
Oth
er S
timul
ant
Use
*Pas
t 30
Day
Oth
erSt
imul
ant U
se
*Life
time
Seda
tive
Use
*Pas
t 30
Day
Sed
ativ
eU
se
Life
time
Her
oin
Use
Past
30
Day
Her
oin
Use
*Life
time
Pres
crip
tion
Nar
cotic
Use
*Pas
t 30
Day
Pre
scrip
tion
Nar
cotic
Use
Life
time
Ecst
asy
Use
Past
30
Day
Ecs
tasy
Use
Region 2010 Region 2012 Region 2014 State 2014 MTF 2014
OTHER ILLICIT DRUG USE PROFILE 2014 DHH Region 7, Grade 10
0
20
40
60
80
100
Perce
ntage
(%)
Alcohol Tobacco Marijuana Inhalants
Life
time
Alco
hol U
se
Past
30
Day
Alc
ohol
Use
Bin
ge D
rinki
ng
Life
time
Cig
aret
teU
se
Past
30
Day
Cig
aret
teU
se
1/2
Pack
(or M
ore)
Cig
aret
tes/
Day
Life
time
Che
win
g To
bacc
oU
se
Past
30
Day
Che
win
gTo
bacc
o U
se
Life
time
Mar
ijuan
aU
se
Past
30
Day
Mar
ijuan
aU
se
Life
time
Inha
lant
Us e
Past
30
Day
Inha
lant
Use
Region 2010 Region 2012 Region 2014 State 2014 MTF 2014
GATEWAY DRUG USE PROFILE 2014 DHH Region 7, Grade 10
* Monitoring the Future does not survey 6th graders and has no equivalent for ‘Other Stimulants,’ ‘Sedatives,’ or ‘Prescription Narcotics.’
16
Drug Use Profiles
0
10
20
30
40
50
Perce
ntage
(%)
Hallucinogens Cocaine Methamphetamine Other Stimulants Sedatives HeroinPrescription
Narcotics Ecstasy
Life
time
Hal
luci
noge
nU
se
Past
30
Day
Hal
luci
noge
nU
se
Life
time
Coc
aine
Use
Past
30
Day
Coc
aine
Use
Life
time
Met
ham
phet
amin
eU
se
Past
30
Day
Met
ham
phet
amin
eU
se
*Life
time
Oth
er S
timul
ant
Use
*Pas
t 30
Day
Oth
erSt
imul
ant U
se
*Life
time
Seda
tive
Use
*Pas
t 30
Day
Sed
ativ
eU
se
Life
time
Her
oin
Use
Past
30
Day
Her
oin
Use
*Life
time
Pres
crip
tion
Nar
cotic
Use
*Pas
t 30
Day
Pre
scrip
tion
Nar
cotic
Use
Life
time
Ecst
asy
Use
Past
30
Day
Ecs
tasy
Use
Region 2010 Region 2012 Region 2014 State 2014 MTF 2014
OTHER ILLICIT DRUG USE PROFILE 2014 DHH Region 7, Grade 12
0
20
40
60
80
100
Perce
ntage
(%)
Alcohol Tobacco Marijuana Inhalants
Life
time
Alco
hol U
se
Past
30
Day
Alc
ohol
Use
Bin
ge D
rinki
ng
Life
time
Cig
aret
teU
se
Past
30
Day
Cig
aret
teU
se
1/2
Pack
(or M
ore)
Cig
aret
tes/
Day
Life
time
Che
win
g To
bacc
oU
se
Past
30
Day
Che
win
gTo
bacc
o U
se
Life
time
Mar
ijuan
aU
se
Past
30
Day
Mar
ijuan
aU
se
Life
time
Inha
lant
Us e
Past
30
Day
Inha
lant
Use
Region 2010 Region 2012 Region 2014 State 2014 MTF 2014
GATEWAY DRUG USE PROFILE 2014 DHH Region 7, Grade 12
* Monitoring the Future does not survey 6th graders and has no equivalent for ‘Other Stimulants,’ ‘Sedatives,’ or ‘Prescription Narcotics.’
17
Drug Use Profiles
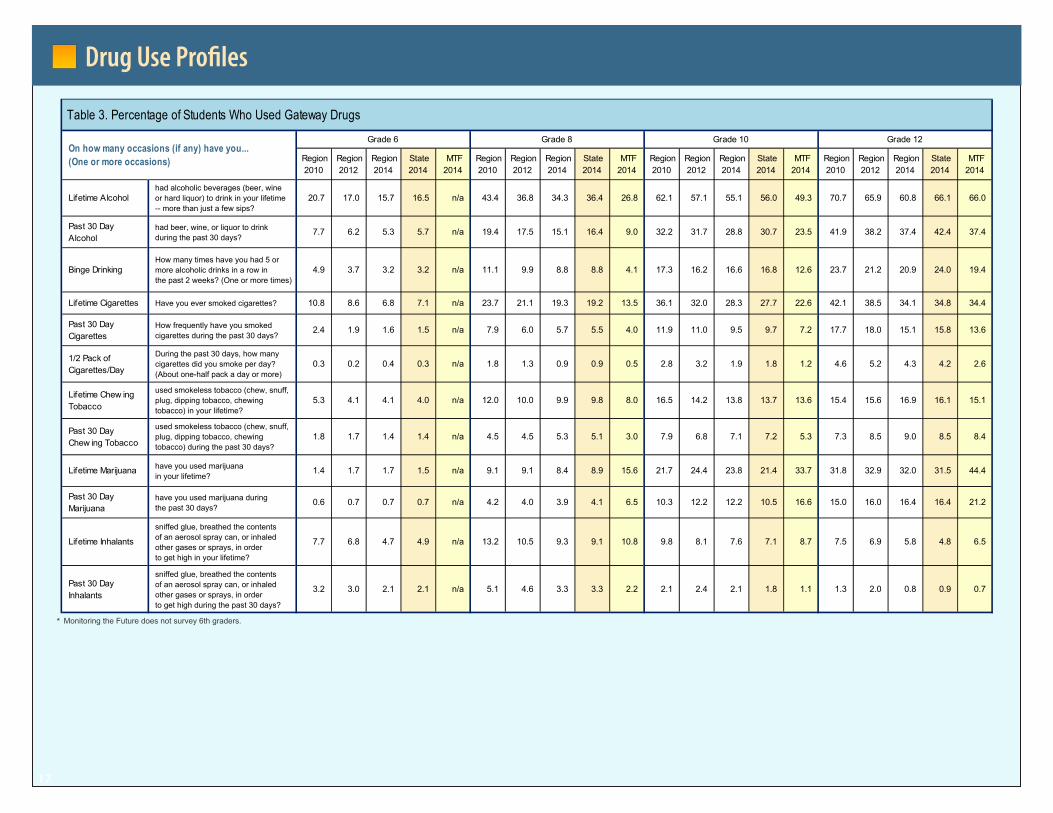
Table 3. Percentage of Students Who Used Gateway Drugs
Region2010
Region2012
Region2014
State2014
MTF2014
Region2010
Region2012
Region2014
State2014
MTF2014
Region2010
Region2012
Region2014
State2014
MTF2014
Region2010
Region2012
Region2014
State2014
MTF2014
Lifetime Alcohol had alcoholic beverages (beer, wine or hard liquor) to drink in your lifetime -- more than just a few sips?
20.7 17.0 15.7 16.5 n/a 43.4 36.8 34.3 36.4 26.8 62.1 57.1 55.1 56.0 49.3 70.7 65.9 60.8 66.1 66.0
Past 30 Day Alcohol
had beer, wine, or liquor to drink during the past 30 days?
7.7 6.2 5.3 5.7 n/a 19.4 17.5 15.1 16.4 9.0 32.2 31.7 28.8 30.7 23.5 41.9 38.2 37.4 42.4 37.4
Binge Drinking How many times have you had 5 or more alcoholic drinks in a row in the past 2 weeks? (One or more times)
4.9 3.7 3.2 3.2 n/a 11.1 9.9 8.8 8.8 4.1 17.3 16.2 16.6 16.8 12.6 23.7 21.2 20.9 24.0 19.4
Lifetime Cigarettes Have you ever smoked cigarettes? 10.8 8.6 6.8 7.1 n/a 23.7 21.1 19.3 19.2 13.5 36.1 32.0 28.3 27.7 22.6 42.1 38.5 34.1 34.8 34.4
Past 30 Day Cigarettes
How frequently have you smoked cigarettes during the past 30 days?
2.4 1.9 1.6 1.5 n/a 7.9 6.0 5.7 5.5 4.0 11.9 11.0 9.5 9.7 7.2 17.7 18.0 15.1 15.8 13.6
1/2 Pack of Cigarettes/Day
During the past 30 days, how many cigarettes did you smoke per day? (About one-half pack a day or more)
0.3 0.2 0.4 0.3 n/a 1.8 1.3 0.9 0.9 0.5 2.8 3.2 1.9 1.8 1.2 4.6 5.2 4.3 4.2 2.6
Lifetime Chew ing Tobacco
used smokeless tobacco (chew, snuff, plug, dipping tobacco, chewing tobacco) in your lifetime?
5.3 4.1 4.1 4.0 n/a 12.0 10.0 9.9 9.8 8.0 16.5 14.2 13.8 13.7 13.6 15.4 15.6 16.9 16.1 15.1
Past 30 Day Chew ing Tobacco
used smokeless tobacco (chew, snuff, plug, dipping tobacco, chewing tobacco) during the past 30 days?
1.8 1.7 1.4 1.4 n/a 4.5 4.5 5.3 5.1 3.0 7.9 6.8 7.1 7.2 5.3 7.3 8.5 9.0 8.5 8.4
Lifetime Marijuana have you used marijuana in your lifetime?
1.4 1.7 1.7 1.5 n/a 9.1 9.1 8.4 8.9 15.6 21.7 24.4 23.8 21.4 33.7 31.8 32.9 32.0 31.5 44.4
Past 30 Day Marijuana
have you used marijuana during the past 30 days?
0.6 0.7 0.7 0.7 n/a 4.2 4.0 3.9 4.1 6.5 10.3 12.2 12.2 10.5 16.6 15.0 16.0 16.4 16.4 21.2
Lifetime Inhalants
sniffed glue, breathed the contents of an aerosol spray can, or inhaled other gases or sprays, in order to get high in your lifetime?
7.7 6.8 4.7 4.9 n/a 13.2 10.5 9.3 9.1 10.8 9.8 8.1 7.6 7.1 8.7 7.5 6.9 5.8 4.8 6.5
Past 30 Day Inhalants
sniffed glue, breathed the contents of an aerosol spray can, or inhaled other gases or sprays, in order to get high during the past 30 days?
3.2 3.0 2.1 2.1 n/a 5.1 4.6 3.3 3.3 2.2 2.1 2.4 2.1 1.8 1.1 1.3 2.0 0.8 0.9 0.7
*
On how many occasions (if any) have you... (One or more occasions)
Grade 6 Grade 8 Grade 10 Grade 12
Monitoring the Future does not survey 6th graders.
18
Drug Use Profiles
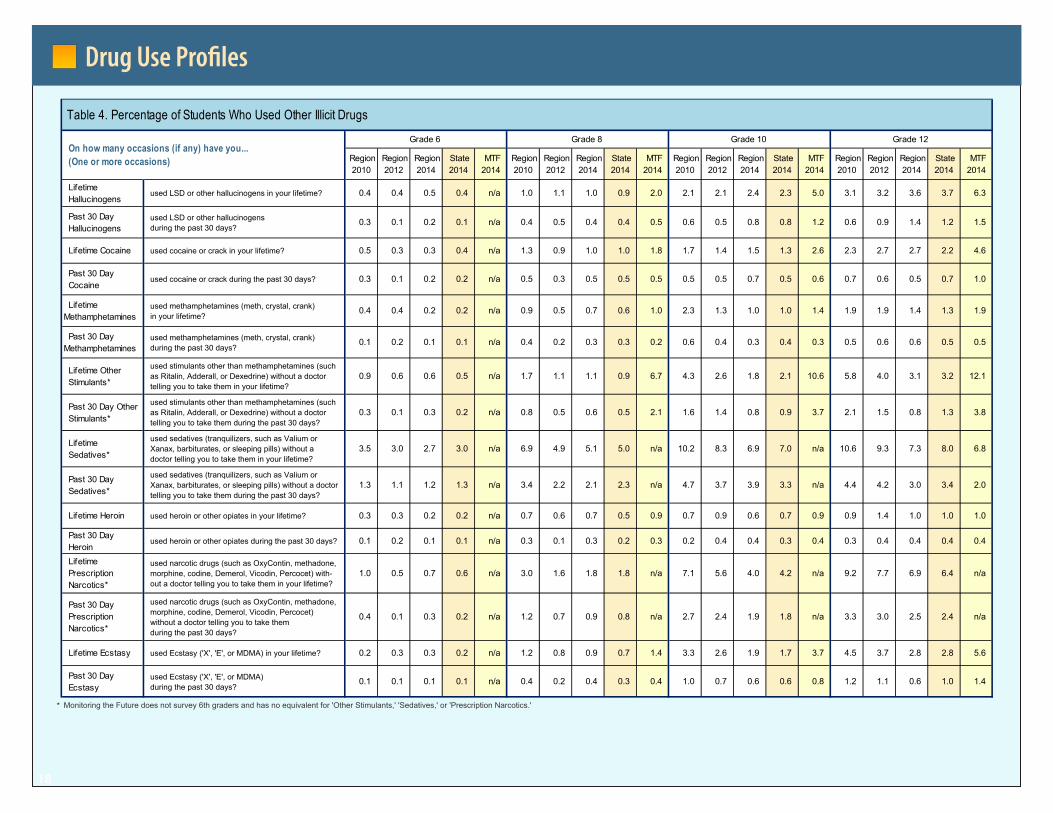
Table 4. Percentage of Students Who Used Other Illicit Drugs
Region2010
Region2012
Region2014
State2014
MTF2014
Region2010
Region2012
Region2014
State2014
MTF2014
Region2010
Region2012
Region2014
State2014
MTF2014
Region2010
Region2012
Region2014
State2014
MTF2014
Lifetime Hallucinogens
used LSD or other hallucinogens in your lifetime? 0.4 0.4 0.5 0.4 n/a 1.0 1.1 1.0 0.9 2.0 2.1 2.1 2.4 2.3 5.0 3.1 3.2 3.6 3.7 6.3
Past 30 Day Hallucinogens
used LSD or other hallucinogens during the past 30 days?
0.3 0.1 0.2 0.1 n/a 0.4 0.5 0.4 0.4 0.5 0.6 0.5 0.8 0.8 1.2 0.6 0.9 1.4 1.2 1.5
Lifetime Cocaine used cocaine or crack in your lifetime? 0.5 0.3 0.3 0.4 n/a 1.3 0.9 1.0 1.0 1.8 1.7 1.4 1.5 1.3 2.6 2.3 2.7 2.7 2.2 4.6
Past 30 Day Cocaine
used cocaine or crack during the past 30 days? 0.3 0.1 0.2 0.2 n/a 0.5 0.3 0.5 0.5 0.5 0.5 0.5 0.7 0.5 0.6 0.7 0.6 0.5 0.7 1.0
Lifetime Methamphetamines
used methamphetamines (meth, crystal, crank) in your lifetime?
0.4 0.4 0.2 0.2 n/a 0.9 0.5 0.7 0.6 1.0 2.3 1.3 1.0 1.0 1.4 1.9 1.9 1.4 1.3 1.9
Past 30 Day Methamphetamines
used methamphetamines (meth, crystal, crank) during the past 30 days?
0.1 0.2 0.1 0.1 n/a 0.4 0.2 0.3 0.3 0.2 0.6 0.4 0.3 0.4 0.3 0.5 0.6 0.6 0.5 0.5
Lifetime Other Stimulants*
used stimulants other than methamphetamines (such as Ritalin, Adderall, or Dexedrine) without a doctor telling you to take them in your lifetime?
0.9 0.6 0.6 0.5 n/a 1.7 1.1 1.1 0.9 6.7 4.3 2.6 1.8 2.1 10.6 5.8 4.0 3.1 3.2 12.1
Past 30 Day Other Stimulants*
used stimulants other than methamphetamines (such as Ritalin, Adderall, or Dexedrine) without a doctor telling you to take them during the past 30 days?
0.3 0.1 0.3 0.2 n/a 0.8 0.5 0.6 0.5 2.1 1.6 1.4 0.8 0.9 3.7 2.1 1.5 0.8 1.3 3.8
Lifetime Sedatives*
used sedatives (tranquilizers, such as Valium or Xanax, barbiturates, or sleeping pills) without a doctor telling you to take them in your lifetime?
3.5 3.0 2.7 3.0 n/a 6.9 4.9 5.1 5.0 n/a 10.2 8.3 6.9 7.0 n/a 10.6 9.3 7.3 8.0 6.8
Past 30 Day Sedatives*
used sedatives (tranquilizers, such as Valium or Xanax, barbiturates, or sleeping pills) without a doctor telling you to take them during the past 30 days?
1.3 1.1 1.2 1.3 n/a 3.4 2.2 2.1 2.3 n/a 4.7 3.7 3.9 3.3 n/a 4.4 4.2 3.0 3.4 2.0
Lifetime Heroin used heroin or other opiates in your lifetime? 0.3 0.3 0.2 0.2 n/a 0.7 0.6 0.7 0.5 0.9 0.7 0.9 0.6 0.7 0.9 0.9 1.4 1.0 1.0 1.0
Past 30 Day Heroin
used heroin or other opiates during the past 30 days? 0.1 0.2 0.1 0.1 n/a 0.3 0.1 0.3 0.2 0.3 0.2 0.4 0.4 0.3 0.4 0.3 0.4 0.4 0.4 0.4
Lifetime Prescription Narcotics*
used narcotic drugs (such as OxyContin, methadone, morphine, codine, Demerol, Vicodin, Percocet) with- out a doctor telling you to take them in your lifetime?
1.0 0.5 0.7 0.6 n/a 3.0 1.6 1.8 1.8 n/a 7.1 5.6 4.0 4.2 n/a 9.2 7.7 6.9 6.4 n/a
Past 30 Day Prescription Narcotics*
used narcotic drugs (such as OxyContin, methadone, morphine, codine, Demerol, Vicodin, Percocet) without a doctor telling you to take them during the past 30 days?
0.4 0.1 0.3 0.2 n/a 1.2 0.7 0.9 0.8 n/a 2.7 2.4 1.9 1.8 n/a 3.3 3.0 2.5 2.4 n/a
Lifetime Ecstasy used Ecstasy ('X', 'E', or MDMA) in your lifetime? 0.2 0.3 0.3 0.2 n/a 1.2 0.8 0.9 0.7 1.4 3.3 2.6 1.9 1.7 3.7 4.5 3.7 2.8 2.8 5.6
Past 30 Day Ecstasy
used Ecstasy ('X', 'E', or MDMA) during the past 30 days?
0.1 0.1 0.1 0.1 n/a 0.4 0.2 0.4 0.3 0.4 1.0 0.7 0.6 0.6 0.8 1.2 1.1 0.6 1.0 1.4
*
On how many occasions (if any) have you... (One or more occasions)
Grade 6 Grade 8 Grade 10 Grade 12
Monitoring the Future does not survey 6th graders and has no equivalent for 'Other Stimulants,' 'Sedatives,' or 'Prescription Narcotics.'
19
Drug Use Profiles
0
10
20
30
40
50
Perce
ntage
(%)
Treatment Needs Additional Alcohol-Related Indicators
Nee
ds A
lcoh
ol T
reat
men
t
Nee
ds D
rug
Trea
tmen
t
Alco
hol o
r Dru
g Tr
eatm
ent
Dru
nk o
r Hig
h at
Sch
ool
DR
IVE
a ca
r or o
ther
vehi
cle
whe
n yo
u ha
dbe
en d
rinki
n g a
lcoh
ol?
(Pa s
t 30
Day
s )
RID
E i n
a c
ar o
r ot h
erve
hicl
e dr
iven
by
s om
e one
wh o
had
bee
ndr
inki
ng a
lcoh
ol?
(Pas
t 30
Day
s)
Region 2010 Region 2012 Region 2014 State 2014 BH Norm 2014
SEVERE SUBSTANCE USE INDICATORS 2014 DHH Region 7, Grade 8
0
10
20
30
40
50
Perce
ntage
(%)
Treatment Needs Additional Alcohol-Related IndicatorsN
eeds
Alc
ohol
Tre
atm
ent
Nee
ds D
rug
Trea
tmen
t
Alco
hol o
r Dru
g Tr
eatm
ent
Dru
nk o
r Hig
h at
Sch
ool
DR
IVE
a ca
r or o
ther
vehi
cle
whe
n yo
u ha
dbe
e n d
ri nki
n g a
lco h
ol?
(Pas
t 30
Day
s )
RID
E in
a c
ar o
r oth
erve
hicl
e dr
iven
by
som
e one
wh o
had
be e
ndr
inki
ng a
lcoh
ol?
(Pas
t 30
Day
s)
Region 2010 Region 2012 Region 2014 State 2014 BH Norm 2014
SEVERE SUBSTANCE USE INDICATORS 2014 DHH Region 7, Grade 6
20
Drug Use Profiles
0
10
20
30
40
50
Perce
ntage
(%)
Treatment Needs Additional Alcohol-Related Indicators
Nee
ds A
lcoh
ol T
reat
men
t
Nee
ds D
rug
Trea
tmen
t
Alco
hol o
r Dru
g Tr
eatm
ent
Dru
nk o
r Hig
h at
Sch
ool
DR
IVE
a ca
r or o
ther
vehi
cle
whe
n yo
u ha
dbe
en d
rinki
ng a
lcoh
ol?
(Pas
t 30
Day
s)
RID
E in
a c
ar o
r oth
erve
hicl
e dr
iven
by
som
eone
who
had
be e
ndr
inki
ng a
lcoh
ol?
(Pas
t 30
Day
s)
Region 2010 Region 2012 Region 2014 State 2014 BH Norm 2014
SEVERE SUBSTANCE USE INDICATORS 2014 DHH Region 7, Grade 12
0
10
20
30
40
50
Perce
ntage
(%)
Treatment Needs Additional Alcohol-Related IndicatorsN
eeds
Alc
ohol
Tre
atm
ent
Nee
ds D
rug
Trea
tmen
t
Alco
hol o
r Dru
g Tr
eatm
ent
Dru
nk o
r Hig
h at
Sch
ool
DR
IVE
a ca
r or o
ther
vehi
cle
whe
n yo
u ha
dbe
en d
rinki
ng a
lcoh
ol?
(Pas
t 30
Day
s)
RID
E in
a c
ar o
r oth
erve
hicl
e dr
iven
by
som
eone
who
had
be e
ndr
inki
ng a
lcoh
ol?
(Pas
t 30
Day
s)
Region 2010 Region 2012 Region 2014 State 2014 BH Norm 2014
SEVERE SUBSTANCE USE INDICATORS 2014 DHH Region 7, Grade 10
21
Drug Use Profiles
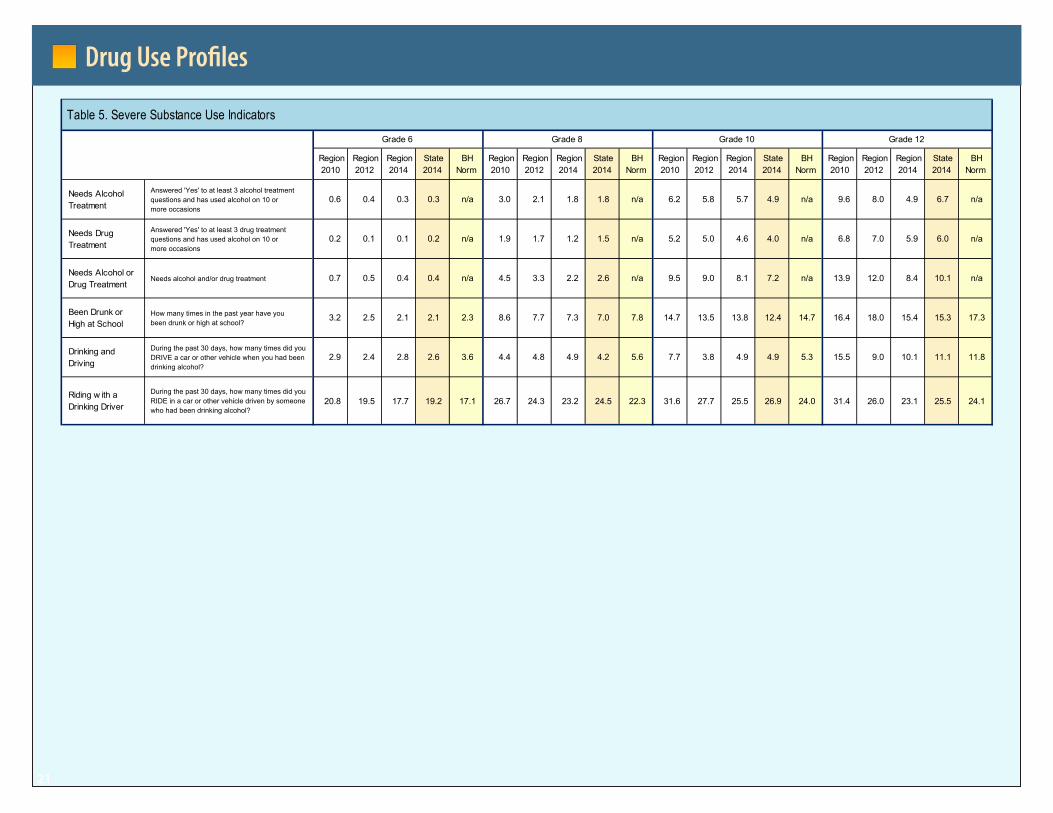
Table 5. Severe Substance Use Indicators
Region2010
Region2012
Region2014
State2014
BHNorm
Region2010
Region2012
Region2014
State2014
BHNorm
Region2010
Region2012
Region2014
State2014
BHNorm
Region2010
Region2012
Region2014
State2014
BHNorm
Needs Alcohol Treatment
Answered 'Yes' to at least 3 alcohol treatment questions and has used alcohol on 10 or more occasions
0.6 0.4 0.3 0.3 n/a 3.0 2.1 1.8 1.8 n/a 6.2 5.8 5.7 4.9 n/a 9.6 8.0 4.9 6.7 n/a
Needs Drug Treatment
Answered 'Yes' to at least 3 drug treatment questions and has used alcohol on 10 or more occasions
0.2 0.1 0.1 0.2 n/a 1.9 1.7 1.2 1.5 n/a 5.2 5.0 4.6 4.0 n/a 6.8 7.0 5.9 6.0 n/a
Needs Alcohol or Drug Treatment
Needs alcohol and/or drug treatment 0.7 0.5 0.4 0.4 n/a 4.5 3.3 2.2 2.6 n/a 9.5 9.0 8.1 7.2 n/a 13.9 12.0 8.4 10.1 n/a
Been Drunk or High at School
How many times in the past year have you been drunk or high at school?
3.2 2.5 2.1 2.1 2.3 8.6 7.7 7.3 7.0 7.8 14.7 13.5 13.8 12.4 14.7 16.4 18.0 15.4 15.3 17.3
Drinking and Driving
During the past 30 days, how many times did you DRIVE a car or other vehicle when you had been drinking alcohol?
2.9 2.4 2.8 2.6 3.6 4.4 4.8 4.9 4.2 5.6 7.7 3.8 4.9 4.9 5.3 15.5 9.0 10.1 11.1 11.8
Riding w ith a Drinking Driver
During the past 30 days, how many times did you RIDE in a car or other vehicle driven by someone who had been drinking alcohol?
20.8 19.5 17.7 19.2 17.1 26.7 24.3 23.2 24.5 22.3 31.6 27.7 25.5 26.9 24.0 31.4 26.0 23.1 25.5 24.1
Grade 6 Grade 8 Grade 10 Grade 12
22
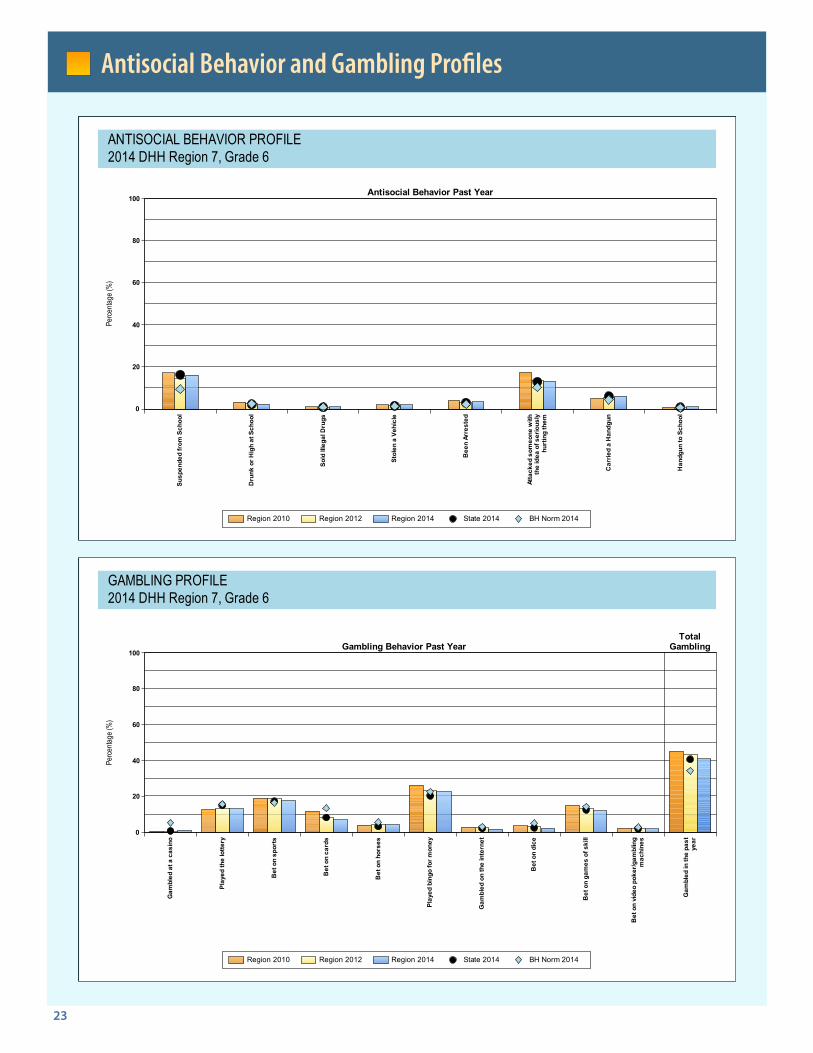
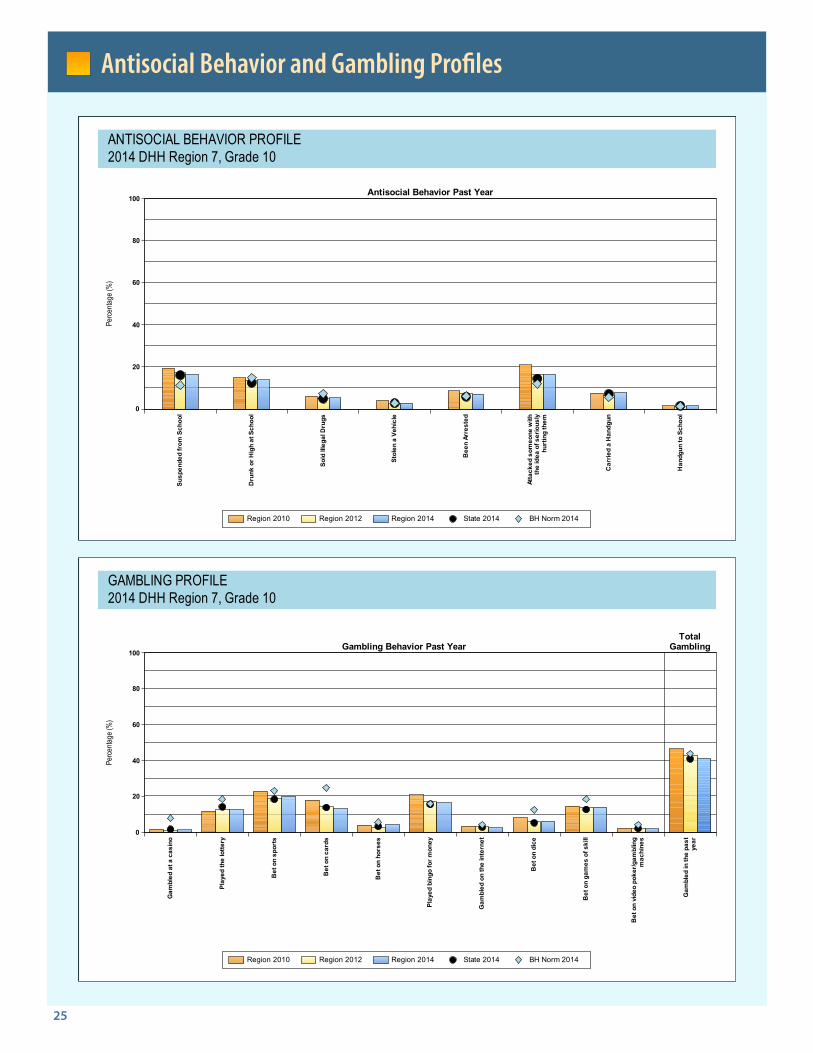
The charts and tables that follow present the rates of a va-riety of antisocial behaviors, as well as gambling behavior among youth in your community who completed the sur-vey. The first set of charts in this section present the per-centage of youth who reported engaging in several forms of antisocial behavior (e.g., attacked someone with the idea of seriously hurting them, stolen a vehicle) or relat-ed consequences (e.g., been suspended from school, been arrested). The second set of charts in this section high-light the percentage of youth who indicated engaging in a variety of gambling behaviors. Rates of both antisocial behavior and gambling reflect reported behavior in the past year.
As with the substance use profile charts presented earlier, the bars on the following charts represent the percent-age of students in that grade who reported the behavior, while the dots on the charts represent the percentage of all of the youth surveyed in Louisiana who reported the problem behavior. The diamonds represent national data from the Bach Harrison Norm and allow a comparison of your antisocial and gambling behavior data to a national sample of students.
A comparison to state and national results provides addi-tional information for your community in determining the relative importance of levels of antisocial and gam-bling behavior. Information about other students in the region and the nation can be helpful in determining the seriousness of a given level of problem behavior. Scanning across the charts will help you gain a better understand-ing of the issues affecting your community.
The following definitions and descriptions provide in-formation for the substance use and severe substance use charts that follow.
• Antisocial behavior (ASB) is a measure of the percentage of students who report any involvement with the eight antisocial behaviors listed in the charts during the past year. In the charts, antisocial behavior is referred to as ASB.
• Gambling behavior charts show the percentage of students who engaged in each of the 10 types of gambling along with the percentage for any gambling behavior during the past year.
Antisocial Behavior and Gambling Profiles
23
Antisocial Behavior and Gambling Profiles
0
20
40
60
80
100
Perce
ntage
(%)
Gambling Behavior Past YearTotal
Gambling
Gam
bled
at a
cas
ino
Play
ed th
e lo
ttery
Bet
on
spor
ts
Bet
on
card
s
Bet
on
hors
es
Play
ed b
ingo
for m
oney
Gam
bled
on
the
inte
rnet
Bet
on
dice
Bet
on
gam
es o
f ski
ll
Be t
on
vide
o po
k er/ g
ambl
i ng
mac
hine
s
Gam
bled
in th
e pa
stye
ar
Region 2010 Region 2012 Region 2014 State 2014 BH Norm 2014
GAMBLING PROFILE 2014 DHH Region 7, Grade 6
0
20
40
60
80
100
Perce
ntage
(%)
Antisocial Behavior Past YearSu
spen
ded
from
Sch
ool
Dru
nk o
r Hig
h at
Sch
ool
Sold
Ille
gal D
rugs
Stol
en a
Veh
icle
Bee
n Ar
rest
ed
Atta
cked
som
eone
with
the
idea
of s
erio
usly
hurt
ing
them
Car
ri ed
a H
and g
un
Han
dgun
to S
choo
l
Region 2010 Region 2012 Region 2014 State 2014 BH Norm 2014
ANTISOCIAL BEHAVIOR PROFILE 2014 DHH Region 7, Grade 6

24
Antisocial Behavior and Gambling Profiles
0
20
40
60
80
100
Perce
ntage
(%)
Gambling Behavior Past YearTotal
Gambling
Gam
bled
at a
cas
ino
Play
ed th
e lo
ttery
Bet
on
spor
ts
Bet
on
card
s
Bet
on
hors
es
Play
ed b
ingo
for m
oney
Gam
bled
on
the
inte
rnet
Bet
on
dice
Bet
on
gam
es o
f ski
ll
Be t
on
vide
o po
k er/ g
ambl
i ng
mac
hine
s
Gam
bled
in th
e pa
stye
ar
Region 2010 Region 2012 Region 2014 State 2014 BH Norm 2014
GAMBLING PROFILE 2014 DHH Region 7, Grade 8
0
20
40
60
80
100
Perce
ntage
(%)
Antisocial Behavior Past YearSu
spen
ded
from
Sch
ool
Dru
nk o
r Hig
h at
Sch
ool
Sold
Ille
gal D
rugs
Stol
en a
Veh
icle
Bee
n Ar
rest
ed
Atta
cked
som
eone
with
the
idea
of s
erio
usly
hurt
ing
them
Car
ried
a H
andg
un
Han
dgun
to S
choo
l
Region 2010 Region 2012 Region 2014 State 2014 BH Norm 2014
ANTISOCIAL BEHAVIOR PROFILE 2014 DHH Region 7, Grade 8
25
Antisocial Behavior and Gambling Profiles
0
20
40
60
80
100
Perce
ntage
(%)
Gambling Behavior Past YearTotal
Gambling
Gam
bled
at a
cas
ino
Play
ed th
e lo
ttery
Bet
on
spor
ts
Bet
on
card
s
Bet
on
hors
es
Play
ed b
ingo
for m
oney
Gam
bled
on
the
inte
rnet
Bet
on
dice
Bet
on
gam
es o
f ski
ll
Be t
on
vide
o po
k er/ g
ambl
i ng
mac
hine
s
Gam
bled
in th
e pa
stye
ar
Region 2010 Region 2012 Region 2014 State 2014 BH Norm 2014
GAMBLING PROFILE 2014 DHH Region 7, Grade 10
0
20
40
60
80
100
Perce
ntage
(%)
Antisocial Behavior Past YearSu
spen
ded
from
Sch
ool
Dru
nk o
r Hig
h at
Sch
ool
Sold
Ille
gal D
rugs
Stol
en a
Veh
icle
Bee
n Ar
rest
ed
Atta
cked
som
eone
with
the
idea
of s
erio
usly
hurt
ing
them
Car
ried
a H
andg
un
Han
dgun
to S
choo
l
Region 2010 Region 2012 Region 2014 State 2014 BH Norm 2014
ANTISOCIAL BEHAVIOR PROFILE 2014 DHH Region 7, Grade 10

26
Antisocial Behavior and Gambling Profiles
0
20
40
60
80
100
Perce
ntage
(%)
Gambling Behavior Past YearTotal
Gambling
Gam
bled
at a
cas
ino
Play
ed th
e lo
ttery
Bet
on
spor
ts
Bet
on
card
s
Bet
on
hors
es
Play
ed b
ingo
for m
oney
Gam
bled
on
the
inte
rnet
Bet
on
dice
Bet
on
gam
es o
f ski
ll
Be t
on
vide
o po
k er/ g
ambl
i ng
mac
hine
s
Gam
bled
in th
e pa
stye
ar
Region 2010 Region 2012 Region 2014 State 2014 BH Norm 2014
GAMBLING PROFILE 2014 DHH Region 7, Grade 12
0
20
40
60
80
100
Perce
ntage
(%)
Antisocial Behavior Past YearSu
spen
ded
from
Sch
ool
Dru
nk o
r Hig
h at
Sch
ool
Sold
Ille
gal D
rugs
Stol
en a
Veh
icle
Bee
n Ar
rest
ed
Atta
cked
som
eone
with
the
idea
of s
erio
usly
hurt
ing
them
Car
ried
a H
andg
un
Han
dgun
to S
choo
l
Region 2010 Region 2012 Region 2014 State 2014 BH Norm 2014
ANTISOCIAL BEHAVIOR PROFILE 2014 DHH Region 7, Grade 12
27
Antisocial Behavior and Gambling Profiles
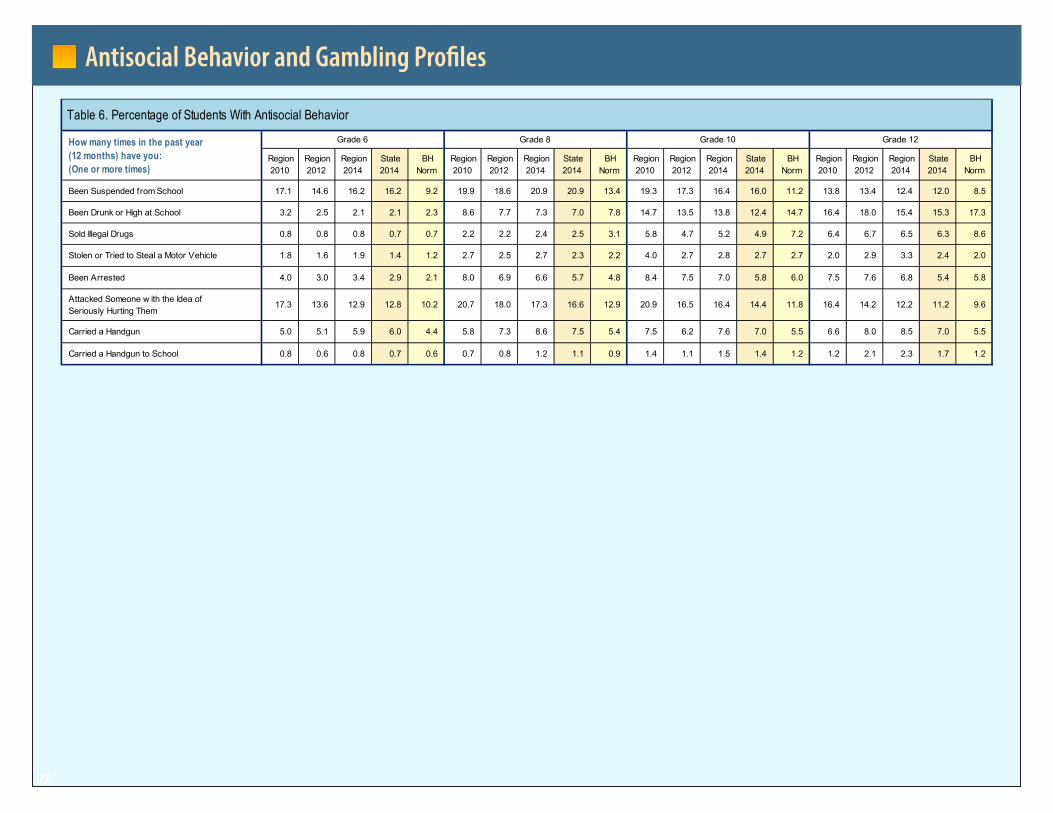
Table 6. Percentage of Students With Antisocial Behavior
Region2010
Region2012
Region2014
State2014
BHNorm
Region2010
Region2012
Region2014
State2014
BHNorm
Region2010
Region2012
Region2014
State2014
BHNorm
Region2010
Region2012
Region2014
State2014
BHNorm
Been Suspended from School 17.1 14.6 16.2 16.2 9.2 19.9 18.6 20.9 20.9 13.4 19.3 17.3 16.4 16.0 11.2 13.8 13.4 12.4 12.0 8.5
Been Drunk or High at School 3.2 2.5 2.1 2.1 2.3 8.6 7.7 7.3 7.0 7.8 14.7 13.5 13.8 12.4 14.7 16.4 18.0 15.4 15.3 17.3
Sold Illegal Drugs 0.8 0.8 0.8 0.7 0.7 2.2 2.2 2.4 2.5 3.1 5.8 4.7 5.2 4.9 7.2 6.4 6.7 6.5 6.3 8.6
Stolen or Tried to Steal a Motor Vehicle 1.8 1.6 1.9 1.4 1.2 2.7 2.5 2.7 2.3 2.2 4.0 2.7 2.8 2.7 2.7 2.0 2.9 3.3 2.4 2.0
Been Arrested 4.0 3.0 3.4 2.9 2.1 8.0 6.9 6.6 5.7 4.8 8.4 7.5 7.0 5.8 6.0 7.5 7.6 6.8 5.4 5.8
Attacked Someone w ith the Idea of Seriously Hurting Them
17.3 13.6 12.9 12.8 10.2 20.7 18.0 17.3 16.6 12.9 20.9 16.5 16.4 14.4 11.8 16.4 14.2 12.2 11.2 9.6
Carried a Handgun 5.0 5.1 5.9 6.0 4.4 5.8 7.3 8.6 7.5 5.4 7.5 6.2 7.6 7.0 5.5 6.6 8.0 8.5 7.0 5.5
Carried a Handgun to School 0.8 0.6 0.8 0.7 0.6 0.7 0.8 1.2 1.1 0.9 1.4 1.1 1.5 1.4 1.2 1.2 2.1 2.3 1.7 1.2
How many times in the past year (12 months) have you: (One or more times)
Grade 6 Grade 8 Grade 10 Grade 12
28
Antisocial Behavior and Gambling Profiles
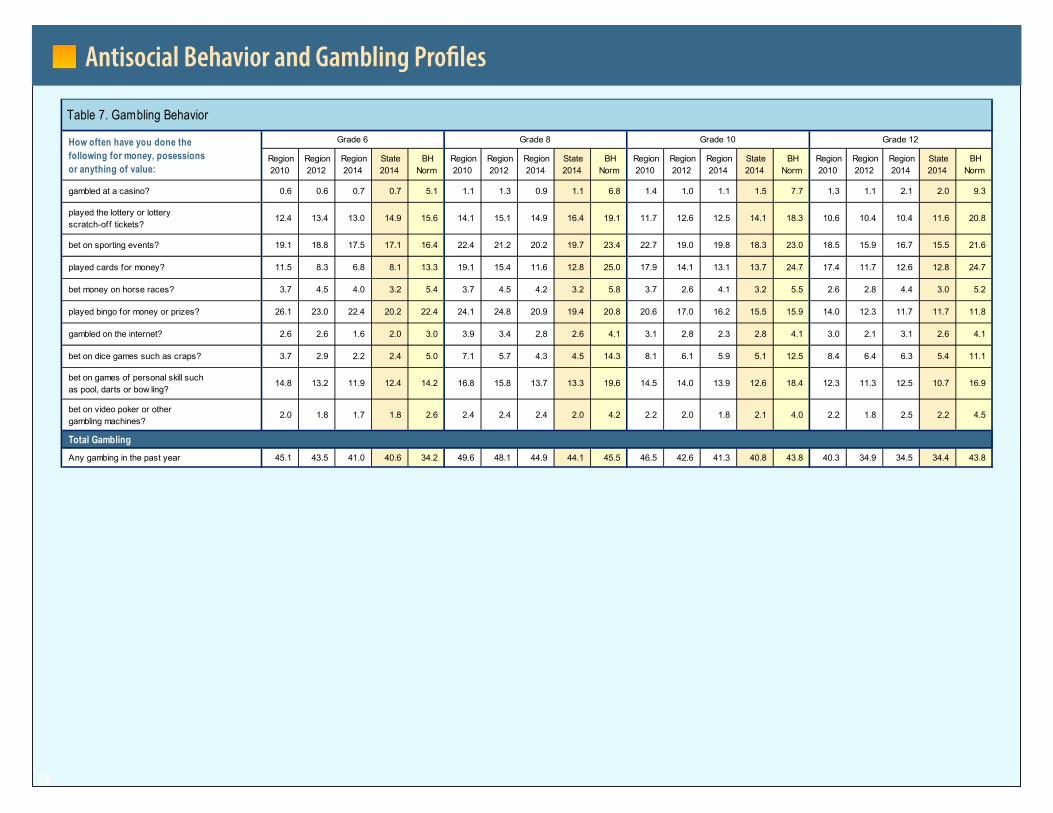
Table 7. Gambling Behavior
Region2010
Region2012
Region2014
State2014
BHNorm
Region2010
Region2012
Region2014
State2014
BHNorm
Region2010
Region2012
Region2014
State2014
BHNorm
Region2010
Region2012
Region2014
State2014
BHNorm
gambled at a casino? 0.6 0.6 0.7 0.7 5.1 1.1 1.3 0.9 1.1 6.8 1.4 1.0 1.1 1.5 7.7 1.3 1.1 2.1 2.0 9.3
played the lottery or lottery scratch-off tickets?
12.4 13.4 13.0 14.9 15.6 14.1 15.1 14.9 16.4 19.1 11.7 12.6 12.5 14.1 18.3 10.6 10.4 10.4 11.6 20.8
bet on sporting events? 19.1 18.8 17.5 17.1 16.4 22.4 21.2 20.2 19.7 23.4 22.7 19.0 19.8 18.3 23.0 18.5 15.9 16.7 15.5 21.6
played cards for money? 11.5 8.3 6.8 8.1 13.3 19.1 15.4 11.6 12.8 25.0 17.9 14.1 13.1 13.7 24.7 17.4 11.7 12.6 12.8 24.7
bet money on horse races? 3.7 4.5 4.0 3.2 5.4 3.7 4.5 4.2 3.2 5.8 3.7 2.6 4.1 3.2 5.5 2.6 2.8 4.4 3.0 5.2
played bingo for money or prizes? 26.1 23.0 22.4 20.2 22.4 24.1 24.8 20.9 19.4 20.8 20.6 17.0 16.2 15.5 15.9 14.0 12.3 11.7 11.7 11.8
gambled on the internet? 2.6 2.6 1.6 2.0 3.0 3.9 3.4 2.8 2.6 4.1 3.1 2.8 2.3 2.8 4.1 3.0 2.1 3.1 2.6 4.1
bet on dice games such as craps? 3.7 2.9 2.2 2.4 5.0 7.1 5.7 4.3 4.5 14.3 8.1 6.1 5.9 5.1 12.5 8.4 6.4 6.3 5.4 11.1
bet on games of personal skill such as pool, darts or bow ling?
14.8 13.2 11.9 12.4 14.2 16.8 15.8 13.7 13.3 19.6 14.5 14.0 13.9 12.6 18.4 12.3 11.3 12.5 10.7 16.9
bet on video poker or other gambling machines?
2.0 1.8 1.7 1.8 2.6 2.4 2.4 2.4 2.0 4.2 2.2 2.0 1.8 2.1 4.0 2.2 1.8 2.5 2.2 4.5
Total Gambling Any gambing in the past year 45.1 43.5 41.0 40.6 34.2 49.6 48.1 44.9 44.1 45.5 46.5 42.6 41.3 40.8 43.8 40.3 34.9 34.5 34.4 43.8
How often have you done the following for money, posessions or anything of value:
Grade 6 Grade 8 Grade 10 Grade 12
29
Risk and Protective Factor & Alcohol Environmental Risk Factor Profiles
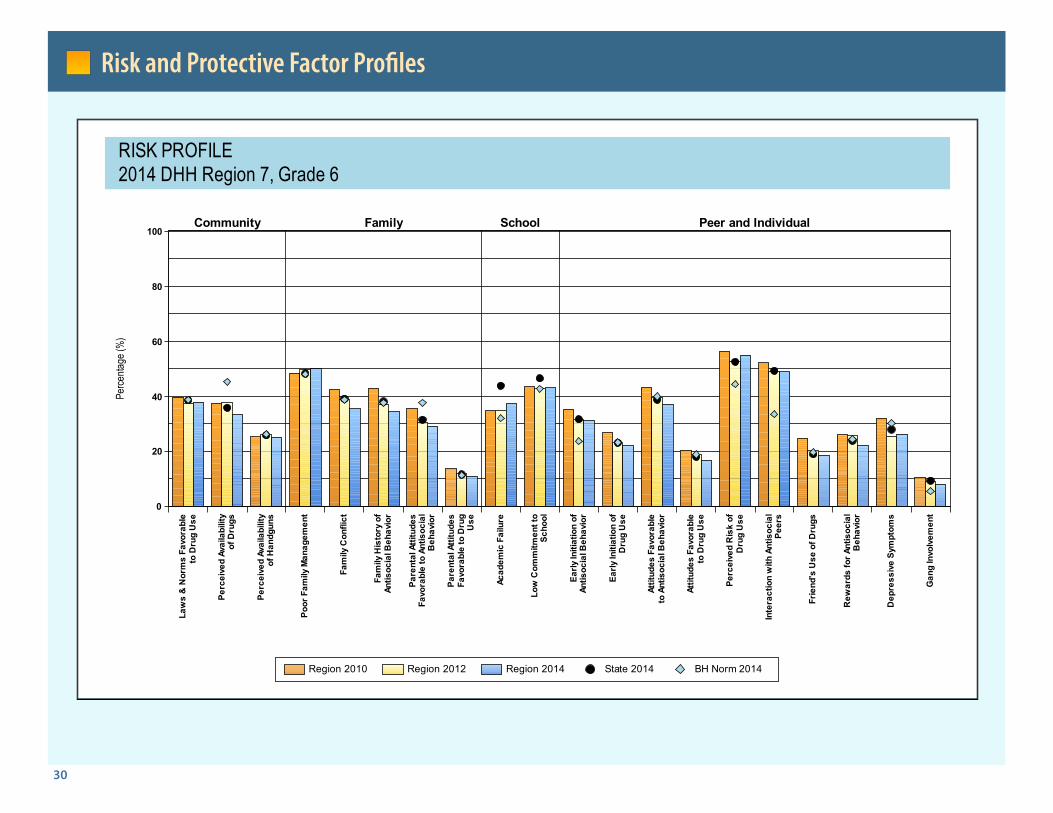
The charts and tables that follow are intended to provide prevention professionals with data that are helpful in un-derstanding the predictors and causes of substance use in your community. Data in the risk and protective factor profiles will provide you with an overview of the levels of risk and protection in your community. The Alcohol Environmental Risk Factors charts present data relevant to several community domain variables associated with increased alcohol consumption.
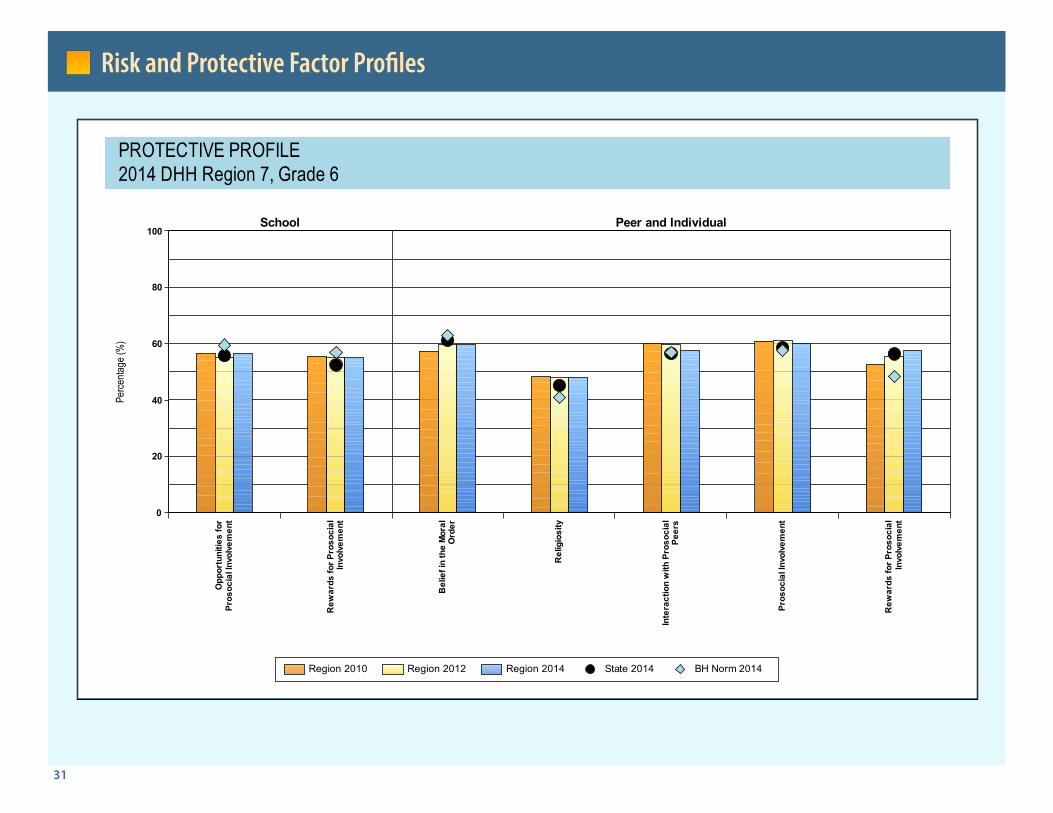
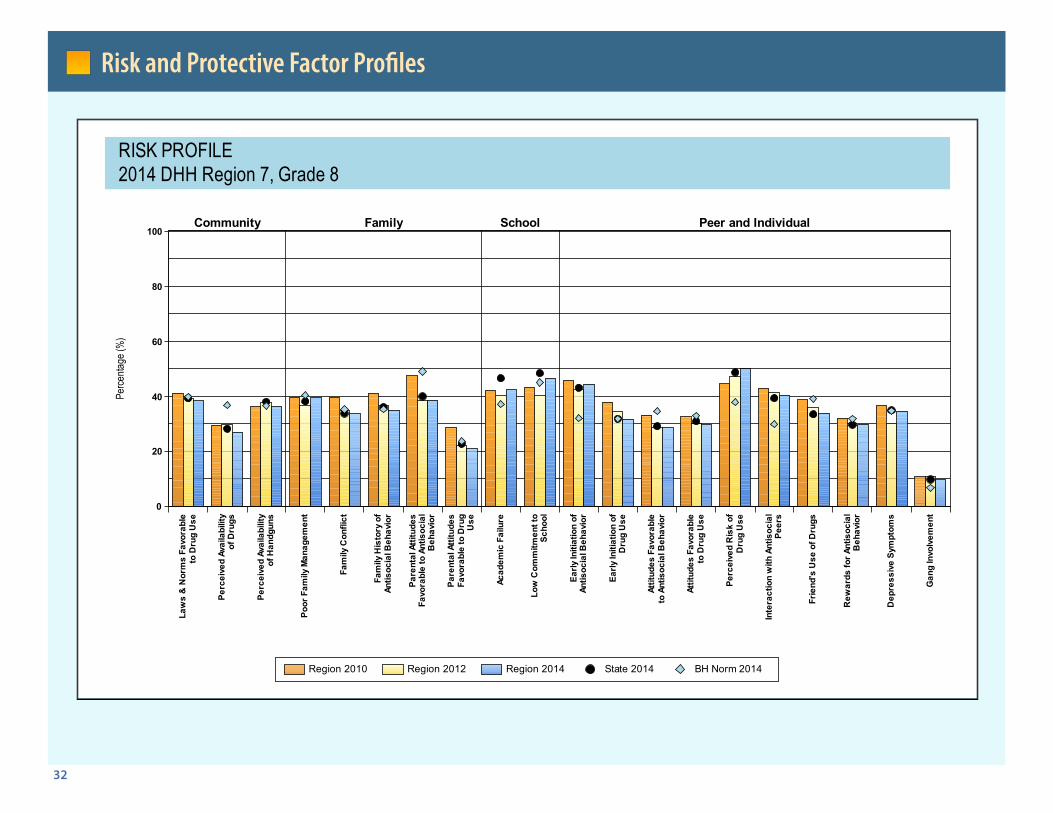
Risk and Protective Factor ProfilesThe risk and protective factor charts show the percentage of students at risk and with protection for each of the risk and protective factor scales. The risk and protective factor scales measure specific aspects of a youth’s life experience that are predictive of whether he/she will engage in prob-lem behaviors. Higher risk and lower protection predict a greater likelihood that a youth with engage in problem behaviors, while lower risk and higher protection predict a greater likelihood that youth will not engage in problem behaviors.
The factors are grouped into four domains: community, family, school, and peer/individual. Brief definitions of the risk and protective factors scales are provided in Table 13 at the end of this report. For more information about risk and protective factors, please refer to the resources listed on the last page of this report under Contacts for Prevention.
Consistent with the other charts in this report the bars represent your community’s levels of risk and protection,
the dots represent the Louisiana state average, and the diamonds represent a national comparison through the Bach Harrison norm, where available. Scanning across the charts, it is important to observe the factors that dif-fer the most from the Bach Harrison Norm. This is the first step in identifying the levels of risk and protection that are higher or lower than those in other communities. The risk factors that are higher than the Bach Harrison Norm and the protective factors are lower than the Bach Harrison Norm are probably the factors that your com-munity should consider addressing when planning pre-vention programs. By looking at the percentage of youth at risk and with protection over time, it is possible to de-termine whether the percentage of students at risk or with protection is increasing, decreasing, or staying the same. This information is important when deciding which risk and protective factors warrant attention.
Alcohol Environmental Risk Factor ProfilesThe Alcohol Environmental Risk Factors profiles include the percentage of students who obtained alcohol from specific sources and survey data gathered to shed light on the community norms about alcohol use. Percentages for the sources of alcohol are based upon only those stu-dents who reported having used alcohol in the past year. (Sample sizes are noted in the chart legend.)
Student perceptions of community norms are drawn from all students surveyed, regardless of whether they reported any alcohol use.
30
Risk and Protective Factor Profiles
0
20
40
60
80
100
Perce
ntage
(%)
Community Family School Peer and Individual
Law
s &
Nor
ms
Favo
rabl
eto
Dru
g U
se
Perc
eive
d Av
aila
bilit
yof
Dru
gs
Perc
eive
d Av
aila
bilit
yof
Han
dgun
s
Poor
Fam
ily M
anag
emen
t
Fam
ily C
onfli
ct
Fam
ily H
isto
ry o
fAn
tisoc
ial B
ehav
ior
Pare
ntal
Atti
tude
sFa
vora
ble
to A
ntis
ocia
lB
ehav
ior
Pare
ntal
Atti
tude
sFa
vora
ble
to D
rug
Use
Acad
emic
Fai
lure
Low
Com
mitm
ent t
oSc
hool
Early
Initi
atio
n of
Antis
ocia
l Beh
avio
r
Early
Initi
atio
n of
Dru
g U
se
Attit
udes
Fav
orab
leto
Ant
isoc
ial B
ehav
ior
Attit
udes
Fav
orab
leto
Dru
g U
se
Perc
eive
d R
isk
ofD
rug
Use
Inte
ract
ion
with
Ant
isoc
ial
Peer
s
Frie
nd's
Use
of D
rugs
Rew
ards
for A
ntis
ocia
lB
ehav
ior
Dep
ress
ive
Sym
ptom
s
Gan
g In
volv
emen
t
Region 2010 Region 2012 Region 2014 State 2014 BH Norm 2014
RISK PROFILE 2014 DHH Region 7, Grade 6
31
Risk and Protective Factor Profiles
0
20
40
60
80
100
Perce
ntage
(%)
School Peer and IndividualO
ppor
tuni
ties
for
Pros
ocia
l Inv
olve
men
t
Rew
ards
for P
roso
cial
Invo
lvem
ent
Bel
ief i
n th
e M
oral
Ord
er
Rel
igio
sity
Inte
ract
ion
with
Pro
soci
alPe
ers
Pros
ocia
l Inv
olve
men
t
Rew
ards
for P
roso
cial
Invo
lvem
ent
Region 2010 Region 2012 Region 2014 State 2014 BH Norm 2014
PROTECTIVE PROFILE 2014 DHH Region 7, Grade 6
32
Risk and Protective Factor Profiles
0
20
40
60
80
100
Perce
ntage
(%)
Community Family School Peer and Individual
Law
s &
Nor
ms
Favo
rabl
eto
Dru
g U
se
Perc
eive
d Av
aila
bilit
yof
Dru
gs
Perc
eive
d Av
aila
bilit
yof
Han
dgun
s
Poor
Fam
ily M
anag
emen
t
Fam
ily C
onfli
ct
Fam
ily H
isto
ry o
fAn
tisoc
ial B
ehav
ior
Pare
ntal
Atti
tude
sFa
vora
ble
to A
ntis
ocia
lB
ehav
ior
Pare
ntal
Atti
tude
sFa
vora
ble
to D
rug
Use
Acad
emic
Fai
lure
Low
Com
mitm
ent t
oSc
hool
Early
Initi
atio
n of
Antis
ocia
l Beh
avio
r
Early
Initi
atio
n of
Dru
g U
se
Attit
udes
Fav
orab
leto
Ant
isoc
ial B
ehav
ior
Attit
udes
Fav
orab
leto
Dru
g U
se
Perc
eive
d R
isk
ofD
rug
Use
Inte
ract
ion
with
Ant
isoc
ial
Peer
s
Frie
nd's
Use
of D
rugs
Rew
ards
for A
ntis
ocia
lB
ehav
ior
Dep
ress
ive
Sym
ptom
s
Gan
g In
volv
emen
t
Region 2010 Region 2012 Region 2014 State 2014 BH Norm 2014
RISK PROFILE 2014 DHH Region 7, Grade 8
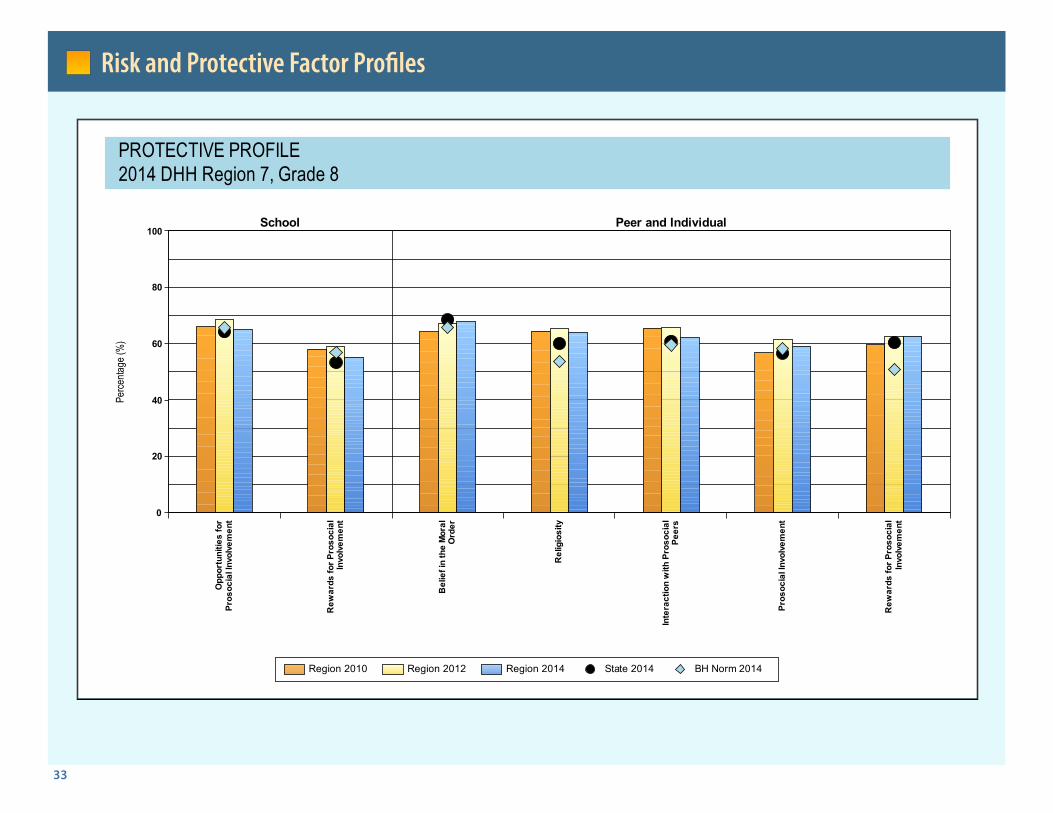
33
Risk and Protective Factor Profiles
0
20
40
60
80
100
Perce
ntage
(%)
School Peer and IndividualO
ppor
tuni
ties
for
Pros
ocia
l Inv
olve
men
t
Rew
ards
for P
roso
cial
Invo
lvem
ent
Bel
ief i
n th
e M
oral
Ord
er
Rel
igio
sity
Inte
ract
ion
with
Pro
soci
alPe
ers
Pros
ocia
l Inv
olve
men
t
Rew
ards
for P
roso
cial
Invo
lvem
ent
Region 2010 Region 2012 Region 2014 State 2014 BH Norm 2014
PROTECTIVE PROFILE 2014 DHH Region 7, Grade 8
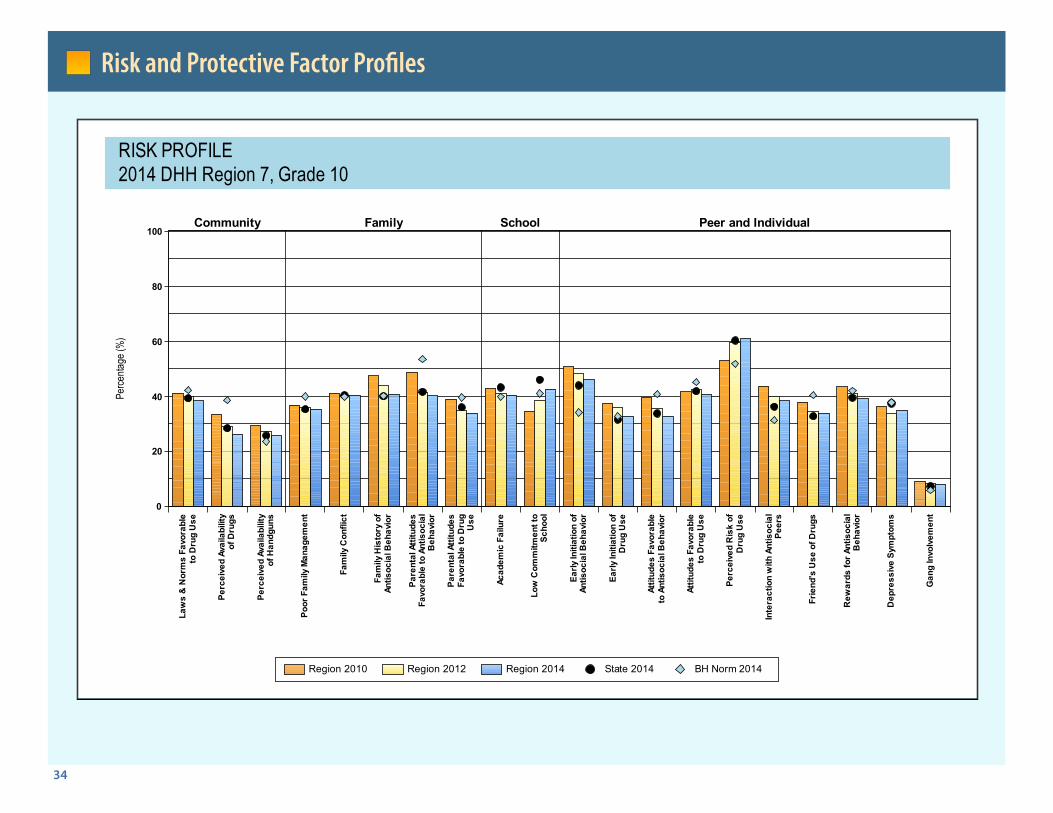
34
Risk and Protective Factor Profiles
0
20
40
60
80
100
Perce
ntage
(%)
Community Family School Peer and Individual
Law
s &
Nor
ms
Favo
rabl
eto
Dru
g U
se
Perc
eive
d Av
aila
bilit
yof
Dru
gs
Perc
eive
d Av
aila
bilit
yof
Han
dgun
s
Poor
Fam
ily M
anag
emen
t
Fam
ily C
onfli
ct
Fam
ily H
isto
ry o
fAn
tisoc
ial B
ehav
ior
Pare
ntal
Atti
tude
sFa
vora
ble
to A
ntis
ocia
lB
ehav
ior
Pare
ntal
Atti
tude
sFa
vora
ble
to D
rug
Use
Acad
emic
Fai
lure
Low
Com
mitm
ent t
oSc
hool
Early
Initi
atio
n of
Antis
ocia
l Beh
avio
r
Early
Initi
atio
n of
Dru
g U
se
Attit
udes
Fav
orab
leto
Ant
isoc
ial B
ehav
ior
Attit
udes
Fav
orab
leto
Dru
g U
se
Perc
eive
d R
isk
ofD
rug
Use
Inte
ract
ion
with
Ant
isoc
ial
Peer
s
Frie
nd's
Use
of D
rugs
Rew
ards
for A
ntis
ocia
lB
ehav
ior
Dep
ress
ive
Sym
ptom
s
Gan
g In
volv
emen
t
Region 2010 Region 2012 Region 2014 State 2014 BH Norm 2014
RISK PROFILE 2014 DHH Region 7, Grade 10
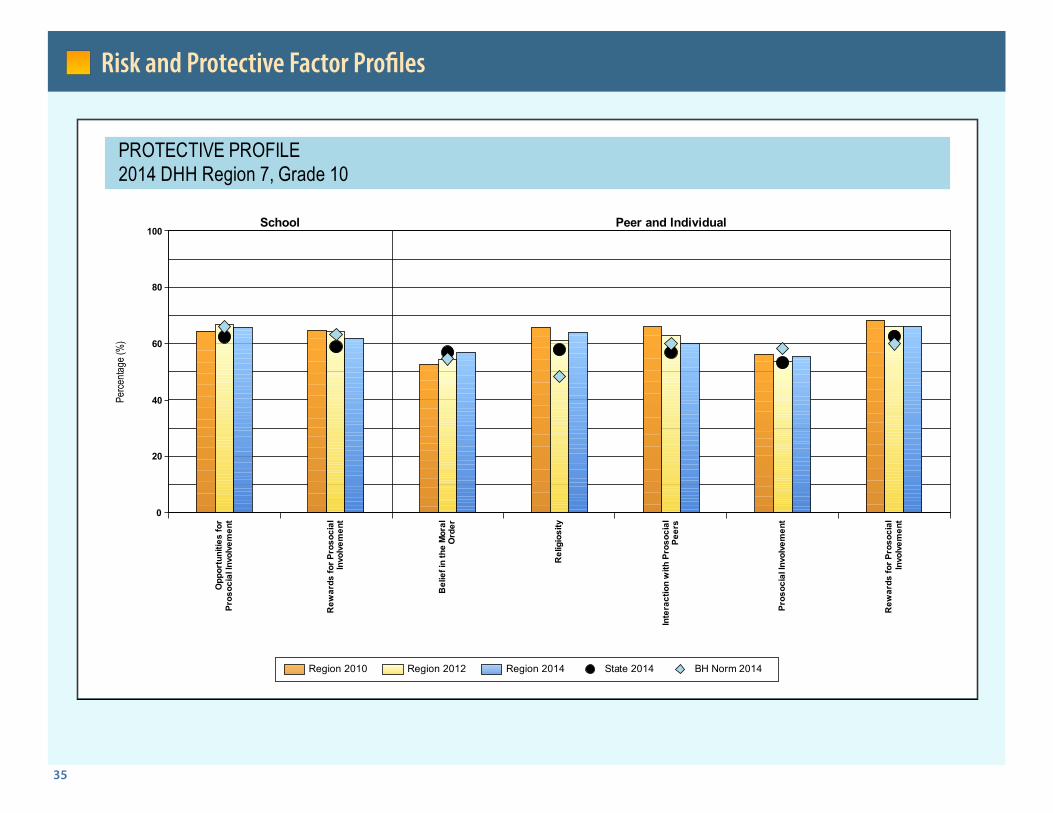
35
Risk and Protective Factor Profiles
0
20
40
60
80
100
Perce
ntage
(%)
School Peer and IndividualO
ppor
tuni
ties
for
Pros
ocia
l Inv
olve
men
t
Rew
ards
for P
roso
cial
Invo
lvem
ent
Bel
ief i
n th
e M
oral
Ord
er
Rel
igio
sity
Inte
ract
ion
with
Pro
soci
alPe
ers
Pros
ocia
l Inv
olve
men
t
Rew
ards
for P
roso
cial
Invo
lvem
ent
Region 2010 Region 2012 Region 2014 State 2014 BH Norm 2014
PROTECTIVE PROFILE 2014 DHH Region 7, Grade 10
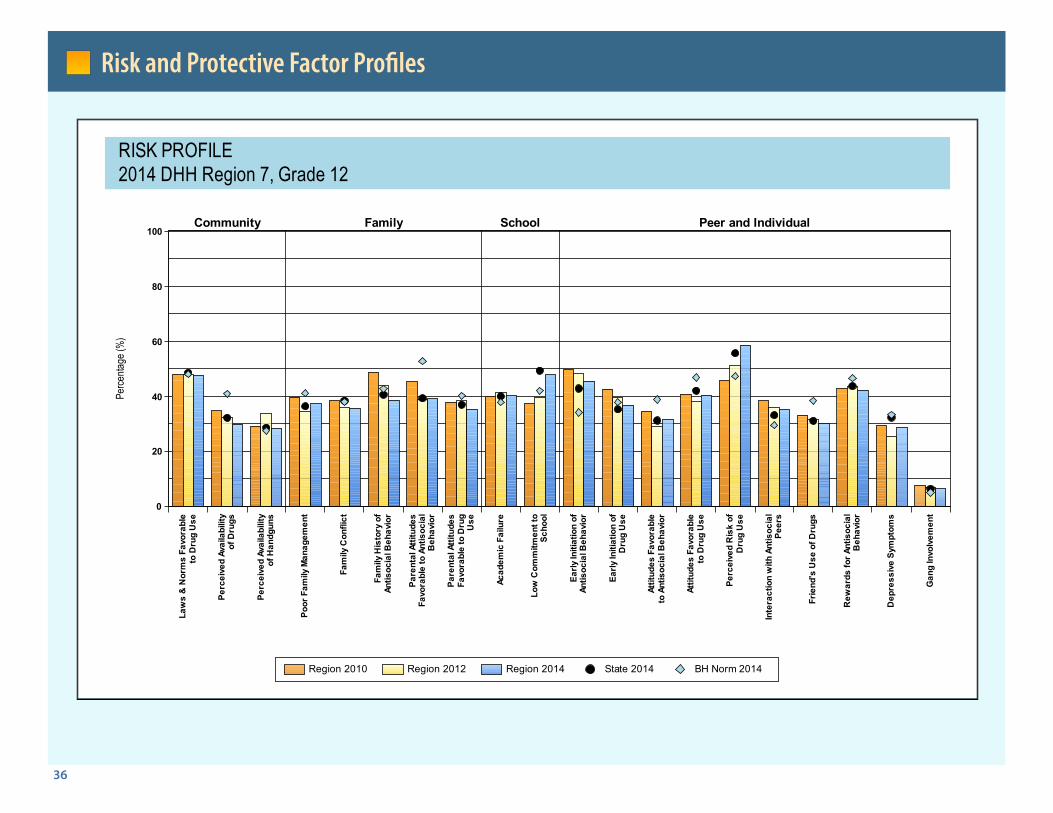
36
Risk and Protective Factor Profiles
0
20
40
60
80
100
Perce
ntage
(%)
Community Family School Peer and Individual
Law
s &
Nor
ms
Favo
rabl
eto
Dru
g U
se
Perc
eive
d Av
aila
bilit
yof
Dru
gs
Perc
eive
d Av
aila
bilit
yof
Han
dgun
s
Poor
Fam
ily M
anag
emen
t
Fam
ily C
onfli
ct
Fam
ily H
isto
ry o
fAn
tisoc
ial B
ehav
ior
Pare
ntal
Atti
tude
sFa
vora
ble
to A
ntis
ocia
lB
ehav
ior
Pare
ntal
Atti
tude
sFa
vora
ble
to D
rug
Use
Acad
emic
Fai
lure
Low
Com
mitm
ent t
oSc
hool
Early
Initi
atio
n of
Antis
ocia
l Beh
avio
r
Early
Initi
atio
n of
Dru
g U
se
Attit
udes
Fav
orab
leto
Ant
isoc
ial B
ehav
ior
Attit
udes
Fav
orab
leto
Dru
g U
se
Perc
eive
d R
isk
ofD
rug
Use
Inte
ract
ion
with
Ant
isoc
ial
Peer
s
Frie
nd's
Use
of D
rugs
Rew
ards
for A
ntis
ocia
lB
ehav
ior
Dep
ress
ive
Sym
ptom
s
Gan
g In
volv
emen
t
Region 2010 Region 2012 Region 2014 State 2014 BH Norm 2014
RISK PROFILE 2014 DHH Region 7, Grade 12
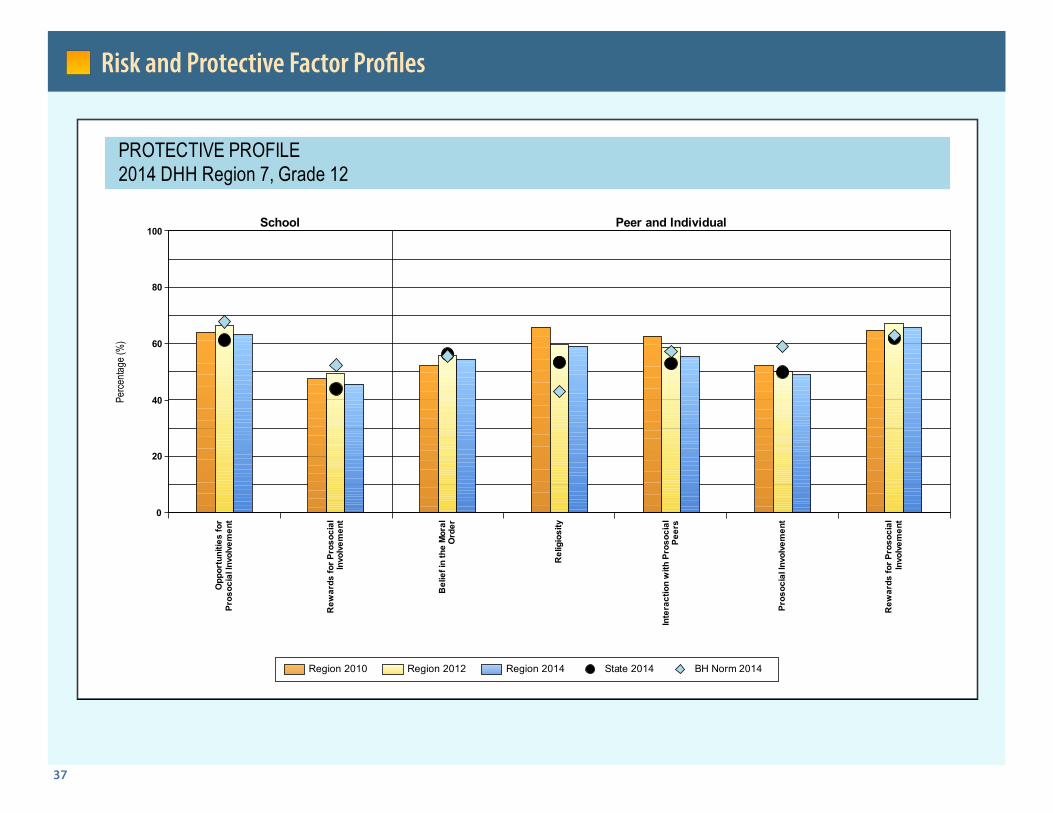
37
Risk and Protective Factor Profiles
0
20
40
60
80
100
Perce
ntage
(%)
School Peer and IndividualO
ppor
tuni
ties
for
Pros
ocia
l Inv
olve
men
t
Rew
ards
for P
roso
cial
Invo
lvem
ent
Bel
ief i
n th
e M
oral
Ord
er
Rel
igio
sity
Inte
ract
ion
with
Pro
soci
alPe
ers
Pros
ocia
l Inv
olve
men
t
Rew
ards
for P
roso
cial
Invo
lvem
ent
Region 2010 Region 2012 Region 2014 State 2014 BH Norm 2014
PROTECTIVE PROFILE 2014 DHH Region 7, Grade 12
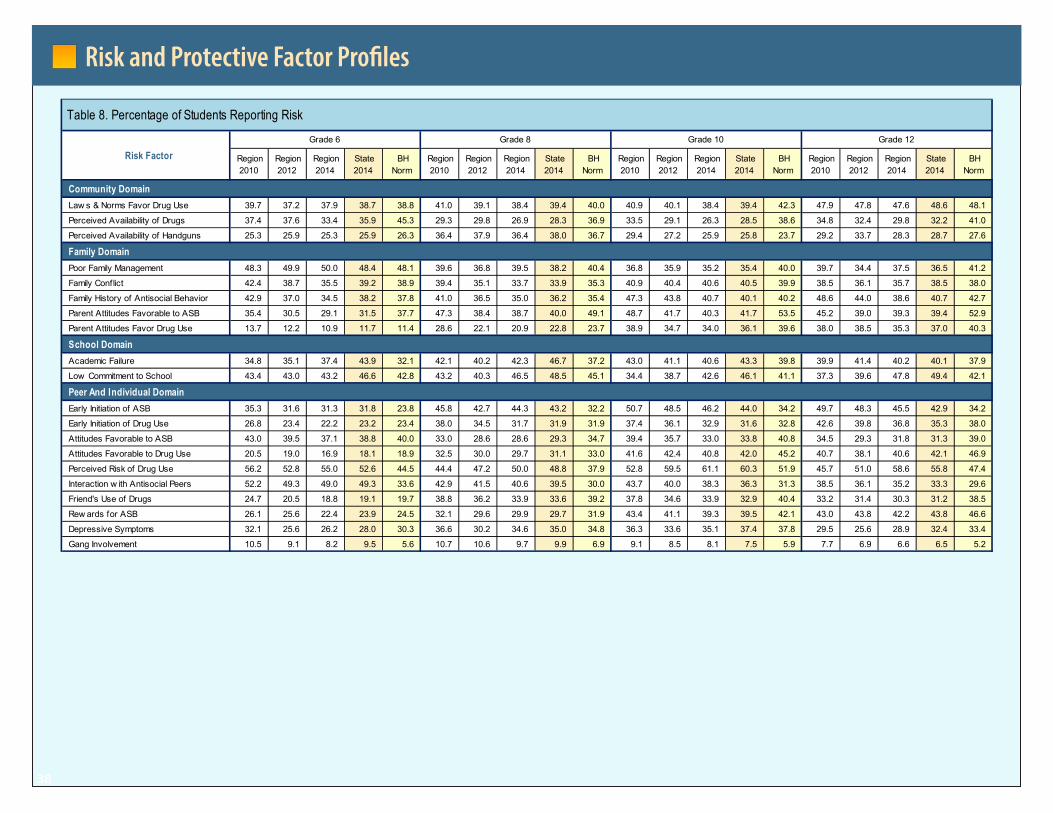
38
Risk and Protective Factor Profiles
Table 8. Percentage of Students Reporting Risk
Region2010
Region2012
Region2014
State2014
BHNorm
Region2010
Region2012
Region2014
State2014
BHNorm
Region2010
Region2012
Region2014
State2014
BHNorm
Region2010
Region2012
Region2014
State2014
BHNorm
Community Domain Law s & Norms Favor Drug Use 39.7 37.2 37.9 38.7 38.8 41.0 39.1 38.4 39.4 40.0 40.9 40.1 38.4 39.4 42.3 47.9 47.8 47.6 48.6 48.1
Perceived Availability of Drugs 37.4 37.6 33.4 35.9 45.3 29.3 29.8 26.9 28.3 36.9 33.5 29.1 26.3 28.5 38.6 34.8 32.4 29.8 32.2 41.0
Perceived Availability of Handguns 25.3 25.9 25.3 25.9 26.3 36.4 37.9 36.4 38.0 36.7 29.4 27.2 25.9 25.8 23.7 29.2 33.7 28.3 28.7 27.6
Family Domain Poor Family Management 48.3 49.9 50.0 48.4 48.1 39.6 36.8 39.5 38.2 40.4 36.8 35.9 35.2 35.4 40.0 39.7 34.4 37.5 36.5 41.2
Family Conflict 42.4 38.7 35.5 39.2 38.9 39.4 35.1 33.7 33.9 35.3 40.9 40.4 40.6 40.5 39.9 38.5 36.1 35.7 38.5 38.0
Family History of Antisocial Behavior 42.9 37.0 34.5 38.2 37.8 41.0 36.5 35.0 36.2 35.4 47.3 43.8 40.7 40.1 40.2 48.6 44.0 38.6 40.7 42.7
Parent Attitudes Favorable to ASB 35.4 30.5 29.1 31.5 37.7 47.3 38.4 38.7 40.0 49.1 48.7 41.7 40.3 41.7 53.5 45.2 39.0 39.3 39.4 52.9
Parent Attitudes Favor Drug Use 13.7 12.2 10.9 11.7 11.4 28.6 22.1 20.9 22.8 23.7 38.9 34.7 34.0 36.1 39.6 38.0 38.5 35.3 37.0 40.3
School Domain Academic Failure 34.8 35.1 37.4 43.9 32.1 42.1 40.2 42.3 46.7 37.2 43.0 41.1 40.6 43.3 39.8 39.9 41.4 40.2 40.1 37.9
Low Commitment to School 43.4 43.0 43.2 46.6 42.8 43.2 40.3 46.5 48.5 45.1 34.4 38.7 42.6 46.1 41.1 37.3 39.6 47.8 49.4 42.1
Peer And Individual Domain Early Initiation of ASB 35.3 31.6 31.3 31.8 23.8 45.8 42.7 44.3 43.2 32.2 50.7 48.5 46.2 44.0 34.2 49.7 48.3 45.5 42.9 34.2
Early Initiation of Drug Use 26.8 23.4 22.2 23.2 23.4 38.0 34.5 31.7 31.9 31.9 37.4 36.1 32.9 31.6 32.8 42.6 39.8 36.8 35.3 38.0
Attitudes Favorable to ASB 43.0 39.5 37.1 38.8 40.0 33.0 28.6 28.6 29.3 34.7 39.4 35.7 33.0 33.8 40.8 34.5 29.3 31.8 31.3 39.0
Attitudes Favorable to Drug Use 20.5 19.0 16.9 18.1 18.9 32.5 30.0 29.7 31.1 33.0 41.6 42.4 40.8 42.0 45.2 40.7 38.1 40.6 42.1 46.9
Perceived Risk of Drug Use 56.2 52.8 55.0 52.6 44.5 44.4 47.2 50.0 48.8 37.9 52.8 59.5 61.1 60.3 51.9 45.7 51.0 58.6 55.8 47.4
Interaction w ith Antisocial Peers 52.2 49.3 49.0 49.3 33.6 42.9 41.5 40.6 39.5 30.0 43.7 40.0 38.3 36.3 31.3 38.5 36.1 35.2 33.3 29.6
Friend's Use of Drugs 24.7 20.5 18.8 19.1 19.7 38.8 36.2 33.9 33.6 39.2 37.8 34.6 33.9 32.9 40.4 33.2 31.4 30.3 31.2 38.5
Rew ards for ASB 26.1 25.6 22.4 23.9 24.5 32.1 29.6 29.9 29.7 31.9 43.4 41.1 39.3 39.5 42.1 43.0 43.8 42.2 43.8 46.6
Depressive Symptoms 32.1 25.6 26.2 28.0 30.3 36.6 30.2 34.6 35.0 34.8 36.3 33.6 35.1 37.4 37.8 29.5 25.6 28.9 32.4 33.4
Gang Involvement 10.5 9.1 8.2 9.5 5.6 10.7 10.6 9.7 9.9 6.9 9.1 8.5 8.1 7.5 5.9 7.7 6.9 6.6 6.5 5.2
Risk Factor Grade 6 Grade 8 Grade 10 Grade 12
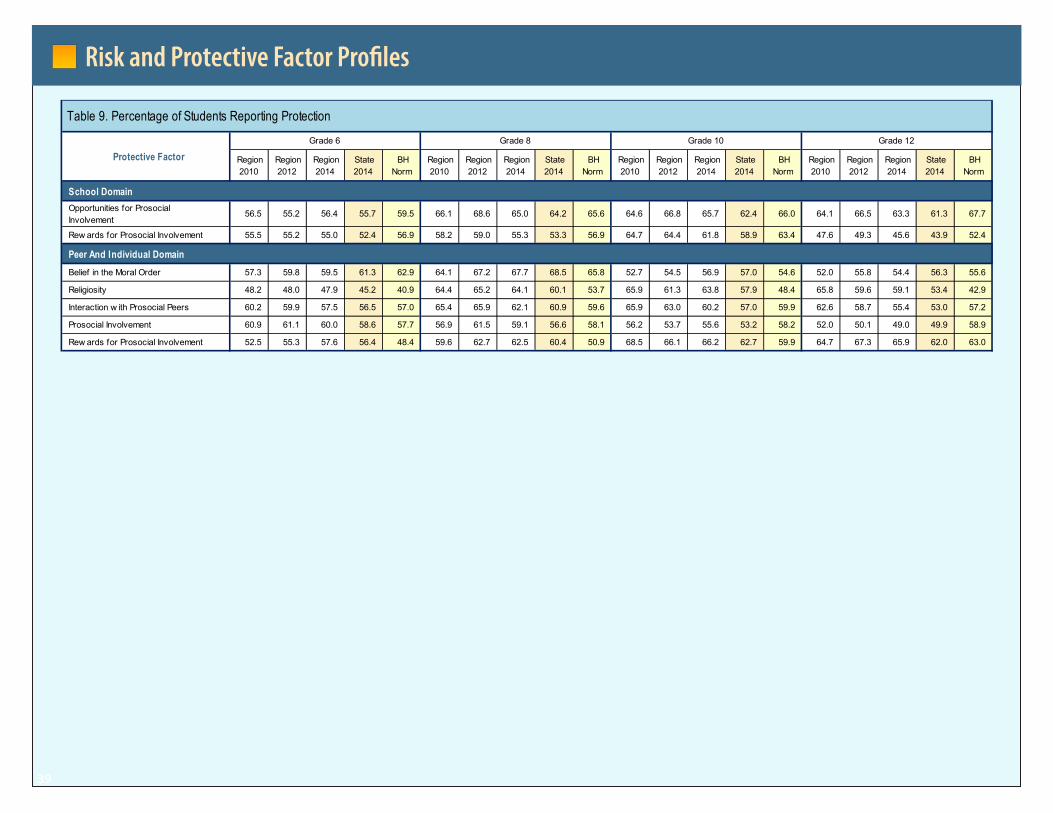
39
Risk and Protective Factor Profiles
Table 9. Percentage of Students Reporting Protection
Region2010
Region2012
Region2014
State2014
BHNorm
Region2010
Region2012
Region2014
State2014
BHNorm
Region2010
Region2012
Region2014
State2014
BHNorm
Region2010
Region2012
Region2014
State2014
BHNorm
School Domain Opportunities for Prosocial Involvement
56.5 55.2 56.4 55.7 59.5 66.1 68.6 65.0 64.2 65.6 64.6 66.8 65.7 62.4 66.0 64.1 66.5 63.3 61.3 67.7
Rew ards for Prosocial Involvement 55.5 55.2 55.0 52.4 56.9 58.2 59.0 55.3 53.3 56.9 64.7 64.4 61.8 58.9 63.4 47.6 49.3 45.6 43.9 52.4
Peer And Individual Domain Belief in the Moral Order 57.3 59.8 59.5 61.3 62.9 64.1 67.2 67.7 68.5 65.8 52.7 54.5 56.9 57.0 54.6 52.0 55.8 54.4 56.3 55.6
Religiosity 48.2 48.0 47.9 45.2 40.9 64.4 65.2 64.1 60.1 53.7 65.9 61.3 63.8 57.9 48.4 65.8 59.6 59.1 53.4 42.9
Interaction w ith Prosocial Peers 60.2 59.9 57.5 56.5 57.0 65.4 65.9 62.1 60.9 59.6 65.9 63.0 60.2 57.0 59.9 62.6 58.7 55.4 53.0 57.2
Prosocial Involvement 60.9 61.1 60.0 58.6 57.7 56.9 61.5 59.1 56.6 58.1 56.2 53.7 55.6 53.2 58.2 52.0 50.1 49.0 49.9 58.9
Rew ards for Prosocial Involvement 52.5 55.3 57.6 56.4 48.4 59.6 62.7 62.5 60.4 50.9 68.5 66.1 66.2 62.7 59.9 64.7 67.3 65.9 62.0 63.0
Protective Factor Grade 6 Grade 8 Grade 10 Grade 12
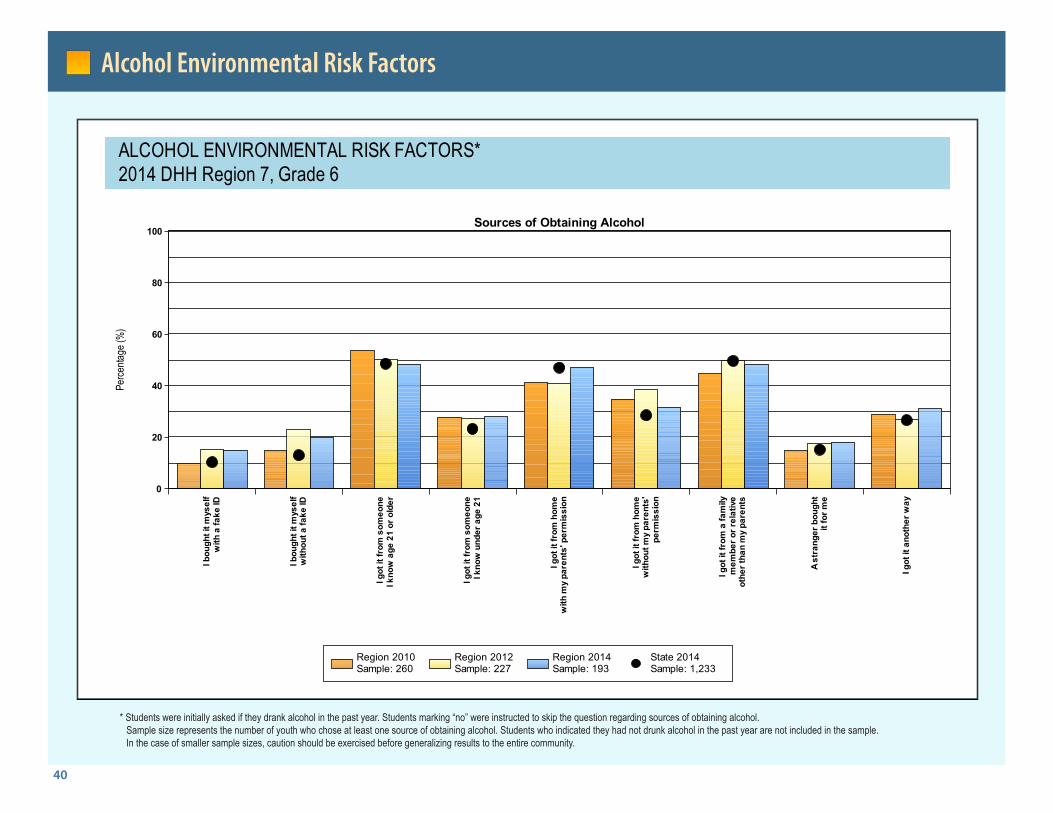
40
Alcohol Environmental Risk Factors
0
20
40
60
80
100
Perce
ntage
(%)
Sources of Obtaining AlcoholI b
ough
t it m
ysel
fw
ith a
fake
ID
I bou
ght i
t mys
elf
with
out a
fake
ID
I got
it fr
om s
omeo
neI k
now
age
21
or o
lder
I got
it fr
om s
omeo
neI k
now
und
er a
ge 2
1
I got
it fr
om h
ome
with
my
pare
nts'
per
mis
sion
I got
it fr
om h
ome
with
out m
y pa
rent
s'pe
rmis
sion
I got
it fr
om a
fam
ilym
embe
r or r
elat
ive
othe
r tha
n m
y pa
rent
s
A st
rang
er b
ough
tit
for m
e
I got
it a
noth
er w
ay
Region 2010Sample: 260
Region 2012Sample: 227
Region 2014Sample: 193
State 2014Sample: 1,233
ALCOHOL ENVIRONMENTAL RISK FACTORS* 2014 DHH Region 7, Grade 6
* Students were initially asked if they drank alcohol in the past year. Students marking “no” were instructed to skip the question regarding sources of obtaining alcohol. Sample size represents the number of youth who chose at least one source of obtaining alcohol. Students who indicated they had not drunk alcohol in the past year are not included in the sample. In the case of smaller sample sizes, caution should be exercised before generalizing results to the entire community.
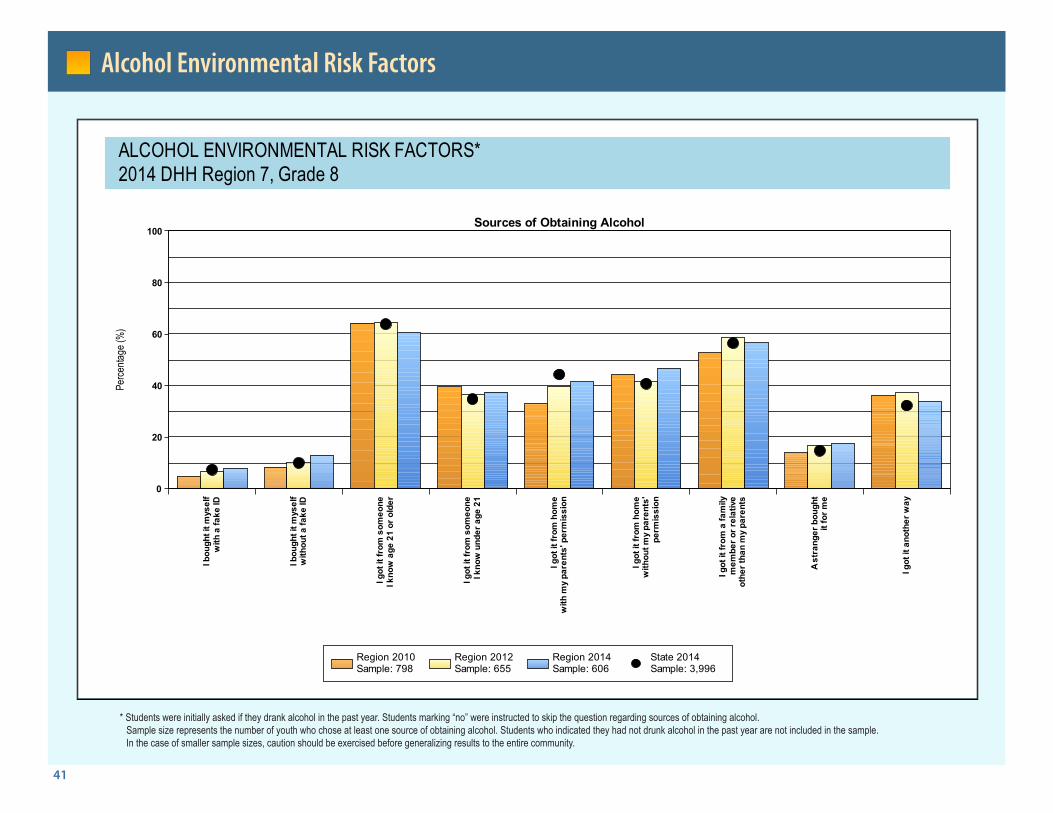
41
Alcohol Environmental Risk Factors
0
20
40
60
80
100
Perce
ntage
(%)
Sources of Obtaining AlcoholI b
ough
t it m
ysel
fw
ith a
fake
ID
I bou
ght i
t mys
elf
with
out a
fake
ID
I got
it fr
om s
omeo
neI k
now
age
21
or o
lder
I got
it fr
om s
omeo
neI k
now
und
er a
ge 2
1
I got
it fr
om h
ome
with
my
pare
nts'
per
mis
sion
I got
it fr
om h
ome
with
out m
y pa
rent
s'pe
rmis
sion
I got
it fr
om a
fam
ilym
embe
r or r
elat
ive
othe
r tha
n m
y pa
rent
s
A st
rang
er b
ough
tit
for m
e
I got
it a
noth
er w
ay
Region 2010Sample: 798
Region 2012Sample: 655
Region 2014Sample: 606
State 2014Sample: 3,996
ALCOHOL ENVIRONMENTAL RISK FACTORS* 2014 DHH Region 7, Grade 8
* Students were initially asked if they drank alcohol in the past year. Students marking “no” were instructed to skip the question regarding sources of obtaining alcohol. Sample size represents the number of youth who chose at least one source of obtaining alcohol. Students who indicated they had not drunk alcohol in the past year are not included in the sample. In the case of smaller sample sizes, caution should be exercised before generalizing results to the entire community.
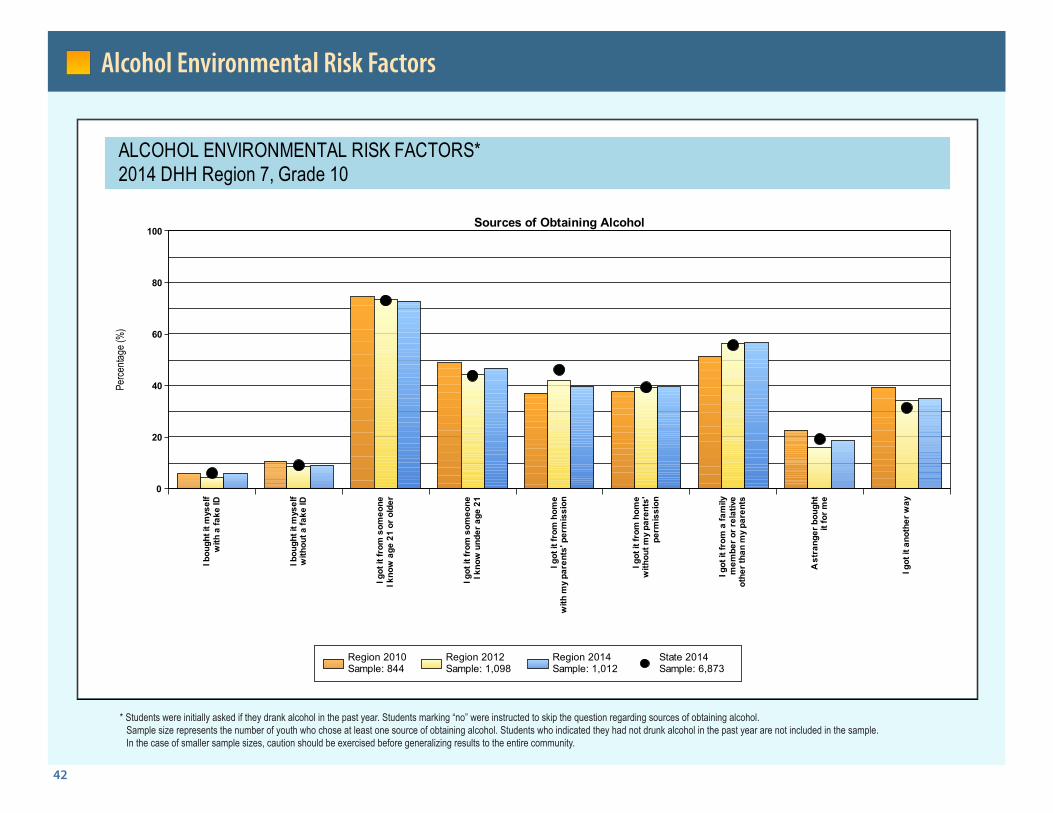
42
Alcohol Environmental Risk Factors
0
20
40
60
80
100
Perce
ntage
(%)
Sources of Obtaining AlcoholI b
ough
t it m
ysel
fw
ith a
fake
ID
I bou
ght i
t mys
elf
with
out a
fake
ID
I got
it fr
om s
omeo
neI k
now
age
21
or o
lder
I got
it fr
om s
omeo
neI k
now
und
er a
ge 2
1
I got
it fr
om h
ome
with
my
pare
nts'
per
mis
sion
I got
it fr
om h
ome
with
out m
y pa
rent
s'pe
rmis
sion
I got
it fr
om a
fam
ilym
embe
r or r
elat
ive
othe
r tha
n m
y pa
rent
s
A st
rang
er b
ough
tit
for m
e
I got
it a
noth
er w
ay
Region 2010Sample: 844
Region 2012Sample: 1,098
Region 2014Sample: 1,012
State 2014Sample: 6,873
ALCOHOL ENVIRONMENTAL RISK FACTORS* 2014 DHH Region 7, Grade 10
* Students were initially asked if they drank alcohol in the past year. Students marking “no” were instructed to skip the question regarding sources of obtaining alcohol. Sample size represents the number of youth who chose at least one source of obtaining alcohol. Students who indicated they had not drunk alcohol in the past year are not included in the sample. In the case of smaller sample sizes, caution should be exercised before generalizing results to the entire community.
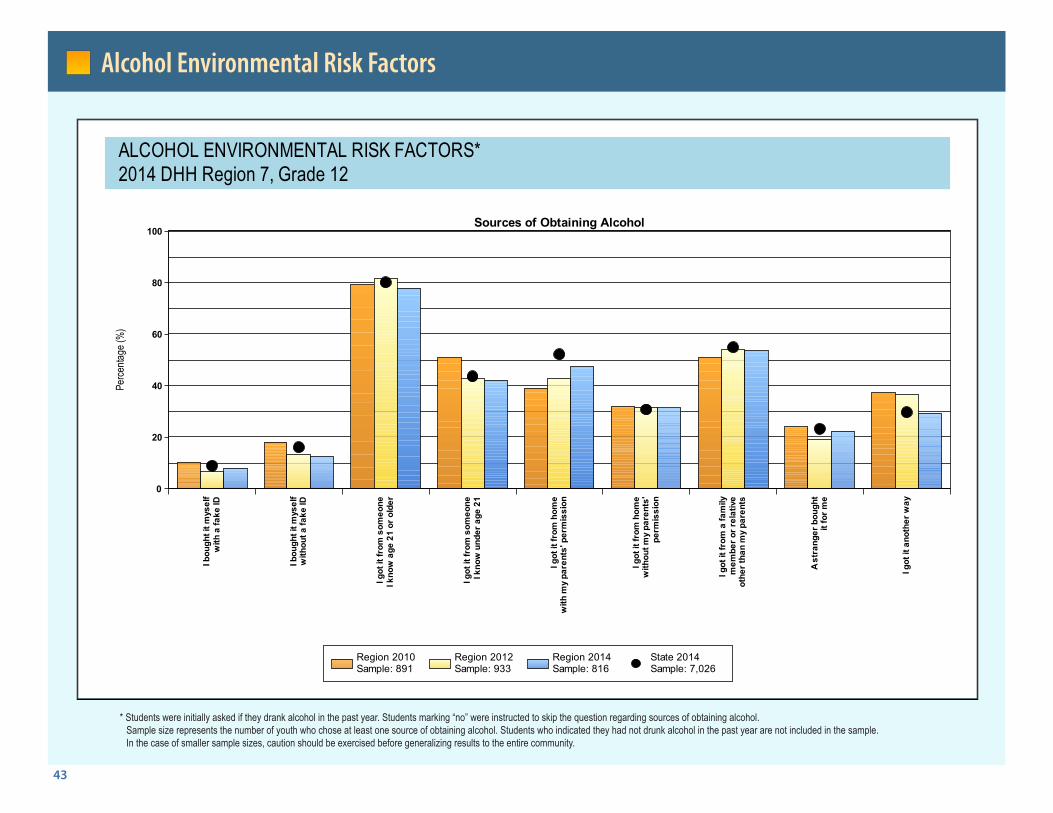
43
Alcohol Environmental Risk Factors
0
20
40
60
80
100
Perce
ntage
(%)
Sources of Obtaining AlcoholI b
ough
t it m
ysel
fw
ith a
fake
ID
I bou
ght i
t mys
elf
with
out a
fake
ID
I got
it fr
om s
omeo
neI k
now
age
21
or o
lder
I got
it fr
om s
omeo
neI k
now
und
er a
ge 2
1
I got
it fr
om h
ome
with
my
pare
nts'
per
mis
sion
I got
it fr
om h
ome
with
out m
y pa
rent
s'pe
rmis
sion
I got
it fr
om a
fam
ilym
embe
r or r
elat
ive
othe
r tha
n m
y pa
rent
s
A st
rang
er b
ough
tit
for m
e
I got
it a
noth
er w
ay
Region 2010Sample: 891
Region 2012Sample: 933
Region 2014Sample: 816
State 2014Sample: 7,026
ALCOHOL ENVIRONMENTAL RISK FACTORS* 2014 DHH Region 7, Grade 12
* Students were initially asked if they drank alcohol in the past year. Students marking “no” were instructed to skip the question regarding sources of obtaining alcohol. Sample size represents the number of youth who chose at least one source of obtaining alcohol. Students who indicated they had not drunk alcohol in the past year are not included in the sample. In the case of smaller sample sizes, caution should be exercised before generalizing results to the entire community.
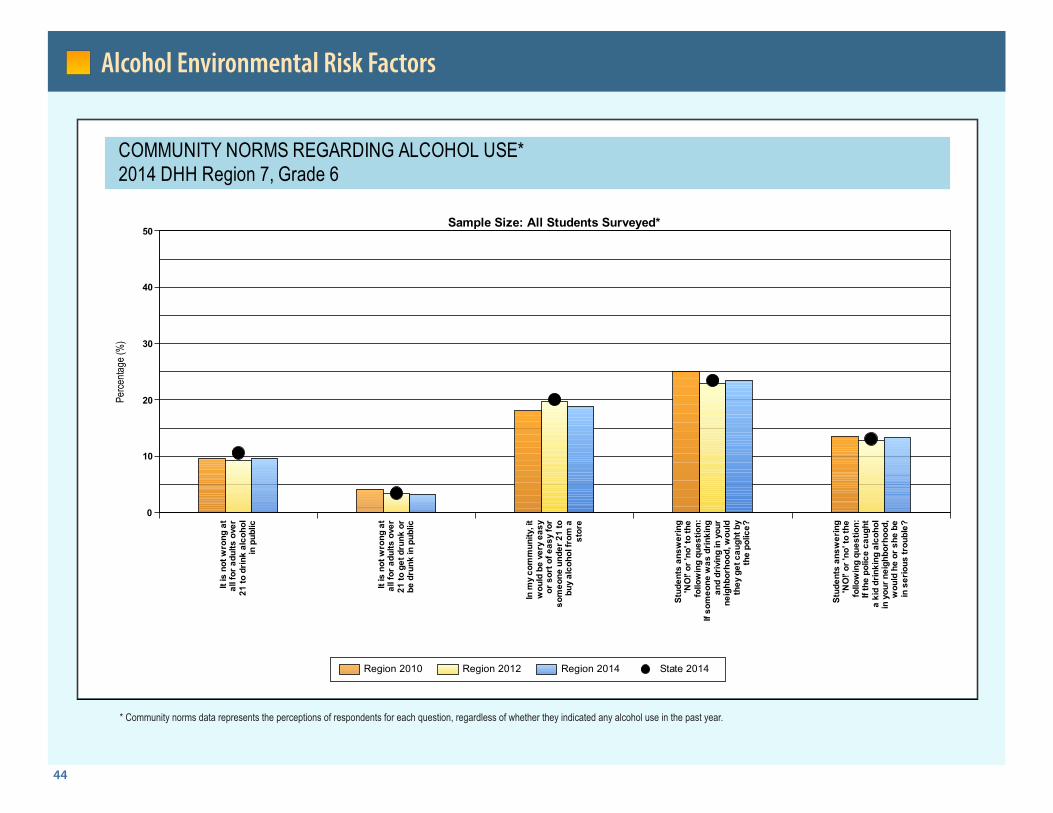
44
Alcohol Environmental Risk Factors
0
10
20
30
40
50
Perce
ntage
(%)
Sample Size: All Students Surveyed*It
is n
ot w
rong
at
all f
or a
dults
ove
r21
to d
rink
alco
hol
in p
ublic
It is
not
wro
ng a
tal
l for
adu
lts o
ver
21 to
get
dru
nk o
rbe
dru
nk in
pub
lic
In m
y co
mm
unity
, it
wou
ld b
e ve
ry e
asy
or s
ort o
f eas
y fo
rso
meo
ne u
nder
21
tobu
y al
coho
l fro
m a
stor
e
Stud
ents
ans
wer
ing
'NO
!' or
'no'
to th
efo
llow
ing
ques
tion:
If so
meo
ne w
as d
rinki
ngan
d dr
ivin
g in
you
rne
ighb
orho
od, w
ould
they
get
cau
ght b
yth
e po
lice?
Stud
ents
ans
wer
ing
'NO
!' or
'no'
to th
efo
llow
ing
ques
ti on:
If th
e po
lice
caug
hta
kid
drin
king
alc
ohol
in y
our n
eigh
borh
ood,
wou
ld h
e or
she
be
in s
erio
us tr
oubl
e?
Region 2010 Region 2012 Region 2014 State 2014
COMMUNITY NORMS REGARDING ALCOHOL USE* 2014 DHH Region 7, Grade 6
* Community norms data represents the perceptions of respondents for each question, regardless of whether they indicated any alcohol use in the past year.

45
Alcohol Environmental Risk Factors
0
10
20
30
40
50
Perce
ntage
(%)
Sample Size: All Students Surveyed*It
is n
ot w
rong
at
all f
or a
dults
ove
r21
to d
rink
alco
hol
in p
ublic
It is
not
wro
ng a
tal
l for
adu
lts o
ver
21 to
get
dru
nk o
rbe
dru
nk in
pub
lic
In m
y co
mm
unity
, it
wou
ld b
e ve
ry e
asy
or s
ort o
f eas
y fo
rso
meo
ne u
nder
21
tobu
y al
coho
l fro
m a
stor
e
Stud
ents
ans
wer
ing
'NO
!' or
'no'
to th
efo
llow
ing
ques
tion:
If so
meo
ne w
as d
rinki
ngan
d dr
ivin
g in
you
rne
ighb
orho
od, w
ould
they
get
cau
ght b
yth
e po
lice?
Stud
ents
ans
wer
ing
'NO
!' or
'no'
to th
efo
llow
ing
ques
ti on:
If th
e po
lice
caug
hta
kid
drin
king
alc
ohol
in y
our n
eigh
borh
ood,
wou
ld h
e or
she
be
in s
erio
us tr
oubl
e?
Region 2010 Region 2012 Region 2014 State 2014
COMMUNITY NORMS REGARDING ALCOHOL USE* 2014 DHH Region 7, Grade 8
* Community norms data represents the perceptions of respondents for each question, regardless of whether they indicated any alcohol use in the past year.
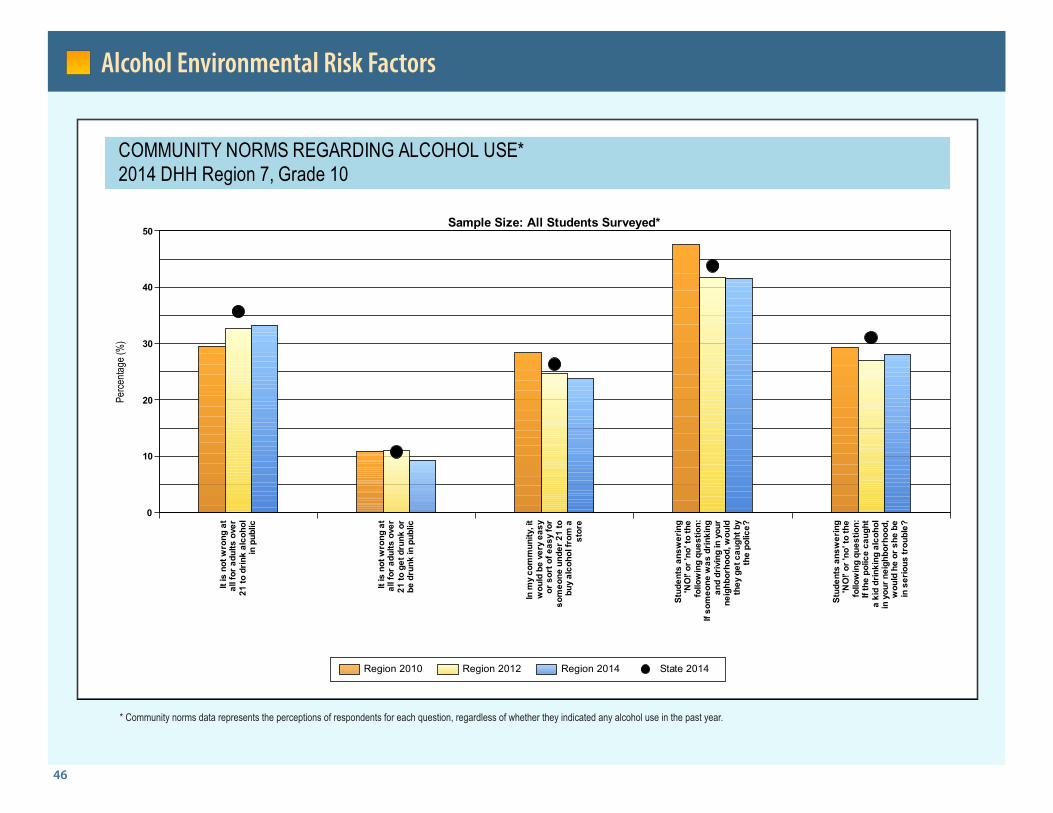
46
Alcohol Environmental Risk Factors
0
10
20
30
40
50
Perce
ntage
(%)
Sample Size: All Students Surveyed*It
is n
ot w
rong
at
all f
or a
dults
ove
r21
to d
rink
alco
hol
in p
ublic
It is
not
wro
ng a
tal
l for
adu
lts o
ver
21 to
get
dru
nk o
rbe
dru
nk in
pub
lic
In m
y co
mm
unity
, it
wou
ld b
e ve
ry e
asy
or s
ort o
f eas
y fo
rso
meo
ne u
nder
21
tobu
y al
coho
l fro
m a
stor
e
Stud
ents
ans
wer
ing
'NO
!' or
'no'
to th
efo
llow
ing
ques
tion:
If so
meo
ne w
as d
rinki
ngan
d dr
ivin
g in
you
rne
ighb
orho
od, w
ould
they
get
cau
ght b
yth
e po
lice?
Stud
ents
ans
wer
ing
'NO
!' or
'no'
to th
efo
llow
ing
ques
ti on:
If th
e po
lice
caug
hta
kid
drin
king
alc
ohol
in y
our n
eigh
borh
ood,
wou
ld h
e or
she
be
in s
erio
us tr
oubl
e?
Region 2010 Region 2012 Region 2014 State 2014
COMMUNITY NORMS REGARDING ALCOHOL USE* 2014 DHH Region 7, Grade 10
* Community norms data represents the perceptions of respondents for each question, regardless of whether they indicated any alcohol use in the past year.
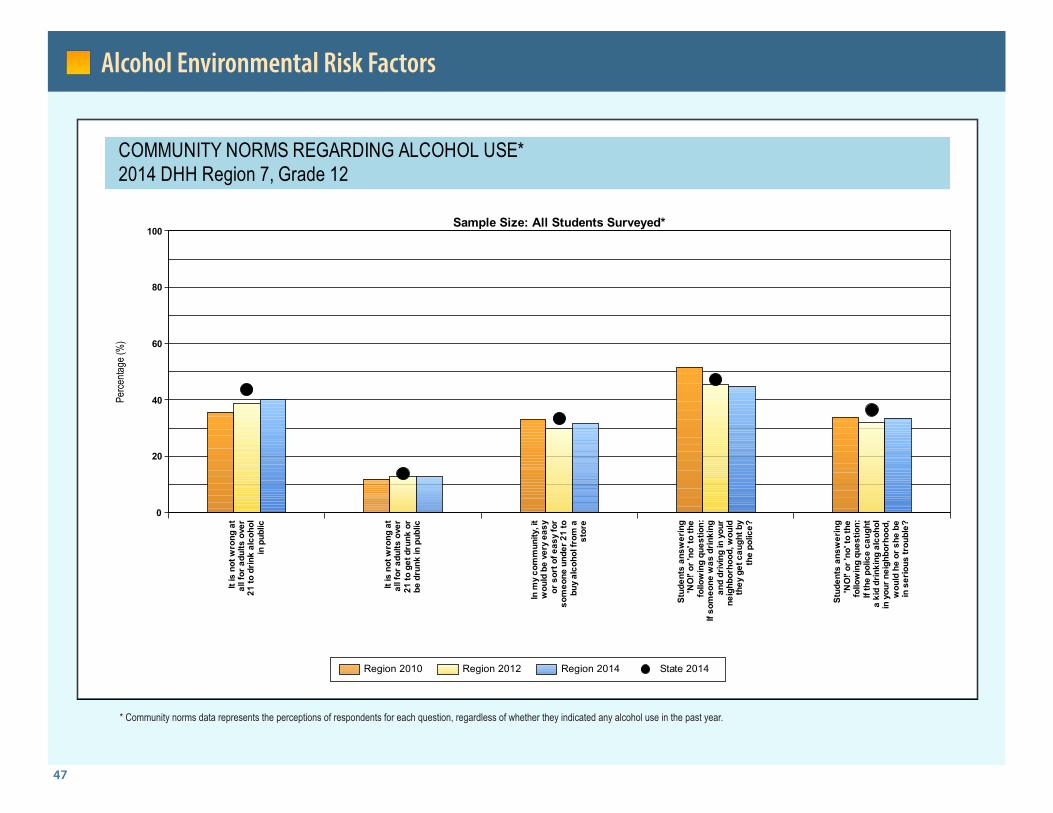
47
Alcohol Environmental Risk Factors
0
20
40
60
80
100
Perce
ntage
(%)
Sample Size: All Students Surveyed*It
is n
ot w
rong
at
all f
or a
dults
ove
r21
to d
rink
alco
hol
in p
ublic
It is
not
wro
ng a
tal
l for
adu
lts o
ver
21 to
get
dru
nk o
rbe
dru
nk in
pub
lic
In m
y co
mm
unity
, it
wou
ld b
e ve
ry e
asy
or s
ort o
f eas
y fo
rso
meo
ne u
nder
21
tobu
y al
coho
l fro
m a
stor
e
Stud
ents
ans
wer
ing
'NO
!' or
'no'
to th
efo
llow
ing
ques
tion:
If so
meo
ne w
as d
rinki
ngan
d dr
ivin
g in
you
rne
ighb
orho
od, w
ould
they
get
cau
ght b
yth
e po
lice?
Stud
ents
ans
wer
ing
'NO
!' or
'no'
to th
efo
llow
ing
ques
tion:
If th
e po
lice
caug
hta
kid
drin
king
alc
ohol
in y
our n
eigh
borh
ood,
wou
ld h
e or
she
be
in s
erio
us tr
oubl
e?
Region 2010 Region 2012 Region 2014 State 2014
COMMUNITY NORMS REGARDING ALCOHOL USE* 2014 DHH Region 7, Grade 12
* Community norms data represents the perceptions of respondents for each question, regardless of whether they indicated any alcohol use in the past year.
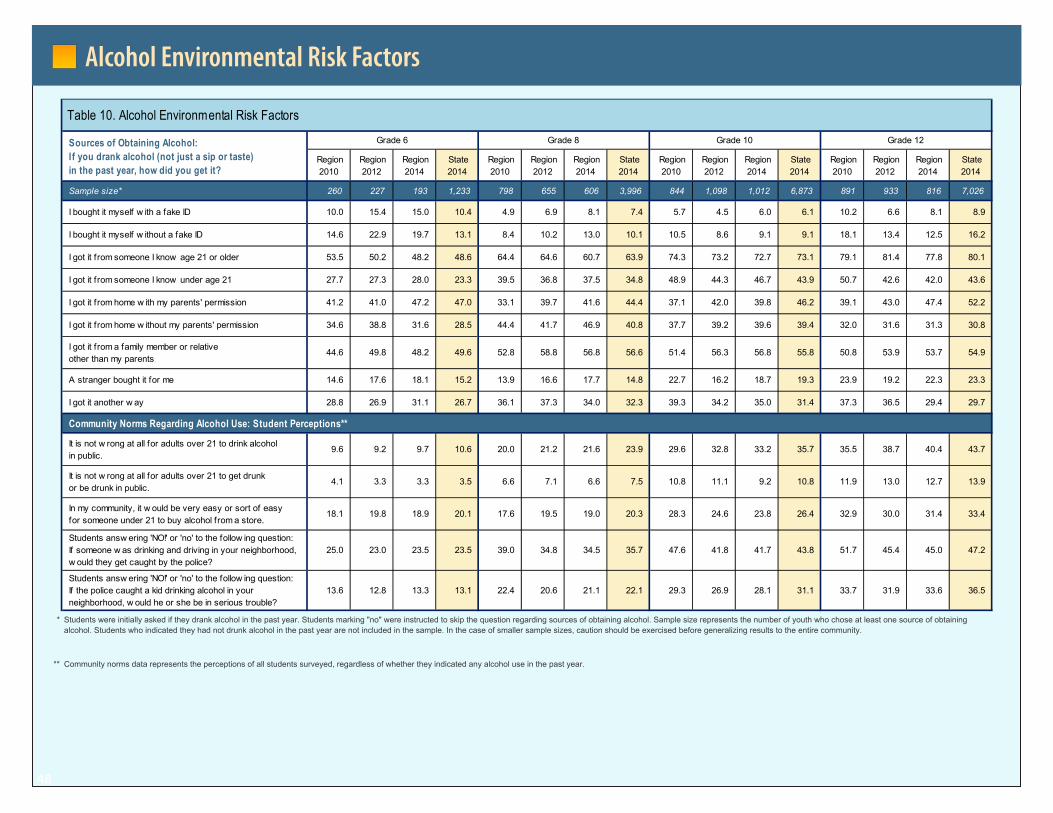
48
Alcohol Environmental Risk Factors
Table 10. Alcohol Environmental Risk Factors
Region2010
Region2012
Region2014
State2014
Region2010
Region2012
Region2014
State2014
Region2010
Region2012
Region2014
State2014
Region2010
Region2012
Region2014
State2014
Sample size* 260 227 193 1,233 798 655 606 3,996 844 1,098 1,012 6,873 891 933 816 7,026
I bought it myself w ith a fake ID 10.0 15.4 15.0 10.4 4.9 6.9 8.1 7.4 5.7 4.5 6.0 6.1 10.2 6.6 8.1 8.9
I bought it myself w ithout a fake ID 14.6 22.9 19.7 13.1 8.4 10.2 13.0 10.1 10.5 8.6 9.1 9.1 18.1 13.4 12.5 16.2
I got it from someone I know age 21 or older 53.5 50.2 48.2 48.6 64.4 64.6 60.7 63.9 74.3 73.2 72.7 73.1 79.1 81.4 77.8 80.1
I got it from someone I know under age 21 27.7 27.3 28.0 23.3 39.5 36.8 37.5 34.8 48.9 44.3 46.7 43.9 50.7 42.6 42.0 43.6
I got it from home w ith my parents' permission 41.2 41.0 47.2 47.0 33.1 39.7 41.6 44.4 37.1 42.0 39.8 46.2 39.1 43.0 47.4 52.2
I got it from home w ithout my parents' permission 34.6 38.8 31.6 28.5 44.4 41.7 46.9 40.8 37.7 39.2 39.6 39.4 32.0 31.6 31.3 30.8
I got it from a family member or relative other than my parents
44.6 49.8 48.2 49.6 52.8 58.8 56.8 56.6 51.4 56.3 56.8 55.8 50.8 53.9 53.7 54.9
A stranger bought it for me 14.6 17.6 18.1 15.2 13.9 16.6 17.7 14.8 22.7 16.2 18.7 19.3 23.9 19.2 22.3 23.3
I got it another w ay 28.8 26.9 31.1 26.7 36.1 37.3 34.0 32.3 39.3 34.2 35.0 31.4 37.3 36.5 29.4 29.7
Community Norms Regarding Alcohol Use: Student Perceptions**
It is not w rong at all for adults over 21 to drink alcohol in public.
9.6 9.2 9.7 10.6 20.0 21.2 21.6 23.9 29.6 32.8 33.2 35.7 35.5 38.7 40.4 43.7
It is not w rong at all for adults over 21 to get drunk or be drunk in public.
4.1 3.3 3.3 3.5 6.6 7.1 6.6 7.5 10.8 11.1 9.2 10.8 11.9 13.0 12.7 13.9
In my community, it w ould be very easy or sort of easy for someone under 21 to buy alcohol from a store.
18.1 19.8 18.9 20.1 17.6 19.5 19.0 20.3 28.3 24.6 23.8 26.4 32.9 30.0 31.4 33.4
Students answ ering 'NO!' or 'no' to the follow ing question: If someone w as drinking and driving in your neighborhood, w ould they get caught by the police?
25.0 23.0 23.5 23.5 39.0 34.8 34.5 35.7 47.6 41.8 41.7 43.8 51.7 45.4 45.0 47.2
Students answ ering 'NO!' or 'no' to the follow ing question: If the police caught a kid drinking alcohol in your neighborhood, w ould he or she be in serious trouble?
13.6 12.8 13.3 13.1 22.4 20.6 21.1 22.1 29.3 26.9 28.1 31.1 33.7 31.9 33.6 36.5
*
** Community norms data represents the perceptions of all students surveyed, regardless of whether they indicated any alcohol use in the past year.
Sources of Obtaining Alcohol: I f you drank alcohol (not just a sip or taste) in the past year, how did you get it?
Grade 6 Grade 8 Grade 10 Grade 12
Students were initially asked if they drank alcohol in the past year. Students marking "no" were instructed to skip the question regarding sources of obtaining alcohol. Sample size represents the number of youth who chose at least one source of obtaining alcohol. Students who indicated they had not drunk alcohol in the past year are not included in the sample. In the case of smaller sample sizes, caution should be exercised before generalizing results to the entire community.
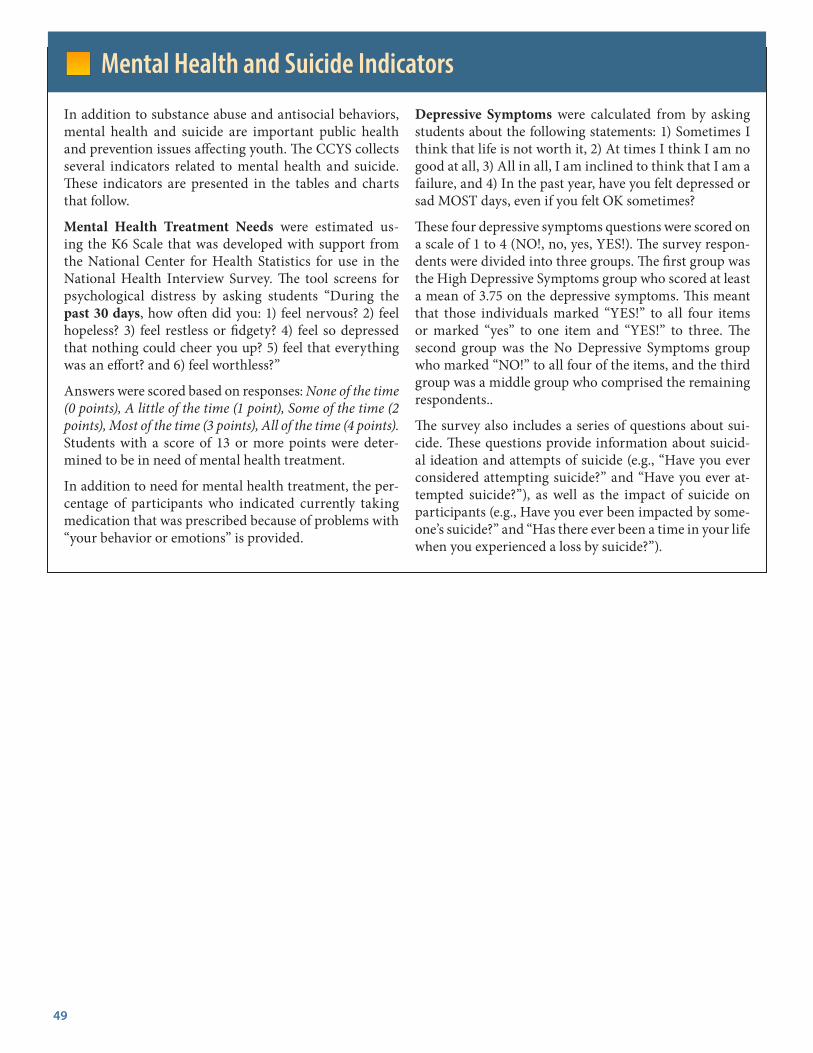
49
In addition to substance abuse and antisocial behaviors, mental health and suicide are important public health and prevention issues affecting youth. The CCYS collects several indicators related to mental health and suicide. These indicators are presented in the tables and charts that follow.
Mental Health Treatment Needs were estimated us-ing the K6 Scale that was developed with support from the National Center for Health Statistics for use in the National Health Interview Survey. The tool screens for psychological distress by asking students “During the past 30 days, how often did you: 1) feel nervous? 2) feel hopeless? 3) feel restless or fidgety? 4) feel so depressed that nothing could cheer you up? 5) feel that everything was an effort? and 6) feel worthless?”
Answers were scored based on responses: None of the time (0 points), A little of the time (1 point), Some of the time (2 points), Most of the time (3 points), All of the time (4 points). Students with a score of 13 or more points were deter-mined to be in need of mental health treatment.
In addition to need for mental health treatment, the per-centage of participants who indicated currently taking medication that was prescribed because of problems with “your behavior or emotions” is provided.
Depressive Symptoms were calculated from by asking students about the following statements: 1) Sometimes I think that life is not worth it, 2) At times I think I am no good at all, 3) All in all, I am inclined to think that I am a failure, and 4) In the past year, have you felt depressed or sad MOST days, even if you felt OK sometimes?
These four depressive symptoms questions were scored on a scale of 1 to 4 (NO!, no, yes, YES!). The survey respon-dents were divided into three groups. The first group was the High Depressive Symptoms group who scored at least a mean of 3.75 on the depressive symptoms. This meant that those individuals marked “YES!” to all four items or marked “yes” to one item and “YES!” to three. The second group was the No Depressive Symptoms group who marked “NO!” to all four of the items, and the third group was a middle group who comprised the remaining respondents..
The survey also includes a series of questions about sui-cide. These questions provide information about suicid-al ideation and attempts of suicide (e.g., “Have you ever considered attempting suicide?” and “Have you ever at-tempted suicide?”), as well as the impact of suicide on participants (e.g., Have you ever been impacted by some-one’s suicide?” and “Has there ever been a time in your life when you experienced a loss by suicide?”).
Mental Health and Suicide Indicators
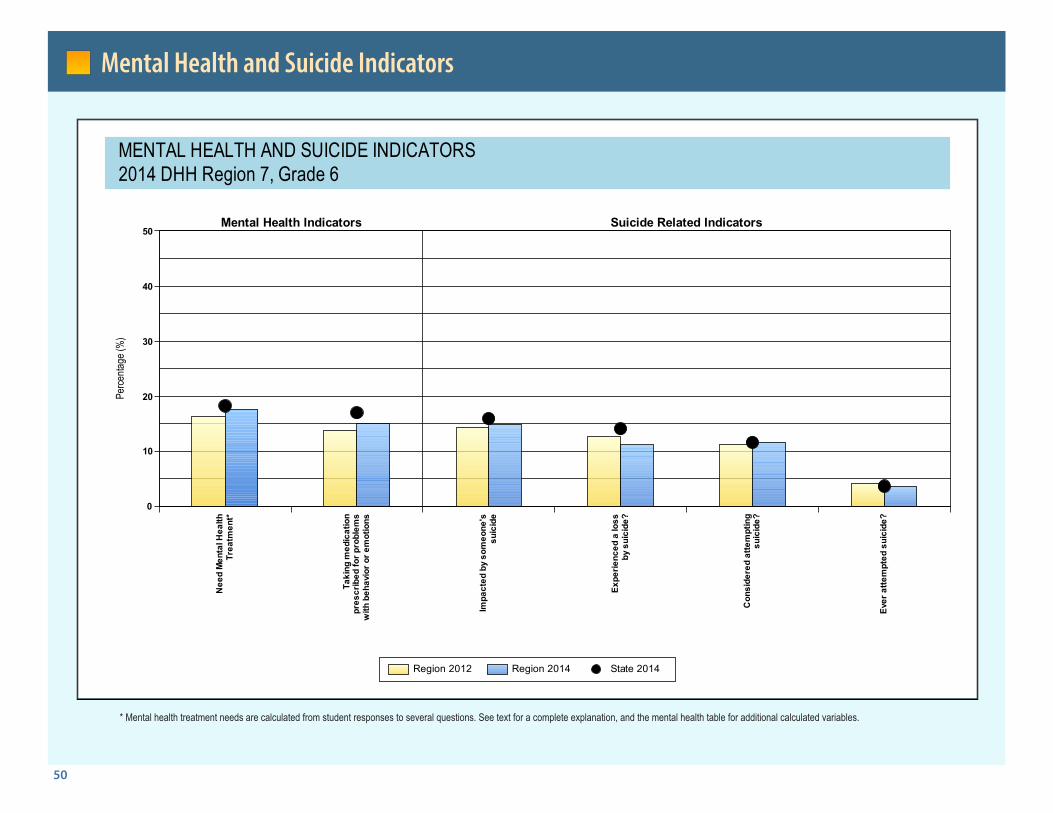
50
Mental Health and Suicide Indicators
0
10
20
30
40
50
Perce
ntage
(%)
Mental Health Indicators Suicide Related IndicatorsN
eed
Men
tal H
ealth
Trea
tmen
t*
Taki
ng m
edic
atio
npr
escr
ibed
for p
robl
ems
with
beh
avio
r or e
mot
ions
Impa
cted
by
som
eone
'ssu
icid
e
Expe
rienc
ed a
loss
by s
uici
de?
Con
side
red
atte
mpt
ing
suic
ide?
Ever
atte
mpt
ed s
uici
de?
Region 2012 Region 2014 State 2014
MENTAL HEALTH AND SUICIDE INDICATORS 2014 DHH Region 7, Grade 6
* Mental health treatment needs are calculated from student responses to several questions. See text for a complete explanation, and the mental health table for additional calculated variables.
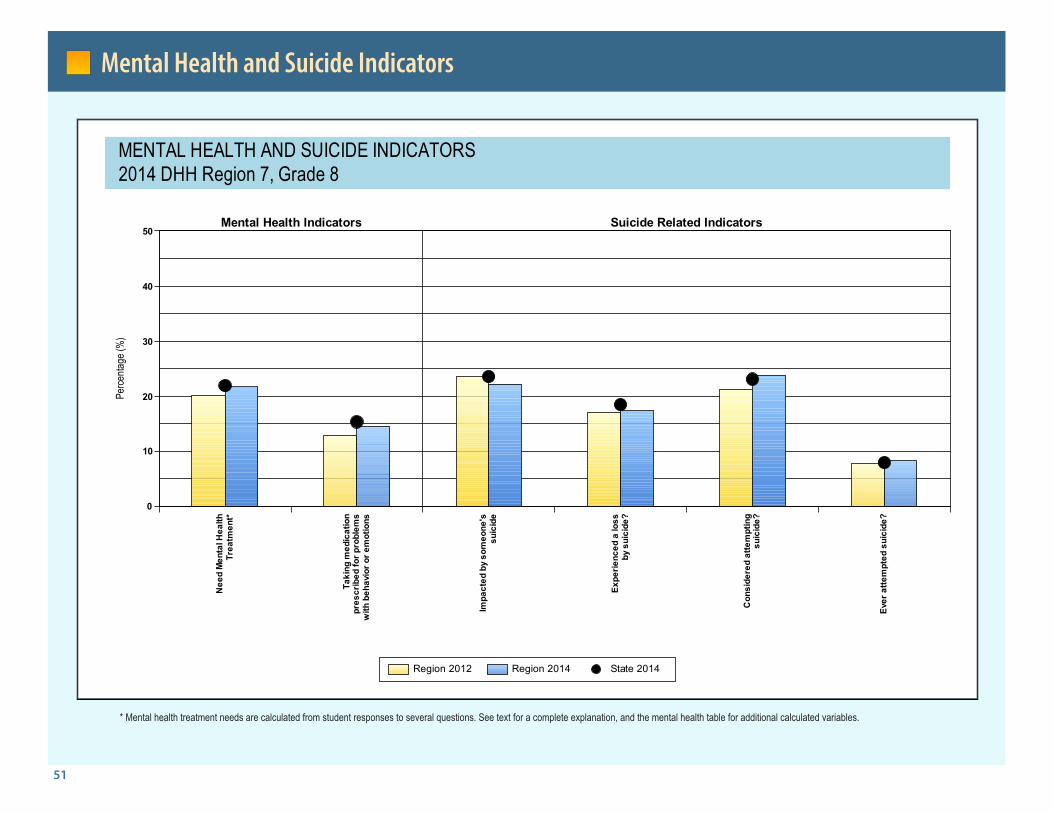
51
Mental Health and Suicide Indicators
0
10
20
30
40
50
Perce
ntage
(%)
Mental Health Indicators Suicide Related IndicatorsN
eed
Men
tal H
ealth
Trea
tmen
t*
Taki
ng m
edic
atio
npr
escr
ibed
for p
robl
ems
with
beh
avio
r or e
mot
ions
Impa
cted
by
som
eone
'ssu
icid
e
Expe
rienc
ed a
loss
by s
uici
de?
Con
side
red
atte
mpt
ing
suic
ide?
Ever
atte
mpt
ed s
uici
de?
Region 2012 Region 2014 State 2014
MENTAL HEALTH AND SUICIDE INDICATORS 2014 DHH Region 7, Grade 8
* Mental health treatment needs are calculated from student responses to several questions. See text for a complete explanation, and the mental health table for additional calculated variables.

52
Mental Health and Suicide Indicators
0
10
20
30
40
50
Perce
ntage
(%)
Mental Health Indicators Suicide Related IndicatorsN
eed
Men
tal H
ealth
Trea
tmen
t*
Taki
ng m
edic
atio
npr
escr
ibed
for p
robl
ems
with
beh
avio
r or e
mot
ions
Impa
cted
by
som
eone
'ssu
icid
e
Expe
rienc
ed a
loss
by s
uici
de?
Con
side
red
atte
mpt
ing
suic
ide?
Ever
atte
mpt
ed s
uici
de?
Region 2012 Region 2014 State 2014
MENTAL HEALTH AND SUICIDE INDICATORS 2014 DHH Region 7, Grade 10
* Mental health treatment needs are calculated from student responses to several questions. See text for a complete explanation, and the mental health table for additional calculated variables.

53
Mental Health and Suicide Indicators
0
10
20
30
40
50
Perce
ntage
(%)
Mental Health Indicators Suicide Related IndicatorsN
eed
Men
tal H
ealth
Trea
tmen
t*
Taki
ng m
edic
atio
npr
escr
ibed
for p
robl
ems
with
beh
avio
r or e
mot
ions
Impa
cted
by
som
eone
'ssu
icid
e
Expe
rienc
ed a
loss
by s
uici
de?
Con
side
red
atte
mpt
ing
suic
ide?
Ever
atte
mpt
ed s
uici
de?
Region 2012 Region 2014 State 2014
MENTAL HEALTH AND SUICIDE INDICATORS 2014 DHH Region 7, Grade 12
* Mental health treatment needs are calculated from student responses to several questions. See text for a complete explanation, and the mental health table for additional calculated variables.
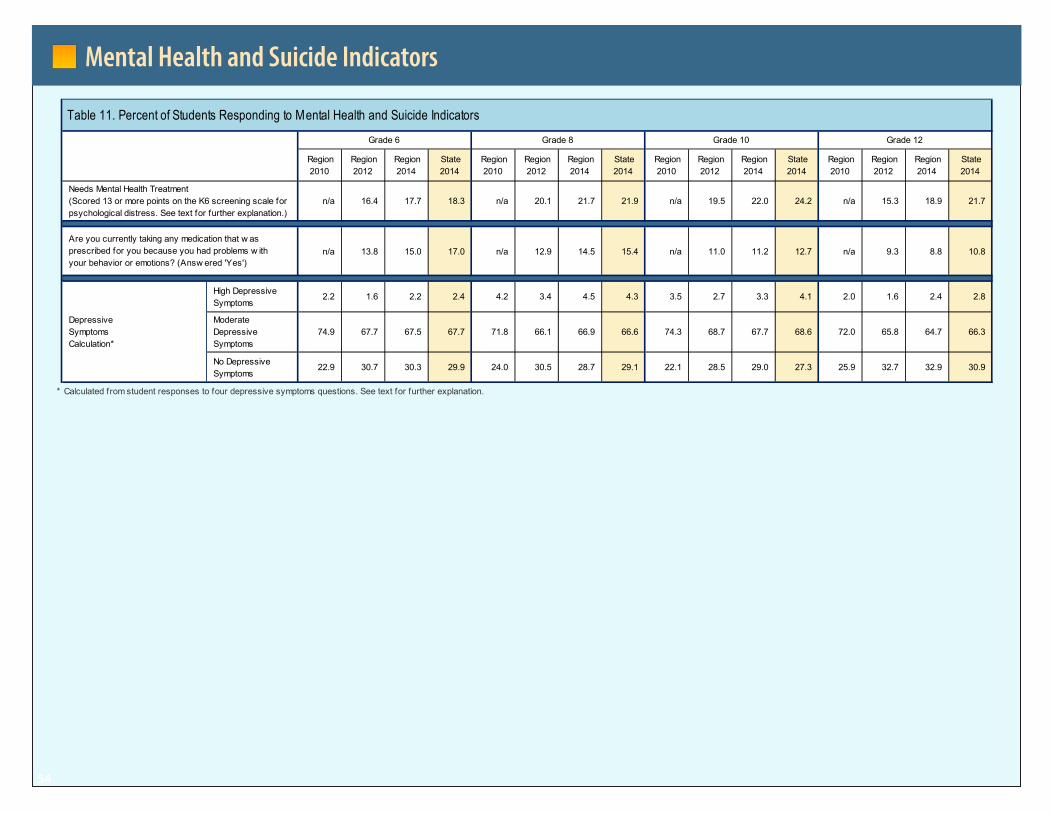
54
Mental Health and Suicide Indicators
Table 11. Percent of Students Responding to Mental Health and Suicide Indicators
Region2010
Region2012
Region2014
State2014
Region2010
Region2012
Region2014
State2014
Region2010
Region2012
Region2014
State2014
Region2010
Region2012
Region2014
State2014
n/a 16.4 17.7 18.3 n/a 20.1 21.7 21.9 n/a 19.5 22.0 24.2 n/a 15.3 18.9 21.7
blank
n/a 13.8 15.0 17.0 n/a 12.9 14.5 15.4 n/a 11.0 11.2 12.7 n/a 9.3 8.8 10.8
blank High Depressive Symptoms
2.2 1.6 2.2 2.4 4.2 3.4 4.5 4.3 3.5 2.7 3.3 4.1 2.0 1.6 2.4 2.8
Moderate Depressive Symptoms
74.9 67.7 67.5 67.7 71.8 66.1 66.9 66.6 74.3 68.7 67.7 68.6 72.0 65.8 64.7 66.3
No Depressive Symptoms
22.9 30.7 30.3 29.9 24.0 30.5 28.7 29.1 22.1 28.5 29.0 27.3 25.9 32.7 32.9 30.9
*
Are you currently taking any medication that w as prescribed for you because you had problems w ith your behavior or emotions? (Answ ered 'Yes')
Depressive Symptoms Calculation*
Calculated from student responses to four depressive symptoms questions. See text for further explanation.
Grade 6 Grade 8 Grade 10 Grade 12
Needs Mental Health Treatment (Scored 13 or more points on the K6 screening scale for psychological distress. See text for further explanation.)
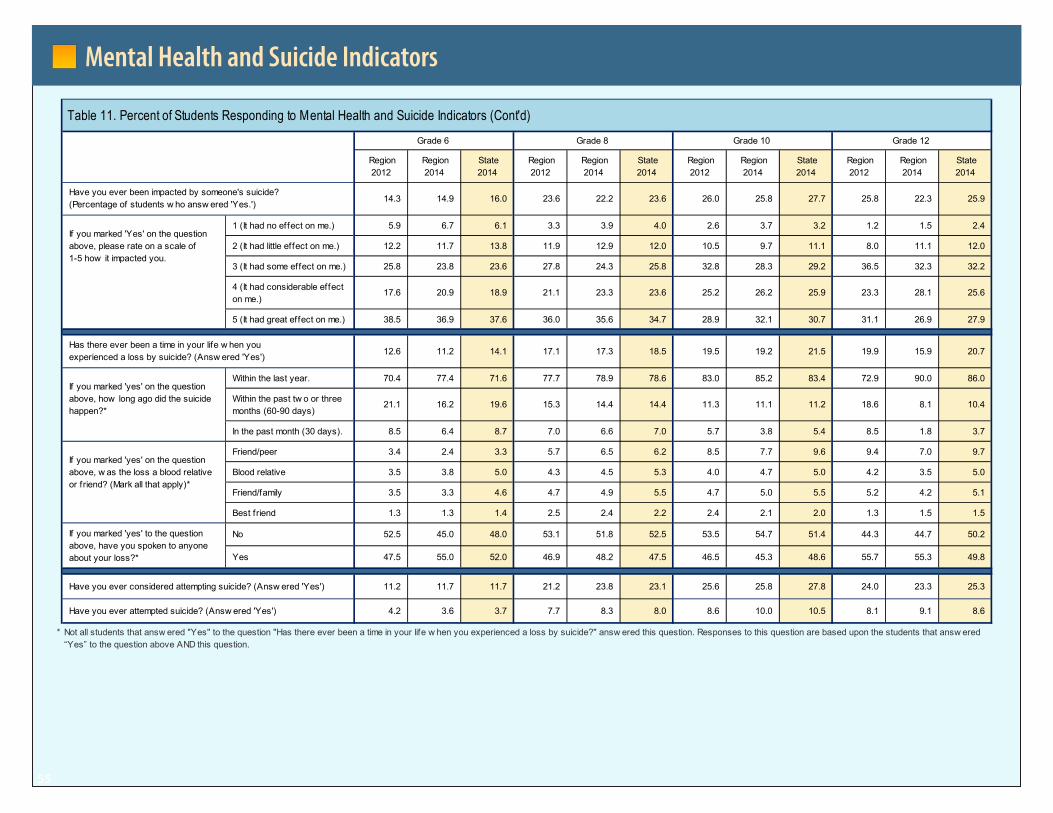
55
Mental Health and Suicide Indicators
Table 11. Percent of Students Responding to Mental Health and Suicide Indicators (Cont'd)
Region2012
Region2014
State2014
Region2012
Region2014
State2014
Region2012
Region2014
State2014
Region2012
Region2014
State2014
14.3 14.9 16.0 23.6 22.2 23.6 26.0 25.8 27.7 25.8 22.3 25.9
1 (It had no effect on me.) 5.9 6.7 6.1 3.3 3.9 4.0 2.6 3.7 3.2 1.2 1.5 2.4
2 (It had little effect on me.) 12.2 11.7 13.8 11.9 12.9 12.0 10.5 9.7 11.1 8.0 11.1 12.0
3 (It had some effect on me.) 25.8 23.8 23.6 27.8 24.3 25.8 32.8 28.3 29.2 36.5 32.3 32.2
4 (It had considerable effect on me.)
17.6 20.9 18.9 21.1 23.3 23.6 25.2 26.2 25.9 23.3 28.1 25.6
5 (It had great effect on me.) 38.5 36.9 37.6 36.0 35.6 34.7 28.9 32.1 30.7 31.1 26.9 27.9 blank
12.6 11.2 14.1 17.1 17.3 18.5 19.5 19.2 21.5 19.9 15.9 20.7
Within the last year. 70.4 77.4 71.6 77.7 78.9 78.6 83.0 85.2 83.4 72.9 90.0 86.0
Within the past tw o or three months (60-90 days)
21.1 16.2 19.6 15.3 14.4 14.4 11.3 11.1 11.2 18.6 8.1 10.4
In the past month (30 days). 8.5 6.4 8.7 7.0 6.6 7.0 5.7 3.8 5.4 8.5 1.8 3.7
Friend/peer 3.4 2.4 3.3 5.7 6.5 6.2 8.5 7.7 9.6 9.4 7.0 9.7
Blood relative 3.5 3.8 5.0 4.3 4.5 5.3 4.0 4.7 5.0 4.2 3.5 5.0
Friend/family 3.5 3.3 4.6 4.7 4.9 5.5 4.7 5.0 5.5 5.2 4.2 5.1
Best friend 1.3 1.3 1.4 2.5 2.4 2.2 2.4 2.1 2.0 1.3 1.5 1.5
No 52.5 45.0 48.0 53.1 51.8 52.5 53.5 54.7 51.4 44.3 44.7 50.2
Yes 47.5 55.0 52.0 46.9 48.2 47.5 46.5 45.3 48.6 55.7 55.3 49.8
blank 11.2 11.7 11.7 21.2 23.8 23.1 25.6 25.8 27.8 24.0 23.3 25.3
4.2 3.6 3.7 7.7 8.3 8.0 8.6 10.0 10.5 8.1 9.1 8.6
*
Have you ever attempted suicide? (Answ ered 'Yes')
Not all students that answ ered "Yes" to the question "Has there ever been a time in your life w hen you experienced a loss by suicide?" answ ered this question. Responses to this question are based upon the students that answ ered “Yes” to the question above AND this question.
If you marked 'Yes' on the question above, please rate on a scale of 1-5 how it impacted you.
Has there ever been a time in your life w hen you experienced a loss by suicide? (Answ ered 'Yes')
If you marked 'yes' on the question above, how long ago did the suicide happen?*
If you marked 'yes' on the question above, w as the loss a blood relative or friend? (Mark all that apply)*
If you marked 'yes' to the question above, have you spoken to anyone about your loss?*
Have you ever considered attempting suicide? (Answ ered 'Yes')
Grade 6 Grade 8 Grade 10 Grade 12
Have you ever been impacted by someone's suicide? (Percentage of students w ho answ ered 'Yes.')
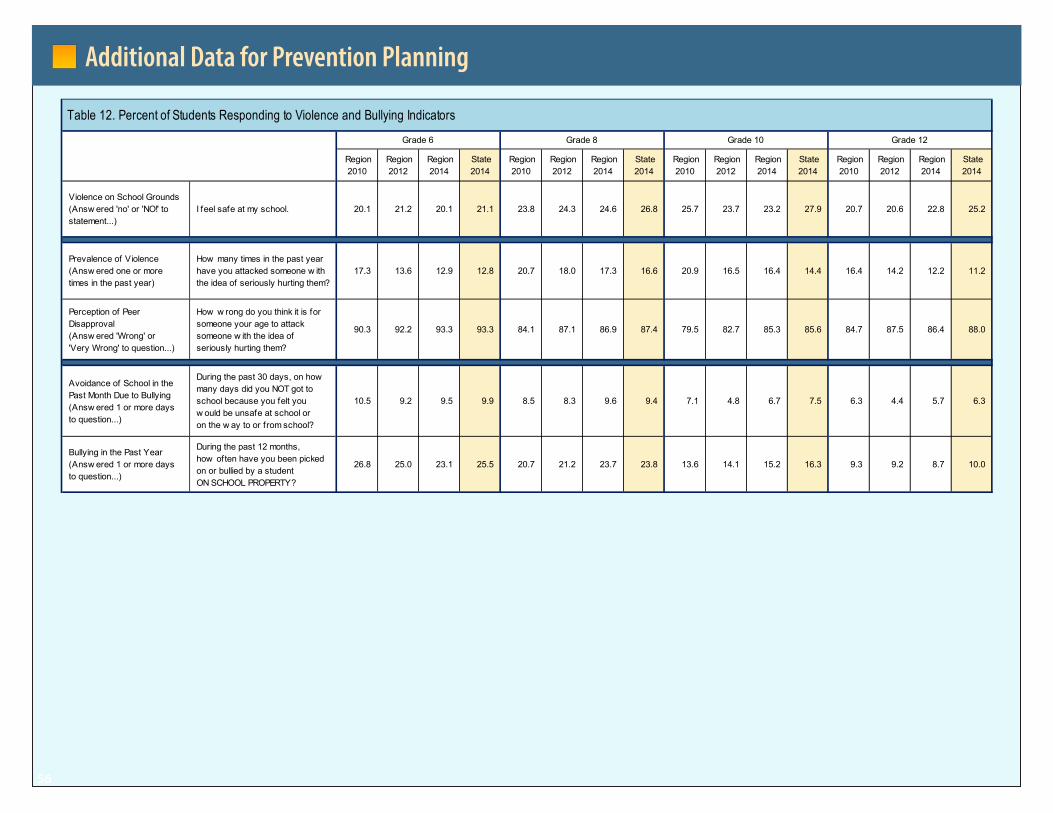
56
Additional Data for Prevention Planning
Table 12. Percent of Students Responding to Violence and Bullying Indicators
Region2010
Region2012
Region2014
State2014
Region2010
Region2012
Region2014
State2014
Region2010
Region2012
Region2014
State2014
Region2010
Region2012
Region2014
State2014
Violence on School Grounds (Answ ered 'no' or 'NO!' to statement...)
I feel safe at my school. 20.1 21.2 20.1 21.1 23.8 24.3 24.6 26.8 25.7 23.7 23.2 27.9 20.7 20.6 22.8 25.2
blank Prevalence of Violence (Answ ered one or more times in the past year)
How many times in the past year have you attacked someone w ith the idea of seriously hurting them?
17.3 13.6 12.9 12.8 20.7 18.0 17.3 16.6 20.9 16.5 16.4 14.4 16.4 14.2 12.2 11.2
Perception of Peer Disapproval (Answ ered 'Wrong' or 'Very Wrong' to question...)
How w rong do you think it is for someone your age to attack someone w ith the idea of seriously hurting them?
90.3 92.2 93.3 93.3 84.1 87.1 86.9 87.4 79.5 82.7 85.3 85.6 84.7 87.5 86.4 88.0
blank
Avoidance of School in the Past Month Due to Bullying (Answ ered 1 or more days to question...)
During the past 30 days, on how many days did you NOT got to school because you felt you w ould be unsafe at school or on the w ay to or from school?
10.5 9.2 9.5 9.9 8.5 8.3 9.6 9.4 7.1 4.8 6.7 7.5 6.3 4.4 5.7 6.3
Bullying in the Past Year (Answ ered 1 or more days to question...)
During the past 12 months, how often have you been picked on or bullied by a student ON SCHOOL PROPERTY?
26.8 25.0 23.1 25.5 20.7 21.2 23.7 23.8 13.6 14.1 15.2 16.3 9.3 9.2 8.7 10.0
Grade 6 Grade 8 Grade 10 Grade 12
Violence and Bullying Indicators, Perceived Perception of Risk, Parent/Peer Disapproval, and 30-Day Use
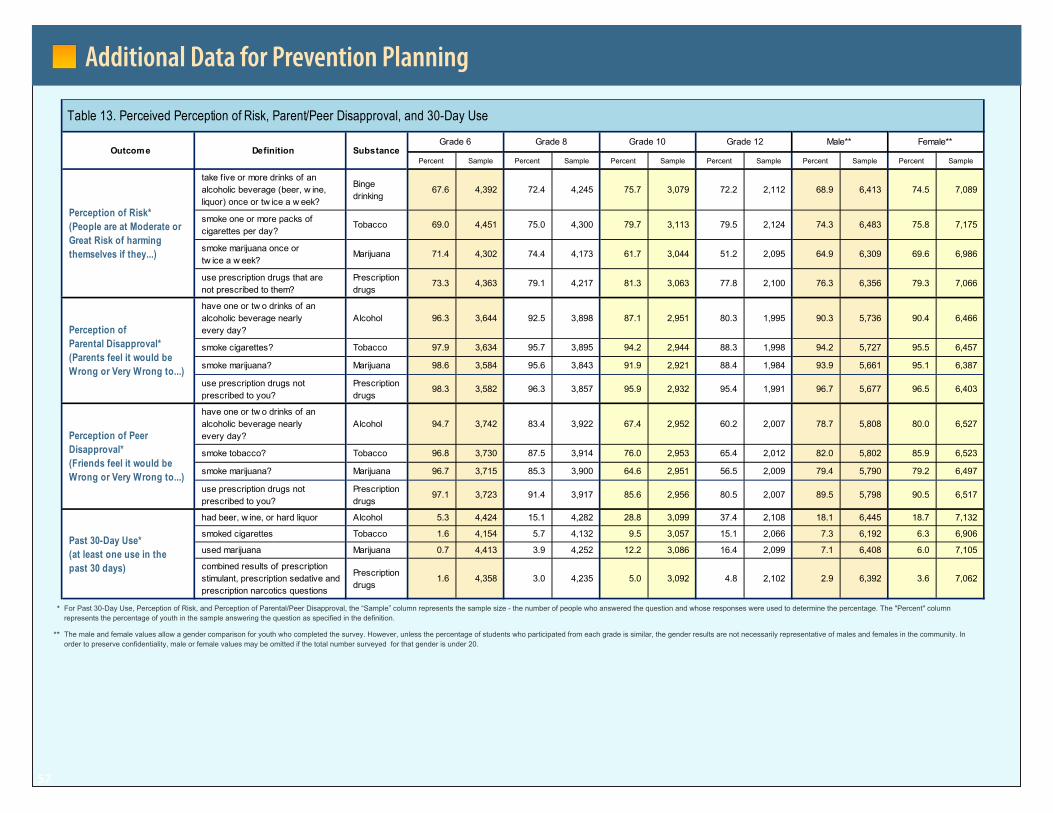
57
Additional Data for Prevention Planning
Table 13. Perceived Perception of Risk, Parent/Peer Disapproval, and 30-Day Use
Percent Sample Percent Sample Percent Sample Percent Sample Percent Sample Percent Sample
take f ive or more drinks of an alcoholic beverage (beer, w ine, liquor) once or tw ice a w eek?
Binge drinking
67.6 4,392 72.4 4,245 75.7 3,079 72.2 2,112 68.9 6,413 74.5 7,089
smoke one or more packs of cigarettes per day?
Tobacco 69.0 4,451 75.0 4,300 79.7 3,113 79.5 2,124 74.3 6,483 75.8 7,175
smoke marijuana once or tw ice a w eek?
Marijuana 71.4 4,302 74.4 4,173 61.7 3,044 51.2 2,095 64.9 6,309 69.6 6,986
use prescription drugs that are not prescribed to them?
Prescription drugs
73.3 4,363 79.1 4,217 81.3 3,063 77.8 2,100 76.3 6,356 79.3 7,066
have one or tw o drinks of an alcoholic beverage nearly every day?
Alcohol 96.3 3,644 92.5 3,898 87.1 2,951 80.3 1,995 90.3 5,736 90.4 6,466
smoke cigarettes? Tobacco 97.9 3,634 95.7 3,895 94.2 2,944 88.3 1,998 94.2 5,727 95.5 6,457
smoke marijuana? Marijuana 98.6 3,584 95.6 3,843 91.9 2,921 88.4 1,984 93.9 5,661 95.1 6,387
use prescription drugs not prescribed to you?
Prescription drugs
98.3 3,582 96.3 3,857 95.9 2,932 95.4 1,991 96.7 5,677 96.5 6,403
have one or tw o drinks of an alcoholic beverage nearly every day?
Alcohol 94.7 3,742 83.4 3,922 67.4 2,952 60.2 2,007 78.7 5,808 80.0 6,527
smoke tobacco? Tobacco 96.8 3,730 87.5 3,914 76.0 2,953 65.4 2,012 82.0 5,802 85.9 6,523
smoke marijuana? Marijuana 96.7 3,715 85.3 3,900 64.6 2,951 56.5 2,009 79.4 5,790 79.2 6,497
use prescription drugs not prescribed to you?
Prescription drugs
97.1 3,723 91.4 3,917 85.6 2,956 80.5 2,007 89.5 5,798 90.5 6,517
had beer, w ine, or hard liquor Alcohol 5.3 4,424 15.1 4,282 28.8 3,099 37.4 2,108 18.1 6,445 18.7 7,132
smoked cigarettes Tobacco 1.6 4,154 5.7 4,132 9.5 3,057 15.1 2,066 7.3 6,192 6.3 6,906
used marijuana Marijuana 0.7 4,413 3.9 4,252 12.2 3,086 16.4 2,099 7.1 6,408 6.0 7,105
combined results of prescription stimulant, prescription sedative and prescription narcotics questions
Prescription drugs
1.6 4,358 3.0 4,235 5.0 3,092 4.8 2,102 2.9 6,392 3.6 7,062
*
**
Past 30-Day Use* (at least one use in the past 30 days)
For Past 30-Day Use, Perception of Risk, and Perception of Parental/Peer Disapproval, the “Sample” column represents the sample size - the number of people who answered the question and whose responses were used to determine the percentage. The "Percent" column represents the percentage of youth in the sample answering the question as specified in the definition.
The male and female values allow a gender comparison for youth who completed the survey. However, unless the percentage of students who participated from each grade is similar, the gender results are not necessarily representative of males and females in the community. In order to preserve confidentiality, male or female values may be omitted if the total number surveyed for that gender is under 20.
Grade 12 Male** Female**
Perception of Risk* (People are at Moderate or Great Risk of harming themselves if they...)
Perception of Parental Disapproval* (Parents feel it would be Wrong or Very Wrong to...)
Perception of Peer Disapproval* (Friends feel it would be Wrong or Very Wrong to...)
Outcome Definition Substance Grade 6 Grade 8 Grade 10
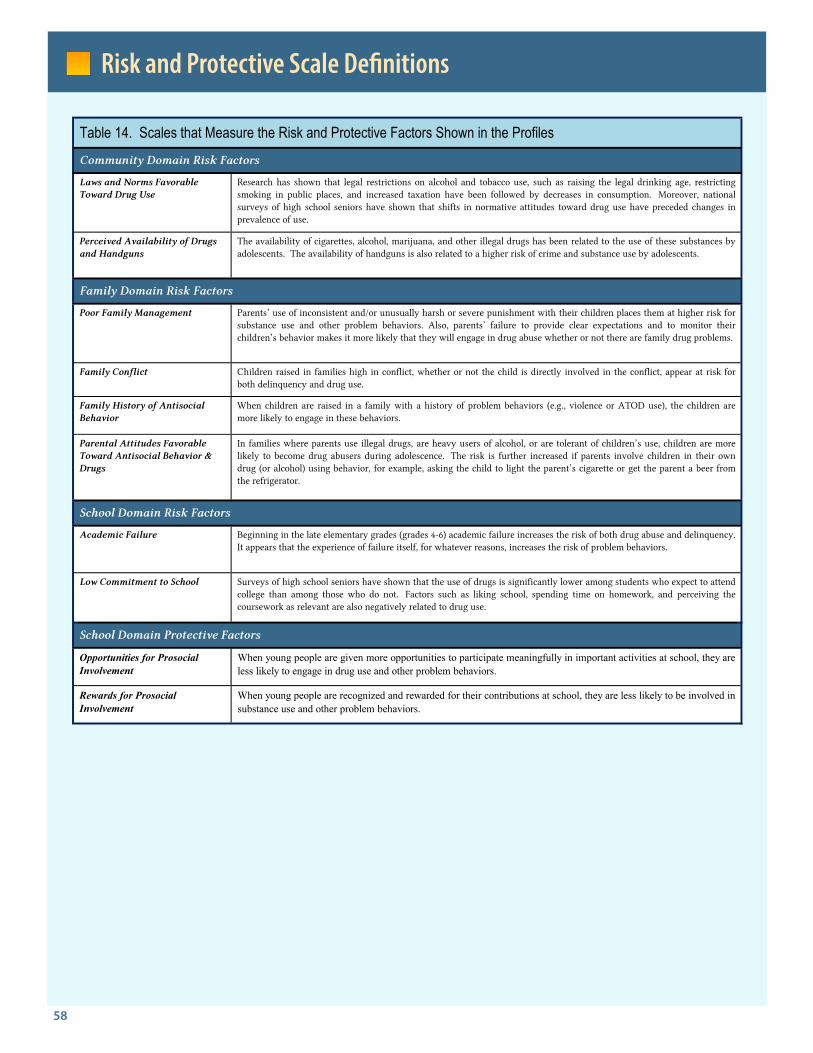
58
Risk and Protective Scale Definitions
1 Laws and Norms Favorable Toward Drug Use
Research has shown that legal restrictions on alcohol and tobacco use, such as raising the legal drinking age, restrictingsmoking in public places, and increased taxation have been followed by decreases in consumption. Moreover, nationalsurveys of high school seniors have shown that shifts in normative attitudes toward drug use have preceded changes inprevalence of use.
1 Perceived Availability of Drugs and Handguns
The availability of cigarettes, alcohol, marijuana, and other illegal drugs has been related to the use of these substances byadolescents. The availability of handguns is also related to a higher risk of crime and substance use by adolescents.
1 Poor Family Management Parents’ use of inconsistent and/or unusually harsh or severe punishment with their children places them at higher risk forsubstance use and other problem behaviors. Also, parents’ failure to provide clear expectations and to monitor theirchildren’s behavior makes it more likely that they will engage in drug abuse whether or not there are family drug problems.
1 Family Conflict Children raised in families high in conflict, whether or not the child is directly involved in the conflict, appear at risk forboth delinquency and drug use.
1 Family History of Antisocial Behavior
When children are raised in a family with a history of problem behaviors (e.g., violence or ATOD use), the children aremore likely to engage in these behaviors.
1 Parental Attitudes Favorable Toward Antisocial Behavior & Drugs
In families where parents use illegal drugs, are heavy users of alcohol, or are tolerant of children’s use, children are morelikely to become drug abusers during adolescence. The risk is further increased if parents involve children in their owndrug (or alcohol) using behavior, for example, asking the child to light the parent’s cigarette or get the parent a beer fromthe refrigerator.
1 Academic Failure Beginning in the late elementary grades (grades 4-6) academic failure increases the risk of both drug abuse and delinquency.It appears that the experience of failure itself, for whatever reasons, increases the risk of problem behaviors.
1 Low Commitment to School Surveys of high school seniors have shown that the use of drugs is significantly lower among students who expect to attendcollege than among those who do not. Factors such as liking school, spending time on homework, and perceiving thecoursework as relevant are also negatively related to drug use.
1 Opportunities for Prosocial Involvement
When young people are given more opportunities to participate meaningfully in important activities at school, they areless likely to engage in drug use and other problem behaviors.
1 Rewards for Prosocial Involvement
When young people are recognized and rewarded for their contributions at school, they are less likely to be involved insubstance use and other problem behaviors.
Table 14. Scales that Measure the Risk and Protective Factors Shown in the ProfilesCommunity Domain Risk Factors
Family Domain Risk Factors
School Domain Risk Factors
School Domain Protective Factors
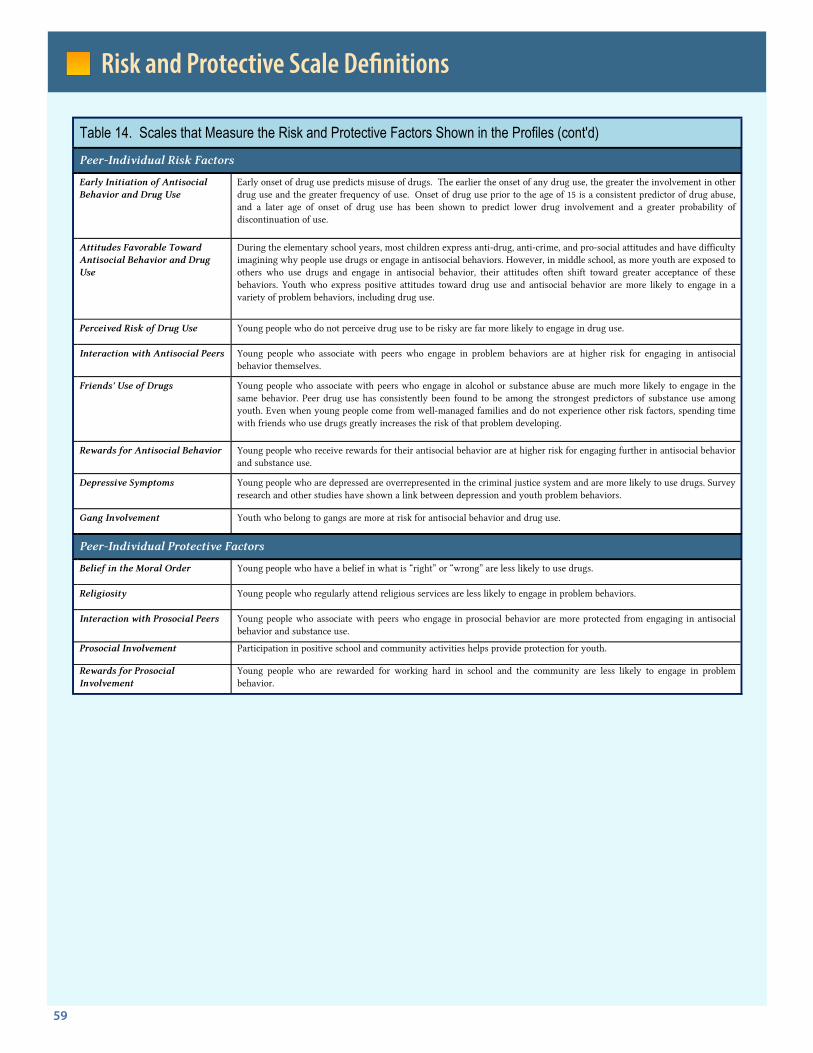
59
Risk and Protective Scale Definitions
1 Early Initiation of Antisocial Behavior and Drug Use
Early onset of drug use predicts misuse of drugs. The earlier the onset of any drug use, the greater the involvement in otherdrug use and the greater frequency of use. Onset of drug use prior to the age of 15 is a consistent predictor of drug abuse,and a later age of onset of drug use has been shown to predict lower drug involvement and a greater probability ofdiscontinuation of use.
1 Attitudes Favorable Toward Antisocial Behavior and Drug Use
During the elementary school years, most children express anti-drug, anti-crime, and pro-social attitudes and have difficultyimagining why people use drugs or engage in antisocial behaviors. However, in middle school, as more youth are exposed toothers who use drugs and engage in antisocial behavior, their attitudes often shift toward greater acceptance of thesebehaviors. Youth who express positive attitudes toward drug use and antisocial behavior are more likely to engage in avariety of problem behaviors, including drug use.
1 Perceived Risk of Drug Use Young people who do not perceive drug use to be risky are far more likely to engage in drug use.
1 Interaction with Antisocial Peers Young people who associate with peers who engage in problem behaviors are at higher risk for engaging in antisocialbehavior themselves.
1 Friends' Use of Drugs Young people who associate with peers who engage in alcohol or substance abuse are much more likely to engage in thesame behavior. Peer drug use has consistently been found to be among the strongest predictors of substance use amongyouth. Even when young people come from well-managed families and do not experience other risk factors, spending timewith friends who use drugs greatly increases the risk of that problem developing.
1 Rewards for Antisocial Behavior Young people who receive rewards for their antisocial behavior are at higher risk for engaging further in antisocial behaviorand substance use.
1 Depressive Symptoms Young people who are depressed are overrepresented in the criminal justice system and are more likely to use drugs. Surveyresearch and other studies have shown a link between depression and youth problem behaviors.
1 Gang Involvement Youth who belong to gangs are more at risk for antisocial behavior and drug use.
1 Belief in the Moral Order Young people who have a belief in what is “right” or “wrong” are less likely to use drugs.
1 Religiosity Young people who regularly attend religious services are less likely to engage in problem behaviors.
1 Interaction with Prosocial Peers Young people who associate with peers who engage in prosocial behavior are more protected from engaging in antisocialbehavior and substance use.
1 Prosocial Involvement Participation in positive school and community activities helps provide protection for youth.
1 Rewards for Prosocial Involvement
Young people who are rewarded for working hard in school and the community are less likely to engage in problembehavior.
Peer-Individual Protective Factors
Peer-Individual Risk Factors
Table 14. Scales that Measure the Risk and Protective Factors Shown in the Profiles (cont'd)
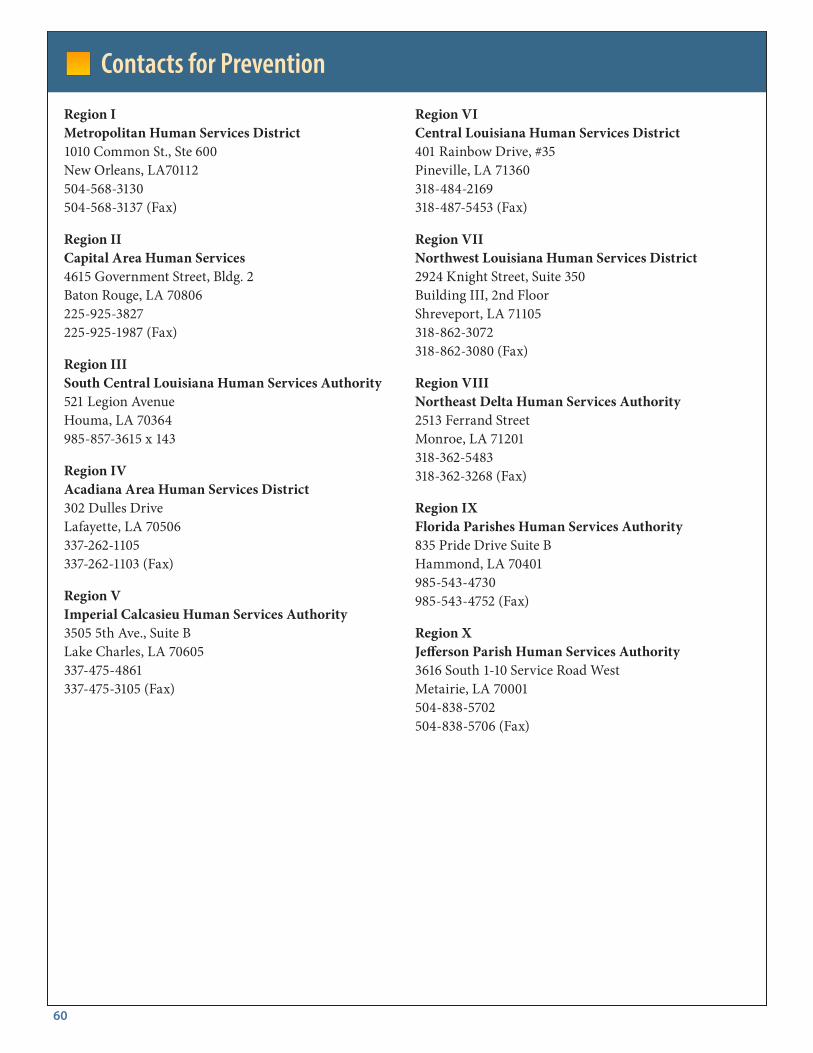
60
Region VI Central Louisiana Human Services District 401 Rainbow Drive, #35 Pineville, LA 71360 318-484-2169 318-487-5453 (Fax)
Region VII Northwest Louisiana Human Services District 2924 Knight Street, Suite 350 Building III, 2nd Floor Shreveport, LA 71105 318-862-3072 318-862-3080 (Fax)
Region VIII Northeast Delta Human Services Authority 2513 Ferrand Street Monroe, LA 71201 318-362-5483 318-362-3268 (Fax)
Region IX Florida Parishes Human Services Authority 835 Pride Drive Suite B Hammond, LA 70401 985-543-4730 985-543-4752 (Fax)
Region X Jefferson Parish Human Services Authority 3616 South 1-10 Service Road West Metairie, LA 70001 504-838-5702 504-838-5706 (Fax)
Region I Metropolitan Human Services District 1010 Common St., Ste 600 New Orleans, LA70112 504-568-3130 504-568-3137 (Fax)
Region II Capital Area Human Services 4615 Government Street, Bldg. 2 Baton Rouge, LA 70806 225-925-3827 225-925-1987 (Fax)
Region III South Central Louisiana Human Services Authority 521 Legion Avenue Houma, LA 70364 985-857-3615 x 143
Region IV Acadiana Area Human Services District 302 Dulles Drive Lafayette, LA 70506 337-262-1105 337-262-1103 (Fax)
Region V Imperial Calcasieu Human Services Authority 3505 5th Ave., Suite B Lake Charles, LA 70605 337-475-4861 337-475-3105 (Fax)
Contacts for Prevention
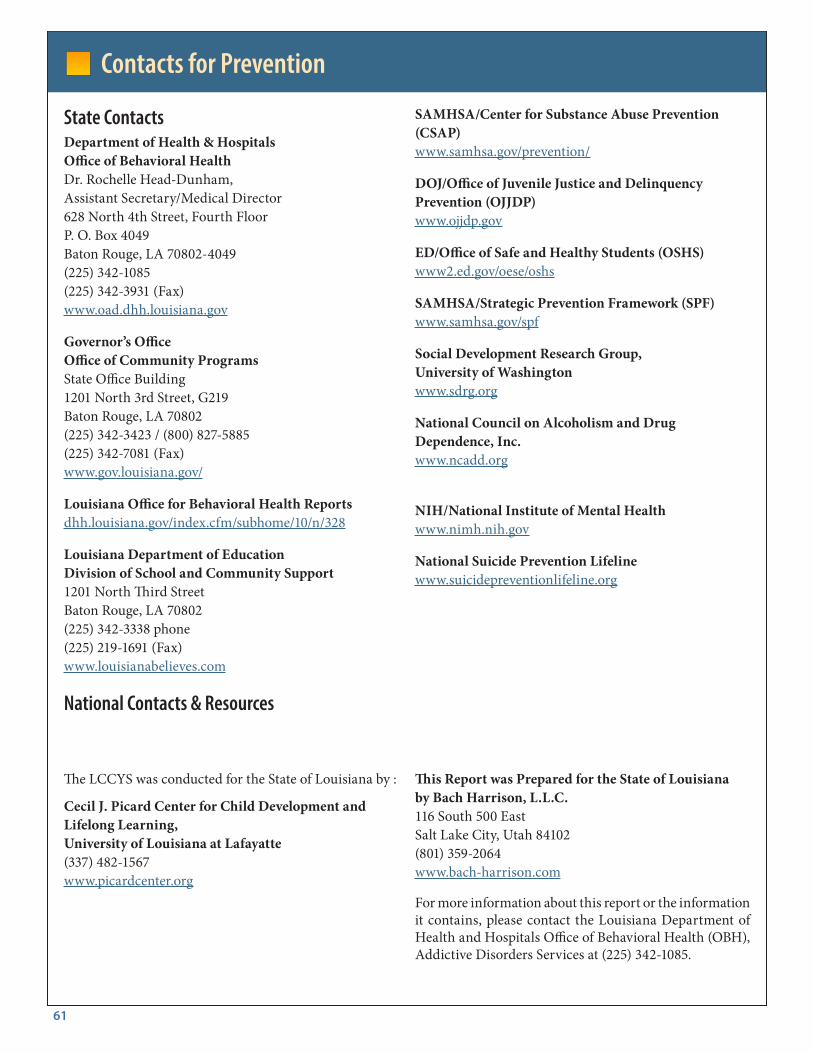
61
SAMHSA/Center for Substance Abuse Prevention (CSAP) www.samhsa.gov/prevention/
DOJ/Office of Juvenile Justice and Delinquency Prevention (OJJDP) www.ojjdp.gov
ED/Office of Safe and Healthy Students (OSHS) www2.ed.gov/oese/oshs
SAMHSA/Strategic Prevention Framework (SPF) www.samhsa.gov/spf
Social Development Research Group, University of Washington www.sdrg.org
National Council on Alcoholism and Drug Dependence, Inc. www.ncadd.org
NIH/National Institute of Mental Health www.nimh.nih.gov
National Suicide Prevention Lifeline www.suicidepreventionlifeline.org
State Contacts Department of Health & Hospitals Office of Behavioral Health Dr. Rochelle Head-Dunham, Assistant Secretary/Medical Director 628 North 4th Street, Fourth Floor P. O. Box 4049 Baton Rouge, LA 70802-4049 (225) 342-1085 (225) 342-3931 (Fax) www.oad.dhh.louisiana.gov
Governor’s Office Office of Community Programs State Office Building 1201 North 3rd Street, G219 Baton Rouge, LA 70802 (225) 342-3423 / (800) 827-5885 (225) 342-7081 (Fax) www.gov.louisiana.gov/
Louisiana Office for Behavioral Health Reports dhh.louisiana.gov/index.cfm/subhome/10/n/328
Louisiana Department of Education Division of School and Community Support 1201 North Third Street Baton Rouge, LA 70802 (225) 342-3338 phone (225) 219-1691 (Fax) www.louisianabelieves.com
National Contacts & Resources
Contacts for Prevention
The LCCYS was conducted for the State of Louisiana by :
Cecil J. Picard Center for Child Development and Lifelong Learning, University of Louisiana at Lafayatte (337) 482-1567 www.picardcenter.org
This Report was Prepared for the State of Louisiana by Bach Harrison, L.L.C. 116 South 500 East Salt Lake City, Utah 84102 (801) 359-2064 www.bach-harrison.com
For more information about this report or the information it contains, please contact the Louisiana Department of Health and Hospitals Office of Behavioral Health (OBH), Addictive Disorders Services at (225) 342-1085.


![Deloitte Digital 1 - Dutch Hacking Health · Deloitte Digital 12 Marketing activities Pre DHH DHH [19/05-21/05] Post DHH ... Movie –National Winner of DHH 2016 Zora present on some](https://img.pdfslide.us/doc/110x75/5f0f1b107e708231d44284d9/deloitte-digital-1-dutch-hacking-health-deloitte-digital-12-marketing-activities.jpg)