Embed Size (px)
Citation preview
January 2001
NASA/CR-2001-210658
Development Cycle Time Simulation forCivil Aircraft
William Spitz, Richard Golaszewski, and Frank BerardinoGellman Research Associates, Inc., Jenkintown, Pennsylvania
Jesse JohnsonLogistics Management Institute, McLean, Virginia

The NASA STI Program Office ... in Profile
Since its founding, NASA has been dedicatedto the advancement of aeronautics and spacescience. The NASA Scientific and TechnicalInformation (STI) Program Office plays a keypart in helping NASA maintain this importantrole.
The NASA STI Program Office is operated byLangley Research Center, the lead center forNASA’s scientific and technical information.The NASA STI Program Office providesaccess to the NASA STI Database, the largestcollection of aeronautical and space scienceSTI in the world. The Program Office is alsoNASA’s institutional mechanism fordisseminating the results of its research anddevelopment activities. These results arepublished by NASA in the NASA STI ReportSeries, which includes the following reporttypes:
• TECHNICAL PUBLICATION. Reports
of completed research or a majorsignificant phase of research thatpresent the results of NASA programsand include extensive data or theoreticalanalysis. Includes compilations ofsignificant scientific and technical dataand information deemed to be ofcontinuing reference value. NASAcounterpart of peer-reviewed formalprofessional papers, but having lessstringent limitations on manuscriptlength and extent of graphicpresentations.
• TECHNICAL MEMORANDUM.
Scientific and technical findings that arepreliminary or of specialized interest,e.g., quick release reports, workingpapers, and bibliographies that containminimal annotation. Does not containextensive analysis.
• CONTRACTOR REPORT. Scientific and
technical findings by NASA-sponsoredcontractors and grantees.
• CONFERENCE PUBLICATION.Collected papers from scientific andtechnical conferences, symposia,seminars, or other meetings sponsoredor co-sponsored by NASA.
• SPECIAL PUBLICATION. Scientific,
technical, or historical information fromNASA programs, projects, and missions,often concerned with subjects havingsubstantial public interest.
• TECHNICAL TRANSLATION. English-
language translations of foreignscientific and technical materialpertinent to NASA’s mission.
Specialized services that complement theSTI Program Office’s diverse offeringsinclude creating custom thesauri, buildingcustomized databases, organizing andpublishing research results ... evenproviding videos.
For more information about the NASA STIProgram Office, see the following:
• Access the NASA STI Program HomePage at http://www.sti.nasa.gov
• E-mail your question via the Internet to
[email protected] • Fax your question to the NASA STI
Help Desk at (301) 621-0134 • Phone the NASA STI Help Desk at (301)
621-0390 • Write to:
NASA STI Help Desk NASA Center for AeroSpace Information 7121 Standard Drive Hanover, MD 21076-1320

National Aeronautics andSpace Administration
Langley Research Center Prepared for Langley Research CenterHampton, Virginia 23681-2199 under Contract NAS2-14361
January 2001
NASA/CR-2001-210658
Development Cycle Time Simulation forCivil Aircraft
William Spitz, Richard Golaszewski, and Frank BerardinoGellman Research Associates, Inc., Jenkintown, Pennsylvania
Jesse JohnsonLogistics Management Institute, McLean, Virginia

Available from:
NASA Center for AeroSpace Information (CASI) National Technical Information Service (NTIS)7121 Standard Drive 5285 Port Royal RoadHanover, MD 21076-1320 Springfield, VA 22161-2171(301) 621-0390 (703) 605-6000

iii
Contents
Chapter 1 Introduction and Summary ...............................................................1-1
REPORT SUMMARY ............................................................................................................1-2
REPORT OVERVIEW AND STRUCTURE...............................................................................1-4
Chapter 2 Literature Review .............................................................................2-1
INTRODUCTION..................................................................................................................2-1
The Commercial Aircraft Industry: Market Structure and Incentives to Invest ........2-1
Product Diversity........................................................................................................2-2
Increasing Returns to Adoption..................................................................................2-2
OTHER SOURCES OF R&D.................................................................................................2-3
NASA-SPONSORED R&D: RISK AND THE PAYBACK PERIOD............................................2-4
EXTENSIONS......................................................................................................................2-5
Monopsony Power of Airlines ...................................................................................2-5
The Effects of a Dominant Firm ................................................................................2-5
RISK IN THE COMMERCIAL AIRCRAFT INDUSTRY..............................................................2-7
SUMMARY AND IMPLICATIONS..........................................................................................2-8
Chapter 3 Models of Aircraft Development Cycle Theory and Practice..........3-1
THE REVISED NASA 1998 DESIGN AND DEVELOPMENT CYCLE FOR AIRFRAMES
SYSTEMS ANALYSIS ..............................................................................................3-1
Early Configuration and Market Analysis .................................................................3-2
Product Definition......................................................................................................3-3
Detailed Design ..........................................................................................................3-3
Fabrication, Assembly, and Testing...........................................................................3-4
Flight Testing .............................................................................................................3-5
Summary ....................................................................................................................3-5
MANUFACTURER COMMENTS ON THE BASE CASE NASA MODEL DESIGN.......................3-6
Early Configuration and Market Analysis .................................................................3-7
Product Definition......................................................................................................3-8
Detailed Design ..........................................................................................................3-9

iv
Tooling, Facilities, and Industrial Equipment Development ...................................3-10
Fabrication, Assembly, and Testing.........................................................................3-10
Flight Tests...............................................................................................................3-11
REVIEW OF BOEING 777 DESIGN CYCLE INNOVATIONS ..................................................3-11
POTENTIAL BENEFITS OF REDUCED CYCLE TIMES AND LIKELY TARGETS OF
REDUCTION EFFORTS..........................................................................................3-14
Chapter 4 Market Impacts and the Realization of Benefits of ReducedCycle Time ............................................................................................4-1
DYNAMIC EQUILIBRIUM IN THE COMMERCIAL AIRCRAFT MARKET ..................................4-1
Recent Advances ........................................................................................................4-2
Dynamic Equilibrium Models....................................................................................4-2
IMPLICATIONS FOR NASA VEHICLE DEVELOPMENT CYCLE ANALYSIS ............................4-3
THE EFFECTS OF VARIABLE PRODUCTION RATES ON LEARNING ECONOMIES...................4-4
Effects of Varying Production Rates..........................................................................4-5
Effects of Reduced Cycle Time .................................................................................4-7
The Effects of Reducing the Variance in Production Rates.......................................4-7
IMPLICATIONS FOR NASA.................................................................................................4-9
Chapter 5 Benefits Framework for Cycle Time Reduction ..............................5-1
BENEFITS FRAMEWORK.....................................................................................................5-5
Chapter 6 Tailored Cost Model Analysis ..........................................................6-1
DETAILED ANALYSIS OF TCM MODEL STRUCTURE..........................................................6-2
DEVELOPMENT OF DESIGN CYCLE TIMELINE AND IMPLEMENTATION IN TCM .................6-4
USE OF REVISED TCM TO MEASURE DESIGN CYCLE BENEFITS OF NASAPROGRAMS............................................................................................................6-9
Chapter 7 Conclusions and Recommendations.................................................7-1
Appendix A Design Cycle Goals For The NASA Systems Study
Appendix B Responses from Aircraft Design Group No. 1
Appendix C Interview Responses of Aircraft Design Group No. 2
Appendix D Presentation Notes Aircraft Design Group No. 2
Appendix E Tailored Cost Model

Contents
v
FIGURES
Figure 3-1. 1990 State-of-the-Art Airframe Development Cycle ..........................................3-2
Figure 4-1. Simulated Results of a Manufacture Program With Varying AnnualMarket Sizes.....................................................................................................................4-6
Figure 4-2. Simulated Results of a Manufacturer Program With ReducedDevelopment Cycle Time.................................................................................................4-7
Figure 4-3. Simulated Results of a Manufacturer Program With 2-Year Cycle Timeand Reduced Demand Variables ......................................................................................4-8
Figure 5–1. Cost-Cycle Time Curve-Effects on Cumulative Costs.......................................5-4
Figure 6–1. Base Case Timeline ............................................................................................6-6
Figure 6–2. Summary Effects of NASA’s CTR-Related Programs.....................................6-14
Figure 6–3. Scaled Impacts on Cycle Time of Individual NASA Programs .......................6-15
TABLES
Table 2-1. Large Transport Aircraft Manufacturer Deliveries and Market Shares................2-2
Table 3-1. Percentage of Cost By Design Cycle Phase—New Designs ................................3-5
Table 4-1. Static Analysis of a Proposed Program.................................................................4-6
Table 5-1. Linkage Of CTR Goals .........................................................................................5-2
Table 6-1. TCM Cost Element Breakdown............................................................................6-1
Table 6-2. TCM Dynamic Allocation By Month...................................................................6-8
Table 6-3. Scenario Changes..................................................................................................6-9
Table 6-4. TRL Impacts .......................................................................................................6-10
Table 6-5. Overview of NASA Programs ............................................................................... 11
Table 6-6. TCM Inputs Affected By Various NASA Programs ..........................................6-12
Table 6-7. Estimated Combined Impacts on Design Cycle Costs of NASA Programs......6-13

1-1
Chapter 1 Introduction and Summary
Cycle Time Reduction (CTR) will be one of the major factors affecting the futureof the civil aerospace industry. This focus comes from a non-traditional aerospaceperspective but it is ultimately the end reflection of the level competition in theaircraft industry. The major buyers of aircraft, airlines, and leasing agencies, havecome to view new aircraft as commodity items. In its simplest form, the majorbuyers pick the least cost aircraft that meets their needs. To successfully competein this type of market, aircraft manufacturers must minimize costs and pass a por-tion of those savings on to the buyers. CTR is one strategy used to move themanufacturing firm down the cost curve.
One approach for examining CTR strategy looks at its implementation. This isusually defined as being either process centered or manufacturing centered. Theprocess activities are based on the application of up-to-date management andcontrol theories (including information technology) about how to improve and/oraccelerate operations, but as applied to the aerospace manufacturing industry. Themanufacturing processes are those best practices implemented in the aerospacemanufacturing industry. These can be thought of as either those initially derivedfrom other industries and applied to the aerospace industry, or those organicallyderived to solve specific problems in the aerospace industry.
Implementation of CTR strategies may not produce future profits, but that doesnot mean the strategy is a failure. In fact, as the level of competition rises, it is oneof the tools to maintain profits. The net effect may show up as constant profits asopposed to increased profits.
The airframe development cycle describes the production phases of civil aircraftfrom concept to delivery.1 It is this cycle that will be analyzed for possible reduc-tions and/or improvements. The proper view of this cycle is not a static one. Theactual development cycle is fluid and dynamic. The definition of the productionphases is somewhat arbitrary and overlapping. The phases of the development cy-cle actually exist in parallel for each individual aircraft, with the first five or sixaircraft going through different phases simultaneously.
The development cycle of future large passenger aircraft is a critical determinantof the future success of the commercial aerospace industry. The typical currentdevelopment cycle spans several phases lasting 4 to 8 years. One of the keys to
1 The complete aircraft development cycle is composed of the airframe development cycle
and the engine development cycle. The engine development cycle was not examined in this study.In this context, the term “development cycle” refers only to the airframe development cycle.
1-2
the continued development of the aerospace industry and its profitability is find-ing ways to shorten or improve this cycle.
NASA’s analysis of the current development cycle is embodied in a coarse model.A more accurate and refined model is required to better assess the effect of newtechnologies on the aircraft development cycle.
Two approaches can be used in the design of aircraft development cycle. The firstis to take the framework as it exists and examine methods and practices to im-prove that framework. This is known as the process-reengineering framework.The second involves designing a wholly new process from start to finish.
The ideas explored in this report are based on the first approach. The second ap-proach holds promise, particularly as it pertains the development of other thanconventional technology and/or other than subsonic aircraft. This is because thegoal of reduction of development time by a factor of two may require radical re-design, rather than simply process improvement. This aspect is beyond the scopeof this study and is not directly covered here, although some of the industry re-duction practices are focused in this direction.
The goals of the present effort are to
u conduct a literature review focusing on the cash flow implications of fastercycle times;
u conduct and report the results of interviews with aircraft manufacturers re-garding cycle time reduction efforts;
u provide a framework to measure the benefits of NASA programs to reducecycle time; and
u implement an empirical model to obtain numerical estimates of likelyNASA program effects on cycle time;
REPORT SUMMARY
The current NASA Airframe Development Cycle Time Reduction Goal is 50 per-cent by year 2022. This goal is not achievable based on the program analysisdone by the LMI/GRA team. It may be that the program technology progressfactors, as determined by the NASA experts, were understated. If that is not thecase, then the current roster of NASA Cycle Time Reduction programs needs tobe reexamined. Programs that duplicate the reductions of others should be re-placed with programs that offer non-duplicative reductions. In addition, new pro-grams targeting a specific part of the cycle can be developed, as well asdeveloping programs based on implementing best standards and practices.
Introduction
1-3
In economic terms, the conventional view is that the industry has evolved into aduopoly, with Boeing competing against Airbus. This view must be modifiedsomewhat, when considering certain segments of the industry; in particular, thegrowing demand for regional jet aircraft has led other smaller firms to enter themarket. Market demand and cost characteristics for the regional jet market arequite different than those for larger aircraft, and so the characteristics of the de-sign cycle may also be different. The duopoly characterization is appropriate forthis segment of the market examined in this study, the larger (more than 100seats) commercial aircraft.
Four major target areas of cycle time reduction efforts over the next several yearsare
u reducing engineering man-hours;
u reducing tooling hours;
u reducing test activity; and
u implementing process and information technologies.
Learning economies are an important aspect of realizing the benefits of cycle timereductions. In turn, this affects production costs and economic profits. Theselearning economies depreciate over time when they are unused. Therefore, it isimportant for a firm to maintain a constant or increasing rate of production overtime in order to benefit from the decreased unit costs resulting from learningeconomies. This means that even small variations in production rates (especiallyin early years) can have dramatic effects on realized learning economies, andhence on net profits. This has several important implications for reductions in de-sign cycle times.
Getting to market earlier means that the company will have more opportunities todominate a particular market segment before a competitor can react. If a companycan lock in more customers, it has a better chance of both producing more unitsand smoothing the production run over the product’s life cycle and thereby realizeits learning economies. By getting to market faster, the forecast for the productand the expected profitability of the program are more likely to be realized.
For the manufacturers, the benefits of airframe development cycle time reductionare fundamentally in the unit of dollars. The benefits are enumerated as increasedsales, increased market share, and lower costs, best translated to dollars.
For NASA and the general public, the benefits are neither as direct or concrete, astheir benefits are those derived from the manufacturers successful implementationof a CTR program. At the primary level there are technologies implemented bythe manufacturers that can modified and transferred other industries. In additionthere are the standard benefits derived from a healthy civil aerospace industry:additional aircraft sales, additional manufacturing, and airline industry employ-

1-4
ment, and the subsequent economic ripple effects. The secondary effects includethe introduction of new aircraft and replacement of old ones. These effects arereduced air and noise pollution and added safety in the commercial fleet.
REPORT OVERVIEW AND STRUCTURE
The remainder of this report is divided into six sections:
u Chapter 2 provides a review of basic economic theory relevant for the air-craft manufacturing industry. It discusses changes in market structure inthe industry over time and reviews the competitive implications of reducedcycle time.
u Chapter 3 discusses the NASA modeling strategy for airframe develop-ment cycle analysis developed in 1998. This is followed by a discussion ofmanufacturer comments on the NASA model design that resulted frominterviews undertaken with two major aircraft design groups. This chapteralso includes a review of design cycle innovations implemented during theBoeing 777 aircraft program, as well as an overview of the likely targetsof future reduction efforts by aircraft manufacturers.
u Chapter 4 discusses new economic evidence on the nature of learningeconomies that may have direct implications for the benefits of reducedcycle time in the commercial aircraft industry.
u Chapter 5 provides a theoretical framework for measuring the benefits ofNASA program efforts to reduce cycle time.
u Chapter 6 discusses NASA’s Tailored Cost Model (TCM) and describesLMI/GRA efforts to expand the model to allow for time dynamics. A de-tailed analysis of the underlying model structure is provided along with adescription of the design cycle timeline that was implemented. This isfollowed by a discussion of how the revised model was then used tomeasure design cycle benefits of current NASA research programs.
u Chapter 7 presents a summary and conclusions, along with recommenda-tions for possible future avenues of research and analysis.

2-1
Chapter 2 Literature Review
INTRODUCTION
This section presents the results of two literature reviews: one involving the mar-ket structure of the aircraft industry and the other regarding competitive implica-tions of cycle time reduction.
The Commercial Aircraft Industry: Market Structure andIncentives to Invest1
The structure of the commercial aircraft industry can be characterized as having arelatively high degree of horizontal concentration, but a lack of vertical integra-tion. Horizontal concentration describes the number of firms participating in themarket at any one stage of production (e.g., airframes or engines). Vertical inte-gration refers to the extent to which single firms participate in the market at sev-eral stages of production (e.g., a firm producing both airframes and engines isvertically integrated).
FIRM SIZE AND MARKET SHARE
Empirical evidence suggests that both firm size and seller concentration affectresearch and development (R&D) efforts. Specifically, the evidence suggests thatincreases in firm size resulted in proportionately greater levels of R&D effort; be-yond the threshold point (about $400 million in sales in 1978 dollars) however,further increases in firm sales caused diminished levels of R&D. As shown inTable 2-1, all the major civil transport aircraft manufacturers are well beyond thissize threshold.
Similarly, increases in market concentration tend to result in proportionatelygreater R&D efforts to be undertaken. Again, this effect diminishes at some point.However, the evidence is relatively weak on both accounts. Accordingly, our con-clusions should be viewed with this in mind. The commercial aircraft industrylargely exceeds, the threshold points for both firm size and market concentration.Table 2-1 shows recent market share data for large transport aircraft. The threelargest airframe manufacturers, Boeing, McDonnell-Douglas, and Airbus, for ex-ample, had deliveries of civil jet transports valued at $31.2 billion, $2.7 billion
1 With minor editorial changes, the following section is taken directly from parts of a report
completed by GRA, Inc. under subcontract to Science Applications International Corporation,prepared for NASA Headquarters, “Economic Analysis of Aeronautical R&T: A Survey,” No-vember 1999.

2-2
and $12.8 billion, respectively in 1998.2 As shown in Table 2-1, the market shareof just the largest commercial airframe manufacturer, Boeing, exceeds 70 percentof the market for large aircraft in dollar value, counting both Boeing and McDon-nell-Douglas. Thus, by both standards, the industry is far past the optimal thresh-old points conducive to R&D activities. Because of this, and in view of theinconclusive evidence regarding the general effects of firm size and market share,these aspects of market share are not likely to mitigate the appropriability prob-lems facing the industry.
Table 2-1. Large Transport Aircraft Manufacturer Deliveries and Market Shares
Deliveries (dollars-billions)
1990 1991 1992 1993 1994 1995 1996 1997 1998
BOEING $20.4 $21.5 $22.8 $19.0 $15.3 $12.5 $15.2 $22.2 $31.2
DOUGLAS 3.7 6.2 6.0 4.4 2.5 3.0 2.8 2.7 2.7
AIRBUS 4.4 7.1 7.1 8.0 7.9 8.9 8.2 10.8 12.8
TOTAL 28.5 34.8 35.9 31.4 25.7 24.4 26.2 35.7 46.7
EUROPE 15.4% 20.4% 19.8% 25.5% 30.7% 36.5% 31.3% 30.3% 27.4%
USA 84.6% 79.6% 80.2% 74.5% 69.3% 63.5% 68.7% 69.7% 72.6%
BOEING 71.6% 61.8% 63.5% 60.5% 59.5% 51.2% 58.0% 62.2% 66.8%
Product Diversity
Diversified firms producing products in closely related markets may have addedincentives to conduct R&D because the benefits can be spread over several prod-ucts. The existence of a large military market aids the industry in spreading thecosts of the common military/civilian R&D base. But, the key question here iswhether the existence of the military market causes firms to undertake civilian-oriented R&D, speculating that the results can be applied in the military sector.While this effect may exist, it is likely to be small. Military and civilian hardwaretend to be quite different in performance characteristics, with military applicationsusually preceding civilian use.3 Disembodied technologies—new concepts orknowledge—may be applicable in either sector, but the production of such R&Dwill be subject to the appropriability problem, regardless of its eventual use.
Increasing Returns to Adoption
Another important point is that firms will have an incentive to invest in existingtechnology when increasing returns to adoption are present. This can delay orprevent the introduction of a new superior technology. Increasing returns can be
2 McDonnell-Douglas merged with Boeing in 1997.3 Some knowledgeable observers say that the military now benefits from innovations first ap-
plied in the civil arena.

Economic Theory and Literature Review
2-3
present when there are large learning curve effects on production costs (i.e., theincremental production costs decline with succeeding units of production). A firmhas an incentive to produce more of an existing design, rather than introduce newtechnology that would cause higher costs associated with the beginning of thelearning curve.
The increasing returns to adoption model may be particularly appropriate for thecivil aircraft industry.4 Here a manufacturer is often faced with a choice of pro-ducing a derivative of an existing design versus a totally new aircraft. (Boeing isfacing this decision today with plans for a large, long-range aircraft to competewith the large transport being considered by Airbus, the A-3XX. Boeing is deter-mining whether to stretch the B-747 or undertake a new design.) The implicationsof the increasing returns to adoption case are that firms may have economic in-centives to forego superior technologies that may have potentially large long-runpayoffs. As a result, firms may underinvest in R&D, even up to technology dem-onstration and validation. As noted in the next section, this does not apply to caseswhere companies receive development funds from government. If governmentwants industry to apply these superior technologies, it may have to invest in theirdevelopment, demonstration, and validation. This is especially the case for tech-nologies that are significantly different than those embodied on existing products.The technology base for high-speed civil transport aircraft is one example of po-tentially superior technology in which the industry may not have adequate incen-tives to invest.
OTHER SOURCES OF R&DThis discussion has intentionally focused on privately funded R&D. Consideredhere are incentives private firms in the industry would have to fund R&D that iscurrently derived from other sources. In general, the types of R&D provided byother sources are, by their very nature, less appropriable than privately conductedR&D, which is dominated by applied research and development activities. Conse-quently, private firms in general will have even less incentive to conduct R&Dcurrently derived from other sources.
An important question for the present analysis is: To what extent will privatefirms have incentives to conduct R&D currently performed or sponsored byNASA? As an R&D source, NASA makes contributions to the industry’stechnology base in terms of infratechnology,5 and discipline and applied research.Relatively little private expenditure is devoted to these elements of the technologybase. The reasons for this phenomenon are twofold:
4 Arthur, op cit, p. 116.5 Infratechnology includes both methods and basic data (e.g., test methods, computational
procedures and materials characteristics) for conducting or using other types of research and tech-nology.

2-4
u Private firms have less incentive to conduct discipline (or basic) and ap-plied R&D because of the problems of appropriability (as well as the riskand payback period problems).
u Neutral technology can be obtained from other sources.
The latter point, is the central policy issue. Given the previous discussion on theappropriability of neutral technology and the results obtained from the economicmodel of the market for R&D, it appears that the private market will not respondwell to the burden of undertaking R&D activities currently conducted by NASA.
A second issue, whether NASA sponsored R&D conducted by private firms, is acomplement or a substitute for privately financed R&D. The concern here is thatNASA (or government) sponsored R&D “crowds out” R&D that otherwise wouldbe financed and conducted privately. A priori expectations lead one to believe thatthe crowding out effect is not substantial: NASA typically sponsors projects thatexhibit scientific potential rather than short-term commercial potential. In addi-tion, there is empirical evidence that the crowding out effect is minimal. Onestudy, which focused specifically on the transport industry, estimated that eachdollar of government sponsored “mission-oriented” research reduced privatelysponsored research by only 8 cents.6 Recall that the discussion above ofabsorptive capacity indicates that public R&D could stimulate private R&Dinvestment.
NASA-SPONSORED R&D: RISK AND THE PAYBACK
PERIOD
Appropriability is not the only factor considered in a firm’s decision to invest inR&D. Specifically, both the level of risk associated with a project and the dura-tion of the payback period influence the investment decision, even when appro-priability is not an issue. Development activities are least risky and have, ingeneral, the shortest payback period, while investments in discipline research andinfratechnology are generally most risky and have the longest payback periods.
Regarding the risk and payback period problems, the important issue here is:Does the type of R&D conducted by NASA complement R&D that private firmstend to conduct, or are NASA R&D activities substitutes? As noted above, manyof NASA’s resources are devoted to basic research and the development of infra-technology. These activities complement the efforts of the private sector sincethey are risky and tend to have long payback periods.
NASA also sponsors and conducts applied research. Although this type of R&Dinvestment is generally less of a problem in terms of risk and the payback period,it is less desirable to private firms than development activities. Moreover, applied
6 J. Carmicheal, “The Effects of Mission-Oriented Public R&D Spending on Private Indus-try,” Journal of Finance, 36, (1981), 617-627.

Economic Theory and Literature Review
2-5
research in aeronautics, particularly the type that NASA conducts, often requiresthe extensive use of large-scale facilities. If the burden of conducting these proj-ects were placed on the private sector, substantial duplication of both large-scalefacilities and expensive experiments may result.
EXTENSIONS
There are two additional features of the industry that play an important role in re-search and development. These features address the following issues:
u The monopsony buying power that sometimes is vested in airlines as a re-sult of direct competition between aircraft manufacturers.
u The role of the dominant firm and its effects on competition and techno-logical change.
These two facets of the commercial aircraft industry are considered below.
Monopsony Power of Airlines
Because aircraft manufacturing requires high development costs, the industry isoften compared to other industries with high development costs (e.g., automo-biles, semiconductors and so forth). The key distinction is that aircraft are built insmall numbers and, in fact, are custom-built to airline specifications. Stability inthe marketplace depends upon the ability of firms to differentiate their productsand, more specifically, to build different size aircraft with different capabilitiesthat will be attractive to specific niches in the marketplace. When firms build air-craft of the same size with similar capabilities, they often find that the market istoo small to yield satisfactory returns on their investments.7 Competition becomesso vigorous for limited sales opportunities that airlines acquire monopsonypower—the ability to dictate the terms of the sale to the seller. This situation canhave debilitating effects on competitors and it can reinforce the already existingtendency for one firm to emerge as the dominant competitor during any given era.
The Effects of a Dominant Firm
Firms become dominant in the industry when they have been successful in mak-ing significant technological leaps forward. Boeing’s dominance over the past 25years can be directly traced to its introduction of the 707, which, although not thefirst turbojet introduced, was the first to combine both speed and cost savings for
7 The classic examples of this are the DC-10 and L-1011. Both targeted the same market niche
in range and size. Losses on the L-1011 forced Lockheed to withdraw from the civil aircraft manu-facturing industry.

2-6
its operators. Similarly, the DC-1-2-3 series dominated airline fleets worldwide inthe 1930s. The DC-3 combined advantages of speed, size, range, and cost.
What is most significant about these two success stories is that both Douglas inthe 1930s and Boeing in the 1950s were minor competitors in the commercial air-craft business when they undertook their projects. In fact, the DC-1-2-3 series wasthe first transport aircraft Douglas ever built. History suggests that dominant firmsin the airframe industry will be reluctant to make technological leaps forward be-cause they do not wish to compete with their existing and successful product linesand their incentives to undertake the considerable risks involved are less thanthose of companies with less of a stake in the existing aircraft market.
In other words, dominant firms become dominant by successfully making signifi-cant technological breakthroughs first. They remain dominant by winning any di-rect competition with other major manufacturers (e.g., the B-707 vs. DC-8, andthe DC-3 vs. the B-247) and by successfully differentiating products (e.g., the B-727 and the B-747). But they can lose their dominance by underinvesting in tech-nological advances and the R&D necessary to support them.
It should be stressed that incorporating a major technological advantage is noguarantee of success. The de Havilland Comet, the Vickers V-1000, and the Con-corde are examples of failed attempts by competitors to make the technologicalbreakthroughs that could have led to market dominance.
In reviewing those histories of major technological breakthroughs, it is importantto recognize the role played by externally generated technology. The DC-3 incor-porated a number of innovations first developed elsewhere: the NACA cowling;all metal, stressed monoplane structures; and variable pitch propellers (invented in1871). The inability of the original investors to appropriate all of the benefits ofthe technologies made the DC-3 possible. Likewise, the KC-135/B-707 was basedon Boeing experience with the B-47 and B-52, both military aircraft.
The findings concerning the incentives of dominant firms to underinvest in majortechnological advances and the R&D necessary to support them is consistent withthe economic literature. A brief summary of that literature indicates the followingpoints:
u Some concentration in an industry may be conducive to invention and in-novation because the firms will have sufficient financial capabilities toundertake these activities and because they have an incentive to differ-entiate their product and thereby earn some monopoly profits; but,
u High concentration (the case of the dominant firm) can retard progress byrestricting the number of independent initiatives and by dampening the in-centives of other firms to compete.

Economic Theory and Literature Review
2-7
u The key to preserving effective competition in less-than-perfectly-competitive industries is to keep entry barriers sufficiently low so thatnewcomers can enter or threaten to enter.
u Access to radical new technologies (and the complementary technologiesto support them) is a key to preserving low entry barriers and competitionespecially in high technology industries.
RISK IN THE COMMERCIAL AIRCRAFT INDUSTRY
The commercial aircraft industry must contend with rapidly advancing technologyand costs. There are innate risks associated with developing and producing air-frames incorporating new and often untried technology. The emphasis on researchand development in the airframe industry is a two-edged sword with respect tofinancial risk: It is costly and the returns from R&D are highly uncertain.
Earlier, it was noted that risk could be mitigated if a firm could diversify its ac-tivities into several relatively small projects, even if the total level of R&D isrelatively high. On the other hand, if the nature of the industry is such that R&Ddiversification is infeasible, then the risk problem becomes more significant.
The nature of the commercial aircraft industry is such that very large single R&Dprojects must be undertaken. Development costs for the Boeing 747, for example,have been estimated at $1.2 billion spanning roughly a 4 year period between De-cember 1965 to January 1970.8 At the time the development of the aircraft com-menced in late 1965, total shareholder’s equity was only about $372 million.9 Theratio of development costs to equity was approximately 3.23; that is, the devel-opment cost of the B-747 alone was more than three times the value of stockhold-ers’ investments. In short, Boeing was required literally to “bet” the company onthe success of the B-747. (It was recently reported that the development costs forits planned 600-800 seat aircraft would be more than $10 billion.10 The develop-ment costs for the Airbus A3XX is projected at $12 billion by 2004).11
McDonnell-Douglas incurred similar risks in developing the DC-10. Develop-ment costs for this aircraft have been estimated at $1.1 billion.12 The value ofshareholders equity was only about $364 million in 1967, the year in whichdevelopment commenced.13 The ratio of development costs to equity was about3.02. McDonnell-Douglas then, was also required to risk the fate of the firm indeveloping the DC-10.
8 RADCAP, op cit, Appendix 9, p. 21.9 Boeing Annual Report, 1966.10 Laurence Zuckerman, “The Jet Wars of the Future,” The New York Times, July 9, 1999, p. C5.11 Reuters News Service, New York, Feb. 2, 2000.12 RADCAP, op cit, Appendix 9, p. 21.13 McDonnell-Douglas Annual Report, 1967.

2-8
SUMMARY AND IMPLICATIONS
Access to non-appropriable technologies from other sources (e.g., NASA) appearsto be critical to the maintenance of efficient production of civilian transports forthe following reasons:
u Firms in general have a tendency to underinvest in R&D, for all the rea-sons cited above.
u The existence of dominant firms tends to impede technological progressand competition.
u The financial capacity of aircraft manufacturers is sometimes debilitatedby the monopsony power of airlines.
u Aircraft manufacturing firms already face substantial risks relative to othermanufacturers. The industry is not likely to be able to respond well to theburden of accepting additional risky R&D projects.
Cycle time reduction has traditionally been associated with decreased costs andimproved customer satisfaction. There are other factors that are equally importantwhen analyzing the airframe manufacturing industry. These would include afaster time to market, as well as increased market share and reduced total operat-ing costs of the aircraft. These factors all have one thing in common, they lead tohigher corporate profits.
The importance of cycle time reductions in capital intensive industries representsa fundamental strategic shift. Historically the major barriers to entry and protectorof profits in this industry segment have been economy of scale, which was afunction of capital intensity. Advances in computer technology, manufacturing,and, in some sense financing, have made economy of time a method to competewith economy of scale.
The general theory states that competitive firms have an incentive to invest in costsavings processes more than a monopolistic firm does. But the degree of compe-tition is inversely related to the potential profit. Those firms with the highest de-gree of competition do invest, but they do so to lower costs and stay in business asopposed to extracting more profits.
Furthermore, when examined at the duopoly level, the general theory holds thattwo firms competing in an industry with no entry will continue to innovate (orimitate) when the cost of innovation (imitation) is less than the benefits, despitethe fact that the other firm can benefit without incurring costs. This is becauseprofits are still being made in the industry, although the marginal rate of profitsmay be declining. Firms will accept a lower rate of return rather than lose cus-tomers to the competitor.

Economic Theory and Literature Review
2-9
The level of competition will determine both the degree and type of innovation tooccur. But even more important, it will also determine the time length in whichany innovation serves as a profitable degree of differentiation before it is con-verted to a standard readily available attribute. Theoretically at the extremes, thistime span is zero under perfect competition and infinite in a monopoly. In real lifewe see competitive advantages lasting as little as 6 months in the computer in-dustry, to 1 to 3 years in the auto industry. Using those industries as the timescale, a competitive advantage in the airframe industry should be currently ex-pected to last 2 to 4 years before it is rendered as standard.
So cycle time reduction should be expected to occur. All firms will attempt it.One firm will succeed faster than the others. That competitor will have a tempo-rary competitive advantage, until another firm catches up. At that point the inno-vation becomes standard and the search is on for a new innovation.
3-1
Chapter 3 Models of Aircraft Development Cycle Theory andPractice
THE REVISED NASA 1998 DESIGN AND
DEVELOPMENT CYCLE FOR AIRFRAMES SYSTEMS
ANALYSIS
In 1998, NASA produced a draft final report outlining a modeling strategy for air-frame development cycle analysis. As noted in that report:
“The single greatest liability in building a capability in vehicle develop-ment cycle analysis is the lack of publicly available historical (empirical)information. In addition, the decisions regarding how the process for anew design should be structured are extremely subjective. Together,these factors lead to a very blurred story from industry both on how theyconduct design today and how design is envisioned in the future. Thisblurred information embodied the available data upon which to build amodel for development cycle analysis.” 1
With this and other caveats, the NASA report cited two primary data sources usedto develop the modeling outline described in the report. One was a Boeing paperproduced as a deliverable to an AST contract involving integrated wing design.2
The second source was a set of published reports regarding the developmentschedule for the Boeing 777 aircraft.3 As is made clear early on in the NASA re-port, information derived from the 777 program is more relevant for new, as op-posed to derivative, design cycles.
The NASA model of design cycles is broken down into five sequential phases:
◆ Early configuration and market analysis
◆ Product definition
◆ Detailed structural, systems, and process design
◆ Fabrication,assembly, and testing
1 NASA Systems Analysis Branch, ASAD, “Final Report on MOASS 98 Airframe Develop-
ment.”2 NASA Contract NAS1-20267, presentation for Task 10.3 See Footnote 1 citation, Section II.

3-2
◆ Flight testing.
The timeline is shown in Figure 3-1. Each of these steps is discussed in more de-tail below.
Figure 3-1. 1990 State-of-the-Art Airframe Development Cycle
Early Configuration and Market Analysis
The key element in configuration and market analysis is to identify customer andproduct needs. There is an important interaction between customer airline needsand the manufacturer’s product lineup. Both Boeing and Airbus have a lineup ofproducts that reflect the large up-front capital costs involved in designing, testing,and manufacturing a jet aircraft. Because of these large expenses, a small numberof designs form the basis for the derivative aircraft types offered by both manu-facturers. Both companies offer a large number of variants from these base de-signs with differentiated product characteristics (range, speed, fuel economy, seatand cabin space, etc). The primary purpose of the market analysis phase is toidentify needs of potential customer airlines and whether they can be met withcurrent products, variants of these products, or if a new aircraft design may be re-quired. This determination is crucial due to the extreme variation in design cycletime and costs for new aircraft designs versus derivative ones.
During this phase, design and tradeoff studies may be used to identify basic rangeand/or payload parameters. In addition, potential market size, likely customers,and price ranges may be analyzed. In turn, these analyses will depend on projec-tions of air travel demand, current fleet sizes, and offer prices of other existing
Firs
t Flig
ht
Early Configuration& Market Analysis
Product DefinitionDetail Structural,Systems& Process Design
Fabrication, Assembly & Testing
Flight Test
(12 Plus Mos)
Cycle 1 Cycle 2 Cycle 3
(24 Mos)
(18 Mos)
(30 Mos)
(12 Mos)
Initi
al C
usto
mer
Req
uire
men
ts,
Con
cept
& M
arke
t • Series of three design, analysis & testing cycles• Each cycle includes four wind tunnel models processed (independently) in parallel with performance reviews and configuration rework linking cycles
- Cruise Aero- Low Speed Aero- Loads- Stability & Control
• Final loads (<9 Mo.)• CAD/CAE• Certification basis• Control law design• Simulations• Manufacturing process & logistics
Mol
d Li
neF
reez
e
• Component fabrication• Component testing• Major assembly• Static test• Fatigue test• Systems installation• Development of training & support services
Cer
tific
atio
n &
Firs
t Del
iver
y
8 YEARS
Tooling, Facilities & Industrial Equipment
EmbeddedSoftware Dev.
Software Functionality Refine Software DevelopBlack Boxes
Ironbird Validation& Verification

Models of the Aircraft Development Cycle Theory and Practice
3-3
aircraft. An increasingly important aspect of this analysis phase for both Boeingand Airbus is the competitive analysis of the other companies’ potential productoffers and/or plans. In this model, the market analysis phase is assumed to take upthe first 12 months of the development cycle.
Product Definition
The product definition phase contains all of the preliminary design and other workneeded to develop a fixed mold line. For modeling, the NASA report identifiesthree consecutive design/wind tunnel cycles, each of which is assumed to takeapproximately 8 months. At the end of each cycle, the design strategy may be re-vised. It eventually converges to an acceptable design at the end of the third cycle.Each cycle is assumed to consist of four parallel wind tunnel models that gothrough design and testing. Aircraft models are built and tested for
◆ high speed aerodynamics (cruising);
◆ low speed aerodynamics (takeoff and landing);
◆ stability and control tests; and
◆ load tests.
The NASA model defined a detailed design structure matrix to capture the inte-grability of the four phases of wind tunnel testing. This matrix is described in de-tail in the ASAD final report. As noted above, the NASA model assumes threeconsecutive wind tunnel cycle models. As noted in the NASA report, Cycle 1 isassumed to typically fail to meet performance or handling objectives. Cycle 2meets performance objectives but fails handling objectives. Finally, Cycle 3 meetsboth performance and handling objectives.
Detailed Design
The detailed design phase contains all of the design work needed to go from amold line to cutting metal. The primary driver in this phase is the creation ofmanufacturing drawings and data sets and their interrelationships, which entaildetailed structural analysis. In practice, the detailed design work is broken out bymajor aircraft systems, for example:
◆ Fuselage
◆ Wings
◆ Landing gear/tail/rudder
◆ Flight controls (internals)
◆ Flight controls (surfaces and attachments)

3-4
◆ Fuel system
◆ Nacelle/pylons
◆ Electrical system and wiring
◆ Cockpit
◆ Cabin
◆ Auxiliary power unit
◆ Fixed equipment
◆ Environmental controls
◆ Engines
◆ HVAC.
The detailed design phase is assumed to take 18 months and involves the exten-sive use of computer aided design and engineering functions, repeated simulationanalyses, analysis of various manufacturing, process, and logistics issues, certifi-cation issues, and determination of final load designs.
Fabrication, Assembly, and Testing
This phase of the design cycle involves component fabrication, major assembly,testing (both static and fatigue), systems integration, and development of trainingand support services. New designs may also require the construction of new tool-ing facilities and equipment, and derivative designs may require changes in cur-rent tooling and equipment facilities. For modeling, this phase was assumed totake 30 months, although clearly the actual time consumed will depend impor-tantly on whether the design is new or derivative. As an aside, it should also bementioned that floor space requirements might become an important issue in thisphase depending on the wing span and other size characteristics of the aircraft un-der development.
Clearly the fabrication and assembly steps are important aspects of this phase thatmay serve as bottlenecks before certain types of testing can be started; however,certain system functionality testing work can be done before fabrication is com-plete. In addition, it is important to note that for certain aspects of ground testing,actual physical checks for defective parts or other shortfalls must be completed.For these purposes, computer simulation is not appropriate. Another importantaspect of this phase is the integration of various aircraft systems. Much of thetesting for systems integration may be carried out by third party manufacturers;however, they are typically verified by an in-house systems integration laboratory
Models of the Aircraft Development Cycle Theory and Practice
3-5
(SIL). Test airplanes may be developed for static, fatigue and/or flight testing.Those that undergo flight testing are eventually sold to customers.
Another important aspect of this phase involves certification testing, which in-cludes type certification (e.g., valid FAR Part 25 certificate), insurance that pro-duction manufacturing processes produce aircraft that conform to technicaldrawings, airworthiness certification, airline certification, and flight crew/cabincrew certification.
The fabrication, assembly, and testing phase is assumed to take approximately 30months in the NASA model. This may include the development of several testaircraft in preparation for flight testing.
Flight Testing
The key elements of this phase involve the validation of performance estimates,exploration of the flight envelope, and certification flight tests. Typically, com-puter simulation cannot be used on new aircraft for certification purposes. How-ever, some derivative designs can be certified with the aid of computersimulation. In addition, certain engine certifications can be completed in windtunnel testing. This phase ends with the modification and delivery of the first air-plane to a customer. Again, flight testing depends importantly on whether the de-sign is new or derivative.
Summary
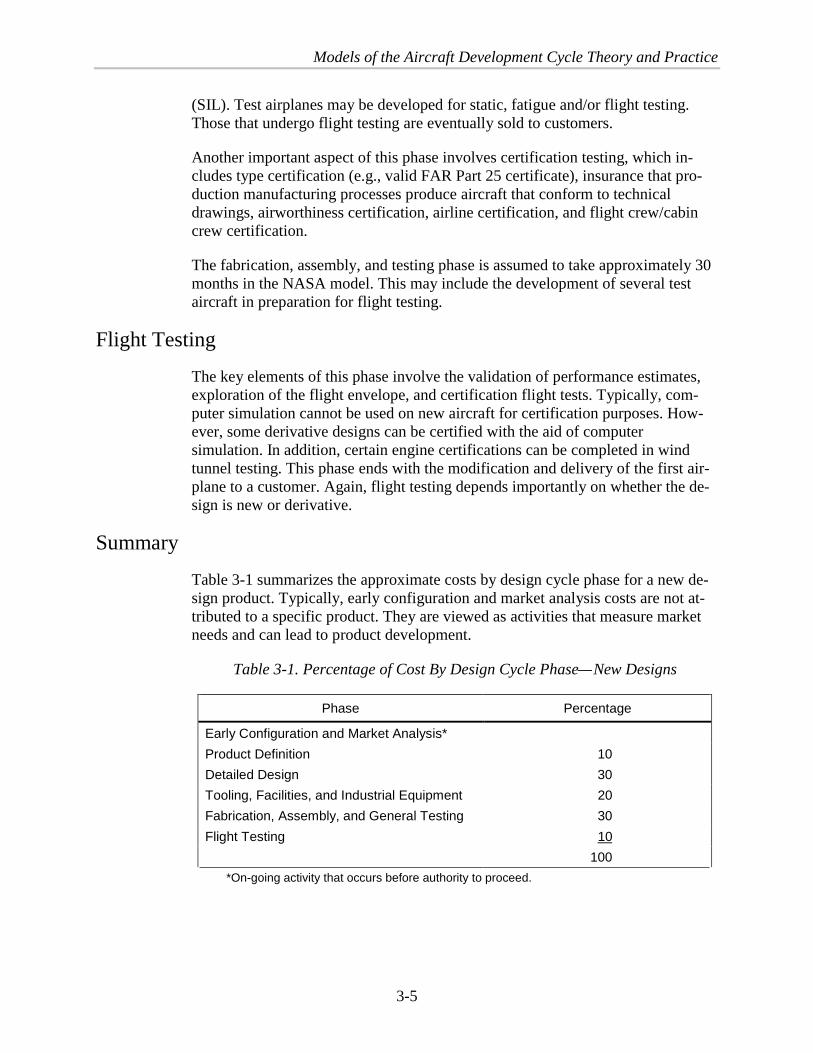
Table 3-1 summarizes the approximate costs by design cycle phase for a new de-sign product. Typically, early configuration and market analysis costs are not at-tributed to a specific product. They are viewed as activities that measure marketneeds and can lead to product development.
Table 3-1. Percentage of Cost By Design Cycle Phase—New Designs
Phase Percentage
Early Configuration and Market Analysis*
Product Definition 10
Detailed Design 30
Tooling, Facilities, and Industrial Equipment 20
Fabrication, Assembly, and General Testing 30
Flight Testing 10
100
*On-going activity that occurs before authority to proceed.

3-6
MANUFACTURER COMMENTS ON THE BASE CASE
NASA MODEL DESIGN
The study team participated in interviews with two major aircraft design groups toconfirm and refine the design cycle elements and times used in the base NASAmodel. The interview questions are contained in Appendix A. For confidentiality,the actual responses are not included in this report, but were used throughout thestudy and are embedded in this report.
These interviews essentially confirmed the validity of the basic structure de-scribed above, although both sources emphasized that each aircraft design isunique and so it is quite difficult to specify a generic model that would be appro-priate for any particular design.4 In addition, the magnitude and span of eachmodel component may vary with the size of the vehicle being developed and theamount of new design required. Entirely new programs may require large invest-ments at each step and longer development times. In derivative programs, certainsteps in the generic model may have to be lengthened or adjusted, while othersmay be curtailed substantially. For example, facilities from an older design maybe reusable during the design process of a derivative aircraft (although toolingfacilities and/or other machinery tends to wear out over time).
The regulatory environment continues to change, and this can have differentialimpacts on different programs. For example, the Boeing 777 program included anobjective of achieving ETOPS certification concurrently with FAA certification.This required dramatically more test flight activity than would otherwise havebeen the case. Sources indicate that ETOPS added approximately 2,000 flighthours to the test flight program.
In addition, manufacturers may have to contend with both FAA and JAA (Euro-pean) regulators whose certification requirements can vary from each other. Forexample, JAA requirements regarding escape hatches on some of the derivativeBoeing 737 programs required extensive redesigns that added several months tothe design cycle process.
A general theme common throughout the interviews was that the design cycle isentirely different for new products as opposed to derivative ones. The time fromearly configuration and market analysis to first delivery has typically spannedfrom 6 to 8 years for entirely new designs, compared to 28 to 40 months for de-rivative products. Development costs of a major derivative can incur non-recurring costs of 75 percent of those of a new design while for a relatively minorderivative, the costs can be from ten to 25 percent of a new design.
4 One of these design groups played a role in developing the base NASA model so it is not
surprising that it corroborated its earlier work.

Models of the Aircraft Development Cycle Theory and Practice
3-7
Early Configuration and Market Analysis
The early configuration and market analysis phase is one that manufacturers al-most always are active in. Only some of these efforts lead to product launch deci-sions. These mostly involve analysis and studies carried out by market research,preliminary design and competitive analysis staff. One manufacturer maintainsalmost a constant dialogue with the largest airlines; however, the level of re-sources dedicated to this activity is not large when viewed in the context of thecosts to develop a new aircraft.
A key milestone in any design process is the issuance of an authorization to pro-ceed from the manufacturers executive decision-makers. While the NASA docu-ments we reviewed do not specifically discuss it, a key element in the pre-ATPtimeframe is the development of a product specification document. Such a docu-ment describes the configuration that is to be offered for sale and defines the air-craft’s performance characteristics. An essential part of the sales offer is theissuance of performance guarantees. The product specification document, if suc-cessful, should lead to the emergence of a firm customer consensus about the needfor and product characteristics of the aircraft to be produced.
When the product specification is complete, company decision-makers may thengrant an Authority To Offer (ATO), which is needed to obtain credit financing forthe large development costs that will be expended prior to first delivery.
With the product specification document completed, ATO granted, and financingarranged, sales personnel then could begin to attempt to “sell” the product to po-tential customers. Finally, only after a certain predetermined number of units are“sold” can Authority to Proceed (ATP) be approved by top management. In manycases, ATP approval is based not only on the number of units sold, but also on thenumber and identity of launch customers. For example, firm orders from a leadingcarrier obviously carry more weight than soft (optional) orders from lesser carri-ers. Once official ATP approval is given, the program is officially launched andthe “hard” design cycle activities begin.
Clearly, customer and product needs are essential issues that have to be satisfacto-rily addressed before the rest of the design cycle can be pursued. The manufactur-ers must deal with marketing, finance, engineering and flight operations groups atpotential customer airlines. Often airline performance needs are stated in terms ofcritical city-pairs in their route systems that must be served without payload deg-radation on most days.
Again, the time and effort devoted to this phase is very dependent on new versusderivative designs. However, the manpower, analysis and studies that go intothese analyses involve relatively minor costs as compared to the funds expendedduring the rest of the design cycle. For the largest airline, the aircraft manufactur-ers are essentially in the marketing and early configuration phase on a continuousbasis. For these reasons, the NASA systems study model can safely treat this

3-8
phase as a fixed block of time with little or no reduction in the time or cost ex-pended.
Product Definition
One aircraft design group believes that product definition is the formal start of anew or derivative aircraft program. As described earlier, the NASA model identi-fies three consecutive design cycles in this phase, each lasting an 8-month period.This sequence is roughly accurate, for example, for the Boeing 777 program, butfor derivatives, there may be no essential need for three cycles, and on unconven-tional or new kinds of vehicles (High-Speed Civil Transport, Large Blended WingBody) there may be a need for additional cycles.
Variability in the 8-month iteration schedule is probably significant and reasons forexpansion or compression arise in real time and are dealt with as they occur.Within each cycle, the NASA model specifies four parallel wind tunnel modelsthat go through design and testing. The manufacturers indicated that the wind tun-nel activities generally are in fact operated independently, and may involve differ-ent model scales and geographically separate tunnels. It is the high lift cycle testthat is critical for the models to pass in order for the program to proceed further.
The manufacturers also indicated that in the future there likely would not be aneed to conduct three consecutive wind tunnel cycles. Instead, elements of thecycle will be staggered along with mold line release for different parts of the air-craft.
As for cost parameters, it was estimated that the product definition phase probablyconsumes one-quarter to one-third of total engineering costs. The cost of tunneloperation varies somewhat based on tunnel size and site capabilities, but from alarger perspective, wind tunnel activities themselves probably represent less than3 percent of the total development cost.
Manufacturers believe that significant opportunities exist in this phase for reduc-tions in cycle time and cost. The replacement of physical tests with virtual (com-puter-based) tests is regarded as the primary way to reduce times and costs in thefuture. However, a leading concern is the issue of liability in accidents or failures.Recent Delta III launch vehicle failures suggest that a reliance on virtual testinghas some risks.
In general, low speed testing, loads testing, and simulation are the focus of themanufacturers current cycle time reduction efforts. The goal is to produce fasterwind tunnels, pressure sensitive paints, faster data reduction, and process im-provements, including changes in management style and processes. For low-speeddesign, one goal is to extend computational fluid dynamics (CFD)-based testingand analysis from cruise mode to other activities. Overall, one design team be-lieves it could reduce time in the product definition phase by 50 percent over afull-year period.

Models of the Aircraft Development Cycle Theory and Practice
3-9
Detailed Design
Aircraft manufacturers have traditionally broken out the detailed design work intosections of the aircraft, along the lines described earlier. The fuselage, wing, andtail structures are further subdivided into smaller sections. There are many manu-facturing limitations in detailed design work that significantly affect design timeand costs. These include supplier availability, required sizes of aluminum sheets,hangar sizes, airport limitations, and transportation parameters such as the turningradius of railway track and the size of railway flatbed cars. The manufacturerssuggested that the cockpit, wings, and horizontal tail typically take the longest todesign and are the most expensive elements.
It is in the detailed design phase where systems integration becomes critical. Allengineering disciplines participate in the integration process and initiatives sug-gested for streamlining the preliminary design are applicable at this point as well.The systems integration process includes not only the integration of the variouscomponents of the aircraft, but also consideration of factory layout options. Aswith the other phases of the development cycle, the time and cost associated withdetailed design varies from program to program, and may be quite different fornew designs as opposed to derivative ones.
The manufacturers are making significant efforts to incorporate component com-monality in various sections of the aircraft, so that some component designs canbe reused across programs. Significant efforts are being focused on cockpit andmaintenance commonality. In addition, parametric computer aided design tech-niques are being implemented to enable derivative designs to be mixed on thesame line. With these sorts of efforts, the manufacturers hope to garner significanttime and cost reductions over the next 5 to 10 years.
The manufacturers are also investing heavily in knowledge-based engineering(KBE) concepts. These techniques are being used to supplement traditional CAD-based automation to help shorten the design process. KBE incorporates both“generative modeling”—the ability to create engineering models that can in turncreate other models themselves, and “total product modeling”—models that in-corporate not only engineering parameters, but also financial and marketing crite-ria. Airbus has used knowledge-based engineering techniques in its design of theA340-600, a stretched version of the existing A340-300 aircraft. The KBE ap-proach was used to design and analyze all of the rib feet used in the stretch A340wing design. The rib feet are flanges used to bolt the wing skin to each rib thatruns from the front to the back of the wing and stringer, along its length. Each ribfoot is slightly different from its neighbor; using conventional CAD techniqueswould have taken approximately one full man-year to design and analyze all ofthe feet. Airbus developed software that itself was able to create the CAD modelneeded for the rib feet. The entire rib design for the A-340 wing was completed inless than one man-day.

3-10
Many of the improvements incorporated into this phase, such as laser-guided toolsand computer aided design, show up downstream in reduced aircraft productioncosts. Overall, one team expects one-half of the costs for some activities in thisphase could be eliminated over 5 years. Not all product elements—such as longlead-time items are susceptible to this level on cost (and time) reduction.
Tooling, Facilities, and Industrial Equipment Development
This is an additional phase cited by the manufacturers’ interviewees that must becompleted before the actual fabrication assembly and testing phase is begun. Newtooling facilities and equipment are always required for new design, and becausetools tend to wear out over time, refurbishments or replacements must be com-pleted even for derivative designs. For example, Boeing noted that some of the727 fuselage tools could be used for the 757 program, but at that point these toolswere wearing out and many of them had to be replaced.
An important consideration here is the size of the aircraft under development. Inparticular, increases in wing span necessitate larger factory floor spaces. Also, itis interesting to note that Airbus has only two basic body cross-section designs,while for Boeing each aircraft is different.
Savings in setup times and more efficient use of floor space are short-term goalsthat the manufacturers hope to achieve within the next 5 years; the company has agoal of reducing floor space used in production by 10 percent in 1 year and by 20percent in 5 years. In addition, efficiencies may be gained from the use of adap-tive tooling, laser alignment and knowledge-based engineering. These subjects arebeing investigated at MIT under the Lean Aircraft Initiative Program.
Fabrication, Assembly, and Testing
As described earlier, this step includes component fabrication, major assembly,static and fatigue testing, and training and support services development. Formodeling, the manufacturers noted that the fabrication and assembly componentscan be treated as recurring cost items while the static and fatigue testing, softwaredevelopment, and training and support services are nonrecurring cost items.
It should also be noted that a significant portion of software development is oftenconducted concurrently with hardware design and often has a longer time span. Itshould also be noted that additional tests for propulsion, avionics and fixedequipment systems are carried out during this phase as well. For new designs,static tests are often conducted on airframes where some non-essential or redun-dant components have been replaced by “mass simulations.” Similarly, fatiguetests are often performed on discrete rigs for the wing, fuselage, and tail struc-tures. Also, ground tests for derivative aircraft may be significantly curtailed rela-tive to new programs.
A typical build of test airplanes may look like the following:

Models of the Aircraft Development Cycle Theory and Practice
3-11
◆ Airframe No. 1—flight testing
◆ Airframe No. 2—flight testing
◆ Airframe No. 3—static testing
◆ Airframe No. 4—flight testing
◆ Airframe No. 5—fatigue testing
◆ Airframe No. 6—flight testing
◆ Airframe No. 7—flight testing.
Flight Tests
This phase typically involves several aircraft. Historically, the actual number offlight test hours has grown over time. This is partially due to the increased strin-gency of required FAA certifications and the corresponding growth in aircraftsystem complexity.
It is important to note that significant time can be expended in designing and in-stalling the flight test instrumentation, as opposed to the flight testing itself. Forexample, the 757 and 767 had approximately the same number of test flight daysbut the 757’s non-flying days were much higher due to additional ground supportand documentation expenditures. One suggested rule of thumb was that a singletest airplane could provide somewhere between 30 and 50 flight hours per month.Thus, if an entirely new design (non-ETOPS) were to require, say 1,800 to 2,000flight hours to reach certification, this would entail approximately 40 aircraftmonths of test flying. With three or four aircraft included into the test program,the actual calendar time spent is approximately 1 year. The flight test span for de-rivative designs is currently on the order of 10 months for a typical program. Cur-rent goals are to reduce the time spent on flight testing from 12 months to 8 to 10months for new designs, and from 10 months to 4 to 5 months for derivative de-signs. This could be accomplished by relying more on the observed performanceof ground test rigs and the use of simulations in lieu of actual flight tests.
REVIEW OF BOEING 777 DESIGN CYCLE INNOVATIONS
Parts of the NASA generic model described earlier closely follow the design pro-cesses used in the development of the Boeing 777 aircraft. The 777 developmentprogram represented a significant departure from the company’s traditional meth-ods of design and development. In particular, the program included a new productdefinition process and an integrated time-phased test program.

3-12
The product definition phase of aircraft development is a major cost driver formanufacturing costs. In turn, a large portion of manufacturing costs are due to therecurring costs that result from changes in product definition necessary to correctpart-to-part interferences. Traditionally, the identification of gaps between partsor part overlaps would require a long sequence of change activities, including fit-up, fastener redesign, description of the new part required along with part number,part definition and dimension, drawing clarifications, edge margin, and wholepattern definitions. The costs of these types of changes were traditionally quitehigh because they could come late in the development program and result in com-pletely reworked parts and tools.
A revised product definition process was instituted for the 777 program based ona strategy of concurrent engineering and three dimensional digital product defini-tion. Design integration was a key aspect of the 777 product definition strategy.To this end, the design phase was broken into six stages:
◆ Initial concepts—This included test requirements, firm structures configu-ration and a preliminary tooling plan
◆ Concept development—Preliminary loads and systems interfaces
◆ Configuration development—Firm configuration update and file structuraldiagrams
◆ Configuration refinement—Engineering data sets, final system diagrams,and initial assembly tool design
◆ Product development—Designs updated to final loads, final productionlayouts
◆ Product definition—All data sets prepared for release, final inputs, andtool designs.
The first four stages focused on creating a complete integrated design before re-leasing the product definition requirements for fabrication and assembly. Detaileddesign was completed in Stage 5 to support final product definition release inStage 6. The 777 program relied entirely on digital product definition, which in-cluded initiatives for digital pre-assembly, hardware variability control, and a pro-cess Boeing calls “design for reusability.”
The use of digital pre-assembly eliminated the need for physical mockups, whichhad traditionally been used to validate design integration and to define certaintypes of parts that could not be accurately described with two-dimensional draw-ings. Digital pre-assembly refers to the use of computer simulations to define partsand tools and to ensure that they will fit together before the parts data sets are re-leased for production. Hardware variability control is a process that Boeing used toimprove performance targets for shape, fit, appearance, service life, and safety.

Models of the Aircraft Development Cycle Theory and Practice
3-13
These top-level characteristics are flowed down to the detailed part level and sta-tistical analysis is conducted to optimize tolerance level and other specifications.
Boeing’s “design for reusability” strategy refers to its effort to standardize certainparts and features of aircraft that could be used across different programs. A re-lated aspect of this strategy was the identification of about 200 standard optionsthat covered the majority of individual customer requirements. Provisions forthese 200 standard options were incorporated into the basic design of the 777 toreduce change, error, and rework costs for individual customers.
The product definition changes described above resulted in significant cost sav-ings for Boeing; in addition, quality control was improved significantly relative topreviuos programs. These improvements in the product definition phase of thedesign cycle had their largest impact on costs and quality; the improvements donot appear to have significantly reduced design cycle times.
The 777 development program also included a wholly redesigned test programthat focused on the validation of design requirements, certification regulations,and customer operations. The program included supplier component testing,Boeing standalone lab testing, and three other laboratories focused on system-level integration testing. These labs included the Systems Integration Laboratory,used to provide airplane-level validation, the flight controls tests rig used to testall flight control components, and a cockpit engineering simulator called CAB2.All of these labs relied heavily on computer simulation to reduce the need forphysical testing.
The SIL performed almost 6,000 hours of testing for the 777 program. Almost4,000 hours of testing were conducted before the first actual flight of the first testairplane. As the flight test program proceeded, changes in solutions were testedand validated in the SIL before their application on the test airplanes.
The flight controls test rig was used to test all flight control components. About6,500 hours of testing was performed in this lab, which involved a significant in-crease in complexity relative to previous programs due to the fly-by-wire designof the 777.
As with the product definition phase, the innovative aspects of the 777’s flighttesting program related primarily to more efficient processes leading to cost sav-ings. It does not appear that actual reductions in cycle time were generated; this islargely due to the significant increase in technical complexity associated with the777 program.

3-14
POTENTIAL BENEFITS OF REDUCED CYCLE TIMES AND
LIKELY TARGETS OF REDUCTION EFFORTS
The benefits of CTR accrue at many levels and in a variety of forms, but the mostimportant metric is at the firm level, and that metric is in profitability. CTR af-fects profitability in two related ways, savings in cost and savings in time.
◆ Savings in costs allow better pricing strategies. The same aircraft of a fewyears earlier can now be built at a lower cost. This allows for more profitper aircraft as well as additional sales due to a lower purchase price.
◆ Savings in time also translate into bottom line profits. Loan terms, in-cluding amount and interest rate will be lower due to a shortened time tobreak even and lower borrowing amount and quicker cash flow from thebuyers.
All of these serve to create better shareholder value for the firm and a more com-petitive firm in the marketplace.
There are other ways to look at the benefits of CTR. One convenient way is tofocus at the operational level of the firm. Here the benefits are driven by fourmajor programs:
◆ Reducing engineering man-hours
◆ Reducing tooling hours
◆ Reducing test activity
◆ Implementing process and information technologies.
According to interviews with industry personnel, engineering man-hours are tar-geted for a 13 to 20 percent reduction over the next 5 years. The reduction pro-gram encompasses a wide range of projects, but almost all of them include someform of information technology. This is the modern form of substitution of capitalfor labor. A potential list of reduction programs follows:
◆ Automate design engineering, including incorporating knowledge-basedtools into CAD
◆ Design analysis limited to 3-D solids
◆ Improve CAD skills of the workforce
◆ Develop propulsion aerolines rapidly
◆ Find solutions for blade containment

Models of the Aircraft Development Cycle Theory and Practice
3-15
◆ Create a creation/design studio, as the auto manufacturers did
◆ Develop common structural analysis tools
◆ Apply CFD to the aerobody
◆ Analyze vehicle lines and loads analysis.
Tooling hours are targeted for 5 to 12 percent reduction over the next 5 years.These reduction programs involve incorporating industry best-tooling practicesand quality control, as well of introduction of new simulation and manufacturingtechniques. These reduction programs are shown below:
◆ Incorporate the best tooling practices for a flexible manufacturing center,including adjewel manufacturing
◆ Incorporate simulation of manufacturing processes
◆ Incorporate integrated tolerance analysis
◆ Create a single standard quality manual for all programs.
A set of test-related initiatives are expected to reduce test activity 8 to 12 percentover the next 5 years. These issues involve certification issues, redesign of testingactivities, and development and deployment of new technology. These plannedreduction programs include:
◆ Development of a 9 month flight test program (currently 12 to 36 months)
◆ FAA oversight given to aircraft manufacturer monitors – expanded dele-gation
◆ Standard test process with off the shelf test plans
◆ Validation capability
◆ Standard validation for propulsion system
◆ Application of smart sensors for testing
◆ Certification of avionics
◆ Propulsion certification and compliance.
The last area is the implementation of process and information technologies.These are the set of tools and practices not related to aircraft manufacturing inparticular; but are associated with developing processes, practices, and tools thatlead to a more efficient and productive operation of the firm at both the strategicand operational levels. Areas designated for emphasis include:

3-16
◆ Establish standard decision analysis tool set for the managers
◆ Implement portfolio management
◆ Screen IR&D projects in accordance with a set of objectives
◆ Overhaul data links to critical suppliers
◆ Develop generic airplane study capability
◆ Create a neural formation network
◆ Integrate into a paperless factory.

4-1
Chapter 4 Market Impacts and the Realization of Benefits ofReduced Cycle Time
NASA’s program to improve its capabilities in vehicle development cycle analy-sis may benefit from new forthcoming economics evidence. A forthcoming studyin the American Economic Review authored by C. Lanier Benkard provides newevidence on the nature of learning economies in the commercial aircraft industrywhich has direct implications for the benefits of reduced cycle time and forNASA’s own vehicle analysis programs.
DYNAMIC EQUILIBRIUM IN THE COMMERCIAL
AIRCRAFT MARKET
Benkard’s paper1 (available at: www.stanford.edu/~lanierb) suggests a significantdeparture from the usual characteristics of learning economies first described inpapers immediately after World War II. During the war, it was found that the pro-duction of certain large-scale weapons systems (battleships, airplanes) exhibitedsignificant reductions in costs over the production run as the workforce learned“how best to assemble and integrate complex systems into a single vehicle.”These same types of learning economies are attributed to the production of mod-ern commercial aircraft, which feature the integration of multiple complex sys-tems. Because of the significant investment required to develop such vehicles,initial units may cost five to ten times as much as later units in the production run.
The existence of learning economies has significant implications for public poli-cies,2 briefly summarizing two of the more relevant implications:
u Because marginal costs are thought to decline continuously over the pro-duction run, some observers have deemed commercial aviation to be a“strategic” industry where government involvement through subsidy orother supports may result in the company gaining significant cost advan-tage over its competitors; in some instances these advantages may be long-term or “permanent.”
u Traditional economic models of competitive markets do not accommodatedeclining marginal cost industries; pricing at marginal cost results in thefirm not being able to recover its initial investment; such circumstances
1 C. Lanier Benkard, “Dynamic Equilibrium in the Commercial Aircraft Market.”2 See: GRA: “Economic Analysis of Aeronautical R&T: A Survey,” (November, 1999), pre-
pared for Office of Aerospace Technology, NASA Headquarters.

4-2
have been recognized in numerous regulated industries including trans-portation and communications. An essential issue for public policy is howbest to set prices in such industries.
Recent Advances
While the learning economies’ models provide useful information on some of thekey characteristics of the commercial aircraft market, they do not accommodatesome of the real world circumstances that have been observed. For example, foryears economists have observed that under certain circumstances commercial air-craft manufacturers sometimes price their products below marginal cost. In almostany circumstance, such behavior would be deemed to be irrational since a companyshould not be selling a product for less than the resources consumed in producing it.
To explain these anomalies, Benkard developed a dynamic model for the com-mercial aircraft industry. For this discussion, the most important feature of thismodel is the observation that learning economies depreciate over time when theyare unused. Benkard estimates that a firm’s learning economies depreciate at anannual rate as high as 40 percent due to attrition in the workforce, changes inwork assignments, and simple losses in proficiency in seldom repeated tasks. It is,therefore, important for the firm to maintain a constant rate of production, or toincrease the rate of production in order to continue to benefit from decreasingcosts promised by learning economies.
Benkard’s paper is based on data on the L-1011 program. He observes that pricesexhibit yearly variances of no more than 10 to 20 percent, but that average vari-able costs can vary by a factor as large as 50 percent. Using a sophisticatedeconometric model, he finds that the variance in annual production rates has di-rect and dramatic effect on learning economies. As a result, his model was able toexplain why throughout much of its life, the price paid for L-1011 aircraft wasbelow the company’s average variable cost. When the firm was unable to main-tain a steady production rate, its costs increased dramatically. This caused it toreduce its prices in an effort to fill empty production slots. It also explains whycommercial aircraft manufacturers may choose to produce white tails in lieu ofslowing down their production lines. The white tails may be a lower cost optionthan laying off workers and risking significant increases in production costs.
Dynamic Equilibrium Models
Benkard’s model is dynamic in the sense that it portrays the features of the com-petitive process including the following:
u Outcomes in each time period (market shares, revenue, costs) for eachcompetitor depend on the competition among them and the demand forproducts.

Market Impacts and the Realization of Benefits of Reduced Cycle Time
4-3
u Manufacturers compete by offering differentiated products and by varyingprice to optimize expected profits.
u Demand for aircraft may be affected by random shocks in the overalleconomy, which is consistent with other studies showing that the demandfor aircraft is strongly correlated (with a lag) with overall economic con-ditions.
u In each time period, the manufacturer seeks to adjust its production rateand its price to maximize its expected profits over the remaining years ofthe product’s life. The company’s cash flow performance is directly af-fected by the product and price offerings of its competitors and the overalldemand in the marketplace.
This kind of model captures the problems manufacturers have in maintaining asmooth production run over a product’s life cycle to realize the maximum gainsfrom learning economies. When demand fluctuates over the business cycle, theoverall demand for aircraft rises and falls. Faced with changes in demand, com-petitors may choose to vary prices to smooth their production runs. During down-turns in demand, prices may fall significantly below average variable costs, andstay there for significant periods of time as manufacturers make forward commit-ments to fill production slots. Alternatively, manufacturers may choose to vary theproduction rates. During downturns, they risk significant increases in productioncosts as output falls. This can have further consequences in the future if the manu-facturers’ production efficiency is low relative to its competitors.
In each time period, the model allows manufacturers to exit the market when thescrap value of an existing program is higher than the expected future cash flows.Likewise, new competitors may commit to enter the market in circumstanceswhere new products (featuring new technologies) appear to have significant com-petitive advantage in the marketplace.
IMPLICATIONS FOR NASA VEHICLE DEVELOPMENT
CYCLE ANALYSIS
NASA has already developed the detailed cost of modeling capabilities that areessential for evaluations of new vehicle developments. These models can also beused to assess the value of reduced development cycle times. Application of someor all of the dynamic features found in Benkard’s model would improve NASA’scapabilities by
u more accurately portraying the learning economies’ issues faced by manu-facturers and, in particular, the implications of varying production rates;

4-4
u the dynamic aspects of the aircraft manufacturing market including varia-tions in the demand for aircraft and the effects of competing airplanes onexpected manufacturer cash flows;
u portraying the advantages of reduced cycle time including, in particular,reducing the time between commitment to a program and its entry into themarketplace, and thereby improving the likelihood that expected produc-tion rates would be realized in the future.
Each of these potential improvements is discussed and illustrated briefly below.
THE EFFECTS OF VARIABLE PRODUCTION RATES ON
LEARNING ECONOMIES
To illustrate how variable costs are affected by changes in production rates, wehave developed a simpler version of Benkard’s model. The following are the sali-ent features of the model:
u Assume that a manufacturer is considering a new version of a large, singleaisle aircraft with a target price of $55 million. The total market for thistype of aircraft is estimated to be 100 units per year over the next 24 years.
u If the manufacturer can beat its competitor to the market with this version,it can command 70 percent of the market; once its competitor enters, itsexpected share will be 50 percent.
u Assume after the first year that the manufacturer can expect a 10 percentannual reduction in marginal costs in each year that production rates are atleast 90 percent of the previous year’s production.
u Assume in those years when production rates fall below 90 percent of theprevious year’s rate, learning economies will depreciate by four percent.
u Assume that the first 10 units have an average variable cost of $85 millionper unit.
u Assume that the initial development costs spread over four years are$2 billion.
If the manufacturer can bring its product to market after 4 years of development,it will beat its competitor to market by 1 year and enjoy a 70 percent market sharein that year.
A static analysis of the prospects for this project assuming a 7 percent discountrate is shown in Table 4-1. The expected net present value of the project is $622million. The nominal internal rate of return is 8 percent, or 1 percent higher thanthe discount rate.
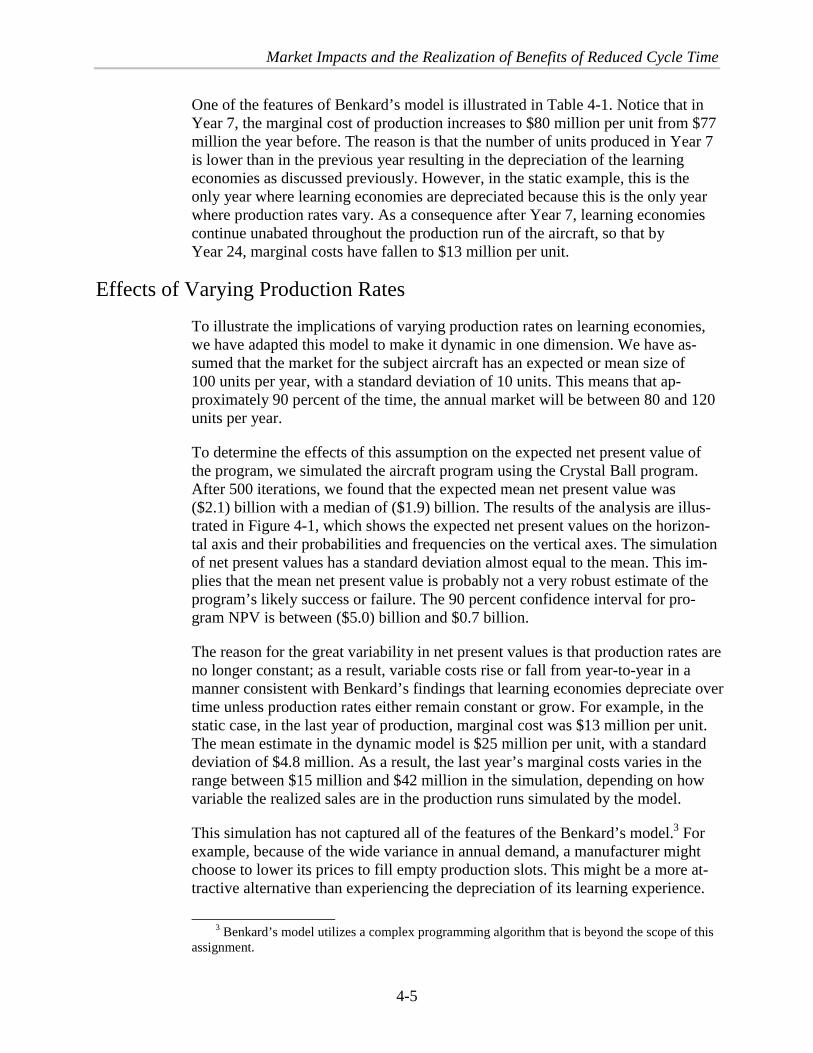
Market Impacts and the Realization of Benefits of Reduced Cycle Time
4-5
One of the features of Benkard’s model is illustrated in Table 4-1. Notice that inYear 7, the marginal cost of production increases to $80 million per unit from $77million the year before. The reason is that the number of units produced in Year 7is lower than in the previous year resulting in the depreciation of the learningeconomies as discussed previously. However, in the static example, this is theonly year where learning economies are depreciated because this is the only yearwhere production rates vary. As a consequence after Year 7, learning economiescontinue unabated throughout the production run of the aircraft, so that byYear 24, marginal costs have fallen to $13 million per unit.
Effects of Varying Production Rates
To illustrate the implications of varying production rates on learning economies,we have adapted this model to make it dynamic in one dimension. We have as-sumed that the market for the subject aircraft has an expected or mean size of100 units per year, with a standard deviation of 10 units. This means that ap-proximately 90 percent of the time, the annual market will be between 80 and 120units per year.
To determine the effects of this assumption on the expected net present value ofthe program, we simulated the aircraft program using the Crystal Ball program.After 500 iterations, we found that the expected mean net present value was($2.1) billion with a median of ($1.9) billion. The results of the analysis are illus-trated in Figure 4-1, which shows the expected net present values on the horizon-tal axis and their probabilities and frequencies on the vertical axes. The simulationof net present values has a standard deviation almost equal to the mean. This im-plies that the mean net present value is probably not a very robust estimate of theprogram’s likely success or failure. The 90 percent confidence interval for pro-gram NPV is between ($5.0) billion and $0.7 billion.
The reason for the great variability in net present values is that production rates areno longer constant; as a result, variable costs rise or fall from year-to-year in amanner consistent with Benkard’s findings that learning economies depreciate overtime unless production rates either remain constant or grow. For example, in thestatic case, in the last year of production, marginal cost was $13 million per unit.The mean estimate in the dynamic model is $25 million per unit, with a standarddeviation of $4.8 million. As a result, the last year’s marginal costs varies in therange between $15 million and $42 million in the simulation, depending on howvariable the realized sales are in the production runs simulated by the model.
This simulation has not captured all of the features of the Benkard’s model.3 Forexample, because of the wide variance in annual demand, a manufacturer mightchoose to lower its prices to fill empty production slots. This might be a more at-tractive alternative than experiencing the depreciation of its learning experience.
3 Benkard’s model utilizes a complex programming algorithm that is beyond the scope of this
assignment.

4-6
Alternatively, it might be less expensive for the manufacturer to produce whitetails than to layoff personnel and experience the learning diseconomies.
Table 4-1. Static Analysis of a Proposed Program
Figure 4-1. Simulated Results of a Manufacture Program WithVarying Annual Market Sizes
Frequency Chart
.000
.010
.019
.029
.038
0
4.75
9.5
14.25
19
-6,000 -4,000 -2,000 0 2,000
500 Trials 4 Outliers
Forecast: npv 4 year cycle tim e
CumulativeDiscounted Discounted
Total Cumulative Total Total Profit @ Profit @Year Market Units MC Cost Revenues Costs Profit 7% 7%
1 100 0 500 0 500 -500 -467 -4672 100 0 1,000 0 500 -500 -437 -9043 100 0 85 1,500 0 500 -500 -408 -1,3124 100 0 85 2,000 0 500 -500 -381 -1,6945 100 10 85 2,850 550 850 -300 -214 -1,9086 100 70 77 8,205 3,850 5,355 -1,505 -1,003 -2,9107 100 50 80 12,183 2,750 3,978 -1,228 -765 -3,6758 100 50 72 15,763 2,750 3,580 -830 -483 -4,1589 100 50 64 18,985 2,750 3,222 -472 -257 -4,415
10 100 50 58 21,885 2,750 2,900 -150 -76 -4,49111 100 50 52 24,495 2,750 2,610 140 67 -4,42512 100 50 47 26,844 2,750 2,349 401 178 -4,24713 100 50 42 28,958 2,750 2,114 636 264 -3,98314 100 50 38 30,861 2,750 1,903 847 329 -3,65415 100 50 34 32,573 2,750 1,712 1,038 376 -3,27816 100 50 31 34,115 2,750 1,541 1,209 409 -2,86917 100 50 28 35,502 2,750 1,387 1,363 431 -2,43718 100 50 25 36,750 2,750 1,248 1,502 444 -1,99319 100 50 22 37,873 2,750 1,124 1,626 450 -1,54320 100 50 20 38,885 2,750 1,011 1,739 449 -1,09421 100 50 18 39,795 2,750 910 1,840 444 -64922 100 50 16 40,614 2,750 819 1,931 436 -21423 100 50 15 41,351 2,750 737 2,013 425 21124 100 50 13 42,014 2,750 663 2,087 411 622
Nominal IRR 8.1%
Incremental

Market Impacts and the Realization of Benefits of Reduced Cycle Time
4-7
Effects of Reduced Cycle Time
Suppose that the same manufacturer had the opportunity to reduce its cycle timeand get to market 2 years earlier than posited in the base case. Assume that theinitial development investment was identical. As a result, the manufacturer wouldexperience the full cost of the development program earlier, which, from a dis-counted cash flow perspective, is more expensive than spreading it over a 4 yearperiod. Offsetting this, however, is the opportunity to get to market earlier, whichwould result in 2 additional years during which the company could expect tocapture 70 percent of the market before its competitor entered.
A simulation run using these assumptions results in a slightly improved expectednet present value of ($1.5) billion. The expected last year’s marginal cost has alsobeen reduced to $21.8 million per unit. The net present value results are illustratedin Figure 4-2.
Figure 4-2. Simulated Results of a Manufacturer Program With ReducedDevelopment Cycle Time
Frequency Chart
.000
.009
.017
.026
.034
0
4.25
8.5
12.75
17
-7,000 -4,500 -2,000 500 3,000
500 Trials 5 Outliers
Forecast: NPV 2 year, same variance as 4 year
The Effects of Reducing the Variance in Production Rates
One potential consequence of getting to market earlier would be locking in morecustomers earlier than a competitor. This might give the company a better oppor-tunity to smooth out its production run which would help it realize larger reduc-tions in marginal costs over the product’s lifecycle.
To simulate this set of circumstances, we have reduced the standard deviation,that applies to a market demand, from ten in the previous simulations to five in

4-8
the present case. Assuming, again, that the company is now able to get to marketin a two-year cycle time, the results are as follows:
u Expected or mean net present value is now positive $0.8 billion, a levelthat is higher than in the static case described earlier.
u The median present value is $1.2 billion, or approximately twice as highas the net present value in the static case.
u While the standard deviation of the simulation remains relatively high, themajority of the simulated net present values are positive.
The results for this simulation are illustrated in Figure 4-3.
Figure 4-3. Simulated Results of a Manufacturer Program With 2-Year CycleTime and Reduced Demand Variables
Frequency Chart
.000
.014
.028
.042
.056
0
7
14
21
28
-3,000 -1,625 -250 1,125 2,500
500 Trials 7 Outliers
Forecast: NPV 2 year, lower variance than 4 year
As one would expect, the reduction in the variability in market demand has adramatic effect on realized learning economies. The expected marginal cost in thelast year of production for this simulation is $14 million per unit, with a median of$14.4 million. These last year marginal costs are 65 percent of the estimated levelfrom the previous case where the company was able to develop an aircraft in only2 years, but experienced greater variation in demand.
Of course, these results are only illustrative. But they suggest how powerful theinsights are in the new learning economies’ models.
Market Impacts and the Realization of Benefits of Reduced Cycle Time
4-9
IMPLICATIONS FOR NASAThe new economics literature on learning economies suggests that the riskinherent in new aircraft development may be even larger than originally posited.While commercial aircraft production is subject to significant learning economies,companies can benefit from these economies to a much greater extent if they areable to maintain or increase their annual production rates. When there are widevariations in production rates, there will be a significant depreciation in learningbenefits, and the realized economics of the program may be disappointing.
As the simulations illustrate, just a few years of declining production can have adramatic effect on realized learning economies. As firms are forced to layoff per-sonnel and reorganize production activities, learning economies depreciate. Evenwhen the production rates increase later during the life of the product, it may bedifficult to overcome an earlier slump in sales. As a consequence, the last years ofproduction when the marginal costs are expected to be extremely low may, infact, be quite costly because learning economies have not been fully realized inthe program.
These findings alone have important implications for the NASA program. To theextent that the risks in the commercial aircraft market have been previously un-derestimated in static models, there may be a more important role for the govern-ment (including NASA) to play. For example, to the extent that new R&T resultsmake it possible to reduce aircraft development cycle time, the simulations haveillustrated two benefits:
u Getting to market earlier means that the company will have more opportu-nities to dominate a particular market segment before a competitor can re-act; if a company can lock in more customers, it has a better chance ofboth producing more units and smoothing the production run over theproduct’s lifecycle and thereby realize its learning economies.
u By getting to market faster, the forecast for the product and the expectedprofitability of the program are more likely to be realized; clearly a com-pany will know more about a market a year from now than it will aboutthe same market 5 years from now; the opportunity to reduce its marketrisk exposure is one of the chief benefits of reducing development cycletime.
Given the time and resources available in this project, we have not been able todevelop a fully dynamic model. However, such a dynamic model would provideimportant insights on other issues relevant to the commercial aircraft market andto NASA programs. For example:
u Given the adverse consequences of interrupting production cycles, manu-facturers may find it less expensive to produce white tails or significantlyreduce their prices in order to fill empty production slots; by smoothing

4-10
out the production run, learning benefits can continue to be realized andthis may be preferable despite the costs of producing white tails or of re-ducing prices.
u Manufacturers’ incentives to produce new products can be significantlyinfluenced by first mover advantages; the opportunity to lock in customersand smooth out the production run can lead to substantial learning econo-mies; once one company has successfully entered, the dynamic modelssuggest that its competitors may face a more difficult time justifying a newprogram (with similar characteristics); the second or third entrant into aproduct category may face greater variability in the demand for theirproducts, and therefore are less likely to realize learning economies. As aresult, one can expect that the products offered in the market will be dif-ferentiated; once one competitor is first in the market, others will wait un-til new technologies can be integrated into their product offerings andthereby provide a significant benefit to leap frog the initial mover.4
u The dynamic equilibrium models also tend to reinforce the application ofstrategic trade theory to the commercial aircraft industry; first mover ad-vantages may be particularly important in this industry given the variabil-ity in the demand for aircraft over the product cycle; second or thirdmovers in such markets are likely to be more severely disadvantaged thanin other industries where production rates are larger and more predictable.
The new economics on learning economies is also generally supportive of theNASA R&T program. Greater risk in the commercial aircraft market portrayed inthese dynamic models make it even less likely that private aeronautics firms willinvest in optimal levels of research and technology. By stimulating the develop-ment and dissemination of new R&T, NASA’s programs provide more opportu-nities for industry to develop more productive products more quickly. As aconsequence, while first movers will always have advantages, these advantageswill be eroded more quickly as new technologies are integrated into competingproducts. This will tend to happen more quickly through the stimulation of theR&T process.
4 In turn, the first mover can use limit pricing to discourage new entry and/or can update its
existing product with new technology.

5-1
Chapter 5 Benefits Framework for Cycle Time Reduction
The short-term benefits of CTR strategies primarily accrue to the aircraft manu-facturers. Their benefits are fairly straightforward and are most easily denomi-nated in the metric of dollars. On the other hand, the benefits to NASA are not asdirect, nor are they easily calculated or denominated. NASA’s benefits tend to besecondary and derived from the primary benefits that accrue to the aircraft manu-facturers.
The previous chapter lists the potential benefits of reduced cycle times and likelyreduction targets. To recap, at the operational level the reduction targets are to
u reduce engineering man-hours;
u reduce tooling hours;
u reduce test activity; and
u implement process and information technologies.
These reduction targets are not goals in of themselves, but are the operationallinks to a set of strategic goals. The strategic goals focus on reductions which af-fect the price that customers are invited to pay. They are reductions in:
u Product development cycle time
u Product cost
u Product/performance/change in sales
u Development program expense.
Product development cycle time refers to lowering the time of building any air-craft. In theory, it can be accomplished both with an increase or decrease in costs.The case of an increase in costs is not necessarily negative, but needs to be ex-amined closely to see that the positive benefits of a shorter development timeoutweigh the negative benefits of a cost increase.
The preferred option is where costs either decrease or stay the same, but the timeis shortened. The benefits in this form are multiplicative. Shorter cycle timeslower borrowing costs while simultaneously increasing cash flow and loweringcapital risk. Thus increasing the firm’s competitive position while adding toshareholder value. Furthermore shorter times usually mean lesser production

5-2
costs, and lesser production costs can mean increased sales because of a lowerprice. Shorter cycle times can also preserve sales and market shares in a fixeddemand marketplace.
Product cost is a major determinant of the volume of aircraft sold, with the gen-eral rule being the lower the cost of the aircraft, the more that can be sold, andvice versa. Therefore product cost is a key component of the profitability of theproduct line. Lower product cost can be accomplished by either cost reductionand/or cycle time reduction.
Development program expense is very much related to Product cost. It representsthe cost incurred until the first unit is sold. Those costs are key as they first de-termine the feasibility of the project then ultimately the profitability of the project.
These four strategic goals can also be examined as to when in the cycle time thesavings occur. This is key because equal savings, either in money and/or time, atdifferent times or phases of the development cycle can translate into very differentfinal aircraft prices. Most of this effect is due to the nature of capital intensivemanufacturing. Typical costs splits are 15/85, non-recurring/recurring. But, be-cause the recurring manufacturing practices are defined by the non recurring por-tion of the cycle, a little savings in the non recurring costs can translate to majorsavings in the recurring costs. In addition, recurring costs are affected by a learn-ing/improvement curve that determines the rate that costs decline with increasedoutput. The decline rate is not a simple function of people learning to do tasksmore efficiently, but is based more on correcting engineering and technical errorsmade in the non-recurring phase.
These four goals are also linked to each other, as changes in one will affect theothers. This linkage is shown in Table 5.1. The table shows how a percentagechange in one affects the other. For instance a 14 percent decline in Productdevelopment cycle time produces a 7 percent decline in Product cost.
Table 5-1. Linkage Of CTR Goals
Product develop-ment cycle time Product cost Change in sales
Developmentprogram expense
Productdevelopmentcycle time
-14/-7 -14/+10 -14/-7
Product cost -7/+10 -7/-17
Change in sales +10/-17Developmentprogram expense

Benefits Framework for Cycle Time Reduction
5-3
This is a somewhat of aggregate look at the effects of CTR strategies. Anotherway is to look at where in the development cycle costs reduced. Given a simplecost profile over time as shown in Figure 5-1. The Cumulative cost profile is alsoshown there. Costs can be reduced in any of 3 ways:
Option 1: Costs are reduced by a constant amount over the entire cycle
Option 2: Costs (and hence time) are reduced late in the cycle
Option 3: Costs (and hence time) are reduced early in the cycle
These 3 results are shown graphically. Each of these costs reductions will producea different cumulative cost profile.
Option 1: Cumulative cost is reduced by a constant amount
Option 2: Cumulative cost is drastically reduced
Option 3: Cumulative costs have a minor reduction
This highlights the points that not only are reductions important, but where thereductions occur are even more significant.

5-4
Figure 5–1. Cost-Cycle Time Curve-Effects on Cumulative Costs
Time
CostCumCost
Time

Benefits Framework for Cycle Time Reduction
5-5
BENEFITS FRAMEWORK
Evaluation of the benefits that accrue to the aircraft manufactures is fairlystraightforward. It is simply the net present value of the savings due to
u reductions in non recurring costs;
u improvements in the learning curve;
u initial cost of the first production unit; and
u increased buildup up the production rate.
This breakout in some sense may be the best as it is the factor components of thefour strategic goals. There are other equally valid ways to characterize the bene-fits. They can also be calculated by cycle phase, by engineering group, or by anyother reasonable classification
The benefits accruing to NASA are not as direct. Most are derived from the air-craft manufacturers benefits. Increased market share, sales and profitabilitytranslates into additional aircraft manufacturing and airline employment. Addi-tional aircraft help lower relative emission and noise rates while raising safetyrates. The technologies developed for civil aircraft cycle time reduction can firstbe applied to the defense aircraft industry and then adapted by other industries.

6-1
Chapter 6 Tailored Cost Model Analysis
During the course of this work effort, the study team was tasked to investigate thepossibility of upgrading NASA’s Tailored Cost Model (TCM) to facilitate themeasurement of potential benefits likely to arise from the successful implementa-tion of various NASA CTR related programs. TCM is an in-house computermodel used by NASA that analyzes the economics of developing new commercialaircraft. This spreadsheet-based model relies on historical relationships betweencost and various independent variables that characterize aircraft size, perform-ance, features and complexity.
TCM uses weight as a primary factor in estimating the various cost componentsthat are treated as part of the development process. Table 6-1 provides an over-view of the major cost elements that form the basis for the model. A detailed de-scription of the model is re-printed as Appendix B.
Table 6-1. TCM Cost Element Breakdown
COST ELEMENT REMARKS
MATERIAL/EQUIPMENT
• High Value Equipment
• Manufacturing Material
Engines/Avionics
All other material and equipment items
LABOR
• Engineering
• Test Engineering
• Development
• ILS Engineering
• Manufacturing
• Manufacturing Support
• Quality Assurance
• Tooling
• Project Management
Design, Technical Staff, Liaison, Administration & ProjectEngineering
Flight/Ground Test Engineering
Test and Mockup Technicians
Maintenance Engineering, Support Equipment Design,Training, Publications
Factory Labor (Touch Labor)
Industrial Engineering, Scheduling, & FactoryManagement
Inspection & QA Management
Manufacturing Methods, Tool Design and Fabrication
Project & Business Management
OTHER DIRECT COSTS Travel, Overtime Premium, Other
The primary purpose of the task undertaken here was to incorporate a true timedimension into the model so that changes in specific components of the develop-ment cycle could be entered and their impacts on the rest of the cycle analyzed. Afurther requirement was to keep the basic structure of the initial TCM intact; this

6-2
was accomplished by appending information (in the form of additional work-sheets) without modifying the original model.1
The add-ons to the model also were designed to:
u Be broadly consistent with the development cycle structure describedabove in Chapter 3.
u Facilitate the input of estimated time/cost savings from NASA programpersonnel who may not be familiar with the overall structure of TCM in-puts and requirements.
DETAILED ANALYSIS OF TCM MODEL STRUCTURE
The general outline shown in Table 6-1 served as a starting point for the analysis;we then methodically went through each cost category to identify the ultimate in-put variables that depended directly on weight or that were fully hard-wired as-sumptions built into the model. This allowed us to identify the following sixunderlying cost categories:
u Basic Engineering
u Tooling and Facilities
u Ground Testing
u Flight Testing
u Manufacturing and Development Overhead
u Other Overhead Items.
Note that this basic structure does not include the “Early Configuration and Mar-ket Analysis” phase discussed in Chapter 3. By design, TCM was built to describethe design cycle process after Authority to Proceed (ATP) has been given for aspecific project.
Within the TCM framework, the overhead items (5 and 6) depend on cost totalsbuilt up from the other categories and are usually entered as fixed percentages ofthese totals. In addition, Categories 1 and 2 each have their own overhead items,which depend on the category cost totals.
Using TCM nomenclature, the Basic Engineering category includes Design Engi-neering and the following overhead items:
1 Note, however, that enhancements of the type discussed earlier in Chapter 4 related to
learning economies and demand uncertainty were not addressed here.

Tailored Cost Model Analysis
6-3
u Technical Staff and System Engineering
u Management/Administration/Spec/Drafting
u Avionics Lab Operations (a function of avionics weight).
The Tooling and Facilities category includes Initial Tooling, Purchased Materialsand the following overhead items:
u Manufacturing Support
u Quality Assurance.
Ground Testing is broken out into six specific testing subcategories:
u Wind Tunnel Tests
u Mockups and EDF
u Iron Bird Tests
u Static Tests
u Fatigue Tests
u Other Ground Tests.
Each ground testing category in turn includes Engineering, Development, andPurchased Materials components; in addition, the last four categories include aManufacturing component.
Flight Testing is broken out into Engineering, Development, and Purchased Mate-rials components.
For ease of exposition, Manufacturing and Development Overhead is treated as aseparate cost category; in the TCM framework, it is strictly a function of theManufacturing and Development cost totals estimated for each of the variousGround Testing components. It is broken into three subcategories:
u Manufacturing Support
u Quality Assurance
u Tooling M&R
Other Overhead Items is an amalgamation of the remaining cost items in theTCM. It is broken into five components, each with their own cost base:

6-4
u Integrated Logistic Support (ILS) — function of Design Engineering andFlight Test Engineering costs
u Project Management — function of Basic Engineering and in addition:
ä Initial Tooling
ä Tooling Overhead
ä Ground Test Engineering, Manufacturing, & Development
ä Flight Test Engineering and Development
ä Manufacturing Development and Overhead
ä Integrated Logistic Support
u Other Direct Costs — function of all items above
u Product Support — function of aircraft weight.
The structure outlined above is a complete and accurate representation of designcycle costs in the Tailored Cost Model that was presented to the study team. Thetotal cost associated with each component in turn depends on two factors: totalhours expended and unit labor cost (in dollars per hour). The only exceptions tothis are Purchased Materials (which are entered into TCM as pure dollaramounts), Other Direct Costs (which is a function of all other TCM costs exceptProduct Support), and Product Support (which is a function of aircraft weight).
DEVELOPMENT OF DESIGN CYCLE TIMELINE AND
IMPLEMENTATION IN TCMWith the TCM cost structure in hand, the next task was to assign each cost cate-gory onto a timeline, and to make these assignments interdependent, so thatchanges when one component was begun or completed would affect all futurecomponents not yet undertaken. Additional discussions were held with industrypersonnel to ascertain reasonable assumptions regarding the interdependence andduration of the various design cycle components; these were combined with theinformation gathered in the manufacturer interviews to derive a “Base Case”timeline for a generic design cycle. Among other things, this required convertingthe TCM cashflow analysis from annual to monthly.
A brief summary of the Base Case timeline is described below:
Basic Engineering — To be consistent with the Phase I structure, Basic Engi-neering and each of its components was divided into two subcategories: ProductDefinition and Detail Design. For analysis, Product Definition was taken to repre-

Tailored Cost Model Analysis
6-5
sent 25 percent of Basic Engineering, with Detail Design representing the re-maining 75 percent.2 The beginning of Product Definition is Month 1, with a du-ration of 24 months. Detail Design begins immediately after Product Definitionends, with a duration of 18 months.
Tooling and Facilities — Begins when Product Definition is 75 percent completeand its duration of 36 months.
Ground Testing
u Wind Tunnel Testing begins when Product Definition is 50 percent com-plete; duration of 24 months
u Mockups and EDF begin when Detail Design begins; duration of 18months
u Iron Bird Tests begin after Wind Tunnel Engineering ends; duration of 30months
u Static Tests begin after Iron Bird Engineering ends; duration of 16 months
u Fatigue Tests begin when Static Test Development begins; duration of 24months
u Other Ground Tests begins after Wind Tunnel Development ends; dura-tion of 13 months.
Flight Testing begins 9 months after Wind Tunnel Development ends; duration of28 months.
The costs for Purchased Materials are assumed to be expensed over the first 3months of each cost category. Finally, Manufacturing and Development Overheadand Other Overhead Items are expensed over time in direct proportion to the costitems on which they are based.
These assumptions result in a base case design cycle lasting 6 years; again, it isimportant to keep in mind that this does not include any design time allotted forearly configuration and market analysis activities. A picture of the implied time-line is shown in Figure 6-1, which allows us to see the overlap in the variousphases of the design cycle.
2 This is consistent with the interview estimate that typical Detail Design costs are about threetimes as large as costs incurred as part of Product Definition.

6-6
Figure 6–1. Base Case Timeline
A detailed layout of the design cycle timeline is shown in Table 6-2; the table in-cludes all of the cost elements described above, as well as unit cost assumptionsfrom the TCM, start time descriptions and durations for each category, and hourlyand total cost rollups. This table is taken directly from the “Dynamics” worksheetthat has been added to the TCM spreadsheet file used to analyze a new 300-passenger aircraft. The columns labeled “Baseline” show the default assumptionsdescribed above. The layout enables the user to easily make changes to the Base-line time assumptions by changing either the formulas in the Start column and/orthe number data in the Duration column.

Tailored Cost Model Analysis
6-7
A separate worksheet page entitled “Scenario” contains an input structure that al-lows the user to make changes in specific cost categories; these changes are en-tered as percentage changes from the baseline and can be used to assess projectedtime and cost savings from NASA or other programs that may impact on designcycle times. The layout is shown in Table 6-3. The category headings refer to thecost categories described above. In addition, the Basic Engineering section con-tains separate line items for various parts of the aircraft; these line items come di-rectly from the TCM layout that makes up the Basic Engineering category.
Changes entered into the Scenario worksheet (Table 6-3) feed directly into thecolumns labeled “Scenario” in the Dynamics worksheet (Table 6-2). It is assumedthat cost reductions translate directly into time reductions, so for example, a 25percent reduction in tooling costs would be accompanied by a reduction in thetime required to complete the tooling phase by 9 months (25 percent of the 36months shown in the baseline). The revised cost data in turn feed into the “Cash-flow” worksheet, where a monthly cashflow statement has been appended belowthe original TCM annual calculations. Here the user can view the impacts of thechanges entered into the Scenario worksheet. The changes in net present valueand/or IRR estimate may be of particular interest.

6-8
Table 6-2. TCM Dynamic Allocation By Month

Tailored Cost Model Analysis
6-9
Table 6-3. Scenario Changes
USE OF REVISED TCM TO MEASURE DESIGN CYCLE
BENEFITS OF NASA PROGRAMS
NASA provided a pre-filtered list of programs currently under development to thestudy team. The information provided included technology descriptions, estimatedTechnology Readiness Levels (TRLs) and likely implementation dates, along withsubjective judgments about likely technical impacts and “minimum success” pa-rameters. The task was to translate the program impacts into input variables thatcould be fed into the revised TCM model in order to assess the impacts on designcycle costs and time.
An initial list of 20 NASA programs were considered and reviewed for input intoTCM. By agreement with NASA, an initial screening was done to drop those
% C h a n g e C u r r e n t % C h a n g e C u r r e n tfr o m B as e l in e S c e n a r io H r s fr o m B as e l in e S c e n a r io H r s
(N o te : + in d icate s in cr e as e i n co s t; - in d icate s d e cr e as e )B A S IC E N G IN E E R IN G
P r o d u c t D e f in i t io n ( 2 5 % ) 2 ,1 7 1 ,7 8 4 D e t a i l D e s ig n ( 7 5 % ) 6 ,5 1 5 ,3 5 1 S T R U C T U R E S ( C O M P O S IT E ) S T R U C T U R E S ( C O M P O S IT E ) W in g G r o u p 0 .0 % 0 W in g G r o u p 0 .0 % 0 F u s e la g e G r o u p 0 .0 % 0 F u s e la g e G r o u p 0 .0 % 0 T a i l G r o u p 0 .0 % 0 T a i l G r o u p 0 .0 % 0S T R U C T U R E S ( C O N V ) S T R U C T U R E S ( C O N V ) W in g G r o u p 0 .0 % 8 1 , 4 0 3 W in g G r o u p 0 .0 % 2 4 4 ,2 0 8 T a i l G r o u p 0 .0 % 3 0 , 8 2 2 T a i l G r o u p 0 .0 % 9 2 , 4 6 5 F u s e la g e G r o u p 0 .0 % 3 0 9 ,1 4 2 F u s e la g e G r o u p 0 .0 % 9 2 7 ,4 2 5 N a c e l le 0 .0 % 4 0 , 1 0 6 N a c e l le 0 .0 % 1 2 0 ,3 1 8 S t r u t 0 .0 % 0 S t r u t 0 .0 % 0 A l ig h t in g G e a r 0 .0 % 3 3 , 1 0 9 A l ig h t in g G e a r 0 .0 % 9 9 , 3 2 7P R O P U L S IO N G R O U P P R O P U L S IO N G R O U P T u r b o f a n E n g in e 0 .0 % 1 0 6 ,1 2 5 T u r b o f a n E n g in e 0 .0 % 3 1 8 ,3 7 5 A c c e s s o r ie s & D r iv e 0 .0 % 1 2 , 5 2 7 A c c e s s o r ie s & D r iv e 0 .0 % 3 7 , 5 8 0 S ta r t & C n t ls 0 .0 % 0 S ta r t & C n t ls 0 .0 % 0 T h r u s t R e v e r s e r s 0 .0 % 1 8 , 8 8 1 T h r u s t R e v e r s e r s 0 .0 % 5 6 , 6 4 3 F u e l S y s te m 0 .0 % 1 6 , 2 7 2 F u e l S y s te m 0 .0 % 4 8 , 8 1 6F IX E D E Q U IP M E N T F IX E D E Q U IP M E N T D F C S /F lt M g t S y s te m 0 .0 % 0 D F C S /F lt M g t S y s te m 0 .0 % 0 S u r fa c e C o n t r o ls 0 .0 % 1 5 7 ,6 3 4 S u r fa c e C o n t r o ls 0 .0 % 4 7 2 ,9 0 3 A u x P o w e r S y s te m 0 .0 % 1 6 , 8 4 9 A u x P o w e r S y s te m 0 .0 % 5 0 , 5 4 6 I n s t r u m e n ts 0 .0 % 7 ,9 9 8 I n s t r u m e n ts 0 .0 % 2 3 , 9 9 3 H y d r /P n e u G r o u p 0 .0 % 7 4 , 8 5 9 H y d r /P n e u G r o u p 0 .0 % 2 2 4 ,5 7 7 E le c t r ic a l G r o u p 0 .0 % 2 5 , 3 5 6 E le c t r ic a l G r o u p 0 .0 % 7 6 , 0 6 8 E n v ir o n C n t l S y s t e m 0 .0 % 5 2 , 3 3 0 E n v ir o n C n t l S y s t e m 0 .0 % 1 5 6 ,9 9 1 A n t i I c e S y s te m 0 .0 % 1 1 , 7 8 7 A n t i I c e S y s te m 0 .0 % 3 5 , 3 6 0 F u r n & E q u ip m e n t 0 .0 % 6 3 6 ,1 4 7 F u r n & E q u ip m e n t 0 .0 % 1 ,9 0 8 ,4 4 2 L o a d & H a n d l in g 0 .0 % 0 L o a d & H a n d l in g 0 .0 % 0 S e a ts 0 .0 % 1 8 0 ,2 8 0 S e a ts 0 .0 % 5 4 0 ,8 4 1 L a v a t o r ie s 0 .0 % 2 5 , 9 2 0 L a v a t o r ie s 0 .0 % 7 7 , 7 5 9 G a l le y s 0 .0 % 9 3 , 9 2 0 G a l le y s 0 .0 % 2 8 1 ,7 6 1L A M I N A R F L O W S Y S T E M L A M I N A R F L O W S Y S T E M L F C S u c t io n S u r f a c e 0 .0 % 0 L F C S u c t io n S u r f a c e 0 .0 % 0 L F C D u c t in g 0 .0 % 0 L F C D u c t in g 0 .0 % 0 L F C C o m p r e s s o r / G n r t r s 0 .0 % 0 L F C C o m p r e s s o r / G n r t r s 0 .0 % 0A V IO N I C S A V IO N I C S D A C A v io n ic E q u ip 0 .0 % 3 3 , 8 6 8 D A C A v io n ic E q u ip 0 .0 % 1 0 1 ,6 0 3 B F E A v io n ic E q u ip 0 .0 % 7 3 , 9 5 4 B F E A v io n ic E q u ip 0 .0 % 2 2 1 ,8 6 1 F lt P r o v is io n s 0 .0 % 9 ,8 0 7 F lt P r o v is io n s 0 .0 % 2 9 , 4 2 1 M is s io n P r o v is io n s 0 .0 % 0 M is s io n P r o v is io n s 0 .0 % 0S O F T W A R E S O F T W A R E O p e r a t io n a l F lt S o f tw a r e 0 .0 % 1 1 2 ,2 4 1 O p e r a t io n a l F lt S o f tw a r e 0 .0 % 3 3 6 ,7 2 2 G r o u n d & E n g S o f tw a r e 0 .0 % 1 0 , 4 4 9 G r o u n d & E n g S o f tw a r e 0 .0 % 3 1 , 3 4 6
T O O L IN G A N D F A C IL I T IE S 1 4 , 7 1 5 ,1 6 5In i t ia l T o o l in g 0 .0 % 1 4 , 7 1 5 ,1 6 5P u r c h a s e d M a te r ia ls 0 .0 %
G R O U N D T E S T IN GW in d T u n n e l T e s t s 3 2 9 ,1 1 2
E n g in e e r in g 0 .0 % 1 2 6 ,7 0 3D e v e lo p m e n t 0 .0 % 2 0 2 ,4 0 9P u r c h a s e d M a te r ia ls 0 .0 %
M o c k u p s a n d E D F 6 9 8 ,4 8 6E n g in e e r in g 0 .0 % 5 5 1 ,5 4 8D e v e lo p m e n t 0 .0 % 1 4 6 ,9 3 8P u r c h a s e d M a te r ia ls 0 .0 %
I r o n B i r d T e s t s 6 3 3 ,9 4 0E n g in e e r in g 0 .0 % 1 7 9 ,0 3 4M a n u f a c tu r in g 0 .0 % 8 2 , 2 3 4D e v e lo p m e n t 0 .0 % 3 7 2 ,6 7 2P u r c h a s e d M a te r ia ls 0 .0 %

6-10
whose impact was focused on engine technologies. In addition, two additionalprograms were dropped because their impacts on the design cycle were consid-ered to be minimal. For the remaining 11 technologies, 24 different analyses werecarried out, involving four different-sized aircraft development programs (300seats, 225 seats, 150 seats and 100 seats), three probability scenarios based on therange of likely impacts (Low, Most Likely and High), and two evaluation years(2007 and 2022).
The Low and High scenarios were based on the lower and upper limits of pro-jected impacts, and the Most Likely scenario was estimated using the program’scurrent TRL level and the following technical confidence mapping estimatesshown in Table 6-4.
Table 6-4. TRL Impacts
Current TRL Level Estimated Relative Impact (%)
1 35
2 55
3 70
4 80
5 85
6 89
7 91
8 93
9 95
For example, if a technology with a current TRL of 4 was projected to cut, say,flight test engineering time by between 10 and 20 percent, then the Low estimatewould be set at 10 percent, the High estimate at 20 percent and the Most Likelyestimate at 18 percent (= 80 percent of the gap between Low and High).
The evaluation years of 2007 and 2022 refer to a design program beginning in thatyear. By agreement with NASA, for the 2007 case only those technologies pro-jected to be at TRL 9 by that year were included in the analysis; this accounted fora total of five programs. (All eleven programs were projected to be at TRL 9 bythe year 2022.)
For each scenario, the goal was to estimate overall reductions in design cycle timeand corresponding increases in manufacturer internal rates of return due to theprograms’ implementations. Table 6-5 lists all 20 programs and descriptions oftheir likely technical impacts and “minimum success” evaluations as provided byNASA; the table also indicates program inclusion or exclusion from the Year2007 analyses.

Table 6-5. Overview of NASA Programs

Tailored Cost Model Analysis
6-12
The next step involved translating the likely program impacts described in Ta-ble 6-5 into TCM inputs. This necessarily involved some subjective judgments;further discussions with industry personnel were conducted to enhance the reli-ability of these judgments. The translation results are shown in Table 6-6. As seenthere, many of the NASA programs considered here affected either the WindTunnel Testing and/or Flight Testing components of the development cycle. Oneopen question recurring throughout the analysis was whether the impacts werelikely to affect only the engineering portion of these test components, or the de-velopment portion as well. This is an important question since development costsare a large fraction of overall testing costs. For completeness, we computed re-sults both including and excluding possible impacts on test development costs.
Table 6-6. TCM Inputs Affected By Various NASA Programs
PROGRAM ELEMENT SUBELEMENT TECH NUM TECH NAME TCM Inputs Affected
522 11 71 2
Coupled Multidisciplinary Simulation
and Optimization
Basic Engineering - Structures - Wing Group, Tail
Group, Nacelle
522 11 81 2 Semi-span test techniques Wind Tunnel Test, Flight Test
522 11 81 3
Ground-to-Flight Performance
Prediction Wind Tunnel Test, Flight Test
522 31 61 1 Subsonic High-Lift Prediction Wind Tunnel Test, Flight Test
522 31 61 2 Airframe Noise Prediction Wind Tunnel Test, Flight Test
522 31 81 1 Computational Aeroelasticity Wind Tunnel Test, Flight Test
522 31 81 2 CFD for Stability and Control Wind Tunnel Test
538 14 0 1 Airframe Methods Wind Tunnel Test
548 20 23 1 Icing Simulation - CFD Development
Basic Engineering - Structures - Fixed Eqpt Design
- Anti Ice System
548 21 23 1
Aircraft Icing Effects - Tailplane Icing
Program Phase II Basic Engineering - Structures - Tail Group
577 50 10 1
Systems Approach to
Crashworthiness Flight Test

6-13
For each analysis, total impacts on the design cycle will be a function of all of the(included) program’s combined impacts. This brings into question how the pro-grams overlap with each other. A detailed technical analysis of these overlaps wasbeyond the scope of this assignment. For present purposes, we have assumed thateach individual program’s impacts are independent, but are applied sequentiallyto the design cycle. So for example, if there were a total of three programs pro-jected to impact flight testing, with savings of 10 percent, 20 percent and 20 per-cent respectively, then the combined impact of these programs would be to cutflight testing costs to 0.9*0.8*0.8 = 57.6 percent of the current baseline. Table 6-7shows the estimated combined impacts by TCM category for all NASA programstaken together. Note that very large reductions in wind tunnel testing and flighttesting costs are projected, particularly for the 2022 analyses.
These cost reductions were fed into the revised TCM spreadsheets for each of thefour different aircraft sizes described above. The reductions feed through the timestructure and into the cashflow analysis of the model. Summary results are shownin Table 6-7, where one can compare manufacturer internal rates of return (IRR)and total design cycle times under the Base Case and each of the scenarios.
Table 6-7. Estimated Combined Impacts on Design CycleCosts of NASA Programs
TCM cost categoryLow
2007 (%)Most likely2007 (%)
High2007 (%)
Low202(%)
Most likely200(%)
High 2022(%)
Production Defini-tion and Detail De-sign (Conventional) Wing Group 5.0 7.8 10.0 5.0 7.8 10.0
Tail Group 24.0 41.0 46.0 24.0 41.0 46.0
Nacelle 5.0 7.8 10.0 5.0 7.8 10.0
Anti-Ice System 15.0 31.0 35.0 15.0 31.0 35.0
Wind tunnel tests Engineering (Dev.) 19.0 26.4 32.5 70.6 85.5 93.2
Flight tests Engineering (Dev.) 19.0 26.4 32.5 46.9 61.2 71.1
Under the Year 2007 scenarios, the IRR’s increase from around 8 percent to the8.5—9.5 percent range, and overall design cycle times decrease by anywherefrom 2 to 17 months from the baseline level of 72 months. Under the Year 2022scenarios, much greater savings in wind tunnel and flight testing costs are as-sumed; this results in IRR’s reaching over 12 percent and overall design cycletimes decreasing by as much as 42 months. These results show the sensitivity ofthe model to assumptions about which NASA programs are likely to affect thedesign cycle and which cost components are affected, and suggest that further in-vestigation into the combined effects of programs which all claim to impact aparticular component (e.g., wind tunnel costs) may be warranted.
For present purposes, the incremental time impacts of individual programs can beestimated using a simple scaling procedure. The process was carried out only forthe 300-passenger aircraft forecasts. First, individual cost reductions were fed intothe TCM model one at a time for each NASA program, and the estimated impact

Tailored Cost Model Analysis
6-14
on the overall length of the design cycle recorded. These impacts were thensummed across all programs, and the total time reduction was compared to theresults shown in Figure 6-2.
Figure 6–2. Summary Effects of NASA’s CTR-Related Programs
As would be expected, the summed total of the individual impacts was greaterthan the grouped impacts shown in the table. The ratio of the grouped total to theindividual summed total was then used as a scaling factor to reduce the estimatedindividual estimates so that their sum total would exactly equal the grouped total.These scaled results for individual NASA programs are shown in Figure 6-3.
Estimated IRR's and Development Cycle Times for 300-Passenger AircraftBaseline: IRR = 8.03%, Total Cycle Time = 72 Months, A/C Sold = 800 @$133.165 Million
Low 2007 Most Likely 2007 High 2007 Low 2022 Most Likely 2022 High 2022
Excluding Wind Tunnel and IRR 8.21% 8.24% 8.38% 8.55% 8.63% 8.75%Flight Test Development NPV at Baseline IRR ($mil) 84.885 98.655 166.457 244.468 285.468 335.779
as % A/C Price 0.08% 0.09% 0.16% 0.23% 0.27% 0.32%Total Cycle Time 70 70 68 65 64 63
Including Wind Tunnel and IRR 8.72% 9.06% 9.40% 10.49% 11.24% 11.87%Flight Test Development NPV at Baseline IRR ($mil) 321.483 468.978 613.162 1,035.347 1,291.709 1,484.701
as % A/C Price 0.30% 0.44% 0.58% 0.97% 1.21% 1.39%Total Cycle Time 63 59 55 42 36 30
Estimated IRR's and Development Cycle Times for 225-Passenger AircraftBaseline: IRR = 8.07%, Total Cycle Time = 72 Months, A/C Sold = 800 @$88.500 Million
Low 2007 Most Likely 2007 High 2007 Low 2022 Most Likely 2022 High 2022
Excluding Wind Tunnel and IRR 8.26% 8.30% 8.45% 8.63% 8.74% 8.86%Flight Test Development NPV at Baseline IRR ($mil) 60.087 71.165 116.677 172.097 203.146 238.278
as % A/C Price 0.08% 0.10% 0.16% 0.24% 0.29% 0.34%Total Cycle Time 70 70 68 65 64 63
Including Wind Tunnel and IRR 8.79% 9.15% 9.51% 10.66% 11.46% 12.13%Flight Test Development NPV at Baseline IRR ($mil) 217.146 316.497 413.011 697.458 872.115 1,001.199
as % A/C Price 0.31% 0.45% 0.58% 0.99% 1.23% 1.41%Total Cycle Time 63 59 55 42 36 30
Estimated IRR's and Development Cycle Times for 150-Passenger AircraftBaseline: IRR = 7.98%, Total Cycle Time = 72 Months, A/C Sold = 800 @$46.308 Million
Low 2007 Most Likely 2007 High 2007 Low 2022 Most Likely 2022 High 2022
Excluding Wind Tunnel and IRR 8.20% 8.24% 8.40% 8.62% 8.75% 8.89%Flight Test Development NPV at Baseline IRR ($mil) 39.973 48.383 76.298 114.737 137.015 160.614
as % A/C Price 0.11% 0.13% 0.21% 0.31% 0.37% 0.43%Total Cycle Time 70 70 68 65 64 63
Including Wind Tunnel and IRR 8.75% 9.13% 9.50% 10.72% 11.60% 12.36%Flight Test Development NPV at Baseline IRR ($mil) 135.485 196.699 255.813 431.186 541.475 625.960
as % A/C Price 0.37% 0.53% 0.69% 1.16% 1.46% 1.69%Total Cycle Time 63 59 55 42 36 30
Estimated IRR's and Development Cycle Times for 100-Passenger AircraftBaseline: IRR = 7.96%, Total Cycle Time = 72 Months; A/C Sold = 800 @$38.170 Million
Low 2007 Most Likely 2007 High 2007 Low 2022 Most Likely 2022 High 2022
Excluding Wind Tunnel and IRR 8.19% 8.25% 8.41% 8.64% 8.79% 8.94%Flight Test Development NPV at Baseline IRR ($mil) 36.476 44.817 69.202 103.519 124.552 145.779
as % A/C Price 0.12% 0.15% 0.23% 0.34% 0.41% 0.48%Total Cycle Time 70 70 68 65 64 63
Including Wind Tunnel and IRR 8.76% 9.15% 9.54% 10.80% 11.72% 12.54%Flight Test Development NPV at Baseline IRR ($mil) 119.028 172.762 224.200 376.637 473.939 548.569
as % A/C Price 0.39% 0.57% 0.73% 1.23% 1.55% 1.80%Total Cycle Time 63 59 55 42 36 30
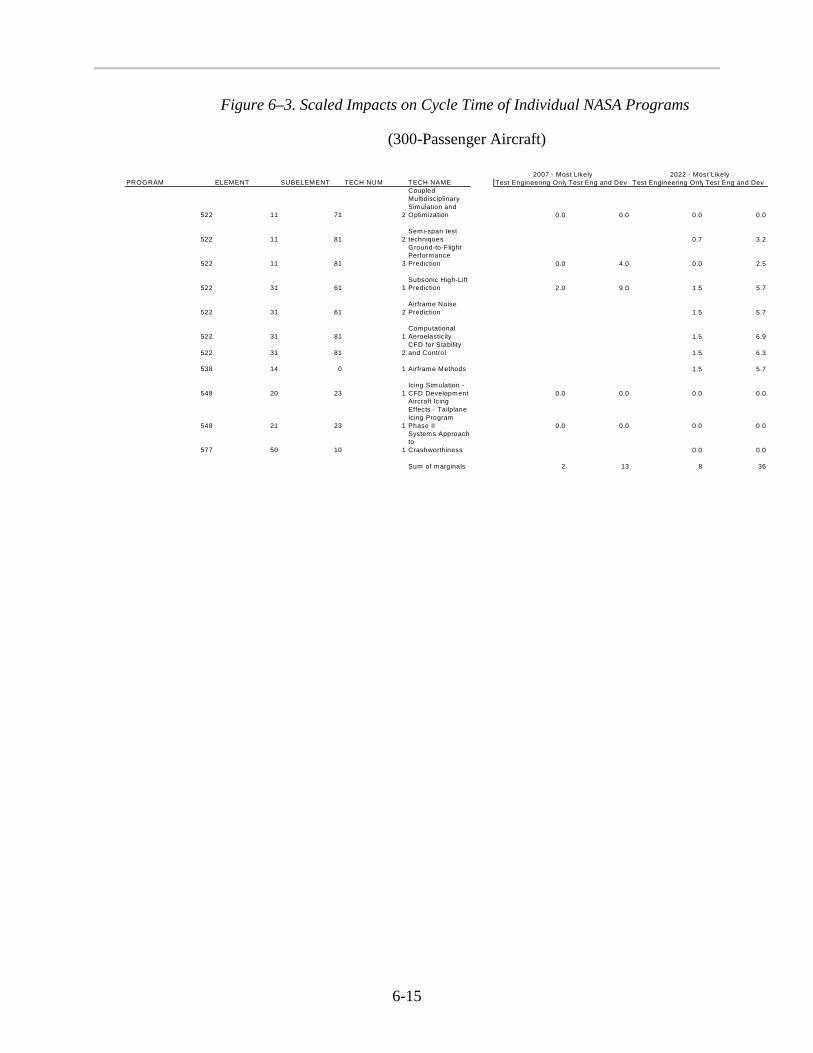
6-15
Figure 6–3. Scaled Impacts on Cycle Time of Individual NASA Programs
(300-Passenger Aircraft)
2007 - Most Likely 2022 - Most LikelyPROGRAM ELEMENT SUBELEMENT TECH NUM TECH NAME Test Engineering Only Test Eng and Dev Test Engineering Only Test Eng and Dev
522 11 71 2
Coupled Multidisciplinary Sim ulation and Optimization 0.0 0.0 0.0 0.0
522 11 81 2Semi-span test techniques 0.7 3.2
522 11 81 3
Ground-to-Flight Performance Prediction 0.0 4.0 0.0 2.5
522 31 61 1Subsonic High-Lift Prediction 2.0 9.0 1.5 5.7
522 31 61 2Airframe Noise Prediction 1.5 5.7
522 31 81 1Computational Aeroelasticity 1.5 6.9
522 31 81 2CFD for Stability and Control 1.5 6.3
538 14 0 1 Airframe Methods 1.5 5.7
548 20 23 1Icing Simulation - CFD Development 0.0 0.0 0.0 0.0
548 21 23 1
Aircraft Icing Effects - Tailplane Icing Program Phase II 0.0 0.0 0.0 0.0
577 50 10 1
System s Approach to Crashworthiness 0.0 0.0
Sum of m arginals 2 13 8 36

7-1
Chapter 7 Conclusions and Recommendations
This analysis was undertaken with the goal of examining commercial aircraft de-sign cycle processes and identifying techniques and factors that may lead to futurereductions in overall design cycle times. A complementary goal of the analysiswas to examine how NASA’s present research efforts may affect the design cycle.
The current NASA Airframe Development Cycle Time Reduction Goal is 50 per-cent by year 2022. The goal is not achievable based on the program analysis doneby the LMI/GRA team. It may very well be the case that the program technologyprogress factors, as determined by the NASA experts were understated. If that isnot the case, then the current roster of NASA Cycle Time Reduction programsneed to be reexamined. Programs which duplicate the reductions of others shouldbe replaced with other programs that offer non-duplicative reductions. In addi-tion, new programs targeting a specific part of the cycle can be developed, as wellas developing programs based on implementing best standards and practices.
Chapter 2 of the report provided a review of the literature and economic theoryrelevant for the aircraft manufacturing industry. In economic terms, the conven-tional view is that the industry has evolved into a duopoly, with Boeing compet-ing against Airbus. This view must be modified somewhat, when consideringcertain segments of the industry; in particular, the growing demand for regionaljet aircraft has led other smaller firms such as Bombardier, Embraer and Fairchildto enter the market and develop competitive products. Marketdemand and cost characteristics for the regional jet market are quite different thanthose for larger aircraft, and so the characteristics of the design cycle may also bedifferent.
For this report, we have focused on design cycles that are relevant for larger (more than 100 seats) commercial aircraft. For this segment of the market, the du-opoly characterization is appropriate. As discussed in Chapter 2, a number of eco-nomic factors affect the characteristics of the competitive environment in aduopoly; these include the nature of product differentiation, the rate of techno-logical innovation, economies of scale, and government policies (including subsi-dies, loan guarantees, spinoffs from military research and development, etc.). Allof these factors have had influences on entry and exit decisions in the industry, asdo the high barriers to entry that characterize the industry. This in turn has im-pacts on the design cycle, as investments in cost (and time) saving innovations ina duopoly market will occur when the private benefits are expected to exceed theprivate costs. This occurs despite the fact that the resulting competitive advantage(and profits) may be competed away over time as the other firm “learns” or imi-tates the innovation for its own competitive purposes.

7-2
Chapter 3 of the report discussed the revised NASA design and development cy-cle analysis prepared in 1998. This analysis provided a useful starting point formodeling that broke down the design cycle into five sequential phases:
u Early configuration and market analysis,
u Product definition,
u Detailed structural, systems, and process design,
u Fabrication, assembly, and testing,
u Flight testing.
Interviews with two major aircraft design groups were held to confirm and refinethe design cycle elements and times used in the base NASA model. These inter-views essentially confirmed the validity of the basic NASA structure, although itwas suggested that an additional phase involving tooling, facilities, and industrialequipment development could be added between Phases 3 and 4. A general themecommon throughout the interviews was that the design cycle is entirely differentfor new products as opposed to derivative ones.
The interviewees also provided important guidance on likely areas of cycle timereduction efforts over the next several years. Four major target areas were identi-fied:
u Reducing engineering man-hours,
u Reducing tooling hours,
u Reducing test activity, and
u Implementing process and information technologies.
A particularly important aspect of realizing the benefits of cycle time reductionsrelates to learning economies, which can have significant impacts on productioncosts and economic profits. Chapter 4 of this report discussed a simplified ap-proach to examining learning economies in a dynamic framework. An essentialfeature of this analysis included an explicit assumption that learning economiesdepreciate over time when they are unused. This implies that it is important for afirm to maintain a constant or increasing rate of production over time in order tobenefit from the decreased unit costs resulting from learning economies.
This has important implications for aircraft design cycles; the empirical simula-tions described in Chapter 4 showed that even small variations in production rates(especially in early years) can have dramatic effects on realized learning econo-mies, and hence on net profits. This has important implications for reductions indesign cycle times. In particular:

Conclusions and Recommendations For Future Analysis
7-3
Getting to market earlier means that the company will have more opportunities todominate a particular market segment before a competitor can react. If a companycan lock in more customers, it has a better chance of both producing more unitsand smoothing the production run over the product’s lifecycle and thereby realizeits learning economies.
By getting to market faster, the forecast for the product and the expected profit-ability of the program are more likely to be realized. Clearly a company willknow more about a market a year from now than it will about the same market 5years from now; the opportunity to reduce its market risk exposure is one of thechief benefits of reducing design time.
Chapter 5 presents a framework for the analysis of CTR derived benefits.NASA’s current Airframe Development Cycle Time Goal is a 50 percent reduc-tion in cycle time. This Goal, if achievable today, would translate into
(a) a 25% decrease in Product Cost(b) a 61% decrease in Development Program Expense(c) a 36% increase in Sales dues to both increased demand from lower price
and market share theft from early market entry.
For the airframe manufacturer the analysis is straightforward. CTR programs aredesigned to deliver aircraft faster and cheaper. The specific programs are de-signed to
(a) reduce engineering work-hours,(b) reduce tooling hours,(c) reduce test time, and(d) introduce process control and information technology throughout the
firm.
The purpose of these programs are toa) reduce non-recurring costs,b) reduce learning curve,c) reduce first production unit cost, andd) increase the production build-up rate.
At the operational level, the results of successful CTR strategies show up asa) decreased production development time,b) lower production costs,c) increased sales, andd) decreased in development program expense.
At the level of the firm these translate into increased cash flow, additional profits,and increased shareholder value.

7-4
For NASA and the general public, the benefits are those derived from the manu-facturers successful implementation of a CTR program. At the primary levelthere are the set of technologies implemented by the manufacturers that can bemodified and transferred other industries. In addition, there are the standard bene-fits derived from a healthy civil aerospace industry: additional aircraft sales, addi-tional manufacturing and airline industry employment, and the subsequenteconomic ripple effects. The secondary effects include the introduction of newaircraft and replacement of old ones. These effects are less air and noise pollutionas well as added safety in the commercial fleet.
In Chapter 6 attention was turned to NASA’s Tailored Cost Model (TCM). TCMis an in-house computer model used by NASA that analyzes the economics of de-veloping new commercial aircraft. This chapter described the new capabilitiesthat were added to the model, including the incorporation of a dynamic time di-mension and the addition of a simple input form to allow users to analyze the timeand cash flow effects of changes in specific components of the design cycle.
Chapter 6 also presented estimated results from employing the revised TCM tomeasure design cycle benefits of various current NASA programs. Under the Year2007 scenarios, manufacturer rates of return increase from around 8 percent to the8.5-9.5 percent range, and overall design cycle times decrease by anywhere from2 to 17 months from the baseline level of 72 months. Under the Year 2022 sce-narios, much greater savings in wind tunnel and flight testing costs are assumed;this results in rates of return reaching over 12 percent and overall design cycletimes decreasing by as much as 42 months.
Overall, the efforts undertaken in this project should provide a solid frameworkfor further empirical analysis of aircraft design cycles. The results from Chapters4, 5, and 6 in particular suggest that further efforts to improve the TCM or otherempirical models of the design cycle should address important features such asthe impact of learning economies, demand and production uncertainty, criticalpath analysis, and the combined interaction of different research programs whoseeffects may overlap with each other.

A-1
Appendix A Design Cycle Goals for the NASA Systems Study
This questionnaire was provided to the two aircraft manufacturers design groups.
Note: Two primary data sources used to develop this questionnaire:
a) 1998 NASA Systems Study
b) Boeing deliverable to an AST contract
u Published reports of 777 development schedule
ä more relevant for new (as opposed to derivative) design cycles
RECONFIRM THE GENERIC DEVELOPMENT CYCLE
Generic Five-Step Process:
u Early Configuration and Market Analysis
u Product Definition
u Detail Design
u Fabrication, Assembly, and Testing
u Flight Testing
Is the above generic process a reasonable way to characterize aircraft develop-ment cycles?
Are you familiar with any other generic structures?
Are the differences because of age of the design or aircraft style and what arethey?
How have the lengths and costs of each of the phases changed over time?
How and what are the changes in the phases you expect to see in the future?
What will be the desired effects? Are they likely to get them? And at what cost?
What processes need to be redesigned?
A-2
What processes can be eliminated?
Is the NASA Framework applicable to this firm or aircraft? Why or why not?
Early Configuration and Market Analysis — 12 Months (OnlyLoosely Discussed In NASA)
u Identify customer/product needs
u Manufacturer/customer interactions
u Design and tradeoff studies to identify range/payload parameters
u Market analysis — potential market size, likely customers, price ranges.
What else is going on in here besides manufacturer and customer iterations overrange-payload designs?
Over time, how has this process been changing?
Where can improvements be made to shorten it? Say, decreasing response timebetween iterations? Multiple designs, contingent designs? Wider range of initialrange-payload options? Seller or third party financing already in place?
What are the costs, benefits, and the effects on timely completion arising fromthese suggestions?
On average, or by specific aircraft, how much is spent in this phase?
How have customer/product needs been identified in the past? Specifics by air-craft type?
What is the nature of customer involvement in:
new versus derivative decisionmaking?
range/payload parameters (bottom line minimums or maximums) ?
engine choices (new versus derivative)?
What types of costs are involved?
Marketing staff
Engineering
Design studies
Paper/computer drawings

Design Cycle Goals For The NASA Systems Study
A-3
Other (e.g., engine analyses?)
Do costs vary by level of customer involvement or who the customers are?
Are formal design studies undertaken during this phase? How does this vary de-pending on new versus derivative?
If so, how many iterations are typical? How does this vary depending on newversus derivative?
How have advances in CAD/CAE affected initial design times and costs? Areadditional important changes expected in the future?
Do unit costs of these studies decline as the number of iterations increases?
How is market analysis carried out? Projections of air travel demand, fleet sizes,other existing aircraft sales, market size for specific aircraft being considered?High/low ranges?
Are all likely potential customers contacted, or does analysis rest on a fewlarge/important customers?
In general, is market development an ongoing process that could or should beseparated from the rest of any specific design cycle?
Is launch decision always the breakpoint before going on to product definition?
Product Definition—24 Months
u Contains all preliminary design needed to develop a fixed mold line
u Three consecutive design/wind tunnel cycles, each 8 months:
ä Cycle #1 typically fails to meet performance or handling objectives
ä Cycle #2 meets performance objects, but typically fails handling ob-jectives
ä Cycle #3 meets performance and handling objectives
u Re-evaluation and configuration update performed at end of each cycle
u Each cycle consists of four parallel wind tunnel models that go throughdesign and testing:
ä High-speed aerodynamics (cruise)
ä Low-speed aerodynamics (takeoff/landing)

A-4
ä Stability and control
ä Loads.
How accurate is this general structure?
Does number of cycles ever go below or above three? Does it depend on newversus derivative?
How much play is there in the 8-month time for each design cycle? Are there rea-sons for going longer/shorter, or is it all re-evaluated in real time?
Are the four wind tunnel models basically independent? If no, what is the natureof the overlap?
Are there cost differences among the four?
Do all four have to be completed before starting another cycle?
Which among the four are most/least variable? Which have the greatest potentialfor time/cost reductions in the future?
How has the structure changed over time? Has it been shortened or lengthened?
Can any of these tasks be performed via computer rather than the physical test?
What new technology or information is needed to delete a test?
Can tests be performed concurrently?
Is there a finer level of detail or subphases to this stage? If so, what are they?
What are your suggestions as to how this phase can be shortened and improved?
Computers?
CAD/CAM?
Concurrent?
Faster iteration?
What are the costs, benefits, and the effects on timely completion arising fromthese suggestions?
Detail Design (18 Months)
u Contains all design needed to go from mold line to cutting metal

Design Cycle Goals For The NASA Systems Study
A-5
u Final loads determined within first 9 months
u Primary driver is creation of manufacturing drawings and their relation-ship with each other, which entails detailed structural analysis.
How are the design plans broken out? By aircraft system? Identify major sys-tems, such as
u Fuselage,
u Wings,
u Landing gear/Tail/Rudder,
u Flight controls — internals vs. surfaces/attachments,
u Fuel system,
u Nacelle/Pylons,
u Electrical system and wiring,
u Cockpit,
u Cabin.
What is the nature of the costs associated with this design step?
What cost items can be broken out?
How much of the work (time/cost) is involved in integrating the systems to ensuredesign compatibilities?
Which systems take the longest to design? Does it vary by aircraft or by new ver-sus derivative?
How are certification requirements incorporated into design?
What is the nature of simulations undertaken at this stage?
How are manufacturing processes and logistics incorporated at this stage?
Where is the greatest potential for time savings? For cost savings?
Fabrication, Testing, And Assembly (30 Months)
u Component fabrication
u Major assembly

A-6
u Static and fatigue testing
u Systems integration
u Software development
u Training and support services development
u End result is first unit of production that will enter flight testing.
Is this an accurate generic description of the subitems involved in this designstep?
Where do each of these individual components appear on the time line? Howdoes this depend on whether the program is new versus derivative?
To what extent are these activities concurrent with each other? (Fabrica-tion/assembly is obviously not).
Where does the testing come in? Which items involve testing after fabrication?Which after assembly? How does this depend on whether program is new versusderivative?
Overall costs for this step? Cost estimates for each component?
Where is the greatest potential for time savings? For cost savings?
Is there a finer level of detail or subphases to this stage? If so, what are they?
What are your suggestions as to how this phase can be shortened and improved?
Computers?
Concurrent?
Faster iteration?
What are the costs, benefits, and the effects on timely completion arising fromthese suggestions?
What are the likely effects on the FAA Certification process?
Flight Testing (12 Months)
Required for certification
In general and by aircraft type, what is the time length spent in flight testing?
What is the cost? Total and by time outlay?

Design Cycle Goals For The NASA Systems Study
A-7
How has it changed over time? Has it been shortened or lengthened?
How has the computer cut costs and time? Will it continue to do so?
How much of this can be done by computer simulation?
How much of this is pilot ego?
Is there a finer level of detail or subphases to this stage? If so, what are they (arethey checking out particular systems on a particular flights)?
What are your suggestions as to how this phase can be shortened and improved?
What are the costs, benefits, and the effects on timely completion arising fromthese suggestions?
What are the likely effects on the FAA Certification process?

B-1
Appendix B Tailored Cost Model
The Tailored Cost Model (TCM) was developed by Greg Bell. A version of TCMwas made available to NASA under contract with McDonnell Douglas Aerospace,led by Mr. Bell. Over a period of years, TCM was developed to provide a mecha-nism for creating independent cost estimates; these could be used to provide“should cost” targets for functional organizations, or to support conceptual designstudies. This is a parametric model that relies on historical relationships betweencost and one or more independent variables that characterize system size, per-formance, scope, or complexity. The cost elements shown in Table B-1, form thebasis of estimate for the program acquisition phase of the life cycle cost.
Table B-1. TCM Cost Element Breakdown
Cost Element Remarks
Material Equipment
• High Value Equipment
• Manufacturing Material
Engines/Avionics
All other material and equipment items
LABOR
• Engineering
• Test Engineering
• Development
• ILS Engineering
• Manufacturing
• Manufacturing Support
• Quality Assurance
• Tooling
• Project Management
Design, Technical Staff, Liaison, Administration & ProjectEngineering
Flight/Ground Test Engineering
Test and Mockup Technicians
Maintenance Engineering, Support Equipment Design,Training, Publications
Factory Labor (Touch Labor)
Industrial Engineering, Scheduling, & Factory Management
Inspection & QA Management
Manufacturing Methods, Tool Design and Fabrication
Project & Business Management
Other Direct Costs Travel, Overtime Premium, Other

B-2
NON-RECURRING ENGINEERING
The aircraft system’s nonrecurring engineering is modeled within three basic sub-groups:
u Design Groups: These groups develop concepts, layouts, and detailed de-signs for structures, power plant, and various fixed equipment, avionic,and armament installations. Their efforts are modeled using weight de-pendent CERs. Software engineering is also modeled as a design groupusing lines of deliverable code as the CER driver.
u Technical Staff/Systems Engineering: These groups perform analyses thatverify and validate the aircraft system designs and include aerodynamics,thermodynamics, loads, stress, flutter, vibration, guidance and control, andweights. System level design integration, engineering simulation, and reli-ability/maintainability engineering groups are also included. Conventionaltechnical staff and systems engineering effort is modeled as a function oftotal design activity.
u Administrative/Management Engineering: These groups include drafting,configuration management, specification and process engineering, projectengineering. The effort covers the management and control of the engi-neering design process and its documentation; it is modeled as a functionof total design activity.
MOCKUP, TEST, AND DEVELOPMENT
The principal cost elements associated with test and mockup activity are test en-gineering and development labor. Test engineers are responsible for defining testrequirements, designing test rigs and instrumentation, supervising the conduct oftests, data reduction, and the preparation of summary reports. The developmentshop builds test rigs and instrumentation, installs instrumentation into test articlessupplied by the factory, sets up and performs the tests, and tears down the rig aftertest completion. The development shop is also responsible for building mockups.Class I mockups may be fabricated from wood and other inexpensive materials.Class II mockups may use actual aerospace hardware and may be used to defineharness, tube, and ducting interfaces. Ground test, flight test, and mockup activi-ties are modeled separately, with CERs for each engineering and developmenteffort.
u Structural Tests: The aircraft structures are subjected to static and fatiguetests to validate ultimate strength and vulnerability to vibration and cyclicloading.
u Subsystem Qualification Tests: New/peculiar subsystem equipment willrequire qualification and miscellaneous ground testing (Shake/Bake/etc.).

Tailored Cost Model
B-3
Certain components may require environmental testing. Special functionalrigs or bench testing (including an “iron bird” flight control rig) may berequired.
u Wind Tunnel Tests: Wind tunnel tests place instrumented subscale modelsrepresenting the aircraft into wind tunnels optimized for high speed or lowspeed aerodynamic evaluations. Wind tunnel test algorithms use tunneloccupancy hours as the independent variable.
u Software Integration Testing: A functional test bench is created to inte-grate software items and evaluate functional performance. Individualcomputer software configuration items are integrated to form the system.The system is tested to ensure that timing and memory constraints are sat-isfied, and that logic, interfaces, and protocols are correct.
u Flight Tests: Flight test activity is necessary to verify the performance ofthe integrated system. Flight test engineering covers the selection and de-sign of instrumentation, data collection and analysis, and the presentationof findings. Development includes instrumentation fabrication and instal-lation, servicing and maintenance of systems under test, and certain testactivities such as ground vibration surveys. The flight test CERs use air-craft hours as an independent variable. The number of test flight hours foreach element or subphase of the flight test program is estimated usinghistorical development experience.
NON-RECURRING TOOLING AND FACTORY TEST
EQUIPMENT
Tooling labor includes efforts to design and fabricate tooling hardware, develop-ment of numerical control programs, and creation of operation sheets and manu-facturing methods.
The aircraft manufacturer’s tooling consists of three principal kinds:
u Tooling associated with fabrication of primary and secondary airframestructures, such as wings, bodies, and empennage, etc.
u A family of tools needed to fabricate system provisions, such as tubing,electrical cables, and structural interfaces.
u A family of tools needed to integrate, assemble, and checkout the com-plete aircraft system. Included in this population are checkout and han-dling items designated as factory test equipment. These often resembleground support equipment in form and complexity.

B-4
General purpose equipment such as Gerber cutting centers, milling machines,lathes, autoclaves, and DIT-MCO type systems are classified as capital equip-ment, and are not included here. TCM estimates a project’s non-recurring toolingand factory test equipment by utilizing a series of weight dependent CERs.
BASIC FACTORY LABOR
Basic factory labor (also called touch labor) includes manufacturing efforts andprocesses required to fabricate, assemble, and install aircraft system elements.Also included are efforts to integrate and checkout supplier-furnished equipment.TCM uses a series of weight-dependent CERs to estimate factory man-hours foran idealized first unit (called T1). Factory effort to produce subsequent units isestimated by applying learning curves. Where large numbers of units are pro-duced, the learning slopes tend to flatten for later production lots. The slopes arebased on historical observations.
Learning Curve—is a measure of the improvement in productivity brought aboutby increased experience and skill levels. Historical data shows an improvement indirect workhours per pound of airplane against the cumulative number of planesproduced for eight types of fighters produced by four manufacturers in WorldWar II. When plotted in log-log form, a straight line results. This relationship canbe depicted by the following equation.
EN = KNS[Eq. B-1]
Where:
EN is the effort per unit of production required to produce the Nth unit.
K is a constant, derived from the data at hand, that represents the amountof theoretical effort required to produce the first unit (TFU).
s is the slope constant, which will always be negative because increasingexperience and efficiency leads to reduced effort on a given task.
Every time cumulative production is doubled, the effort per unit required is a con-
stant 2s of what it had been. It is common to express the learning curve functionof the gain for double the production. Thus, an 85 percent learning curve functionmeans it requires only 85 percent as much effort to produce the (2N)th unit as itdid to produce the Nth unit.
If the percentage learning ratio is designated as Lp, the relationship between it andthe slope is
-s =2- log Lp
log 2 [Eq. B-2]

Tailored Cost Model
B-5
For the total effort required for N units from 1 through N, the cumulative effort,Tn, is
å=N
ET1
nn [Eq. B-3]
The learning curve methodology in TCM relies on the use of the Wright curveapproximation for this summation. Total hours for a given number of units is cal-culated using the following equation:
( ) ( )[ ]B1B11n 5.05.0
1++
-++
= NB
TT [Eq. B-4]
Where:
Tn = Total manufacturing hours, N units
T1 = Manufacturing hours, unit 1
B = (Log slope)/(Log 2)
This approximation improves as N increases.
Integrated Logistic Support (ILS) and Support InvestmentNon-Recurring
Integrated Logistic Support is a collection of efforts and products, including plansand analyses, hardware of various types, software and documentation, and serv-ices. The cost model develops ILS labor costs in three categories:
u Plans and Analyses: These occur during Full-Scale Development and in-clude the following subtasks:
ä Maintainability Analysis
ä Reliability Analysis
ä Maintenance Planning
ä Repair Level Analysis
ä Identification of Ground Support Equipment items
ä Plans and Concepts for Provisioning, Publications, Training Systems,Site Activation, and Personnel Skill Requirements.

B-6
These engineering efforts are estimated as a function of the total nonrecurring en-gineering effort.
u Flight Test Support: This work element occurs during the FSD flight testactivity, and includes field service maintenance and supply support activi-ties. The labor is estimated as a function of total flight test engineeringhours.
u ILS Commodities Nonrecurring: This activity includes formal design anddevelopment of ILS hardware and software as follows:
ä Organizational, Intermediate, and Depot GSE
ä Development of Training Curriculum and Design of Training
ä Equipment for Operation and Maintenance.
ä Preparation of Technical Publications, Provisioning Data, and otherdeliverable logistics data.
The estimate for serial production of GSE items, production of training equipmentsuch as mobile trainers and simulators, and the production of initial spares is pro-vided separately within a Support Investment cost summary. Small costs are alsoincluded for the maintenance and distribution of technical data. ILS commoditycosts are estimated as a function of total aircraft production cost, based upon his-torical support investments for similar systems.
Support Labor And Program Management
The aircraft prime contractor/system integrator’s support labor includes liaisonand sustaining engineering, manufacturing support, quality assurance, and toolingmaintenance and repair. Support labor efforts are developed by applying factors tofactory, development, or tooling labor hours. Representative factors are shown inTable B-2.
Table B-2. Support Labor and Program Management Factors
Support labor element f(Factory Mhrs) f(Development Mhrs) f(Tooling Mhrs)
Engineering liaison .080 N/A N/A
ILS sustaining .020 N/A N/A
Manufacturing support .120 .010 .050
Quality assurance FSD .150 .113 .055
Quality assurance production .150 N/A N/A
Tooling maintenance and repair .120 .022 N/A

Tailored Cost Model
B-7
Program Management depends on the total number of prime contractor/systemintegrator in-plant labor hours. The cost model uses a program management factorof 4.5 percent for the RDT&E phase and 3.3 percent for the production phase.The size of the program determines the relative magnitude of program manage-ment effort required.
Material and Equipment Costs
Material costs include the raw materials, castings, forgings, and purchased partsrequired to fabricate and assemble aircraft systems and structures. Also includedis a population of tubes, wires, connectors, shelves, and assorted items required tofabricate and assemble installations or provisions for the aircraft subsystems.Equipment items include propulsion systems, flight controls, avionics, electricalcomponents, APUs, environmental systems, landing gear, instruments, furnish-ings, and numerous other purchased items.
u Supplier Non-recurring: Non-recurring costs are parametrically estimatedusing weight- or thrust-dependent CERs. The percentage of new design isused as a simple complexity adjustment for off-the-shelf or derivativecases. Supplier non-recurring costs are included in the full scale develop-ment program, and may also cover the cost of production line rate optimi-zation.
u Theoretical First Unit (TFU) Costs: First unit raw material costs are para-metrically estimated using weight dependent CERs. The CERs are derivedfrom the cost of applicable raw materials per pound and historical usagefactors (buy-to-fly ratios) associated with the manufacturing processes.
u Cost Curve Calculations: TFU costs are used for cost improvement curveanalysis. Off-the-shelf items are cost-curved based upon the total numberof units previously delivered. The cost curve methodology relies on theuse of Wright curves. Total raw material cost for a given number of unitsis calculated using the following equation:
( ) ( )[ ]BBt n
B
TFUTRM ++
-++
=11
cos 5.05.01
[Eq. B-5]
Where:
TRMcost = Total Raw Material Costs, n Units
TFU = Theoretical First Unit Material Cost
B = (Log Slope)/(Log 2)

B-8
The cost curve slopes used for these calculations are quite flat; initially 92 per-cent, quickly transitioning to 95 percent. The fundamental basis for such im-provement is gradual reduction in rework, improvement in usage experience dueto process review, and improved material price due to increasing purchase quanti-ties as the production rate accelerates.
The summary of the TCM cost elements is shown in Table B-3. The correspond-ing labor rates are shown in Table B-4 and the inflation factors are shown in Ta-ble B-5.
Table B-3. Summary of TCM Cost Elements
Table B-4. Hourly Labor Rates in 1989 dollars
Category Rate
Project Management 90
Engineering 85
Test Engineering 82
Logistics 78
Quality Assurance 54
Manufacturing Support 52
Tooling/ Manufacturing Engineering 52
Development 48
Manufacturing 48
RDT & E PRODUCTION SUPPORT INVESTMENTTEST
COST ELEMENT NR & TEST NR FSD FSD PROG RATE PROD PROG SITEENGR DEV ART TOOLS A/C ILS MGT TOOL A/C MGT PGSE TRAIN SPARES DATA ACT
MATERIAL/EQUIP.
Manufacturing Materials F X F X F F X
Purchased Equipment X X F XLABOR
Engineering X F F F
Test Engineering X X
Development X SUPPORT INVESTMENT COSTS ARE
ILS Engineering X F ESTIMATED AS FUNCTIONS OF
Manufacturing X X X PRODUCTION FLAWAY COSTS
Manufacturing Support F F F F F F
Quality Assurance F F F F F F
Tooling F F X F X F
Program Management X XOTHER DIRECT COSTS F F F F F F F F F F
X - Paranetrically generated estimateF - Factor generated estimate

Tailored Cost Model
B-9
Table B-5. USAF Raw Inflation Index— Base Year1989
Fiscal year Inflation factor
1985 0.811
1986 0.860
1987 0.907
1988 0.952
1989 1.000
1990 1.040
1991 1.085
1992 1.115
1993 1.145
1994 1.174
1995 1.207
1996 1.240
CASH FLOW FINANCIAL ANALYSIS
Cash Flow—Measures the flow of funds into or out of a project. Funds flowingin constitute positive cash flow; funds flowing out are negative cash flow. Froman accounting point of view, cash flow is defined as:
Cash flow = net annual cash income + depreciation
One might consider cash income as “real dollars” and depreciation as a book-keeping adjustment to allow for capital expenditures. A simple example is shownin Table B-6.
Table B-6. Simple Cash Flow Sample
1. Revenue (over 1-yr. period) $500,000
2. Operating costs 360,000
3. Gross earnings (1) - (2) 140,000
4. Annual depreciation charge 60,000
5. Taxable income (3) - (4) 80,000
6. Income tax (5) x 0.34 27,200
7. Net profit after taxes (5) - (6) 52,800
8. Net cash flow (after taxes)
(7) + (4) = 52,800 + 60,000 $112,800
Discounted Cash Flow—An investment analysis that compares the present worth(value) of projected receipts and disbursements occurring at designated times in

B-10
the future to estimate the return from the investment or project. Also called Dis-counted Cash Flow rate of return; Interest rate of return; Internal rate of return;Investor’s method; or Profitability index. This method finds the rate of return thatmakes the present value of all receipts equal to the present value of all expenses.
When profitability is measured by the DCF rate of return, the inclusion of the in-flation rate results in an effective rate of return based on constant-value money.To a first approximation, the DCF rate of return is reduced by an amount equiva-lent to the average inflation rate.
Rate of Return—Rate of return is widely accepted index of profitability. It is de-fined as the interest rate that causes the equivalent receipts of a money flow to beequal to the equivalent disbursements of that money flow.
In TCM a financial analysis for the project is performed, using the parametric costestimate values as the basis for expenditures and a “floated” market price to de-termine revenues and derive a viable price for the desired aircraft manufacturer’sinternal rate of return. A graphical example is shown in Figure B-1. Figure B-2shows the cash flow over time.
Figure B–1. Graphical Internal Rate of Return Example
0
5,000
10,000
15,000
20,000
25,000
30,000
35,000
40,000
45,000
0% 5% 10% 15% 20% 25% 30%
Interest Rate
Present
Equivalent
Value
ReceiptsDisbursements
IRR= 25.7%

Tailored Cost Model
B-11
Figure B–2. Sample Cash Flow of an Aircraft Manufacturer
Present Value Method — In this method the object is to determine the futurecash flows and discount these at an appropriate rate of return to obtain the net pre-sent value.
NPV =(Ri -Ci) - tc(Ri -Ci -Di)
i(1+k)i=1
n
å +SV- tg(SV- BV)
n(1+ k)- A-W+ I [Eq. B-6]
Where:
NPV = net present value expected from purchase of the aircraft
A = purchase price of aircraft
W = additional working capital needed (spare parts, inventory)
I = Investment tax credit (if airline shows profits)
SV = salvage value of aircraft at the end of period n
BV = book value of aircraft at end of period n
tg = tax rate applicable to the capital gains realized by the carrier
Ri = revenue realized from use of aircraft in period i
Ci = costs (operating, insurance, administrative, etc.) allocated to theaircraft in period i
-3,000
-2,000
-1,000
0
1,000
2,000
3,000
4,000
0 2 4 6 8 10 12 14 16
Year
0
400
800
1200
Uni
ts P
rodu
ced
Cashflow Production
BreakevenUnits394
Total Units800

B-12
Di = amount of aircraft depreciated in period i
tc = tax rate applicable to the carrier
n = length of period considered
k = appropriate discount rate (the after-tax cost of capital, a weightedaverage of cost of debit and cost of equity).
If the net present value determined from the equation is greater than zero, then thedecision to purchase the aircraft is valid. By this technique, the expected cash flows(both + and -) through the life of the project are discounted to time zero at an inter-est rate representing the minimum acceptable return on capital. There will be somevalue of interest (k) for which the sum of the discounted cash flows equals zero;NPV=0. This value of k is called the discounted cash flow rate or return.

C-1
Appendix C Economic Theory for the Civil Aircraft Marketplace
The number of sellers in the market is one of the factors that determine the marketstructure. Sellers (operating in the product or output market) can range from manyto one, while buyers (operating in the resource or input market) also have thesame range. The other two market structure determinants are product differentia-tion, or the degree to which the items sold vary by the seller and the barrier to en-try, or the degree to which additional firms can enter the industry.
There are only four fundamental market structures as the three structural determi-nants are not independent: Pure competition, pure monopoly, monopolistic com-petition, and oligopoly. We will focus on the oligopoly market structure. It ischaracterized by few firms, with varying amount of product differentiation andvarying degrees of difficulty of entry. By this definition, almost every industry isan oligopoly. Therefore we will refine the definitions to limit the analysis to in-dustries similar to the airframe manufacturing industry. Therefore, the number offirms will range from 4 to 2; each firm will offer a differentiated product and thebarrier to entry will be high.
The competitive practices in an oligopoly, including strategy, operations, andpricing, can be complex. One common practice is known as price leadership. Un-der this scenario, one or more of the firms announces a price, then the rest of thefirms accept it. This can occur when one firm is more powerful than the otherfirms in the industry. This is also known as “dominant firm leadership with acompetitive fringe.”
A firm (or firms) can become dominant for any or all of three major reasons:lower costs, superior products, or collusion.
Dominant firms can exist because they have lower costs. This lower cost can arisefrom a variety of sources including better management, better technology, betterpatents, more experience, more efficient operations, achievement of economy ofscale effects, or operating higher on the learning curve.
Dominant firms can exist because they have superior products. This superioritycan be real or it can be imagined. One firm can produce items of better quality,durability, longer lasting, easier operation, or any other relevant physical charac-teristic. Firms can also produce items that are perceived to be better. It can do sobased on the psychology of reputation, goodwill, or advertising.

C-2
Dominant firms can exist because of collusion. This occurs when a group of firmsagree to act collectively in any number of critical areas.
History shows that dominant firms do not stay dominant forever. Market shareshrinks over time and moves the market from a dominant firm leadership oligop-oly structure to some other one. This happens for a various of reasons. Dominantfirms can get complacent, fail to offer customers the appropriate level of service,or customer demand can shift. On the other hand, the firms that make up the com-petitive fringe may bring new innovations and new products to the marketplace.The competitive fringe, in some sense, may try harder. In any case, history showsthat dominant firms do not remain that way forever.
Over time, the market structure of dominant firm changes. What is of interest iswhen that structure changes to a duopoly, which is what has happened in the largeairframe industry. There are three types of duopolies. They are Cartel, Cournotand Stackleberg. They are most easily distinguished by the prices they charge andhence, the profits they gain. The two firms in a cartel set prices and output suchthat industry revenue (and profit) is maximized. This is the equivalent of monop-oly pricing: quantity is restricted and the highest possible price is charged. TheCournot Duopoly assumes that each firm considers the others choice of output asfixed. This results in both a higher quantity output and lower price than under thecartel solution. The Stackleberg Duopoly is characterized by a leader-followerrelationship. The leader firm recognizes how the follower firm makes its quantitydecisions and uses that information to maximize its profits. This results in a lowerprice and higher output than under the Cournot case.
The price-quantity structure is a function of a set of underlying market character-istics. To a large extent, certain types of characteristics determine the generalmarket structure (monopoly, imperfect competition, and perfect competition)while others will determine the specific market structure (for example, which spe-cific type of duopoly). Of key importance here are the types and levels of barriersto entry, economies of scale, investment strategies and the degree of product dif-ferentiation.
Barriers to entry are industry practices that determine the ease or difficulty newfirms face as they enter the market, or as existing firms exit the market. Factorsthat translate into very high barriers (i.e., very few new firms are able to enter thistype of market), include capital intensive industries having large advance sunkfixed costs, declining average costs, low volumes, high prices and using advancedtechnologies are of interest here.
The capital intensity deserves special mention. Firms must make large capitaloutlays, particularly unrecoverable outlays, in advance of both production deci-sions and expected profits. This binding commitment of resources affects both thelevel and flow of profits, and is sufficient to deter most firms from entering such amarketplace.

REPORT DOCUMENTATION PAGE Form ApprovedOMB No. 0704-0188
Public reporting burden for this collection of information is estimated to average 1 hour per response, including the time for reviewing instructions, searching existing datasources, gathering and maintaining the data needed, and completing and reviewing the collection of information. Send comments regarding this burden estimate or any otheraspect of this collection of information, including suggestions for reducing this burden, to Washington Headquarters Services, Directorate for Information Operations andReports, 1215 Jefferson Davis Highway, Suite 1204, Arlington, VA 22202-4302, and to the Office of Management and Budget, Paperwork Reduction Project (0704-0188),Washington, DC 20503.
1. AGENCY USE ONLY (Leave blank) 2. REPORT DATE
January 20013. REPORT TYPE AND DATES COVERED
Contractor Report4. TITLE AND SUBTITLE
Development Cycle Time Simulation for Civil Aircraft5. FUNDING NUMBERS
C NAS2-14361
6. AUTHOR(S)
William Spitz, Richard Golaszewski, Frank Berardino, and Jesse Johnson522-99-11-01
7. PERFORMING ORGANIZATION NAME(S) AND ADDRESS(ES)
Logistics Management Institute2000 Corporate RidgeMcLean, Virginia 22102-7805
8. PERFORMING ORGANIZATIONREPORT NUMBER
LMI-NS905S1
9. SPONSORING/MONITORING AGENCY NAME(S) AND ADDR ESS(ES)
National Aeronautics and Space AdministrationLangley Research CenterHampton, VA 23681-2199
10. SPONSORING/MONITORINGAGENCY REPORT NUMBER
NASA/CR-2001-210658
11. SUPPLEMENTARY NOTES
Langley Technical Monitor: Robert YackovetskyFinal Report
12a. DISTRIBUTION/AVAILABILITY STATEMENT
Unclassified-UnlimitedSubject Category 5 Distribution: NonstandardAvailability: NASA CASI (301) 621-0390
12b. DISTRIBUTION CODE
13. ABSTRACT (Maximum 200 words)
Cycle Time Reduction (CTR) will be one of the major factors affecting the future of the civil aerospace industry.This focus is the end reflection of the level of competition in the commercial large carrier aircraft industry.Aircraft manufacturer must minimize costs and pass a portion of those savings onto buyers. CTR is one strategyused to move the manufacturing firm down the cost curve. The current NASA Airframe Development CycleTime Reduction Goal is 50% by year 2022. This goal is not achievable based on the program analysis done bythe LMI/GRA team. This may mean that the current roster of NASA CTR programs needs to be reexamined orthat the program technology progress factors, as determined by the NASA experts, were understated. Programsthat duplicate the reductions of others should be replaced with non-duplicative programs. In addition, newprograms targeting a specific part of the cycle can be developed.
14. SUBJECT TERMS
Aircraft development; Cycle time; Research and development; Aircraft cost15. NUMBER OF PAGES
92models; Tailored cost model 16. PRICE CODE
A0517. SECURITY CLASSIFICATION
OF REPORT
Unclassified
18. SECURITY CLASSIFICATIONOF THIS PAGE
Unclassified
19. SECURITY CLASSIFICATION OF ABSTRACT
Unclassified
20. LIMITATION OF ABSTRACT
UL
NSN 7540-01-280-5500 Standard Form 298 (Rev. 2-89)Prescribed by ANSI Std. Z-39-18298-102