Embed Size (px)
Citation preview
8/12/2019 Cycle Simulation
http://slidepdf.com/reader/full/cycle-simulation 1/7
8/12/2019 Cycle Simulation
http://slidepdf.com/reader/full/cycle-simulation 2/7
performance of a diesel engine fuelled by diesel and also the
different blends of diesel and biodiesel. The model predicts the
performance of a CI engine in terms of brake power and brake
thermal efficiency for all the fuels considered for the present study.
Fuel properties [11] and the engine design and operating parame-
ters are specified as inputs to the model.
2. General description of the model
It is assumed that there is spatial uniformity of pressure, temper-
ature andcomposition of thecylindercontentat eachcrank angle.Thefuels considered are diesel and 20% (B20), 40% (B40), 60% (B60) (by
volume) blending of biodieselfrom Karanjaoil [11,14] with diesel. The
molecularformula of diesel is approximated as C12H23 [15]. Karanjaoil
is mostly oleic and linoleic. The chemical formula of pure biodiesel is
considered as C17.75H33.43O1.98 and this has been derived from the
fatty acid composition of karanja oil as given in Table 1. It is also
assumed that the air fuel mixture is lean and this leads to tempera-
tures at which dissociation of products does not have much effect on
engine performance [16]. Therefore, dissociation of products of
combustion is neglected in order to keep the analysis simple [17,18].
However, combustion products should be defined by considering
dissociation in order to represent a more realistic cycle [17,19]. Poly-
nomial expressions are used for each species (O2, N2, CO2, H2O)
considered in the calculation of specific heats, internal energy andenthalpy as a function of temperature [13,19–21]. The compression
phase begins at the point of closing of the inlet valve (IVC) and
continues up-to crank angle at which combustion begins. The period
from the endof combustion tothe exhaust valve opening (EVO) isthe
expansion phase. The compression and the expansion phases are
considered as polytropic.
2.1. Energy conservation
The first law of thermodynamics applied for the closed cycle
period (from IVC to EVO) can be written as
dQ ndq
¼ dU
dq þ dW
dq (1)
Where dQ ndq
is the net heat release rate and is the difference between
dQ c
dq and dQ h
dq
dQ c
dq ¼ Heat release rate due to combustion of fuel
dQ hdq
¼ Rate of heat transfer from in cylinder gases to the wall
dU
dq ¼ Rate of change of internal energy
dW
dq ¼ Rate of work transfer
Equation (1) can be rearranged as
dQ c
dq dQ h
dq ¼ MC v
dT
dqþ p
dV
dq (2)
M , C v, p, T and V are the mass, specific heat at constant volume,
instantaneous pressure, instantaneous temperature, instantaneous
volume of the cylinder content respectively.
Instantaneous cylinder volume V is given by,
A ¼ 2:94Dv
ffiffiffiffiffiffiffiffiffiffiffiffiffiffiffiffiffiffiffiffiffiffiffiffiffiffiffiffiffiffiffiffiffiffiffiffiffiffiffiffiffiffiL2v LvDv
8 þ D2
v
128
!v uut (3)
The terms used in equation (3) are as given below.
Table 1
Fatty acid composition of karanja oil [14].
Sl. No Fat ty acid Mo lecular formula Co mpo sition(wt.%)
1 Palmitic C16H32O2 11.30
2 Stearic C18H36O2 9.80
3 Oleic C18H34O2 45.25
4 linoleic C18H32O2 24.75
5 Srachidic C20H40O2 1.75
6 linolenic C18H30O2 2.90
7 behenic C22H44O2 3.20
8 Unidentified 1.05
Nomenclature
A Area, m2
C v Specific heat at constant volume, kJ/kmol
D Cylinder bore, mD p Valve port diameter, mm
Ds Valve stem diameter, mm
Dv valve diameter, mm
Dvi Inlet valve diameter, mmk thermal conductivity, W/mK
L Length of connecting rod, mm
Lv Instantaneous valve lift, mm
M Mass, kgN Engine RPM
n no. of intake valve/cylinder
n pr no. of piston ring
p Pressure, barP sl Piston skirt length, mm
pe Exhaust back pressure, bar
pimf Inlet manifold pressure, bar
pa atmospheric pressure, bar
pimep indicated mean effective pressure, bar
dQ c
dq Heat release rate due to combustion of fuel, kJ/degree
crank angledQ hdq
Rate of heat transfer from in cylinder gases to the wall,
kJ/degree crank angledQ ndq
Net heat release rate, kJ/degree crank angleR Universal gas constant, kJ/molK
Re Reynolds’s Number
S stroke length, mm
T temperature, Kt time, secdU dq
Rate of change of internal energy, kJ/degree crank
angle
V Volume, m3
V s Stroke volume, m3
V p Mean piston speed, m/sdW dq
Rate of Work transfer, kJ/degree crank angle
Greek Letters
r density, kg/m3
m dynamic viscosity, kg/m sec
g Ratio of specific heat, dimensionless
q Crank angle, degreef fuel air equivalence ratio, dimensionless
T.K. Gogoi, D.C. Baruah / Energy 35 (2010) 1317–13231318
8/12/2019 Cycle Simulation
http://slidepdf.com/reader/full/cycle-simulation 3/7
Rc is the compression ratio, L is the length of connecting rod, S is
the stroke length,
V s is the stroke volume of the cylinder and q is the crank angle.
2.2. Ignition delay
The ignition delay is the time between start of fuel injection and
start of combustion. Many expressions for ignition delay are found
in literature as a function of mixture pressure, temperature, fuel
cetane number and fuel air equivalence ratio. The following
empirical correlation is used for calculation of ignition delay
[16,21,22].
sid ¼ 2:64
p0:8f0:2exp
16550 20CN
RT
(4)
Where R is universal gas constant, CN is fuel cetane numberand f is
fuel air equivalence ratio. However, the constants and exponents in
the above correlation are to be better calibrated against experi-
mental results.
2.3. Combustion
In the present work, the combustion process is modeled
using a single zone approach, which is based on a uniformly
distributed heat releasing phenomenon. Spray combustion is not
considered in detail. Detailed phenomenological combustion
modeling is undoubtedly useful, particularly in the design of
combustion chamber; however, single zone heat release
combustion models are appropriate for use in total diesel system
simulation where the combustion process details are not the
primary focus [13].
The Weibe function is used for calculation of heat release rate
due to combustion of fuel.
x ¼ 1 exp" a
q q0Dq
m
þ1#
(5)
Where x is the mass fraction burned, q0 is the start of combustion
and Dq is the combustion duration. a is an adjustable parameter
that characterizes the completeness of combustion. The parameter
m represents the rate of combustion. Differentiating x with respect
to qq0
Dq and multiplying withQ av
Dq, the heat release rate is calculated
as,
dQ c
dq ¼ aðm þ 1Þ
Q avDq
q q0
Dq
m
exp
" a
q q0
Dq
mþ1#
(6)
Where Q av is the heat released per cycle. The value of m for all the
fuel is taken as 2.0 and the value of a for diesel, B20, B40 and B60
were taken as 5.0 [13], 5.508, 6.008 and 6.508 respectively.
2.4. Heat transfer
The heat transfer between the trapped gas and the surrounding
wall is calculated by using Anand’s equation.
dQ h=dq
A ¼ a
k
DRebðT w T Þ þ c
T 4w T 4
(7)
Where A is the heat transfer area and T w is the temperature of the
cylinder wall. Re ¼ rV pDm is the Reynolds number with D the
cylinder bore and V p the mean piston speed. r, m and k are the gas
density, dynamic viscosity and thermal conductivity respectively.
The value of a varies with speed and engine design. With normal
combustion, 0:35 a 0:8 with b ¼ 0.7 [13]; c ¼ 0 for the
compression period and otherwise c ¼ 3.3 108 W/m2K4 is the
most usual value [5].
2.5. Gas exchange process
During intake and exhaust processes, the cylinder pressure is
not only a function of in-cylinder processes but also of mass flowrate through the valves. Applying energy equation to these
processes and treating the gas as ideal [17,20,21,23], one obtains,
For the exhaust process,
dp
dt ¼ g p
1
M
dM
dt 1
V
dV
dt
exhaust
(8)
For the intake process,
dp
dt ¼ g
RT
V
dM
dt p
V
dV
dt
intake
(9)
Both these equations require mass flow rate dM dt
, which can be
determined from the equation given below [21].
dM
dt ¼ Ap0
ffiffiffiffiffiffiffiffiffiffiffiffiffiffiffiffiffiffiffiffiffiffiffiffiffiffiffiffiffiffiffiffiffiffiffiffiffiffiffiffiffiffiffiffiffiffiffiffiffiffiffiffiffiffiffiffiffiffiffiffiffiffiffiffiffiffiffiffiffiffiffiffiffiffi 2g
RT ðg 1Þ
p
p0
gg1
p
p0
gg1
1
s (10)
Where A is the instantaneous valve flow area and it depends upon
the valve lift and the geometric features of the valve head, seat and
stem. Depending upon the instantaneous valve lift, three different
cases may arise [24],
CaseI :0 < Lv
Dv
< 0:125: The minimum flow area corresponds to
the slant surface of a frustum of a right circular cone and perpen-
dicular to the valve seat.
A ¼ 2:22Lv
7
8Dv þ Lv
2
(11)
Where Lv and Dv are the instantaneous valve lift and valve headdiameter respectively.
CaseII : 0:125 < Lv
Dv
< 0:2735: The minimum flow area is still the
slant surface but no longer perpendicular to the valve seat.
V ðqÞ ¼ V s
24 Rc
Rc 1 1 cosq
2 þ L
S 1
2
ffiffiffiffiffiffiffiffiffiffiffiffiffiffiffiffiffiffiffiffiffiffiffiffiffiffiffiffiffiffiffiffiffiffiffi"2
L
S
2
sin2q
#v uut35 (12)
CaseIII : Lv
Dv
> 0:2735: When valve lift becomes large, then the
flow area is port flow area minus the sectional area of the valve
stem.
A ¼ p
4
"
Dv
2 2
Dv
4 2#
(13)
It is assumed that the port diameterD p ¼ Dv
2 and the valve stem
diameterDs ¼ Dv
4 , with a valve seat angle of 45.
2.6. Net work
Net work done in a complete cycle is given by
W net ¼ #
p þ D p
2
DV (14)
Where D p is the change in pressure inside the cylinder due to
piston motion, combustion, heat transfer and flow into and out of
the cylinder. The following equation gives the pressure drop due to
heat transfer [21].
T.K. Gogoi, D.C. Baruah / Energy 35 (2010) 1317–1323 1319
8/12/2019 Cycle Simulation
http://slidepdf.com/reader/full/cycle-simulation 4/7
D p
p ¼
dQ hdt
MC vT Dt (15)
2.7. Frictional power
Frictional losses affect the maximum brake torque and the
minimum brake specific fuel consumption directly and are often
a criterion of good engine design. These losses not only reduce the
power but also influence the size of the coolant systems [16]. The
mean effective losses of power due to friction in different moving
parts are calculated by using the following empirical relations
[21].
(i) Mean effective pressure(FMEP)lost due to friction in the piston
and piston rings
FMEP 1 ¼ 12:85P sl
DL 100 V p
1000 (16)
Where P sl is the piston skirt length (mm)
D is the cylinder bore (m), L is the stroke length (m), V p is mean
piston speed (m/s)
(i) MEP lost in bearing friction
FMEP 2 ¼ 0:0564D
L N
1000 (17)
N is the engine RPM.
(iii) MEP lost in friction in the valve gear
FMEP 3 ¼ 0:226
30 4N
1000
nD1:75
vi
D2L (18)
Where n is the number of intake valve/cylinder, Dvi is the inlet valve
diameter.
(iv) MEP lost in overcoming inlet and throttling losses
FMEP 4 ¼ pe
2:75þ pimf (19)
Where pe is the exhaust gas back pressure (bar) and pimf is the inlet
manifold pressure (bar).
(v) MEP lost in pumping
FMEP 5 ¼ 0:0275
N
1000
1:5
(20)
(vi) MEP lost in friction due to gas pressure behind rings
FMEP 6 ¼ 0:42
pa pimf
L
D2
0:0888Rc þ 0:182R1:330:394V p=100c
10 ð21Þ
Where pa is the atmospheric pressure (bar).
(vii) MEP lost in friction due to wall tension in rings
FMEP 7 ¼ 10 0:377Ln pr
D2 (22)
Where n pr is the number of piston rings.
(viii) Blow by losses
FMEP 8 ¼ ffiffiffiffiffiffiffiffiffiffiffiffiffiffiffiffiffiffiffiffi pa pimf
p "
0:121R0:4c ð0:0345 þ 0:001055Rc Þ
N
100
1:185#
(23)
(ix) MEP lost in overcoming combustion chamber and wall
pumping losses
FMEP 9 ¼ ffiffiffiffiffiffiffiffiffiffiffiffiffi
pimep
11:45
r 0:0915
N
1000
1:7
(24)
Where pimep is the indicated mean effective pressure.
Indicated power can be calculated from the net work done
during the cycle and hence the indicated mean effective pressure.
The brake mean effective pressure is the difference between the
indicated mean effective pressure and the frictional mean effective
pressure. Thus, it calculates brake power from known values of
brake mean effective pressure, stroke volume and speed.
3. Results and discussion
The developed model was used to investigate the effect of
variation of speed and compression ratio (CR) on engine perfor-
mance (Brake Power and brake thermal efficiency) fuelled by diesel
and blends of diesel and biodiesel. Table 2 shows the engine
configuration and the engine operating conditions. The properties
of the fuels, viz. diesel and the various blendsof diesel and biodiesel
(B20, B40 and B60) are shown in Table 3. The speed was varied from
800 to 1800 rpm and the CR from 12 to 18.5.
3.1. Effect of speed on brake power
Figs. 1–3 show the variations of brake power with speed for CR 14, 15.5 and 17.5. The results show that bake power increases with
the increase in speed for all the fuel, the peak power occurs at
a particular speed and further increase in speed results in decrease
of brake power. Peak power at a particular speed is a characteristic
of diesel engine. At speeds above the one at which peak power
occurs, the frictional losses increase very rapidly and hence the
brake power decreases. From the figures, increased brake power is
evident in case of the blends B40 and B60. The brake power output
in case of the blend B20 is slightly lower than diesel at all speeds
and CR. Rehman et al. [12] also on a variable speed TD43F engine,
obtained higher performance with karanja methyl ester and its
blends B40 and B60 and lower brake power in case of B20.
According to their report, the increased power in case of the blends
Table 2
Engine design and operating parameters.
Parameters Value
Bore, mm 87.5
Stroke, mm 110
Connecting rod length, mm 230
Inlet valve diameter, mm 24
Exhaust valve diameter, mm 34
Inlet valve open 13 deg. bTDC
Inlet valve close 30 deg aBDC
Exhaust valve open 20 deg bBDC
Exhaust valve close 14 deg. aTDC
Relative air fuel ratio 1.5
Inlet manifold pressure, atm 1.0
Exhaust manifold pressure, atm 1.0
T.K. Gogoi, D.C. Baruah / Energy 35 (2010) 1317–13231320
8/12/2019 Cycle Simulation
http://slidepdf.com/reader/full/cycle-simulation 5/7
B40 and B60 was due to complete combustion of oxygenated fuel,
and the lower power output in case of B20 was due to increased
viscosity and presence of relatively less oxygen. However, they
varied the speed from 1200 rpm to 2400 rpm and the power values
were found at a CR of 18. Moreover, the engine design parameters
were also different from the ones that are considered in the present
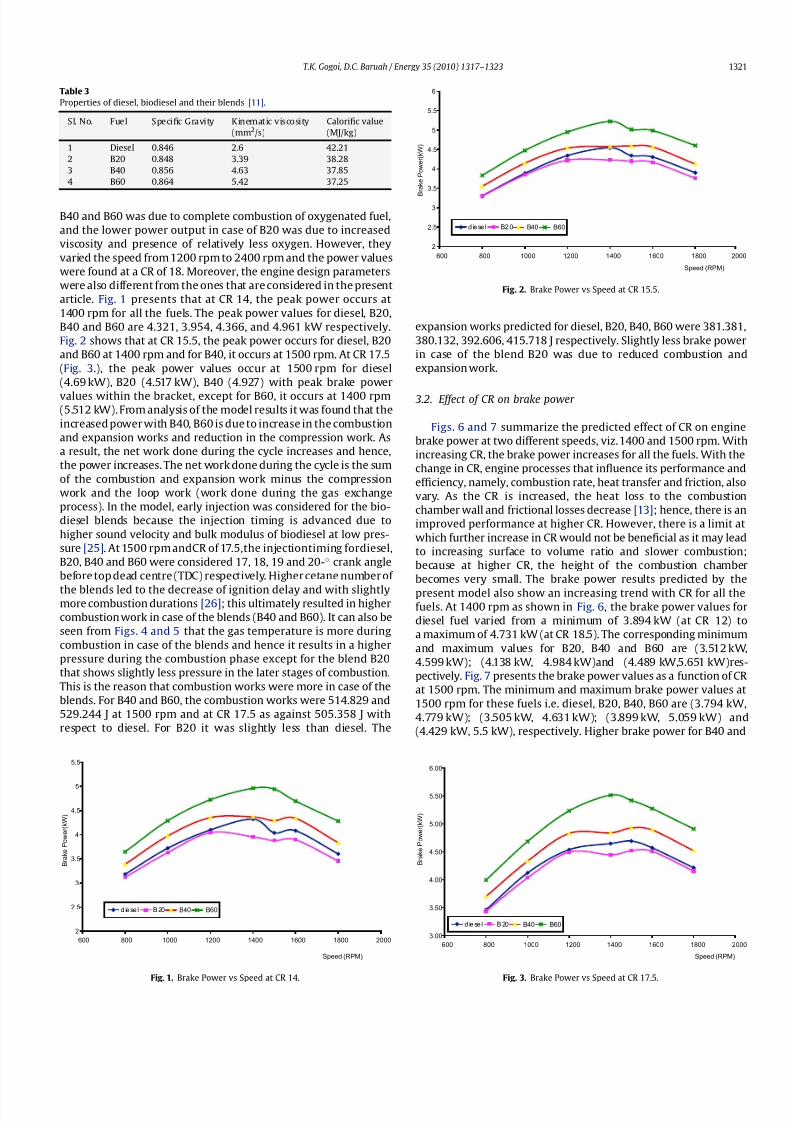
article. Fig. 1 presents that at CR 14, the peak power occurs at
1400 rpm for all the fuels. The peak power values for diesel, B20,
B40 and B60 are 4.321, 3.954, 4.366, and 4.961 kW respectively.
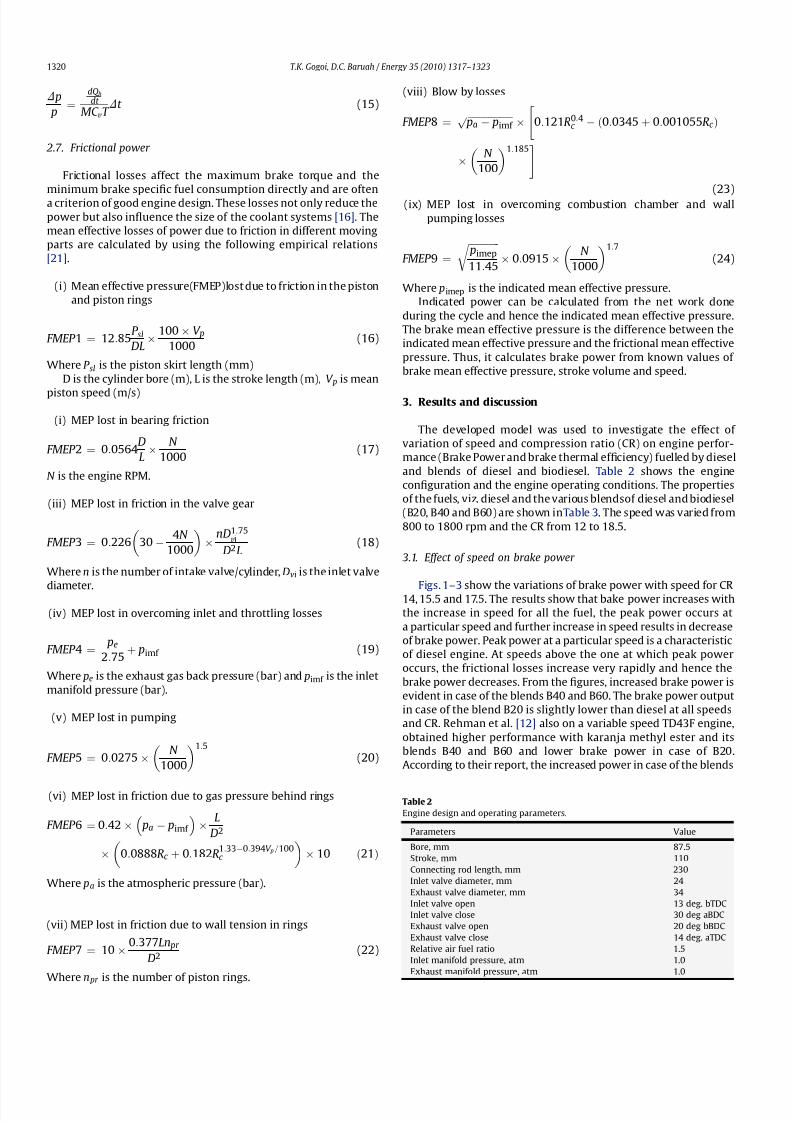
Fig. 2 shows that at CR 15.5, the peak power occurs for diesel, B20
and B60 at 1400 rpm and for B40, it occurs at 1500 rpm. At CR 17.5
(Fig. 3.), the peak power values occur at 1500 rpm for diesel
(4.69 kW), B20 (4.517 kW), B40 (4.927) with peak brake power
values within the bracket, except for B60, it occurs at 1400 rpm(5.512 kW). From analysis of the model results it was found that the
increased power with B40, B60 is due to increase in the combustion
and expansion works and reduction in the compression work. As
a result, the net work done during the cycle increases and hence,
the power increases. The net work done during the cycle is the sum
of the combustion and expansion work minus the compression
work and the loop work (work done during the gas exchange
process). In the model, early injection was considered for the bio-
diesel blends because the injection timing is advanced due to
higher sound velocity and bulk modulus of biodiesel at low pres-
sure [25]. At 1500 rpm andCR of 17.5,the injectiontiming fordiesel,
B20, B40 and B60 were considered 17, 18, 19 and 20- crank angle
before top dead centre (TDC) respectively. Higher cetane number of
the blends led to the decrease of ignition delay and with slightlymore combustion durations [26]; this ultimately resulted in higher
combustion work in case of the blends (B40 and B60). It can also be
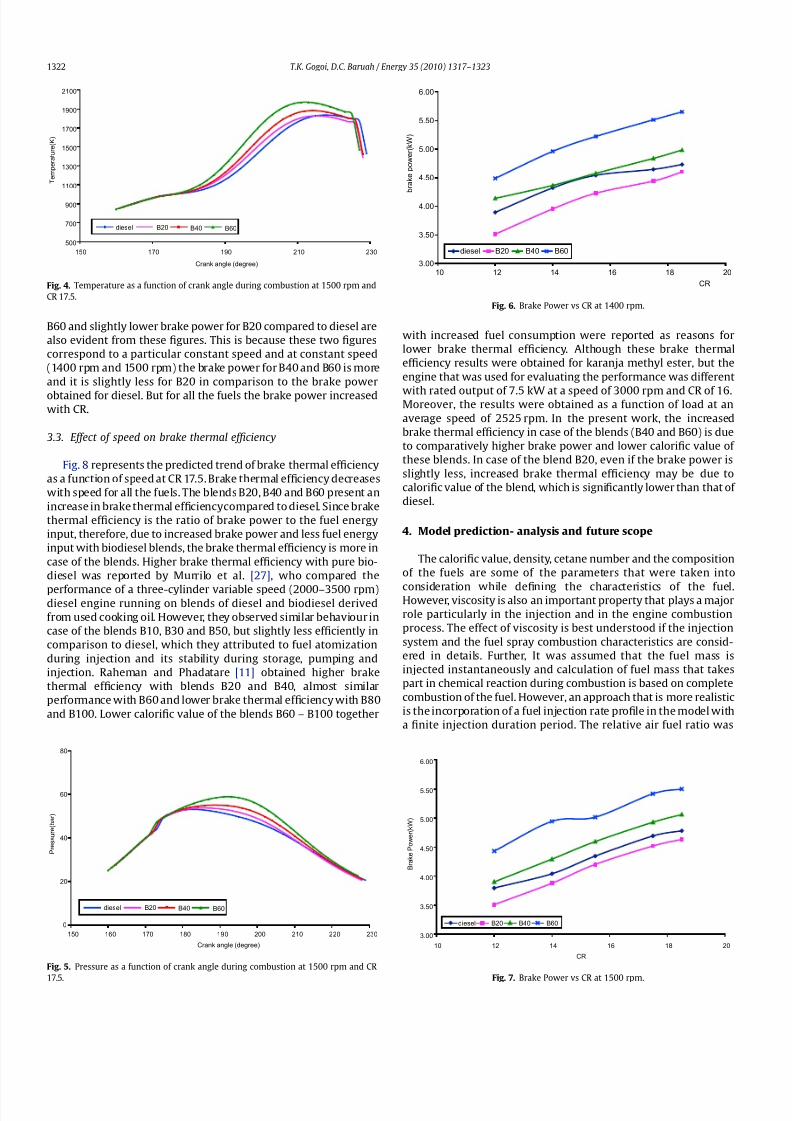
seen from Figs. 4 and 5 that the gas temperature is more during
combustion in case of the blends and hence it results in a higher
pressure during the combustion phase except for the blend B20
that shows slightly less pressure in the later stages of combustion.
This is the reason that combustion works were more in case of the
blends. For B40 and B60, the combustion works were 514.829 and
529.244 J at 1500 rpm and at CR 17.5 as against 505.358 J with
respect to diesel. For B20 it was slightly less than diesel. The
expansion works predicted for diesel, B20, B40, B60 were 381.381,
380.132, 392.606, 415.718 J respectively. Slightly less brake power
in case of the blend B20 was due to reduced combustion and
expansion work.
3.2. Effect of CR on brake power
Figs. 6 and 7 summarize the predicted effect of CR on engine
brake power at two different speeds, viz. 1400 and 1500 rpm. With
increasing CR, the brake power increases for all the fuels. With the
change in CR, engine processes that influence its performance and
efficiency, namely, combustion rate, heat transfer and friction, also
vary. As the CR is increased, the heat loss to the combustion
chamber wall and frictional losses decrease [13]; hence, there is an
improved performance at higher CR. However, there is a limit at
which further increase in CR would not be beneficial as it may lead
to increasing surface to volume ratio and slower combustion;
because at higher CR, the height of the combustion chamber
becomes very small. The brake power results predicted by the
present model also show an increasing trend with CR for all thefuels. At 1400 rpm as shown in Fig. 6, the brake power values for
diesel fuel varied from a minimum of 3.894 kW (at CR 12) to
a maximum of 4.731 kW (at CR 18.5). The corresponding minimum
and maximum values for B20, B40 and B60 are (3.512 kW,
4.599 kW); (4.138 kW, 4.984 kW)and (4.489 kW,5.651 kW)res-
pectively. Fig. 7 presents the brake power values as a function of CR
at 1500 rpm. The minimum and maximum brake power values at
1500 rpm for these fuels i.e. diesel, B20, B40, B60 are (3.794 kW,
4.779 kW); (3.505 kW, 4.631 kW); (3.899 kW, 5.059 kW) and
(4.429 kW, 5.5 kW), respectively. Higher brake power for B40 and
Table 3
Properties of diesel, biodiesel and their blends [11].
Sl. No. Fuel Specific Gravity Kinematic viscosity
(mm2/s)
Calorific value
(MJ/kg)
1 Diesel 0.846 2.6 42.21
2 B20 0.848 3.39 38.28
3 B40 0.856 4.63 37.85
4 B60 0.864 5.42 37.25
2
2.5
3
3.5
4
4.5
5
5.5
600 800 1000 1200 1400 1600 1800 2000
Speed (RPM)
B r a k e P o w e r ( k W )
d iese l B 20 B40 B60
Fig. 1. Brake Power vs Speed at CR 14.
2
2.5
3
3.5
4
4.5
5
5.5
6
600 800 1000 1200 1400 1600 1800 2000
Speed (RPM)
B r a k e P o w e r ( k W )
d iese l B20 B40 B60
Fig. 2. Brake Power vs Speed at CR 15.5.
3.00
3.50
4.00
4.50
5.00
5.50
6.00
600 800 1000 1200 1400 1600 1800 2000
Speed (RPM)
B r a k e P o w e r ( k W )
d iese l B 20 B40 B60
Fig. 3. Brake Power vs Speed at CR 17.5.
T.K. Gogoi, D.C. Baruah / Energy 35 (2010) 1317–1323 1321
8/12/2019 Cycle Simulation
http://slidepdf.com/reader/full/cycle-simulation 6/7
B60 and slightly lower brake power for B20 compared to diesel are
also evident from these figures. This is because these two figures
correspond to a particular constant speed and at constant speed
(1400 rpm and 1500 rpm) the brake power for B40 and B60 is more
and it is slightly less for B20 in comparison to the brake power
obtained for diesel. But for all the fuels the brake power increasedwith CR.
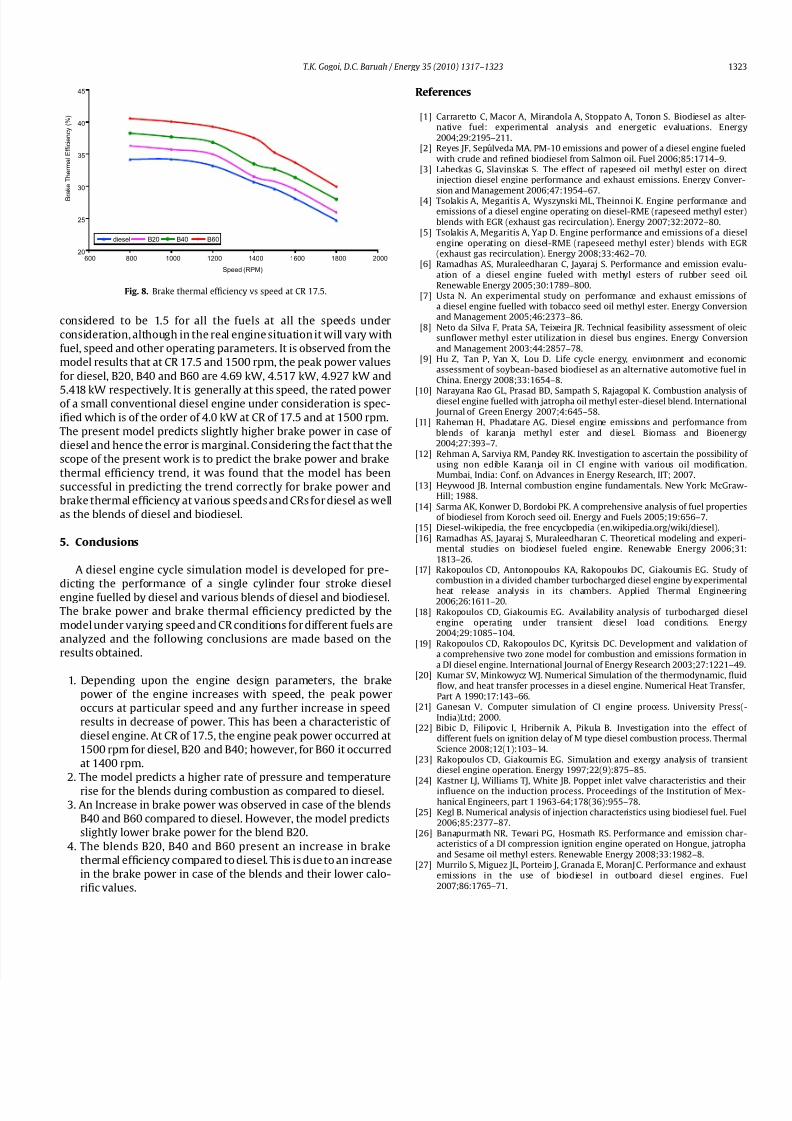
3.3. Effect of speed on brake thermal efficiency
Fig. 8 represents the predicted trend of brake thermal efficiency
as a function of speed at CR 17.5. Brake thermal efficiency decreases
with speed for all the fuels. The blends B20, B40 and B60 present an
increase in brake thermal efficiencycompared to diesel. Since brake
thermal efficiency is the ratio of brake power to the fuel energy
input, therefore, due to increased brake power and less fuel energy
input with biodiesel blends, the brake thermal efficiency is more in
case of the blends. Higher brake thermal efficiency with pure bio-
diesel was reported by Murrilo et al. [27], who compared the
performance of a three-cylinder variable speed (2000–3500 rpm)diesel engine running on blends of diesel and biodiesel derived
from used cooking oil. However, they observed similar behaviour in
case of the blends B10, B30 and B50, but slightly less efficiently in
comparison to diesel, which they attributed to fuel atomization
during injection and its stability during storage, pumping and
injection. Raheman and Phadatare [11] obtained higher brake
thermal efficiency with blends B20 and B40, almost similar
performance with B60 and lower brake thermal efficiency with B80
and B100. Lower calorific value of the blends B60 – B100 together
with increased fuel consumption were reported as reasons for
lower brake thermal efficiency. Although these brake thermal
efficiency results were obtained for karanja methyl ester, but the
engine that was used for evaluating the performance was different
with rated output of 7.5 kW at a speed of 3000 rpm and CR of 16.Moreover, the results were obtained as a function of load at an
average speed of 2525 rpm. In the present work, the increased
brake thermal efficiency in case of the blends (B40 and B60) is due
to comparatively higher brake power and lower calorific value of
these blends. In case of the blend B20, even if the brake power is
slightly less, increased brake thermal efficiency may be due to
calorific value of the blend, which is significantly lower than that of
diesel.
4. Model prediction- analysis and future scope
The calorific value, density, cetane number and the composition
of the fuels are some of the parameters that were taken into
consideration while defining the characteristics of the fuel.However, viscosity is also an important property that plays a major
role particularly in the injection and in the engine combustion
process. The effect of viscosity is best understood if the injection
system and the fuel spray combustion characteristics are consid-
ered in details. Further, It was assumed that the fuel mass is
injected instantaneously and calculation of fuel mass that takes
part in chemical reaction during combustion is based on complete
combustion of the fuel. However, an approach that is more realistic
is the incorporation of a fuel injection rate profile in the model with
a finite injection duration period. The relative air fuel ratio was
500
700
900
1100
1300
1500
1700
1900
2100
150 170 190 210 230
Crank angle (degree)
T e m p e r a t u r e ( K )
diesel B20 B40 B60
Fig. 4. Temperature as a function of crank angle during combustion at 1500 rpm and
CR 17.5.
0
20
40
60
80
150 160 170 180 190 200 210 220 230
Crank angle (degree)
P r e s s u r e ( b a r )
diesel B20 B40 B60
Fig. 5. Pressure as a function of crank angle during combustion at 1500 rpm and CR
17.5.
3.00
3.50
4.00
4.50
5.00
5.50
6.00
10 12 14 16 18 20
CR
b r a k e p o w e r ( k W )
diesel B20 B40 B60
Fig. 6. Brake Power vs CR at 1400 rpm.
3.00
3.50
4.00
4.50
5.00
5.50
6.00
10 12 14 16 18 20
CR
B r a k e P o w e r ( k W )
diesel B20 B40 B60
Fig. 7. Brake Power vs CR at 1500 rpm.
T.K. Gogoi, D.C. Baruah / Energy 35 (2010) 1317–13231322
8/12/2019 Cycle Simulation
http://slidepdf.com/reader/full/cycle-simulation 7/7
considered to be 1.5 for all the fuels at all the speeds under
consideration, although in the real engine situation it will vary with
fuel, speed and other operating parameters. It is observed from the
model results that at CR 17.5 and 1500 rpm, the peak power values
for diesel, B20, B40 and B60 are 4.69 kW, 4.517 kW, 4.927 kW and
5.418 kW respectively. It is generally at this speed, the rated powerof a small conventional diesel engine under consideration is spec-
ified which is of the order of 4.0 kW at CR of 17.5 and at 1500 rpm.
The present model predicts slightly higher brake power in case of
diesel and hence the error is marginal. Considering the fact that the
scope of the present work is to predict the brake power and brake
thermal efficiency trend, it was found that the model has been
successful in predicting the trend correctly for brake power and
brake thermal efficiency at various speeds and CRs for diesel as well
as the blends of diesel and biodiesel.
5. Conclusions
A diesel engine cycle simulation model is developed for pre-
dicting the performance of a single cylinder four stroke dieselengine fuelled by diesel and various blends of diesel and biodiesel.
The brake power and brake thermal efficiency predicted by the
model under varying speed and CR conditions for different fuels are
analyzed and the following conclusions are made based on the
results obtained.
1. Depending upon the engine design parameters, the brake
power of the engine increases with speed, the peak power
occurs at particular speed and any further increase in speed
results in decrease of power. This has been a characteristic of
diesel engine. At CR of 17.5, the engine peak power occurred at
1500 rpm for diesel, B20 and B40; however, for B60 it occurred
at 1400 rpm.
2. The model predicts a higher rate of pressure and temperature
rise for the blends during combustion as compared to diesel.
3. An Increase in brake power was observed in case of the blends
B40 and B60 compared to diesel. However, the model predicts
slightly lower brake power for the blend B20.
4. The blends B20, B40 and B60 present an increase in brake
thermal efficiency compared to diesel. This is due to an increase
in the brake power in case of the blends and their lower calo-
rific values.
References
[1] Carraretto C, Macor A, Mirandola A, Stoppato A, Tonon S. Biodiesel as alter-native fuel: experimental analysis and energetic evaluations. Energy2004;29:2195–211.
[2] Reyes JF, Sepulveda MA. PM-10 emissions and power of a diesel engine fueledwith crude and refined biodiesel from Salmon oil. Fuel 2006;85:1714–9.
[3] Labeckas G, Slavinskas S. The effect of rapeseed oil methyl ester on directinjection diesel engine performance and exhaust emissions. Energy Conver-sion and Management 2006;47:1954–67.
[4] Tsolakis A, Megaritis A, Wyszynski ML, Theinnoi K. Engine performance andemissions of a diesel engine operating on diesel-RME (rapeseed methyl ester)blends with EGR (exhaust gas recirculation). Energy 2007;32:2072–80.
[5] Tsolakis A, Megaritis A, Yap D. Engine performance and emissions of a dieselengine operating on diesel-RME (rapeseed methyl ester) blends with EGR (exhaust gas recirculation). Energy 2008;33:462–70.
[6] Ramadhas AS, Muraleedharan C, Jayaraj S. Performance and emission evalu-ation of a diesel engine fueled with methyl esters of rubber seed oil.Renewable Energy 2005;30:1789–800.
[7] Usta N. An experimental study on performance and exhaust emissions of a diesel engine fuelled with tobacco seed oil methyl ester. Energy Conversionand Management 2005;46:2373–86.
[8] Neto da Silva F, Prata SA, Teixeira JR. Technical feasibility assessment of oleicsunflower methyl ester utilization in diesel bus engines. Energy Conversionand Management 2003;44:2857–78.
[9] Hu Z, Tan P, Yan X, Lou D. Life cycle energy, environment and economicassessment of soybean-based biodiesel as an alternative automotive fuel inChina. Energy 2008;33:1654–8.
[10] Narayana Rao GL, Prasad BD, Sampath S, Rajagopal K. Combustion analysis of diesel engine fuelled with jatropha oil methyl ester-diesel blend. International
Journal of Green Energy 2007;4:645–58.[11] Raheman H, Phadatare AG. Diesel engine emissions and performance from
blends of karanja methyl ester and diesel. Biomass and Bioenergy2004;27:393–7.
[12] Rehman A, Sarviya RM, Pandey RK. Investigation to ascertain the possibility of using non edible Karanja oil in CI engine with various oil modification.Mumbai, India: Conf. on Advances in Energy Research, IIT; 2007.
[13] Heywood JB. Internal combustion engine fundamentals. New York: McGraw-Hill; 1988.
[14] Sarma AK, Konwer D, Bordoloi PK. A comprehensive analysis of fuel propertiesof biodiesel from Koroch seed oil. Energy and Fuels 2005;19:656–7.
[15] Diesel-wikipedia, the free encyclopedia (en.wikipedia.org/wiki/diesel).[16] Ramadhas AS, Jayaraj S, Muraleedharan C. Theoretical modeling and experi-
mental studies on biodiesel fueled engine. Renewable Energy 2006;31:1813–26.
[17] Rakopoulos CD, Antonopoulos KA, Rakopoulos DC, Giakoumis EG. Study of combustion in a divided chamber turbocharged diesel engine by experimental
heat release analysis in its chambers. Applied Thermal Engineering2006;26:1611–20.
[18] Rakopoulos CD, Giakoumis EG. Availability analysis of turbocharged dieselengine operating under transient diesel load conditions. Energy2004;29:1085–104.
[19] Rakopoulos CD, Rakopoulos DC, Kyritsis DC. Development and validation of a comprehensive two zone model for combustion and emissions formation ina DI diesel engine. International Journal of Energy Research 2003;27:1221–49.
[20] Kumar SV, Minkowycz WJ. Numerical Simulation of the thermodynamic, fluidflow, and heat transfer processes in a diesel engine. Numerical Heat Transfer,Part A 1990;17:143–66.
[21] Ganesan V. Computer simulation of CI engine process. University Press(-India)Ltd; 2000.
[22] Bibic D, Filipovic I, Hribernik A, Pikula B. Investigation into the effect of different fuels on ignition delay of M type diesel combustion process. ThermalScience 2008;12(1):103–14.
[23] Rakopoulos CD, Giakoumis EG. Simulation and exergy analysis of transientdiesel engine operation. Energy 1997;22(9):875–85.
[24] Kastner LJ, Williams TJ, White JB. Poppet inlet valve characteristics and theirinfluence on the induction process. Proceedings of the Institution of Mex-hanical Engineers, part 1 1963-64;178(36):955–78.
[25] Kegl B. Numerical analysis of injection characteristics using biodiesel fuel. Fuel2006;85:2377–87.
[26] Banapurmath NR, Tewari PG, Hosmath RS. Performance and emission char-acteristics of a DI compression ignition engine operated on Hongue, jatrophaand Sesame oil methyl esters. Renewable Energy 2008;33:1982–8.
[27] Murrilo S, Miguez JL, Porteiro J, Granada E, MoranJ C. Performance and exhaustemissions in the use of biodiesel in outboard diesel engines. Fuel2007;86:1765–71.
20
25
30
35
40
45
600 800 1000 1200 1400 1600 1800 2000
Speed (RPM)
B r
a k e T h e r m a l E f f i c i e n c y ( % )
diesel B20 B40 B60
Fig. 8. Brake thermal efficiency vs speed at CR 17.5.
T.K. Gogoi, D.C. Baruah / Energy 35 (2010) 1317–1323 1323