Embed Size (px)
Citation preview

1
DETERMINATION OF THE LEADING STRATEGY FOR SUCCESSFUL DELIVERY
OF INFRASTRUCTURE DEVELOPMENT PROJECTS UNDER PUBLIC - PRIVATE
PARTNERSHIP FOR SUSTAINABLE TRANSFORMATION OF TANZANIA INTO AN
INDUSTRIALISED ECONOMY: THE CASE OF KIGAMBONI BRIDGE PROJECT IN
DAR ES SALAAM TANZANIA
Paper presented at the 29th National Conference 2017 on “The Role of Engineers in Transforming
Tanzania into an Industrialised Economy: Challenges and Opportunities”, 7th to 9th December
2017 at Arusha Tanzania.
*Eng. Joseph M. Nyamhanga and Eng. Dr. Frank E. Ngoiya**
*Permanent Secretary, Ministry of Works, Transport and Communication,
**Principal Engineer, Ministry of Works, Transport and Communication.
Abstract
Public-Private Partnership (PPP) concept is an important model for provision of infrastructure
in an efficient and timely cost-effective manner and is a vehicle which could facilitate
Government’s new drive for industrialization, alleviate Public Sector financial constraints and
enable sustainable economic growth through infrastructure development. Apparently the
application PPP concept in many African Countries including Tanzania remains limited, which
needs to be improved. This paper presents findings of a research conducted to investigate
Government’s Leading Strategy in delivering infrastructure projects under PPP approach
through a case study of Kigamboni Bridge project. Questionnaire survey research examined the
relative importance of subjectively obtained 27 SWOT factors from literature review which
influence delivery of PPP projects. The survey data were analysed, prioritised and ranked using
Principal Component Analysis (PCA) tool in SPSS version 21. Twelve (12) SWOT factors or three
(3) factors per SWOT letter produced from the prioritization exercise were then ranked according
to their intensity of influence commensurate with their relative weights and used as input into the
SWOT Clock Strategic Model (Tirosh, 2010). The output of the model was the creation of four
possible strategies of Growth, Response, Survival and Leverage. The Leading Strategy was
determined to be the Leverage Strategy which is characterized by higher Weaknesses than
Strengths and greater Opportunities than Threats. Subsequently the influencing factors
corresponding to the higher Weaknesses as ranked in three (3) levels were identified as the
available financial market, thorough and realistic cost-benefit analysis, and appropriate risk
allocation and risk sharing. The paper recommends to the Government to improve the Availability
of Financial Market while Engineers and staff of other related disciplines should enhance their
capacity to deliver PPP projects in order to stimulate delivery of infrastructure development
projects under PPP approach, thereby impacting positively on the Government’s new impetus for
industrialisation and economic growth in Tanzania.
1.0 INTRODUCTION
In an endeavour to bridge the growing gap between the cost of infrastructure needed and the
resources available in the country, Tanzania developed Public-Private Partnership (PPP) policy in
2009 followed by PPP Act of 2010 and its amendments in 2014; as well as PPP Regulations of
2015. The purpose of legal and regulatory framework is to facilitate Private Sector investment in
infrastructure projects and services. These efforts have been undertaken in consideration that PPP
concept is an important model for provision of infrastructure in an efficient and timely cost-
effective way, eventually alleviating financial burden on the Public Sector against the rising
infrastructure development costs. Furthermore such undertaking underscores the fact that a widely
accessible and reliable infrastructure such as roads, ICTs, transport and electricity is fundamental
for economic growth, higher employment, enhancement of living standards for the people and

2
invariably boosting the Government’s new impetus and drive for industrialization. With such
attractive promises of the PPP model, to-date the implementation of the PPP policy is still limited,
needing to be improved (EIU, 2015). This paper presents research findings in which SWOT
(Strengths, Weaknesses, Opportunities and Threats) strategic behaviour model was applied to
determine the Leading Strategy or Tanzania’s readiness and capacity to implement sustainable
and efficient PPP projects in the transport sector through a case study of Kigamboni Bridge
project. The paper is structured in five sections. Following this introduction, the second section
presents literature review of PPP complexities relative to Government responsibilities and how
SWOT Clock Strategic Model could be invoked to examine Government’s capacity and readiness
to successfully deliver PPP projects. The third section describes the methodology employed
followed by the fourth section which elucidates data analysis processes and findings are presented.
Finally in section five a conclusion and recommendations are drawn.
2.0 Literature Review
2.1 Public –Private Partnership
Public-Private Partnership (PPP) can be defined as a long-term contract between a Private Party
and a Government Agency, for providing a public infrastructure or service, in which the Private
Party bears significant risks and management responsibilities (World Bank, 2012). In PPP the
service delivery objectives of the government are aligned with the profit objectives of the private
partner (Eldrup and Schütze, 2013). With such arrangement, PPP projects have become difficult
to execute, requiring robust regulatory and institutional architectures, high levels of technical
capacity, political will and social consensus. Furthermore PPP project cycle is a complex one,
requiring skills in financial analysis and modelling, structuring of transactions, expertise in
commercial law, and sector knowledge. (EIU, 2015). Consequently the Government has to
overcome the challenges of building PPP enabling environment, identifying and selecting
appropriate projects, establishing capable coordinating and supportive authority, issuing
transparent tenders, selecting suitable concessionaire and structuring robust contracts. The
Government must also ensure the presence of legal and regulatory framework as the checks and
balances for enabling proper execution of these projects and to be actively involved in project life-
cycle phases (Kwak et.al, 2009).
2.2 Capacity and Readiness of Government for Successful Delivery of PPP Projects
Successful delivery of PPP projects entails improving government’s capacity to execute and
manage innovative partnerships in pursuit for means of averting formidable challenges at earlier
and later stages of PPP market development, as countries increasingly apply the PPP approach to
infrastructure projects across a number of sectors (Doloitte Research, 2006). Indeed the need for
undertaking self-evaluation of government’s capacity and readiness to deliver PPP projects,
followed by continuous improvement in areas where weaknesses are identified, cannot be
overstated. Recent evaluation of 15 African countries readiness and capacity to implement
sustainable and efficient PPP projects in key infrastructure sectors, showed that majority of those
countries had weaknesses in most key indicators for creating enabling environment for successful
delivery of PPP projects as depicted in Figure 1 (EIU, 2015).
2.3 SWOT Analysis of the Government as an Organization Implementing PPP Projects
SWOT analysis is a technique for understanding an organization and its environment, credited to
Albert Humphreys of Stanford University for his research work in 1960s and 1970s (Tirosh, 2013).
Strength factors are those which gives the organization an edge over its competitors while
Weakness factors are those which when used by its competitors will harm the organisation. On
the other hand, Opportunity factors are those which can bring competitive advantage to the

3
organisation whereas Threat factors are the unfavourable situations that can negatively affect the
organisation (Jurevicius, 2013).
Figure 1: Evaluation of Readiness and Capacity for PPP in Africa
NASCENT 29.9
EMERGING 29.9
DEVELOPED 19.9
MATURE 20
DEVELOPED
(60 -79.9%)
NASCENT (0-29.9%)
2.Morocco (51.8%)
3. Kenya (51.4%)
4. Egypt (51.8%)
5.Tanzania (48.6%)6. Côte d’Ivoire (45.5%)
1. South Africa (70.7%)
15. Democratic Republic of
the Congo (20.6%)
MATURE (80-100%)
EMERGING
(30 -59.9%)
7.Tunisia (45.4%)
8. Uganda (45.1%)9. Rwanda (43.5%)
11.Cameroon (38.2%)
12. Nigeria (36.8%) 13. Zambia (34.2%)
14. Angola (31.4%)
Source: Developed from EIU, 2015
As an essential part of organisation strategy, SWOT analysis of its internal Strengths and
Weaknesses as well as its external Opportunities and Threats is an important component for
strategy formulation and implementation (Lynch, 2006). Despite the popularity of the traditional
SWOT analysis, it has inherent flaws associated with being subjective and too often only a
superficial imprecise listing or an incomplete qualitative examination of internal and external
factors, with no criteria for prioritization or the means to analytically assess the fit between SWOT
factors and decision alternatives (Chang & Huang, 2006); (Lynch, 2006); (Moghaddaszadeh et.
al., 2015). With the exception of the pioneering work by Chang & Huang 2006, the SWOT
approach is also faced with strategic positioning dilemma on the time axis (Tirosh, 2010).
Therefore, the rational approach in SWOT analysis developed by Tirosh, 2010 has been adapted
for the current research as the means of achieving the desired study objective while overcoming
the weaknesses identified in the traditional SWOT.
2.4 The SWOT Clock Strategic Behaviour Model
The SWOT Strategic Clock Model is an innovative extension of the traditional SWOT paradigm
in a rationalistic typology that minimises some of its weaknesses (Tirosh, 2010). The model
approach is structured in such a way that at any given moment there is a ‘Leading Strategy’ which
takes into account the close relationship of the internal factors (Strengths and Weaknesses), and
intensity of the external factors of the environment (Opportunities and Threats). The SWOT
factors are quantified based on a list of Influential Factors (internal and external), and a Relative
Weight assigned to each influencing factor reflecting the priority level and its impact, and the
momentary position of influencing factors. The Leading Strategy is determined by choosing the
most suitable of four possible strategies (‘Growth’, ‘Response’, ‘Survivor,’ and ‘Leverage’).
Eventually the weighted values present a two dimensional representation of the current
organisation Leading Strategy which may be traced over a period of time as a vector in the
Cartesian coordinate system (Tirosh, 2013).
2.5 Determination of PPP SWOT Factors for the Public Sector
In a PPP business venture, it is envisaged that all partners looking for potential mutual benefits in
the partnership, invoke the well-established strategy formulation tools, such as the Political,
Economic, Social and Technological (PEST) tool for situation analysis of external environment
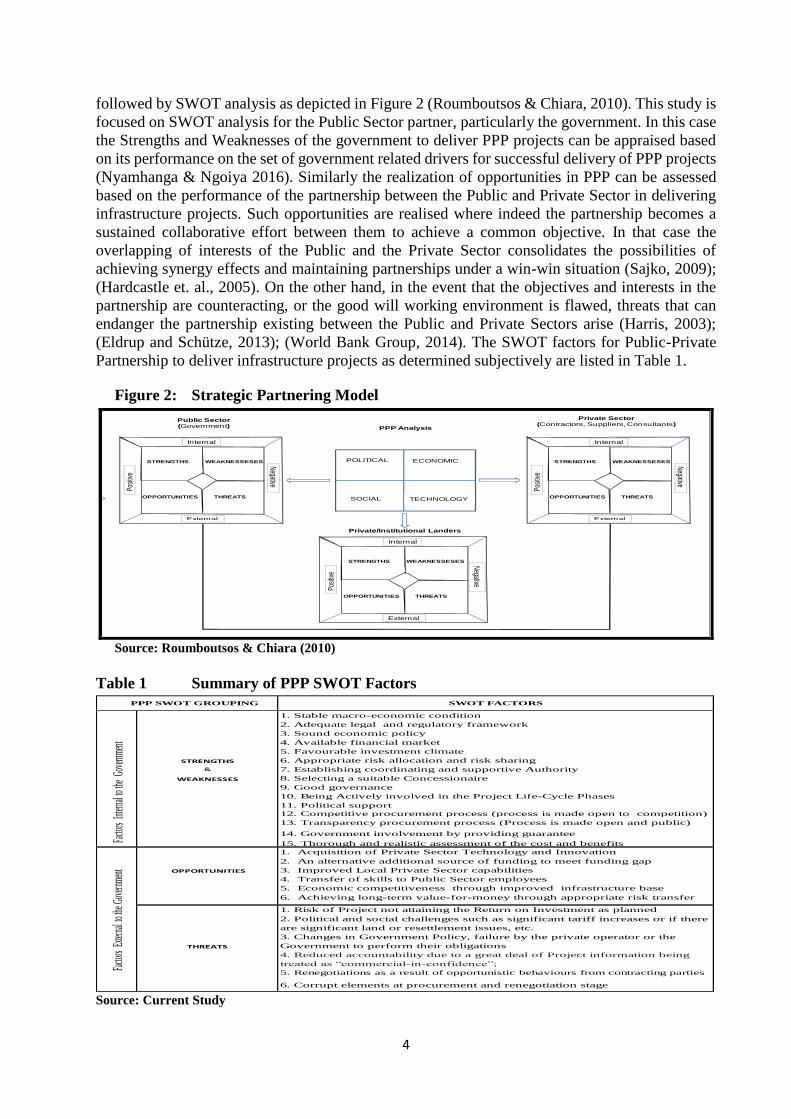
4
followed by SWOT analysis as depicted in Figure 2 (Roumboutsos & Chiara, 2010). This study is
focused on SWOT analysis for the Public Sector partner, particularly the government. In this case
the Strengths and Weaknesses of the government to deliver PPP projects can be appraised based
on its performance on the set of government related drivers for successful delivery of PPP projects
(Nyamhanga & Ngoiya 2016). Similarly the realization of opportunities in PPP can be assessed
based on the performance of the partnership between the Public and Private Sector in delivering
infrastructure projects. Such opportunities are realised where indeed the partnership becomes a
sustained collaborative effort between them to achieve a common objective. In that case the
overlapping of interests of the Public and the Private Sector consolidates the possibilities of
achieving synergy effects and maintaining partnerships under a win-win situation (Sajko, 2009);
(Hardcastle et. al., 2005). On the other hand, in the event that the objectives and interests in the
partnership are counteracting, or the good will working environment is flawed, threats that can
endanger the partnership existing between the Public and Private Sectors arise (Harris, 2003);
(Eldrup and Schütze, 2013); (World Bank Group, 2014). The SWOT factors for Public-Private
Partnership to deliver infrastructure projects as determined subjectively are listed in Table 1.
Figure 2: Strategic Partnering Model
Source: Roumboutsos & Chiara (2010)
Table 1 Summary of PPP SWOT Factors
1. Stable macro-economic condition
2. Adequate legal and regulatory framework
3. Sound economic policy
4. Available financial market
5. Favourable investment climate
STRENGTHS 6. Appropriate risk allocation and risk sharing
& 7. Establishing coordinating and supportive Authority
WEAKNESSES 8. Selecting a suitable Concessionaire
9. Good governance
10. Being Actively involved in the Project Life-Cycle Phases
11. Political support
12. Competitive procurement process (process is made open to competition)
13. Transparency procurement process (Process is made open and public)
14. Government involvement by providing guarantee
15. Thorough and realistic assessment of the cost and benefits
1. Acquisition of Private Sector Technology and Innovation
2. An alternative additional source of funding to meet funding gap
OPPORTUNITIES 3. Improved Local Private Sector capabilities
4. Transfer of skills to Public Sector employees
5. Economic competitiveness through improved infrastructure base
6. Achieving long-term value-for-money through appropriate risk transfer
1. Risk of Project not attaining the Return on Investment as planned
2. Political and social challenges such as significant tariff increases or if there
are significant land or resettlement issues, etc.
THREATS
3. Changes in Government Policy, failure by the private operator or the
Government to perform their obligations
4. Reduced accountability due to a great deal of Project information being
treated as “commercial-in-confidence”;
5. Renegotiations as a result of opportunistic behaviours from contracting parties
6. Corrupt elements at procurement and renegotiation stage
SWOT FACTORS PPP SWOT GROUPING
Facto
rsEx
terna
l to t
he G
overn
ment
Facto
rs In
terna
l to th
e Go
vernm
ent
Source: Current Study
Internal
External
Posi
tive
Negative
STRENGTHS WEAKNESSESES
OPPORTUNITIES THREATS
Internal
External
Posi
tive
Negative
STRENGTHS WEAKNESSESES
OPPORTUNITIES THREATS
Internal
External
Posi
tive
Negative
STRENGTHS WEAKNESSESES
OPPORTUNITIES THREATS
POLITICAL ECONOMIC
TECHNOLOGYSOCIAL
Private/Institutional Landers
Public Sector(Government) PPP Analysis
Private Sector(Contractors, Suppliers, Consultants)

5
3.0 RESEARCH METHODOLOGY
3.1 Review Kigamboni Bridge Project Documents
Kigamboni Bridge is the first project of its kind in Tanzania which is being implemented under
the Public - Private Partnership approach using Design – Build – Finance – Operate and Transfer
(DBFOM) Model. Its construction begun in February 2012, was opened to traffic in April 2016
and thereafter it was renamed as Nyerere Bridge on its inauguration day. As a result of limited
interest of the Private Sector to invest into the construction of the Bridge under PPP approach it
took several years of government advertisement since 1990s with no avail. Ultimately in 2003 the
Tanzania’s National Social Security Fund (NSSF) proposal to deliver the Bridge under PPP
approach was accepted by the Government. Subsequently, NSSF was entrusted with the
responsibility of designing the project, financing, construction, operations and maintenance,
collecting and retaining toll charges from the users of the bridge and finally transferring back the
Bridge to the Government. The Bridge total construction cost was USD 143.5 million whereby
the NSSF financed 60 per cent of the project costs while the remaining 40 per cent of the cost was
funded by the Government as a viability fund (CRiSi, 2010).
3.2 Structured Questionnaire Survey
In order to ensure an effective questionnaire design, a structured-questionnaire was adapted from
Li (2003) and designed with two parts. The first part required personal information of respondents
which included organisation name and his or her position, academic qualification, primary role
and responsibility in the Public or Private Sector or Kigamboni Bridge, years of work experience,
years of experience in implementing Kigamboni Bridge, number of PPP projects to have been
involved in and whether he or she has attended a course on Public-Private Partnership concept.
The second part relates to objectives of this research. A total of 100 questionnaires were distributed
to various stakeholders involved in one way or another in the delivery of the Bridge project based
on non-probabilistic or purposive selection of respondents. They were asked to rate on a 5-point
Likert scale in order to measure the level of agreement between respondents on the statements
provided which depicted Government Strengths and Weaknesses, Opportunities and Threats
factors influencing successful delivery of the Bridge project under PPP approach. For Strengths
and Weaknesses factors, rating number one (1) represented very weak and rating number five (5)
stood for very strong. Similar procedure was repeated for Opportunities and Threats factors with
relevant response scale anchors. Lastly for all factors respondents were required to select “N/A”
if they were uncertain in rating a particulars statement. Out of 100 administered questionnaires,
67 completed questionnaires were collected from respondents, representing a response rate of
67%. An in-depth look at completed questionnaires showed that 53 responded well to the question
concerning Strengths and Weaknesses while 63 responded well to questions concerning
Opportunities and Threats factors respectively. Thus the questionnaires were considered suitable
for analysis as a case of having different sample sizes for each question analysed (Kitchenham &
Pfleeger 2003).
4.0 DATA ANALYSIS AND RESULTS
4.1 Personal Information Data Analysis
All personal information responses were coded and analysed in SPSS version 21. Among the
results, one stands out, indicating that out of total 67 respondents, 49 of them or 73.1% had Masters
Degrees and above, mainly in Economics and Engineering, thus capable of correctly completing
the questionnaire. Detailed results of personal information data have been reported in Nyamhanga
& Ngoiya, (2016).

6
4.2 Descriptive Statistical Data Analysis
4.2.1 Strength and Weakness Factors
Strengths and Weaknesses factors were to be identified and separated from each other based on
respondent’s rating on the same scale, the government linked drivers for successful delivery of
Kigamboni Bridge. Factors with percentage rating exceeding 40% representing very weak, weak
and average scale anchors were collectively considered as weakness factors. They are the available
financial market, appropriate risk allocation and sharing, and thorough and realistic cost-benefit
analysis. The remaining 12 factors, for which respondent’s frequency rating of strong and very
strong exceeded 60% were considered to be Strength factors as depicted in Figure 3.
4.2.2 Opportunities and Threats Factors
Respondent’s rating of Opportunity factors had a medium value of four (4) which stand for “more
attained”, indicating that most of them agreed that the suggested statements represented
opportunity factors. Similarly five (5) out of six (6) Threat Factors attained respondents rating of
a median value of three (3) which stands for “sometimes encountered” while only one factor
named “Political and Social challenges” attained a median value of (4) meaning that it was the
most often encountered threat as shown in Figure 4.
Figure 3: Rating of Government Strength and Weakness Factors for SWOT Analysis
Source: Current study
Figure 4: Respondents Frequency Median Values for Government’s Threat Factors
Source: Current study
0
10
20
30
40
50
60
70
80
90
100
Freq
uenc
y of
Res
pond
ents
(%)
Government Strength and Weakness Factors
(%)age Very weak, Weak and Average Responses
(%)age Strong & Very Strong Responses
0
1
2
3
4
5
Risk of project not attaining the return
on investment
Political and social challenges such as tarrif increase, land and resettlement
issues
Changes of Government policy
or failure by the private operator or
Government to perform their
obligations
Reduced accountability due
to project information being
treated as "commercial-in-
confidence"
Opportunistic behaviour of
contracting parties leading to
renegotiations
Corrupt practices at procurement as well as at renegotiation
stages
Resp
onde
nts M
edian
Valu
es
Government Threat Factors

7
4.3 Inferential Statistical Data Analysis
4.3.1 Prioritization of SWOT Factors by Principal Component Analysis
The SWOT data for Strengths, Weaknesses, Opportunities and Threats having passed descriptive
statistical analysis stage were prioritized separately by applying dimension reduction factor
analysis procedure in SPSS, using Principal Component Analysis (PCA). The process was
followed by elimination of cross-loaded factors (Tabachnick & Fidell, 2013) as well as ranking
and deletion of factors whose magnitude of factor loading fell below the mean value of factor
loadings of all factors within a Principal Component (Moghaddaszadeh et. al., 2015). In this way
the process prioritized and reduced the 27 SWOT factors to finally 12 factors or three (3) factors
per each SWOT acronym letter as well as ranking them by the magnitude of their factor loadings.
4.3.2 SWOT Diamond Strategy Vector Analysis
The procedure for the application of SWOT Clock Strategic Model to determine the Leading
Strategy used parameters of prioritized and ranked Influencing Factors. The established
Influencing Factors, three (3) variables for each SWOT acronym letter were then combined to
form two sets of six variables each for SWOT’s internal factors (Strengths and Weaknesses) and
external factors (Opportunities and Threats) respectively. These two sets of variables were then
analysed separately by Principal Component Analysis to produce new SWOT factors ranking
according to the magnitude of the new factor loadings. Concurrently the initial Eigenvalues as a
percentage of total variance corresponding to the SWOT factors were also produced. Thereafter
the positioning of SWOT factors was performed on a three level scale depending on their relative
importance ranking. Level three (3) represented High position while level two (2), Medium and
level one (1) Low position. The relative positions of SWOT factors and the intensity of their
influence are depicted in Figure 5.
Figure 5: Summary of SWOT Influencing Factors and their Positions
Source: current study
Since the percentage of the total variance of each set of six variables add up to 100%, the value of
such percentages were considered to be the relative weights for the influencing SWOT factors
(Ma’ruf, 2007). A new ranking of relative importance of the SWOT factors was then determined
by considering the magnitude of the resulting initial eigenvalues percentage of total variance or
Internal
Ne
ga
tive
Po
sit
ive
External
STRENGTH WEAKNESSES
OPPORTUNITIES THREATS
Rank Loading PositionIntensity
1 0.804 3 High
20.796
2 Medium
30.653
1 Low
Thorough and realistic cost-benefit
assessment
Appropriate risk allocation and risk
sharing
SWOT Factor
Available Financial Market
Rank Loading PositionIntensity
1 0.788 3 High
2 0.727 2 Medium
3 Competitve Procurement Process 0.704 1 Low
SWOT Factor
Being actively involved in project life
cycle
Good Governance
Rank Loading PositionIntensity
1 0.854 3 High
2 0.846 2 Medium
3 0.840 1 LowAchieving long termValue for Money
SWOT Factor
Economic competitiveness through
improved infrastructure baseImproved local Private Sector
capabilities
Rank Loading PositionIntensity
1 0.991 3 High
2 0.942 2 Medium
3 0.926 1 Low
SWOT Factor
Opportunistic behaviour of contracting
parties leading to renegotiations
Political and social challenges such as tarrif
increase, land and ressetlement issues
Change of Government policy or failure by
the Private Operator or Government to
perform their obligations

8
relative weights. This process produced a quantitative objective measuring index which represents
the factor’s quantitative value for which a set of two (2) Weighted Power Intensity (WPI) matrices
were developed for both the Organization and the Environment. Using these matrices it was
possible to calculate quantitatively the power intensity of the four SWOT factors as the product of
the relative weight of each factor with the corresponding assigned position value as depicted in
Tables 2 and Table 3.
Table 2: A Matrix for Power Intensity of the Government's Strength and Weakness in
Relation to Delivery of Kigamboni Bridge PPP Project
A Matrix for Power Intensity of the Government's Strength and Weakness in Relation to Implementing Kigamboni PPP Project
Measuring Scale High Mid Low Low Mid High
3 2 1 1 2 3
1 Available financial market .804 55.903 55.903
Weighted intensity 167.71
2 Thorough and realistic cost-benefit assessment. .796 13.669 13.669
Weighted intensity 27.338
3 Being actively involved in project's life cycle .788 11.947 11.947 35.84
Weighted intensity
4 Good Governance .727 8.172 8.172
Weighted intensity 16.344
5 Competitive procurement process .704 6.039 6.039
Weighted intensity 6.04
6 Appropriate risk allocation and risk sharing, .653 4.269 4.269
Weighted intensity 4.27
100 100.000 TOTAL 35.84 16.344 6.04 4.27 27.338 167.71
58.22 199.32
Power intensity of
"weakness"
Relative
Weight
Power Intensity of
"Strength"
Weighted Power
Intensity
S/N Influencing Factor Factor Loadinginitial Eigenvalue
% of Variance
Source: Current study
Table 3: A Matrix for Power Intensity of the External Environment Opportunities and
Threats in Relation to Delivery Kigamboni Bridge PPP Project
A Matrix for Power Intensity of the External Environment in Relation to Implementing Kigamboni PPP Project
Measuring Scale High Mid Low Low Mid High
3 2 1 1 2 3
.854 39.256 39.256
Weighted intensity 117.8
.942 26.935 26.935
Weighted intensity 53.87
.991 16.772 16.772
Weighted intensity 50.32
.926 7.418 7.418
Weighted intensity 7.42
.846 6.229 6.229
Weighted intensity 12.458
.840 3.390 3.390
Weighted intensity 3.39
100 100 TOTAL 117.8 12.458 3.39 7.42 53.87 50.32
133.62 111.60
Power intensity of
"Threats"
S/N Influencing FactorFactor Loading
initial Eigenvalue
% of Variance
Relative
Weight
Weighted Power
Intensity (WPI)
Economic competitiveness through improved infrastructure base1
Political and social challenges such as tarrif increase, land and resettlement
issues2
Opportunistic behaviour of contracting parties leading to renegotiations3
Changes of Government policy or failure by the private operator or
Government to perform their obligations4
Improved Local Private Sector capabilities5
Achieving long-term value-for-money through appropriate risk transfer to the
Private Sector6
Power Intensity of
"Opportunities"
Source: Current study
In summary, the Weighted Power Intensity (WPI) variables in the SWOT Clock Strategic Model
as a combination of factors from both Tables 2 and Table 3 are presented in Table 4. It shows that

9
the Strength Intensity is smaller than the Weakness Intensity and the Opportunity Intensity is
higher than the Threat Intensity, thereby consolidating the Leading Strategy as depicted in Figure
6.
Table 4: Summary of the Weighted Power Intensity of Variables for SWOT Clock
Strategic Model
Strength Intensity Opportunity Intensity Weakness Intensity Threat Intensity
S O W T
58.22 133.62 199.32 111.60 Source: Current study
Figure 6: The SWOT CLOCK Diamond Behaviour Model in Relation to Delivery
of Kigamboni Bridge PPP Project
160
80
40
120
80 40120
200
200200 160
200
160
120
80
40
40
GROWTHSTRATEGY
0 80 120 160 T
W
S
LEVERAGESTRATEGY
RESPONSESTRATEGY
SURVIVALSTRATEGY
O
Source: Current study
Positioning of the Weighted Power Intensity of each SWOT intensity factor in the SWOT Clock
Diamond Behaviour Model, involves creating simultaneously four triangles which represents four
possible strategies of Growth, Response, Survival and Leverage using values from Table 4. The
quadrant with the largest triangle determines the Leading Strategy which in this case is the
Leverage Strategy. Finally the strategic pointer position is at a point within the third Quadrant of
the Cartesian coordinate system having coordinates (22.10 [opportunities], 141.10 [weaknesses])
as indicated by the pointer vector which begins at the origin passing through (O22, W141) as
depicted in Figure 6.
5.0 CONCLUSION AND RECOMMENDATIONS
In determining the Leading Strategy which is being applied by the Government to deliver
Kigamboni Bridge, the findings show that the Principal Component Analysis iteratively prioritized
and reduced 27 SWOT factors to 12 SWOT factors, six (6) each for both internal and external
environment factors. Subsequent ranking of those factors through the factor loading and later by
their relative weights corresponding to initial Eigenvalues percentage of total variance became an
input into the SWOT Clock Strategic Model. From the positioning and the relative weights, four
10
weighted triangles were simultaneously created within the SWOT Clock Diamond Behaviour
Model representing four possible strategies namely, Growth, Response, Survival and Leverage
Strategy.
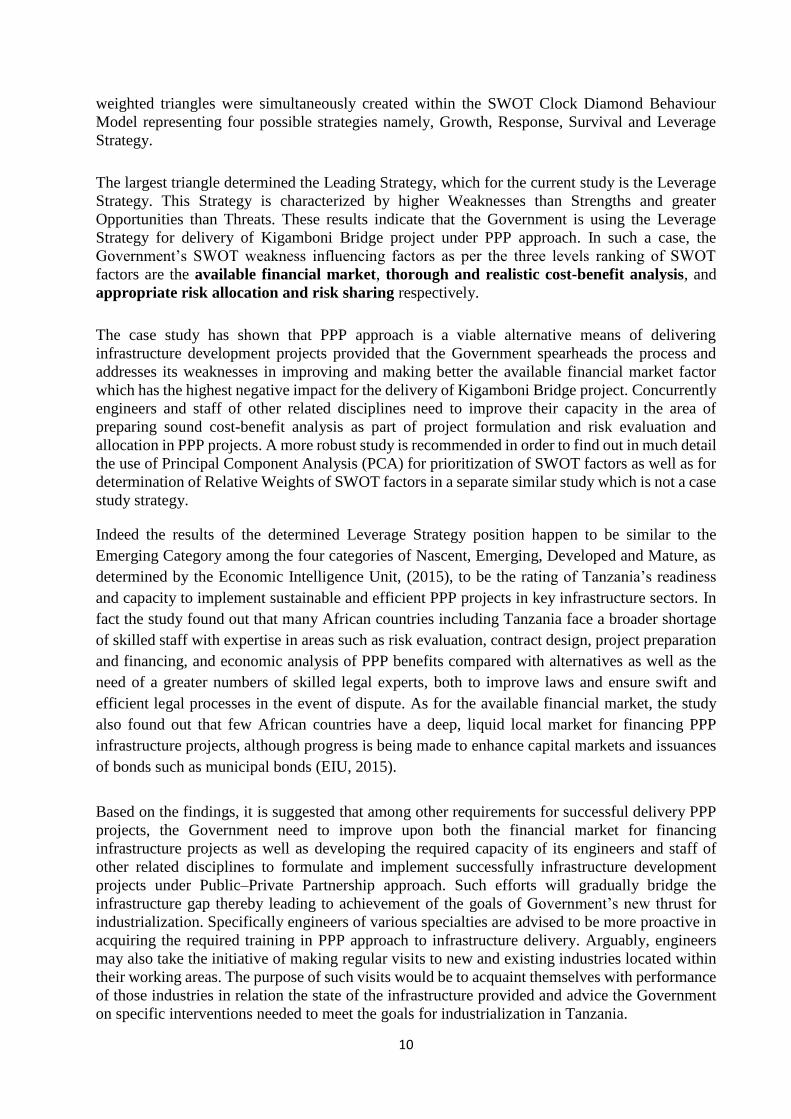
The largest triangle determined the Leading Strategy, which for the current study is the Leverage
Strategy. This Strategy is characterized by higher Weaknesses than Strengths and greater
Opportunities than Threats. These results indicate that the Government is using the Leverage
Strategy for delivery of Kigamboni Bridge project under PPP approach. In such a case, the
Government’s SWOT weakness influencing factors as per the three levels ranking of SWOT
factors are the available financial market, thorough and realistic cost-benefit analysis, and
appropriate risk allocation and risk sharing respectively.
The case study has shown that PPP approach is a viable alternative means of delivering
infrastructure development projects provided that the Government spearheads the process and
addresses its weaknesses in improving and making better the available financial market factor
which has the highest negative impact for the delivery of Kigamboni Bridge project. Concurrently
engineers and staff of other related disciplines need to improve their capacity in the area of
preparing sound cost-benefit analysis as part of project formulation and risk evaluation and
allocation in PPP projects. A more robust study is recommended in order to find out in much detail
the use of Principal Component Analysis (PCA) for prioritization of SWOT factors as well as for
determination of Relative Weights of SWOT factors in a separate similar study which is not a case
study strategy.
Indeed the results of the determined Leverage Strategy position happen to be similar to the
Emerging Category among the four categories of Nascent, Emerging, Developed and Mature, as
determined by the Economic Intelligence Unit, (2015), to be the rating of Tanzania’s readiness
and capacity to implement sustainable and efficient PPP projects in key infrastructure sectors. In
fact the study found out that many African countries including Tanzania face a broader shortage
of skilled staff with expertise in areas such as risk evaluation, contract design, project preparation
and financing, and economic analysis of PPP benefits compared with alternatives as well as the
need of a greater numbers of skilled legal experts, both to improve laws and ensure swift and
efficient legal processes in the event of dispute. As for the available financial market, the study
also found out that few African countries have a deep, liquid local market for financing PPP
infrastructure projects, although progress is being made to enhance capital markets and issuances
of bonds such as municipal bonds (EIU, 2015).
Based on the findings, it is suggested that among other requirements for successful delivery PPP
projects, the Government need to improve upon both the financial market for financing
infrastructure projects as well as developing the required capacity of its engineers and staff of
other related disciplines to formulate and implement successfully infrastructure development
projects under Public–Private Partnership approach. Such efforts will gradually bridge the
infrastructure gap thereby leading to achievement of the goals of Government’s new thrust for
industrialization. Specifically engineers of various specialties are advised to be more proactive in
acquiring the required training in PPP approach to infrastructure delivery. Arguably, engineers
may also take the initiative of making regular visits to new and existing industries located within
their working areas. The purpose of such visits would be to acquaint themselves with performance
of those industries in relation the state of the infrastructure provided and advice the Government
on specific interventions needed to meet the goals for industrialization in Tanzania.

11
REFERENCES
Chang H. and Huang W. (2006), Application of a Quantification SWOT Analytical Method,
Mathematical and Computer Modeling 43, pp. 158-169, Elsevier;
CRiSi Infrastructure Advisory (2010), Kigamboni Bridge Financial Feasibility Assessment
Report, National Social Security Fund;
Doloitte Study, (2006), Closing the Infrastructure Gap: the Role of PPPs, Deloitte Research Study,
Deloitte;
EIU (Economic Intelligence Unit) (2015), Evaluating the environment for public–private
partnerships in Africa, The 2015 Infrascope, EIU, London;
Hardcastle, C., Edwards, P.J., Akintoye, A. and Li, B. (2005). Critical success factors for PPP/PFI
projects in the UK construction industry: A factor analysis approach, Construction
Management and Economics, 23(5);
Harris, C. (2003), Private Participation in Infrastructure in Developing Countries: Trends, Impacts,
and Policy Lessons. World Bank Working Paper, no. 5, The International Bank for
Reconstruction and Development, The World Bank, 1818 H Street, N.W., Washington, D.C.
20433, U.S.A;
Jurevicius, O. 2013, SWOT Analysis – Do it Properly, Strategic Management Insight,
http//www.strategicmanagementinsight.com/ (Accessed 8th September 2016);
Kitchenham, B. & Pfleeger, S. L., (2003), Principles of Survey Research, Data Analysis Part 6,
Software Engineering Notes Vol. 28 No 2;
Kwak, Y. H., Chih Y. & Ibbs C. W. (2009), Towards a Comprehensive Understanding of Public
- Private Partnerships for Infrastructure Development, California Management Review Vol.
51, No. 2 P51-78, Winter 2009;
Li, Bing (2003) Risk Management of Construction Public-Private Partnership Projects, PhD
Thesis, Glasgow Caledonian University, United Kingdom;
Lynch, R. (2006). Strategic Management 5th ed. Edinburgh Gate, Harlow, Essex, CM20 2JE,
England, Pearson Education Limited;
Ma'ruf. B., (2007), A Systematic Approach to Strategy formulation for Medium sized Shipyards,
Jurnal manajemen Teknologi, Vol 6, (2), PP 169-178;
Moghaddaszadeh, M., Sarfaraz, A. H., Komijan, A. R. and Shojaie A. A., (2015), An Integration
of SWOT and Factor Analysis to Determining and Prioritizing Strategies: Case Study of a
Persian Food Industry, International Journal of System Assurance Engineering and
Management Vol. 6 (3), pp 297–303;
Nyamhanga, J.M & Ngoiya, F.E. (2016), Drivers for Successful Delivery of Infrastructure
Development Projects through Public - Private Partnership Approach for Sustainable United
Nations Development Goals: The Case for Kigamboni Bridge in Dar Es Salaam, Tanzania.
Proc. 10th International Conference on Achievement of United Nations Sustainable
Development Goals in Innovation, Technology and Engineering, 1st – 2nd December, 2016
Arusha, Tanzania, PP 35-49

12
The United Republic of Tanzania, (2009), The National Public - Private Partnership Policy, Prime
Minister’s Office;
Tirosh, N (2010), The SWOT CLOCK Strategic Behavior, 3rd. Annual EuroMed Conference of
the EuroMed Academy of Business, Nicosia, Cyprus, EuroMed Press, Proceedings, ISBN :
978-9963-634-83-5;
Tirosh, N (2013), Systems and methods for Business Decision Making, United States Patent
Application Publication No. US 2013/0218642 Al. available from
https://www.luminpdf.com/ Retrieved on 28 September, 2016;
World Bank, (2012) Public-Private Partnerships: Reference Guide. World Bank Institute and
Public-Private Infrastructure Advisory Facility (PPIAF);
World Bank Group, (2014), Overcoming Constraints to the Financing of Infrastructure, Success
Stories and Lessons Learned: Country, Sector and Project Examples of Overcoming
Constraints to the Financing of Infrastructure.