Embed Size (px)
Citation preview
1 INTRODUCTION
The design of an underground structure always requires a characterisation of the ground within the project area. This characterisation forms the basis for the design of the excavation and support. Characterising a rock mass requires a complete image of the rock material, its condition, geometrical assembly, and its discontinuity and fault systems. Different investigation methods are applied in various investigation phases. These methods can include field mapping, drill hole logging, and geophysical investigations. An investigation campaign should result in a three-dimensional geological model representing the most probable rock mass condition. However, due to the limited extent of site investigations, this model contains uncertainties. Field mapping is restricted to the surface, whereas drill cores provide only data for a limited rock mass volume. In addition to the uncertainties of the geological model, the values of the geotechnical parameters of the rock mass material are often widely distributed. Finding representative values is a challenging task.
The purpose of this paper is to highlight the aims of the geological investigation, the associated geological modelling and data evaluation, and to propose a characterisation method which allows the consideration of the inherent uncertainties of the geological model and geotechnical parameters. A procedure for rock mass characterisation is presented which was released as a guideline in Austria. This procedure forms the framework for further analyses. The steps of the procedure are
practically formulated in a computational model which contains the relevant information of the geological model and data evaluations. Probabilistic methods were used to evaluate the computational model. The general principles to create a computational model are presented and discussed on simple examples, especially the consideration of faults. The entire method is discussed in an example which was recently carried out for the tender design of a major tunnel project in Austria.
2 GEOLOGICAL INVESTIGATIONS AND MODELLING
Site investigation for an underground structure is a difficult task which in many cases is underestimated. The overall goal of site investigation is to develop a consistent ground model including all geotechnical and hydraulic aspects relevant for the underground structure as the basis for the construction contract. In all phases of the design this final goal should be kept in mind. Realistic modelling of rock mass geometry and mechanical behaviour of rock masses depends on the understanding of geological processes and their complex interactions such as tectonic deformation, weathering and morphogenesis (Steidl 2003). Suitable investigation concepts call for methods in accordance with the project and design stage. They include desk studies, field mapping, and subsurface investigations (Riedmüller 1998, Riedmüller & Schubert 1999, Steidl et al. 2001, Riedmüller & Schubert 2001, Goricki et al. 2001).
Determination of rock mass behaviour as an integral part in rock mass characterisation using probabilistic methods M. Pötsch & W. Schubert Institute for Rock Mechanics and Tunnelling, Graz University of Technology
A. Goricki & A. Steidl 3G Gruppe Geotechnik Graz ZT GmbH
ABSTRACT: When the geotechnical engineer is involved in rock mass characterisation, he is faced with geological and geotechnical data which inherently contain uncertainties. This paper proposes a procedure to facilitate the processing of these data, and to consistently consider uncertain parameters in the geotechnical design process. Consequences on the requirements for geological investigations and modelling are discussed. The general procedure of rock mass characterisation and its computational implementation is described whereby the focus is set on probabilistic processing of geological data. The application of the procedure is presented in detail on a rock mass characterisation performed for a major tunnel project in Austria.
The correct transfer of the geological-geotechnical rock mass model and its implications into a proper design is one of the most challenging tasks in an underground project. One of the main problems is the uncertainty inherent in the geological prediction. Other problems are the assessment of such factors as site management, workmanship and support effects or the care and experience applied in the updating of the geological model as excavation proceeds (Riedmüller 1997).
The correct way to consider the uncertainty is to describe the rock mass and its parameters by statistical distributions rather than by singular deterministic values. However, the basis for all further investigations is a sound geological model together with carefully investigated and reasonably selected rock mass parameters.
Geological singularities of the rock mass model such as faults, lithological boundaries, and aquifers have a significant influence on a tunnel project. The necessary data to describe singularities can be either measured in boreholes, outcrops, aerial and satellite images or estimated. These data form the basis for the statistical distributions applied in the proposed procedure. Results have to be reconsidered after each new investigation campaign.
In addition to the lithological discrimination between rock types, significant differences within a certain rock type, e.g. spacing and frequency of discontinuity sets, or the unconfined compressive strength, can be described by frequency distributions. For example, the spacing of discontinuities can be obtained by applying scanline or window mapping techniques on selected outcrops or along drill cores. When a sufficiently large number of data cannot be obtained, the parameter distribution can be estimated by using statistical methods.
3 ROCK MASS CHARACTERISATION
3.1 General Procedure The geotechnical design, as part of the excavation design, serves as a basis for approval procedures, the determination of excavation classes and their distribution, and the determination of the excavation and support methods used on site (Schubert et al. 2001).
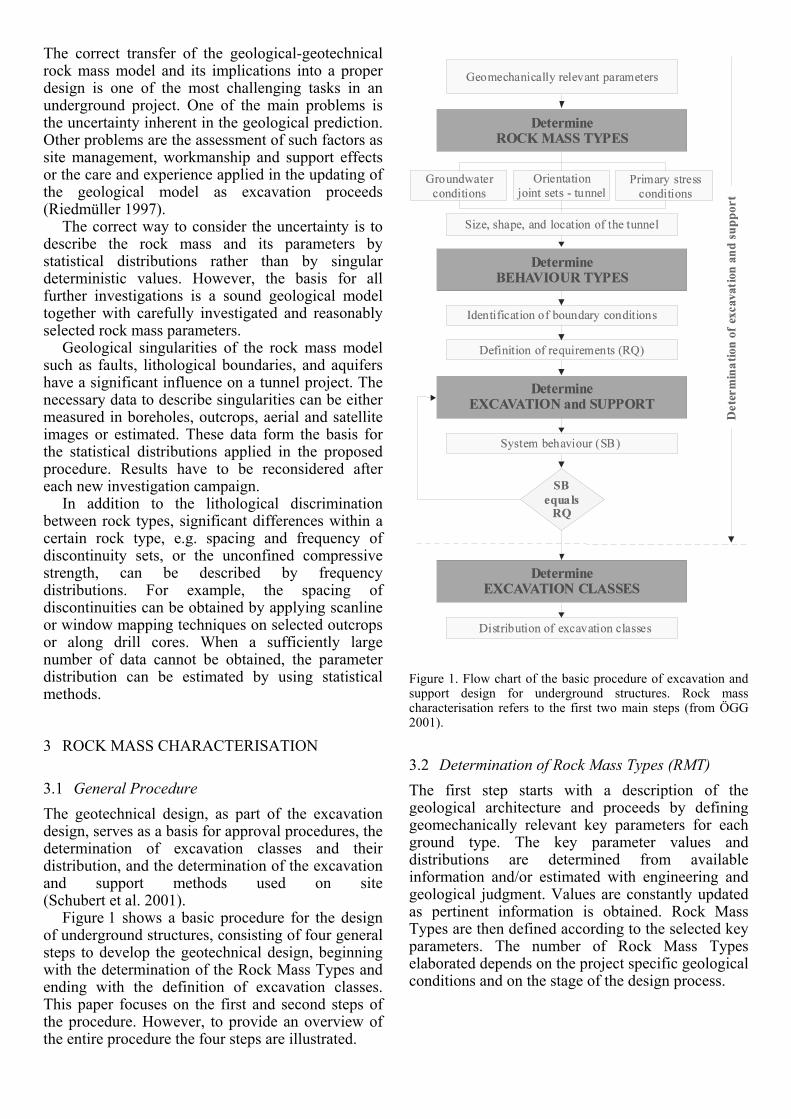
Figure 1 shows a basic procedure for the design of underground structures, consisting of four general steps to develop the geotechnical design, beginning with the determination of the Rock Mass Types and ending with the definition of excavation classes. This paper focuses on the first and second steps of the procedure. However, to provide an overview of the entire procedure the four steps are illustrated.
Figure 1. Flow chart of the basic procedure of excavation and support design for underground structures. Rock mass characterisation refers to the first two main steps (from ÖGG 2001).
3.2 Determination of Rock Mass Types (RMT) The first step starts with a description of the geological architecture and proceeds by defining geomechanically relevant key parameters for each ground type. The key parameter values and distributions are determined from available information and/or estimated with engineering and geological judgment. Values are constantly updated as pertinent information is obtained. Rock Mass Types are then defined according to the selected key parameters. The number of Rock Mass Types elaborated depends on the project specific geological conditions and on the stage of the design process.
3.3 Determination of Rock Mass Behaviour Types (BT)
The second step involves evaluating the potential rock mass behaviours considering each Rock Mass Type and local Influencing Factors, including the relative orientation of relevant main discontinuity sets to the excavation, ground water conditions, primary stress situation, and the size, shape and location of the underground structure. This process results in the definition of project specific Behaviour Types.
Following the steps of figure 1, the rock mass behaviour is the response of a Rock Mass Type exposed to the acting Influencing Factors. It is determined on the final geometry of the excavation without considering support measures or excavation sequences. To evaluate this response, any suitable method is applicable. The authors predominantly used analytical models but under certain circumstances numerical or empirical methods are also reasonable (Thurner 2000, Schweiger et al. 2002).
The Rock Mass Behaviour Types form the basis for determining the excavation and support methods as well as assisting in evaluating monitoring data during the excavation.
The rock mass behaviour is the result of a failure of the rock mass surrounding the underground excavation. Each failure mechanism can be computed with appropriate analytical models and classified into defined Behaviour Types (Goricki 2003). The different failure mechanisms can be distinguished into gravity controlled failure of key blocks, gravity controlled failure of a highly fractured rock mass, stress induced failures such as shear failure, rock burst, spalling, buckling, and plastification, and other failure modes (ravelling ground, flowing ground and swelling ground).
3.4 Determination of the excavation and support In the third step, different excavation and support measures are evaluated and acceptable methods are determined based on the defined Behaviour Types. The System Behaviour (SB) is a result of the interaction between the rock mass and its behaviour and the selected excavation and support schemes. The evaluated System Behaviour has to be compared to the defined requirements. If the System Behaviour does not comply with the requirements, the excavation and/or support scheme has to be modified until compliance is obtained.
3.5 Determination of excavation classes In the final step of the design process the geotechnical design must be transformed into a cost and time estimate for the tender process. Excavation
classes are defined based on the evaluation of the excavation and support measures, which is regulated for example in Austria with the standard ÖNORM B2203-1 by classifying round length and support measures. These excavation classes form a basis for compensation clauses in the tender documents. The distribution of the expected Behaviour Types and the excavation classes along the alignment of the underground structure provides the basis for establishing the bill of quantities and the bid price during tender.
4 COMPUTATIONAL APPROACH
The characterisation procedure is performed by a computational model. This model follows the characterisation steps described above and promotes project-specific analyses and evaluations to cover the variety in geotechnical engineering and tunnelling. Probabilistic simulations are facilitated by this model.
4.1 General description In general, the rock mass is subdivided into calculation segments to which Rock Mass Types and Influencing Factors are assigned. The rock mass behaviour is determined for each calculation segment using various analytical models to determine distinct failure mechanisms.
4.1.1 Calculation Segments The geological model is virtually cut into slices along the tunnel axis. These slices are called “calculation segments”. They can have a constant or variable thickness and possess a virtual extent to avoid any boundary influence. These calculation segments are consecutively arranged along the tunnel axis and represent the discretised rock mass. Relevant properties and boundary conditions are assigned to the calculation segments.
The properties are assigned in terms of individual key parameters. Key parameters can be the rock type, the fracturing, and/or mechanical and hydraulic properties. The Rock Mass Type of the calculation segment results from the current combination of key parameters and their corresponding values.
In the next step the Influencing Factors (see 3.3) are assigned to the calculations segments. They represent the relevant boundary conditions of the calculation segment to the rock mass behaviour. The primary stress condition can be estimated from the corresponding overburden, and additionally from the genesis of the rock mass, the tectonic history, the location of the excavation within the rock mass, etc. The orientation of the main discontinuity sets relative to the excavation is based on both the field mapping and logging oriented drill cores.
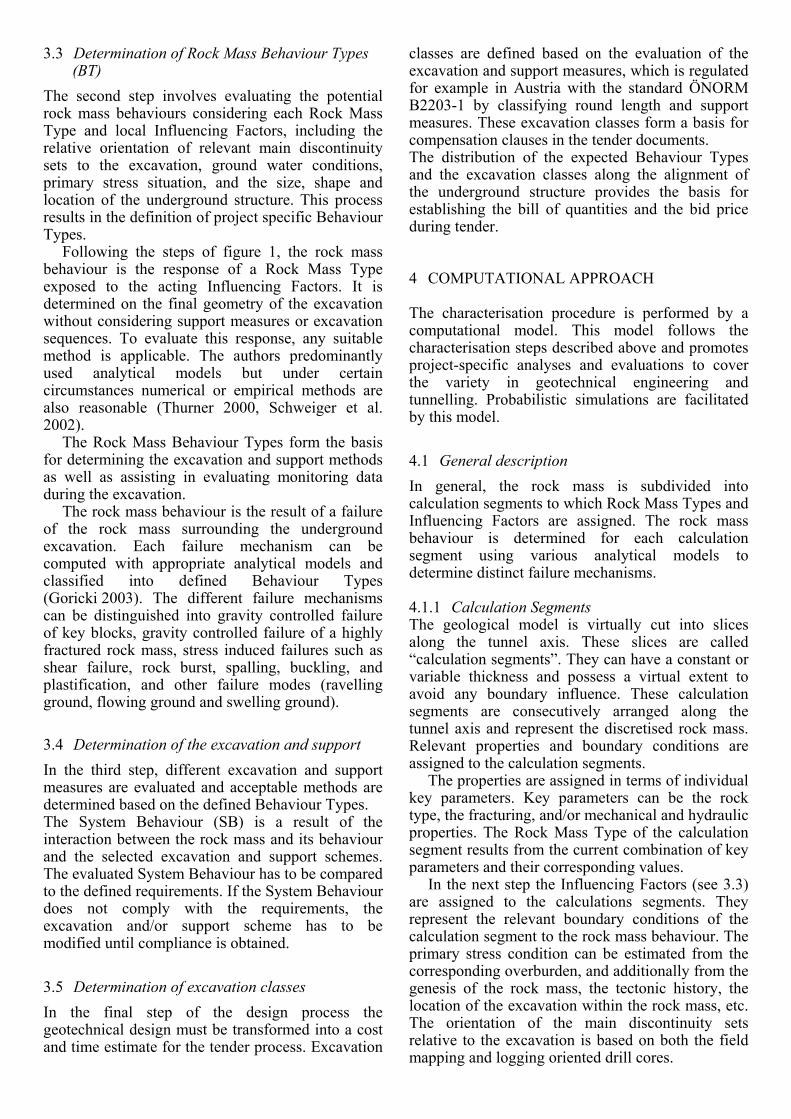
The presence of ground water is usually estimated from a hydrogeological model. As mentioned before, for the determination of the rock mass behaviour only full face excavation is considered.
Figure 2 shows the described sequence of the assignment of rock mass properties with individual key parameters in a simple geological model. It consists of three lithological series which are a phyllite series, a carbonate series and tertiary sediments. Additionally, it contains the probable location of faults and their orientation. Relevant key parameters were identified which are the rock type and its unconfined compressive strength (UCS), the fracturing of the rock mass, the spacing of the foliation, and the presence of faults. These parameters are allocated to their probable location along the tunnel axis. Discretising the geological model into calculation segments and combining the corresponding parameters result in one Rock Mass Type for each calculation segment. In the last row of figure 2 three examples of resulting calculation segments are presented. These are a blocky rock mass (RMT 1), a faulted rock mass (RMT 8), and a foliated rock mass (RMT 7) with a fault near the tunnel wall.
Figure 2. Example for the assignment of Rock Mass Types derived from a geological model (from Goricki 2003)
4.1.2 Analysis of Rock Mass Behaviour The calculation segments are analysed with respect to the response of the current Rock Mass Type to tunnel excavation under the corresponding Influencing Factors. For the analysis different analytical models are simultaneously applied. Every model provides a physical value which describes an aspect of the rock mass response, e.g. displacements, depth of the failure zone, volume of overbreak, severity of rock burst, etc. Comparing these results to previously defined delimiting criteria various Behaviour Types can be distinguished. The most critical Behaviour Type is then assigned to the calculation segment.
For the estimation of displacement magnitudes and depth of failure zone the models from Hoek et al. (1995) or Feder & Arwanitakis (1976) are applied. The overbreak volume is assessed applying the principles of block theory (Goodman & Shi 1985) under consideration of the stress condition around the tunnel (Karzulovic 1988, Pötsch 2002).
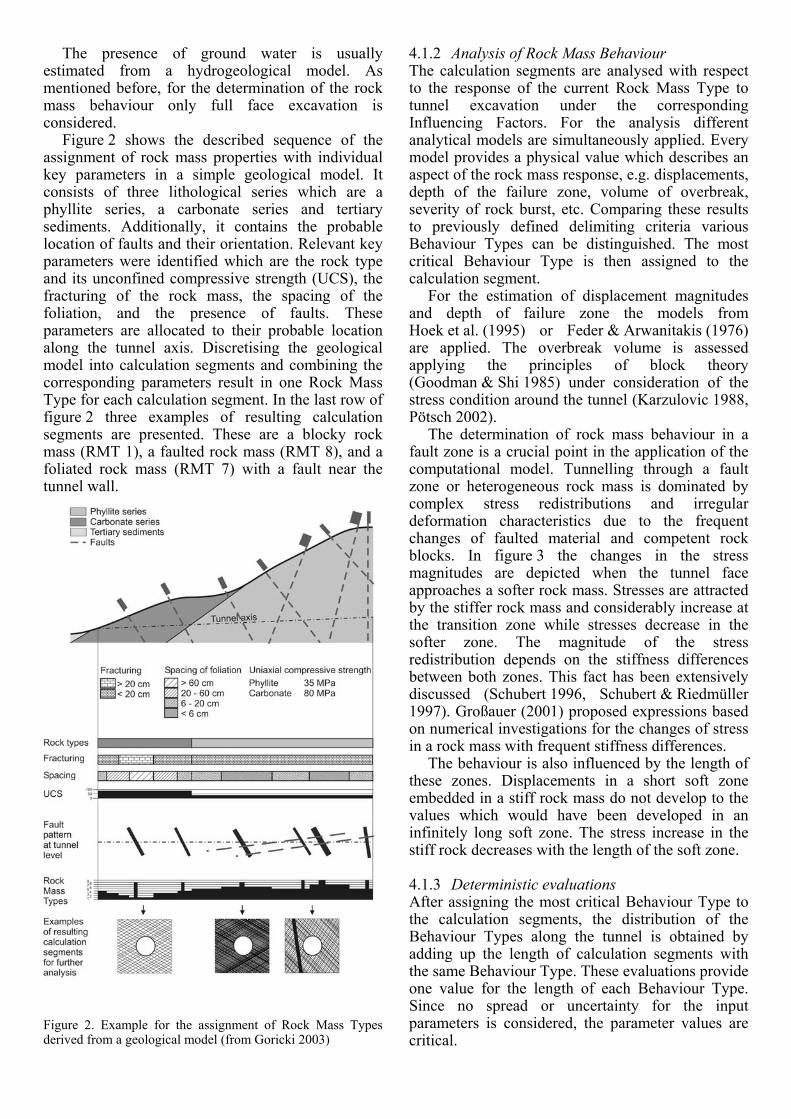
The determination of rock mass behaviour in a fault zone is a crucial point in the application of the computational model. Tunnelling through a fault zone or heterogeneous rock mass is dominated by complex stress redistributions and irregular deformation characteristics due to the frequent changes of faulted material and competent rock blocks. In figure 3 the changes in the stress magnitudes are depicted when the tunnel face approaches a softer rock mass. Stresses are attracted by the stiffer rock mass and considerably increase at the transition zone while stresses decrease in the softer zone. The magnitude of the stress redistribution depends on the stiffness differences between both zones. This fact has been extensively discussed (Schubert 1996, Schubert & Riedmüller 1997). Großauer (2001) proposed expressions based on numerical investigations for the changes of stress in a rock mass with frequent stiffness differences.
The behaviour is also influenced by the length of these zones. Displacements in a short soft zone embedded in a stiff rock mass do not develop to the values which would have been developed in an infinitely long soft zone. The stress increase in the stiff rock decreases with the length of the soft zone.
4.1.3 Deterministic evaluations After assigning the most critical Behaviour Type to the calculation segments, the distribution of the Behaviour Types along the tunnel is obtained by adding up the length of calculation segments with the same Behaviour Type. These evaluations provide one value for the length of each Behaviour Type. Since no spread or uncertainty for the input parameters is considered, the parameter values are critical.
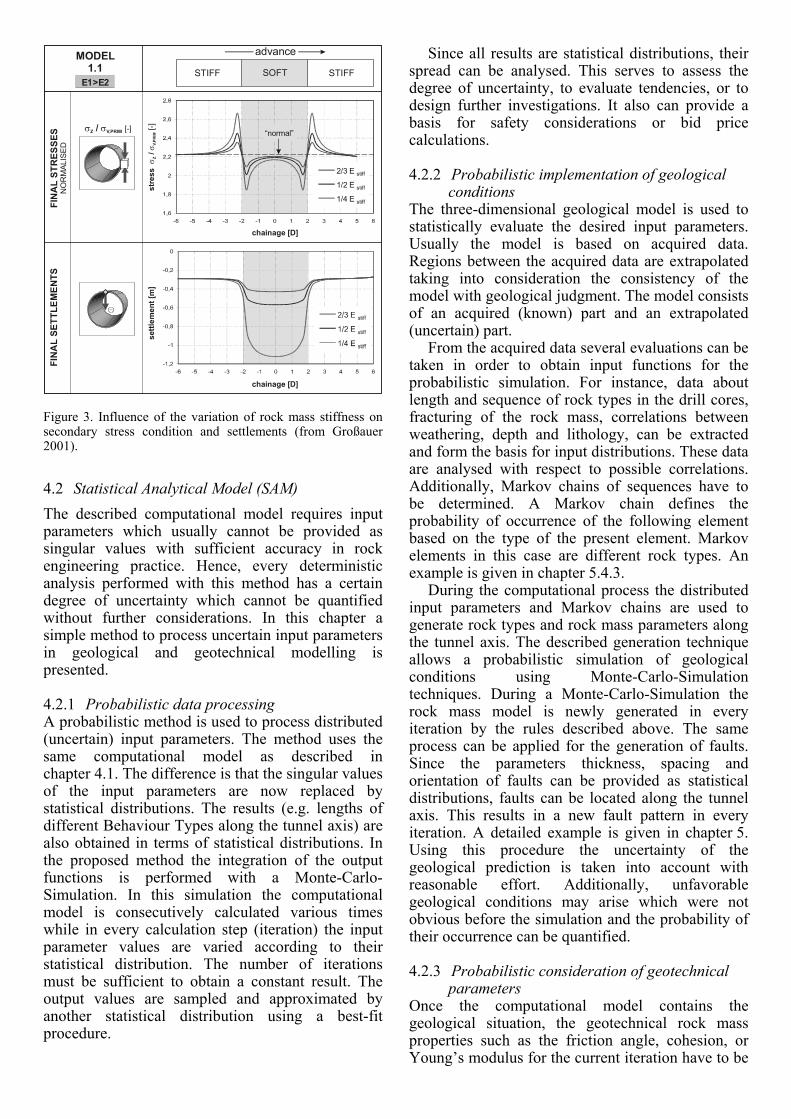
Figure 3. Influence of the variation of rock mass stiffness on secondary stress condition and settlements (from Großauer 2001).
4.2 Statistical Analytical Model (SAM) The described computational model requires input parameters which usually cannot be provided as singular values with sufficient accuracy in rock engineering practice. Hence, every deterministic analysis performed with this method has a certain degree of uncertainty which cannot be quantified without further considerations. In this chapter a simple method to process uncertain input parameters in geological and geotechnical modelling is presented.
4.2.1 Probabilistic data processing A probabilistic method is used to process distributed (uncertain) input parameters. The method uses the same computational model as described in chapter 4.1. The difference is that the singular values of the input parameters are now replaced by statistical distributions. The results (e.g. lengths of different Behaviour Types along the tunnel axis) are also obtained in terms of statistical distributions. In the proposed method the integration of the output functions is performed with a Monte-Carlo-Simulation. In this simulation the computational model is consecutively calculated various times while in every calculation step (iteration) the input parameter values are varied according to their statistical distribution. The number of iterations must be sufficient to obtain a constant result. The output values are sampled and approximated by another statistical distribution using a best-fit procedure.
Since all results are statistical distributions, their spread can be analysed. This serves to assess the degree of uncertainty, to evaluate tendencies, or to design further investigations. It also can provide a basis for safety considerations or bid price calculations.
4.2.2 Probabilistic implementation of geological conditions
The three-dimensional geological model is used to statistically evaluate the desired input parameters. Usually the model is based on acquired data. Regions between the acquired data are extrapolated taking into consideration the consistency of the model with geological judgment. The model consists of an acquired (known) part and an extrapolated (uncertain) part.
From the acquired data several evaluations can be taken in order to obtain input functions for the probabilistic simulation. For instance, data about length and sequence of rock types in the drill cores, fracturing of the rock mass, correlations between weathering, depth and lithology, can be extracted and form the basis for input distributions. These data are analysed with respect to possible correlations. Additionally, Markov chains of sequences have to be determined. A Markov chain defines the probability of occurrence of the following element based on the type of the present element. Markov elements in this case are different rock types. An example is given in chapter 5.4.3.
During the computational process the distributed input parameters and Markov chains are used to generate rock types and rock mass parameters along the tunnel axis. The described generation technique allows a probabilistic simulation of geological conditions using Monte-Carlo-Simulation techniques. During a Monte-Carlo-Simulation the rock mass model is newly generated in every iteration by the rules described above. The same process can be applied for the generation of faults. Since the parameters thickness, spacing and orientation of faults can be provided as statistical distributions, faults can be located along the tunnel axis. This results in a new fault pattern in every iteration. A detailed example is given in chapter 5. Using this procedure the uncertainty of the geological prediction is taken into account with reasonable effort. Additionally, unfavorable geological conditions may arise which were not obvious before the simulation and the probability of their occurrence can be quantified.
4.2.3 Probabilistic consideration of geotechnical parameters
Once the computational model contains the geological situation, the geotechnical rock mass properties such as the friction angle, cohesion, or Young’s modulus for the current iteration have to be
advance
settl
emen
t [m
]st
ress
/
σ
σZ
V,PR
IM[-]
chainage [D]
chainage [D]
STIFF STIFFSOFT
FIN
AL
SETT
LEM
ENTS
FIN
AL
STR
ESSE
SN
OR
MAL
ISE
D
σ σZ V,PRIM / [-]
MODEL1.1
2/3 E stiff
1/2 E stiff
1/4 E stiff
“normal”
E1>E2
assigned. This can be done using the distributed input parameters defined in the Rock Mass Types. This means that the parameter values of the Rock Mass Types also have to be provided as statistical distributions (Goricki et al. 2003).
Another way of introducing geotechnical parameters is to provide intact rock parameters for each rock type in terms of statistical distributions and assign them according to the current rock type of the calculation segment. The rock mass parameters are then determined taking into account the current fracturing and/or weathering, and the condition of the discontinuities. Based on these combinations the GSI (Hoek et al. 1995, Hoek & Brown 1997, Hoek 1999) can be estimated and rock mass parameters determined for the current calculation segment. The advantage of the second approach is its higher flexibility in the consideration of special rock mass features. For instance, the influence of discontinuity orientation or water presence on strength parameters can be consistently implemented. Furthermore, it allows considering the entire spread of the parameter values according to the determined distributions.
With the described computational model it is possible to take into account the uncertainties of the geological prediction and the spread of the geotechnical parameters. Using this model rock mass characterisation can be easily performed and its reliability quantified.
5 APPLICATION AND CASE STUDY
The presented characterisation procedure has been applied to many tunnel projects in different stages of design as well as during construction. This case study outlines the application of the procedure and the software tool for the tender design of Koralm Base Tunnel, a major tunnel project in Austria. The complete case study is based on the corresponding ground expertise (3G 2004).
5.1 Project description The Koralm Base Tunnel will form part of the Austrian High Speed Railway Network. It links Styria with Carinthia by a planned 32.8 km double-tube with an overburden of about 1200 m at its maximum (Fig.4). Due to the extension of the High Speed Railway Network where the tunnel is one of the core pieces, the travel time from Vienna to Klagenfurt can be reduced from four and a half to three hours (Vavrovsky et al. 2001).
Within the scope of the investigation campaign, three exploratory tunnels are going to be constructed. These tunnels are the exploratory tunnels “Mitterpichling”, and “Paierdorf” on the Carinthian side, and the exploratory tunnel
“Leibenfeld” on the Styrian side of the Koralm massive (Fig. 4). The length of the “Paierdorf” tunnel is about 5.5 km and the maximum overburden is about 700 m. It starts in a depth of about 160 m. The access is provided by the shaft “Paierdorf” with a diameter of 9 m. It is a very challenging project since it explores for a long stretch the conditions of Lavanttal fault zone. In this chapter the investigation and characterisation process is exclusively described for the “Paierdorf” exploratory tunnel which was performed during the tender process, and focuses on the approximated 2 km of the fault zone.
Figure 4. Overview of the Koralm tunnel project including the exploratory tunnels “Mitterpichling”, “Paierdorf”, and “Leibenfeld” (from left to right) and the shaft “Paierdorf” (left) and “Leibenfeld” (right)
5.2 Geological overview The Koralm mountain range is part of the Koriden unit within the Middle-Austroalpine nappe complex of the Eastern Alps. The majority of the Koralm tunnel is located within a polymetamorphe crystalline basement, mainly consisting of different types of gneiss, mica schist, and secondary units including quartzite, amphibolite, eklogite and marble. The Koralm is bounded on both sides by young extensional brittle fault systems. The most important fault system is the Lavanttal fault system located at the western hill slope of the Koralm. This NNW-SSE striking fault system is supposed to be active and generated the Lavanttal valley, a pull-apart basin with a depth of more than 1000 m. This basin is, for the most part, filled with tertiary, fine-grained river and marine sediments.
Deutschlandsberg
St. Paul im Lavanttal
Großer Speikkogel
St. Georgen
Wolfsberg
Klagenfurt Graz
Vienna
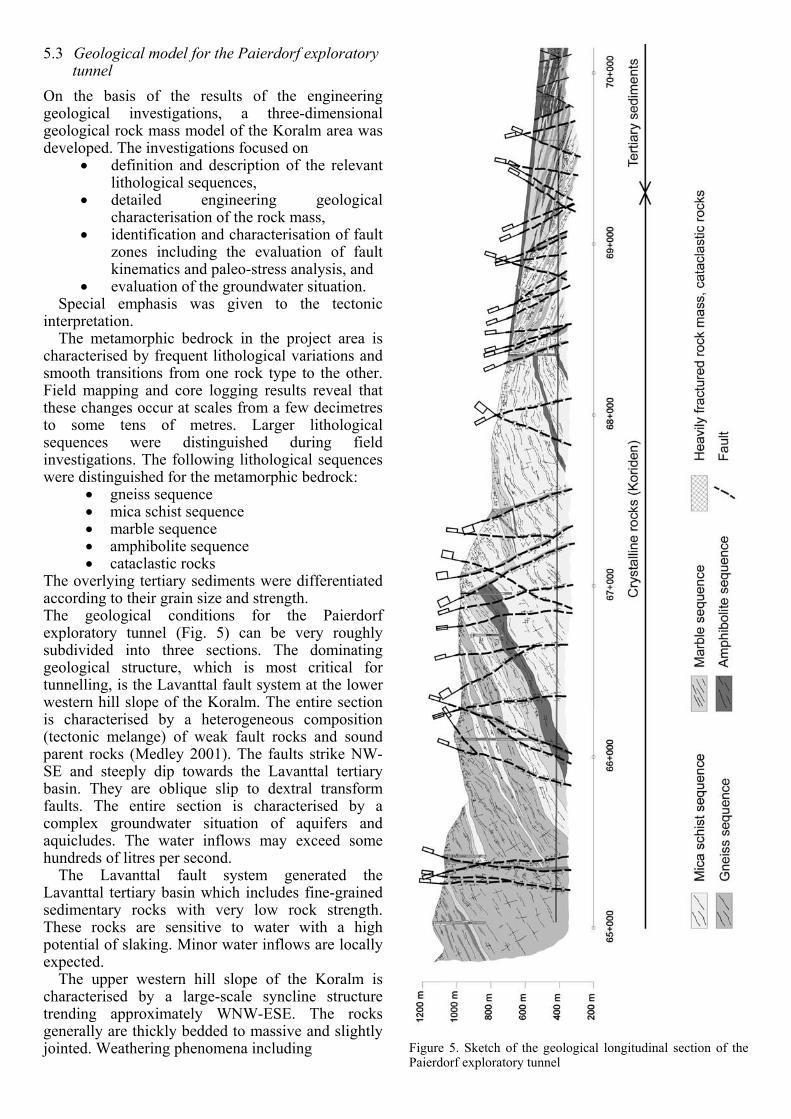
5.3 Geological model for the Paierdorf exploratory tunnel
On the basis of the results of the engineering geological investigations, a three-dimensional geological rock mass model of the Koralm area was developed. The investigations focused on
• definition and description of the relevant lithological sequences,
• detailed engineering geological characterisation of the rock mass,
• identification and characterisation of fault zones including the evaluation of fault kinematics and paleo-stress analysis, and
• evaluation of the groundwater situation. Special emphasis was given to the tectonic
interpretation. The metamorphic bedrock in the project area is
characterised by frequent lithological variations and smooth transitions from one rock type to the other. Field mapping and core logging results reveal that these changes occur at scales from a few decimetres to some tens of metres. Larger lithological sequences were distinguished during field investigations. The following lithological sequences were distinguished for the metamorphic bedrock:
• gneiss sequence • mica schist sequence • marble sequence • amphibolite sequence • cataclastic rocks
The overlying tertiary sediments were differentiated according to their grain size and strength. The geological conditions for the Paierdorf exploratory tunnel (Fig. 5) can be very roughly subdivided into three sections. The dominating geological structure, which is most critical for tunnelling, is the Lavanttal fault system at the lower western hill slope of the Koralm. The entire section is characterised by a heterogeneous composition (tectonic melange) of weak fault rocks and sound parent rocks (Medley 2001). The faults strike NW-SE and steeply dip towards the Lavanttal tertiary basin. They are oblique slip to dextral transform faults. The entire section is characterised by a complex groundwater situation of aquifers and aquicludes. The water inflows may exceed some hundreds of litres per second.
The Lavanttal fault system generated the Lavanttal tertiary basin which includes fine-grained sedimentary rocks with very low rock strength. These rocks are sensitive to water with a high potential of slaking. Minor water inflows are locally expected.
The upper western hill slope of the Koralm is characterised by a large-scale syncline structure trending approximately WNW-ESE. The rocks generally are thickly bedded to massive and slightly jointed. Weathering phenomena including
Figure 5. Sketch of the geological longitudinal section of the Paierdorf exploratory tunnel
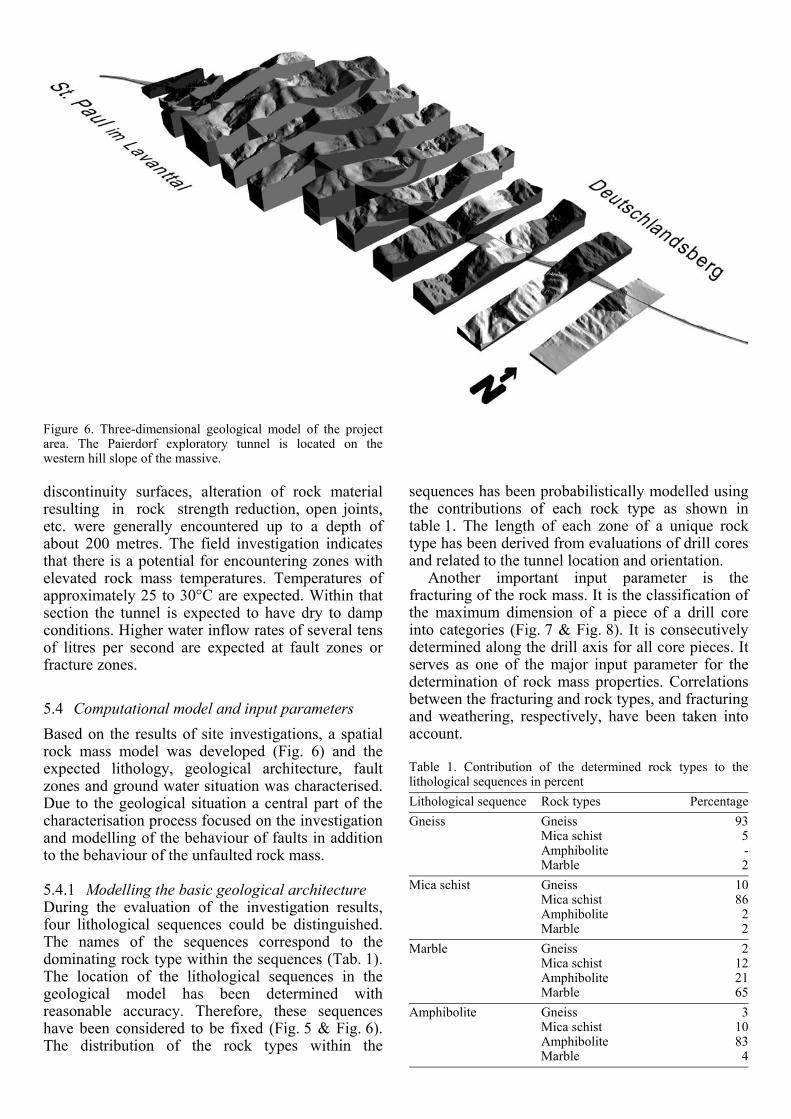
Figure 6. Three-dimensional geological model of the project area. The Paierdorf exploratory tunnel is located on the western hill slope of the massive.
discontinuity surfaces, alteration of rock material resulting in rock strength reduction, open joints, etc. were generally encountered up to a depth of about 200 metres. The field investigation indicates that there is a potential for encountering zones with elevated rock mass temperatures. Temperatures of approximately 25 to 30°C are expected. Within that section the tunnel is expected to have dry to damp conditions. Higher water inflow rates of several tens of litres per second are expected at fault zones or fracture zones.
5.4 Computational model and input parameters Based on the results of site investigations, a spatial rock mass model was developed (Fig. 6) and the expected lithology, geological architecture, fault zones and ground water situation was characterised. Due to the geological situation a central part of the characterisation process focused on the investigation and modelling of the behaviour of faults in addition to the behaviour of the unfaulted rock mass.
5.4.1 Modelling the basic geological architecture During the evaluation of the investigation results, four lithological sequences could be distinguished. The names of the sequences correspond to the dominating rock type within the sequences (Tab. 1). The location of the lithological sequences in the geological model has been determined with reasonable accuracy. Therefore, these sequences have been considered to be fixed (Fig. 5 & Fig. 6). The distribution of the rock types within the
sequences has been probabilistically modelled using the contributions of each rock type as shown in table 1. The length of each zone of a unique rock type has been derived from evaluations of drill cores and related to the tunnel location and orientation.
Another important input parameter is the fracturing of the rock mass. It is the classification of the maximum dimension of a piece of a drill core into categories (Fig. 7 & Fig. 8). It is consecutively determined along the drill axis for all core pieces. It serves as one of the major input parameter for the determination of rock mass properties. Correlations between the fracturing and rock types, and fracturing and weathering, respectively, have been taken into account.
Table 1. Contribution of the determined rock types to the lithological sequences in percent Lithological sequence Rock types Percentage Gneiss Gneiss 93 Mica schist 5 Amphibolite - Marble 2 Mica schist Gneiss 10 Mica schist 86 Amphibolite 2 Marble 2 Marble Gneiss 2 Mica schist 12 Amphibolite 21 Marble 65 Amphibolite Gneiss 3 Mica schist 10 Amphibolite 83 Marble 4
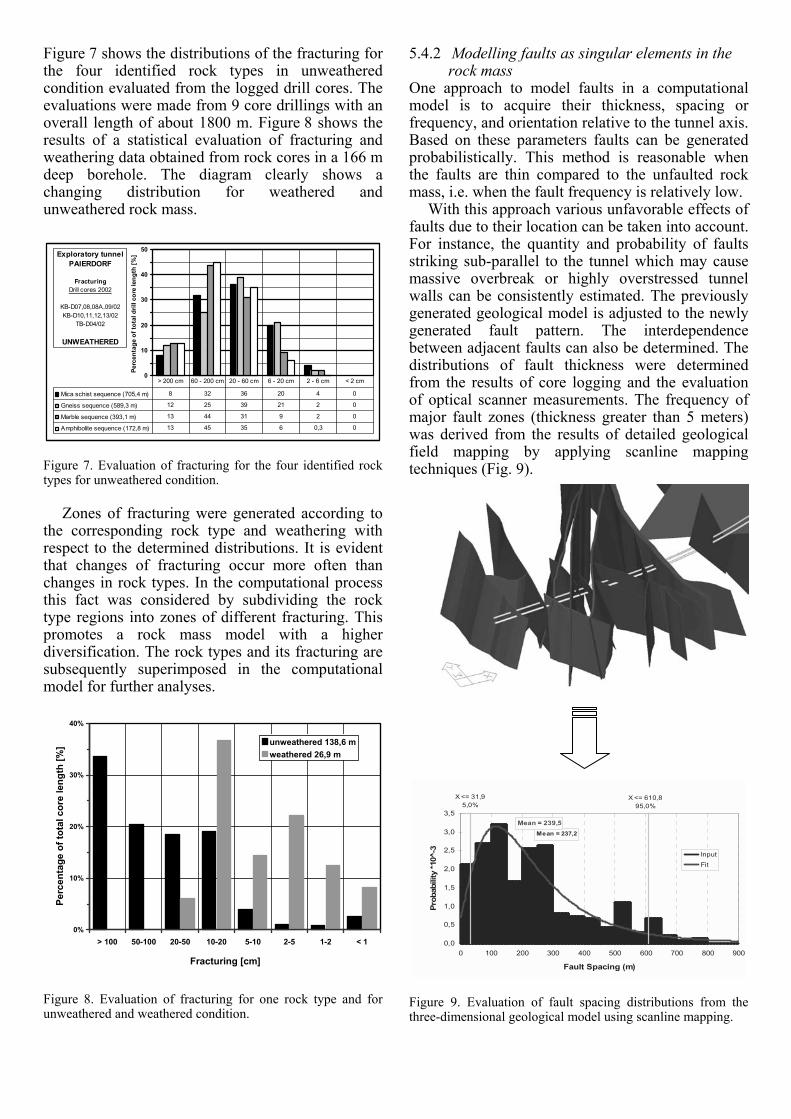
Figure 7 shows the distributions of the fracturing for the four identified rock types in unweathered condition evaluated from the logged drill cores. The evaluations were made from 9 core drillings with an overall length of about 1800 m. Figure 8 shows the results of a statistical evaluation of fracturing and weathering data obtained from rock cores in a 166 m deep borehole. The diagram clearly shows a changing distribution for weathered and unweathered rock mass.
Figure 7. Evaluation of fracturing for the four identified rock types for unweathered condition.
Zones of fracturing were generated according to
the corresponding rock type and weathering with respect to the determined distributions. It is evident that changes of fracturing occur more often than changes in rock types. In the computational process this fact was considered by subdividing the rock type regions into zones of different fracturing. This promotes a rock mass model with a higher diversification. The rock types and its fracturing are subsequently superimposed in the computational model for further analyses.
Figure 8. Evaluation of fracturing for one rock type and for unweathered and weathered condition.
5.4.2 Modelling faults as singular elements in the rock mass
One approach to model faults in a computational model is to acquire their thickness, spacing or frequency, and orientation relative to the tunnel axis. Based on these parameters faults can be generated probabilistically. This method is reasonable when the faults are thin compared to the unfaulted rock mass, i.e. when the fault frequency is relatively low.
With this approach various unfavorable effects of faults due to their location can be taken into account. For instance, the quantity and probability of faults striking sub-parallel to the tunnel which may cause massive overbreak or highly overstressed tunnel walls can be consistently estimated. The previously generated geological model is adjusted to the newly generated fault pattern. The interdependence between adjacent faults can also be determined. The distributions of fault thickness were determined from the results of core logging and the evaluation of optical scanner measurements. The frequency of major fault zones (thickness greater than 5 meters) was derived from the results of detailed geological field mapping by applying scanline mapping techniques (Fig. 9).
Figure 9. Evaluation of fault spacing distributions from the three-dimensional geological model using scanline mapping.
0%
10%
20%
30%
40%
> 100 50-100 20-50 10-20 5-10 2-5 1-2 < 1
Fracturing [cm]
Perc
enta
ge o
f tot
al c
ore
leng
th [%
] unweathered 138,6 mweathered 26,9 m
0
10
20
30
40
50
Mica schist sequence (705,4 m) 8 32 36 20 4 0
Gneiss sequence (589,3 m) 12 25 39 21 2 0
Marble sequence (393,1 m) 13 44 31 9 2 0
Amphibolite sequence (172,8 m) 13 45 35 6 0,3 0
> 200 cm 60 - 200 cm 20 - 60 cm 6 - 20 cm 2 - 6 cm < 2 cm
Exploratory tunnelPAIERDORF
FracturingDrill cores 2002
KB-D07,08,08A,09/02KB-D10,11,12,13/02
TB-D04/02
UNWEATHERED
Perc
enta
ge o
f tot
al d
rill c
ore
leng
th [%
]
Mean = 237,2
Mean = 239,5
X <= 610,895,0%
X <= 31,95,0%
0,0
0,5
1,0
1,5
2,0
2,5
3,0
3,5
0 100 200 300 400 500 600 700 800 900
Fault Spacing (m)
Prob
abili
ty *1
0̂-3 Input
Fit
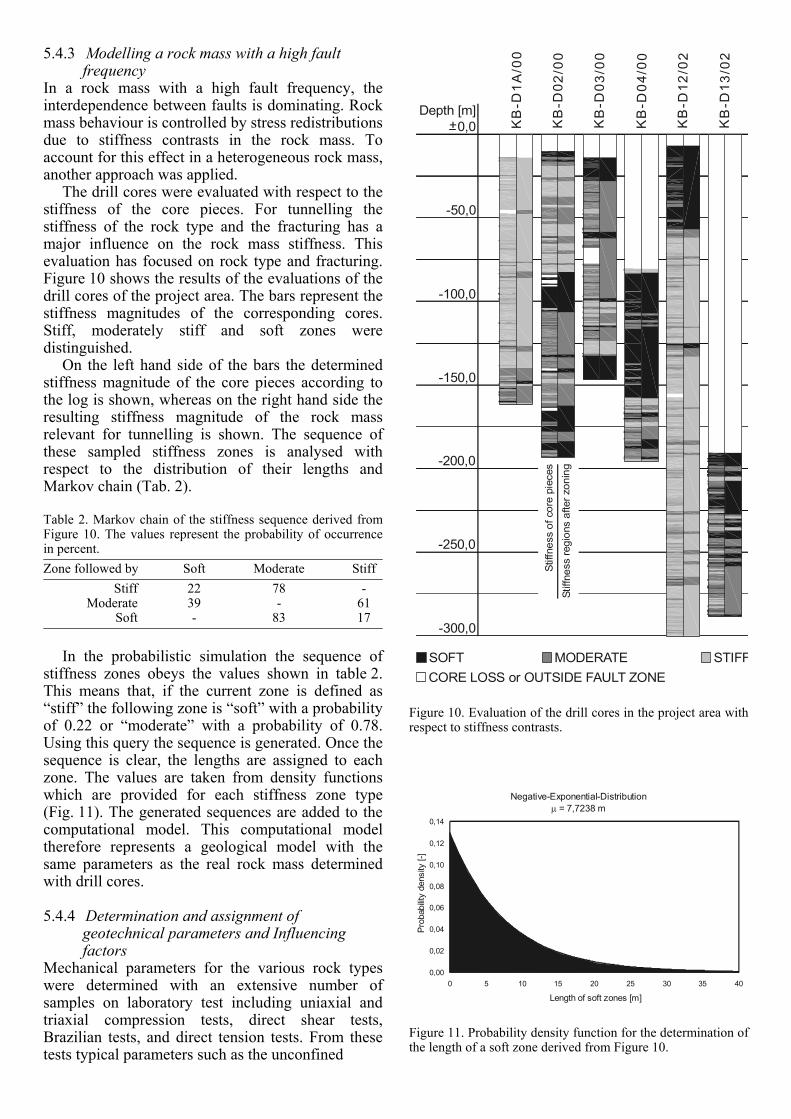
5.4.3 Modelling a rock mass with a high fault frequency
In a rock mass with a high fault frequency, the interdependence between faults is dominating. Rock mass behaviour is controlled by stress redistributions due to stiffness contrasts in the rock mass. To account for this effect in a heterogeneous rock mass, another approach was applied.
The drill cores were evaluated with respect to the stiffness of the core pieces. For tunnelling the stiffness of the rock type and the fracturing has a major influence on the rock mass stiffness. This evaluation has focused on rock type and fracturing. Figure 10 shows the results of the evaluations of the drill cores of the project area. The bars represent the stiffness magnitudes of the corresponding cores. Stiff, moderately stiff and soft zones were distinguished.
On the left hand side of the bars the determined stiffness magnitude of the core pieces according to the log is shown, whereas on the right hand side the resulting stiffness magnitude of the rock mass relevant for tunnelling is shown. The sequence of these sampled stiffness zones is analysed with respect to the distribution of their lengths and Markov chain (Tab. 2).
Table 2. Markov chain of the stiffness sequence derived from Figure 10. The values represent the probability of occurrence in percent. Zone followed by Soft Moderate Stiff Stiff 22 78 - Moderate 39 - 61 Soft - 83 17
In the probabilistic simulation the sequence of
stiffness zones obeys the values shown in table 2. This means that, if the current zone is defined as “stiff” the following zone is “soft” with a probability of 0.22 or “moderate” with a probability of 0.78. Using this query the sequence is generated. Once the sequence is clear, the lengths are assigned to each zone. The values are taken from density functions which are provided for each stiffness zone type (Fig. 11). The generated sequences are added to the computational model. This computational model therefore represents a geological model with the same parameters as the real rock mass determined with drill cores.
5.4.4 Determination and assignment of geotechnical parameters and Influencing factors
Mechanical parameters for the various rock types were determined with an extensive number of samples on laboratory test including uniaxial and triaxial compression tests, direct shear tests, Brazilian tests, and direct tension tests. From these tests typical parameters such as the unconfined
Figure 10. Evaluation of the drill cores in the project area with respect to stiffness contrasts.
Figure 11. Probability density function for the determination of the length of a soft zone derived from Figure 10.
-50,0
-100,0
-150,0
-200,0
-250,0
-300,0
0,0+Depth [m]
KB
-D1
A/0
0
KB
-D0 2
/00
KB
-D0 3
/00
KB
- D0
4/0
0
KB
- D12
/02
KB
-D1 3
/02
SOFT MODERATE STIFFCORE LOSS or OUTSIDE FAULT ZONE
Stiff
ness
of c
ore
piec
es
Stiff
ness
regi
ons
afte
r zon
ing
Negative-Exponential-Distributionµ = 7,7238 m
0,00
0,02
0,04
0,06
0,08
0,10
0,12
0,14
0 5 10 15 20 25 30 35 40
Length of soft zones [m]
Prob
abilit
yde
nsity
[-]
compressive strength (UCS), mi value, cohesion, friction angle, the Young’s modulus, etc., were determined. Due to the extensive number of tests it was possible to statistically evaluate the results and provide statistical distributions as input parameters for the intact rock.
In the probabilistic simulation the parameters are assigned to each calculation segment according to the probability function for the mechanical parameter of the corresponding rock type. Correlations between parameters or other boundary conditions have to be considered. For instance, soft zones have to be linked with a highly fractured rock mass or a rock type with a low Young’s modulus.
Based on the parameter combination of a calculation segment a GSI has been assigned to determine the rock mass properties. The GSI was determined based on a combination of fracturing, weathering, and discontinuity condition.
The Influencing Factors were assigned according to the geological model. The magnitude and orientation of the primary stress was derived from the overburden, the tectonic history, and hydraulic fracturing in situ tests. This led to the estimation of high lateral stress in the part of the tunnel with high overburden, and, to a moderate lateral stress level in the western periphery of the Koralm (Lavanttal) due to the extensional tectonic history. Other influencing factors were analogously assigned to the approach given in previous chapters.
5.5 Evaluation of Rock Mass Behaviour With the computational model and the described input parameters, a Monte-Carlo-Simulation with 5000 iterations was performed. The calculation segments were evaluated in order to determine the most unfavorable rock mass behaviour using the calculation models described in chapter 4.1.2. The rock mass behaviours were classified, based on predefined delimiting criteria, into Behaviour Types (Tab. 3).
Table 3. Behaviour Types defined in ÖGG (2001). A detailed description is given in Goricki (2003). Number Behaviour Type
1 Stable 2 Discontinuity controlled block failure 3 Shallow stress induced failure 4 Deep seated stress induced failure 5 Rock burst 6 Buckling failure 7 Shear failure under low confining pressure 8 Ravelling ground 9 Flowing ground 10 Swelling 11 Frequently changing behaviour
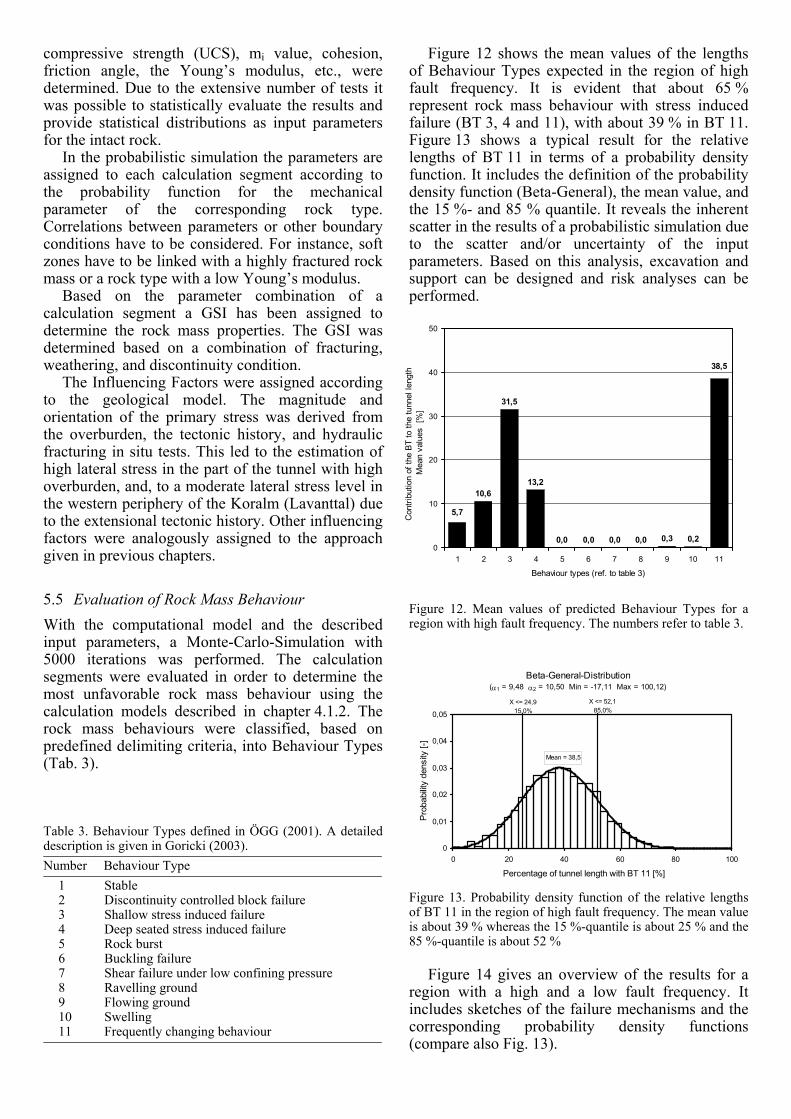
Figure 12 shows the mean values of the lengths of Behaviour Types expected in the region of high fault frequency. It is evident that about 65 % represent rock mass behaviour with stress induced failure (BT 3, 4 and 11), with about 39 % in BT 11. Figure 13 shows a typical result for the relative lengths of BT 11 in terms of a probability density function. It includes the definition of the probability density function (Beta-General), the mean value, and the 15 %- and 85 % quantile. It reveals the inherent scatter in the results of a probabilistic simulation due to the scatter and/or uncertainty of the input parameters. Based on this analysis, excavation and support can be designed and risk analyses can be performed.
Figure 12. Mean values of predicted Behaviour Types for a region with high fault frequency. The numbers refer to table 3.
Figure 13. Probability density function of the relative lengths of BT 11 in the region of high fault frequency. The mean value is about 39 % whereas the 15 %-quantile is about 25 % and the 85 %-quantile is about 52 %
Figure 14 gives an overview of the results for a
region with a high and a low fault frequency. It includes sketches of the failure mechanisms and the corresponding probability density functions (compare also Fig. 13).
Beta-General-Distribution(α1 = 9,48 α2 = 10,50 Min = -17,11 Max = 100,12)
Mean = 38,5
X <= 52,185,0%
X <= 24,915,0%
0
0,01
0,02
0,03
0,04
0,05
0 20 40 60 80 100
Percentage of tunnel length with BT 11 [%]
Pro
babi
lity
dens
ity [-
]
10,6
31,5
13,2
0,0 0,0 0,0 0,0 0,3 0,2
38,5
5,7
0
10
20
30
40
50
1 2 3 4 5 6 7 8 9 10 11
Behaviour types (ref. to table 3)
Con
tribu
tion
of th
e BT
to th
e tu
nnel
leng
th
Mea
n va
lues
[%
]
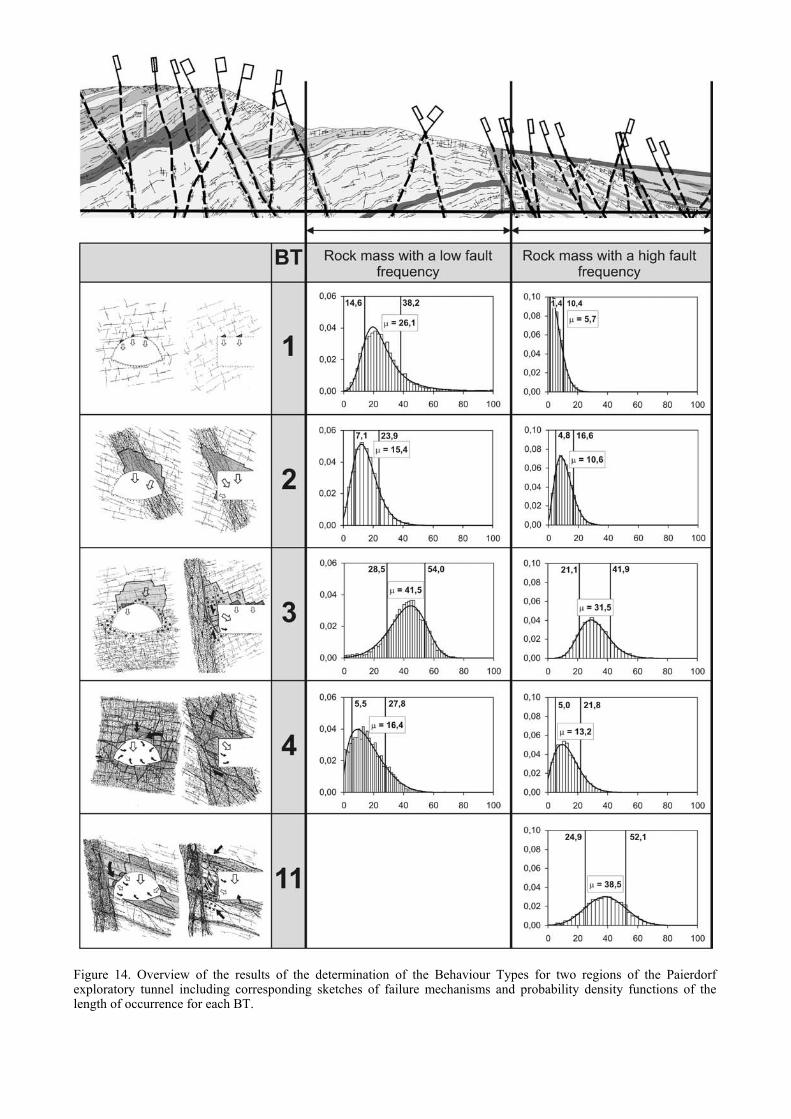
Figure 14. Overview of the results of the determination of the Behaviour Types for two regions of the Paierdorf exploratory tunnel including corresponding sketches of failure mechanisms and probability density functions of the length of occurrence for each BT.
According to the Austrian Guideline (ÖGG 2001) the obtained Behaviour Types have to be verbally and graphically described. The descriptions must include specifications about the involved Rock Mass Types, the primary stress condition, orientation of the main discontinuity sets relative to the excavation, the ground water situation, the excavation shape, and the dominating failure mechanisms, behaviour at excavation, breakage, long-term behaviour and the estimation of the final displacement magnitude.
6 SUMMARY AND CONCLUSION
A procedure has been presented to consistently determine the rock mass behaviour in the geomechanical design process. The requirements on the geological investigation and the applied methods have been discussed. A general procedure for rock mass characterisation and determination of excavation and support has been presented. It includes the determination of Rock Mass Types, Behaviour Types, the System Behaviour, and excavation classes. Subsequently a computational model has been described which follows the proposed general procedure in the determination of Behaviour Types. The computational model promotes probabilistic simulations including the consideration of uncertainties in the geological model and geotechnical parameters. A case study of a rock mass characterisation for the tender design of a tunnel has been presented. The establishment of a geological model, the derivation of statistical input parameters and the quality and quantity of the results have been extensively described.
The computational model provides flexible and project-specific evaluation possibilities and can be easily extended to determine excavation and support on a probabilistic basis which has been described by Großauer et al. (2003). Furthermore, it is a simple method to determine the risk due to uncertainties in the rock mass. This serves as a basis for risk analyses and cost estimations (Goricki et al. 2002a, Goricki et al. 2002b).
REFERENCES
Feder, G. & Arwanitakis, M. 1976. Zur Gebirgsmechanik ausbruchsnaher Bereiche tiefliegender Hohlraumbauten. Berg- und Hüttenmännische Monatshefte 4: 103-117. Springer Verlag, Wien
Goodman, R.E. & Shi, G-H. 1985. Block Theory and its Application to Rock Engineering. Prentice-Hall, New Jersey
Goricki A., Schubert W., Fuchs R. & Steidl A. 2001. Geotechnical assessment of the route corridor. ISRM Reg. Symp. Eurock 2001, Espoo, Finland
Goricki A., Schick K.J. & Steidl A. 2002a Quantification of the Geotechnical and Economic Risk in Tunneling.
Probabilistics in GeoTechnics: Technical and Economic Risk Estimation, Graz, Austria
Goricki, A., Schubert, W., Steidl, A. & Vigl, A. 2002b Geotechnical Risk Assessment as the Basis for Cost Estimates in Tunneling. Felsbau 20(5), 24-30
Goricki, A. 2003. Classification of Rock Mass Behaviour based on a Hierarchical Rock Mass Characterisation for the Design of Underground Structures. Doctoral Thesis, Institute for Rock Mechanics and Tunnelling, Graz University of Technology
Goricki, A., Pötsch, M. & Schubert, W. 2003. Probabilistic Determination of Rock Mass Behaviour and Support of Tunnels (based on the Austrian Guideline for the Geomechanical Design of Conventional Tunnels). ISRM 2003–Technology roadmap for rock mechanics, South African Institute of Mining and Metallurgy: 405-408
Großauer, K. 2001. Tunnelling in Heterogeneous Ground – Numerical Investigations of Stresses and Displacements. Diploma Thesis, Institute for Rock Mechanics and Tunnelling, Graz University of Technology
Großauer, K., Riedmüller, G., Schubert, W. & Goricki, A. 2003. Procedure to compare tunnel alternatives and construction methods for the Semmering base tunnel project. Soil and Rock America 2003, 39th U.S. Rock Mech. Symp., Cambridge, USA, 2373-2378
Hoek, E., Kaiser, P.K. & Bawden, W.F. 1995. Support of Underground Excavations in Hard Rock. Balkema, Rotterdam
Hoek, E. & Brown, E.T. 1997. Practical Estimates of Rock Mass Strength. International Journal of Rock Mechanics and Mining Sciences 34(8), 1165-1186.
Hoek, E. 1999. Putting numbers to geology – an engineer´s viewpoint. Felsbau 17 (3), 139 – 151
Karzulovic, A.L. 1988. The Use of Keyblock Theory in the Design of Linings and Supports for Tunnels. Dissertation, University of California, Berkeley
Medley, E.W. 2001. Orderly Characterisation of Chaotic Franciscan Melange. Felsbau 19(4), 20-33
ÖGG Österreichische Gesellschaft für Geomechanik. 2001. Richtlinie für die Geomechanische Planung von Untertagebauarbeiten mit zyklischem Vortrieb. Salzburg
Pötsch, M. 2002. Influence of the Three-Dimensional Stress Condition at the Tunnel Face on the Stability of Removable Blocks. Diploma Thesis, Institute for Rock Mechanics and Tunnelling, Graz University of Technology
Riedmüller G. 1997. Engineering Geologist's Point of View. Felsbau 15/3, 167-170
Riedmüller G: 1998. The Importance of Geological Field Investigation for the Design of Tunnels. Felsbau 16/5, 284-288
Riedmüller G. & Schubert W. 1999. Tunneling in Difficult Ground - From Investigation to Completion. 4. Slovenski Kongres - O Cestah in Prometu, Portoroz, 26.-28. oktobra 1998
Riedmüller G. & Schubert W. 2001. Project and rock mass specific investigation for tunnels. ISRM Reg. Symp. Eurock 2001, Espoo, Finland.
Schubert, W. 1996. Dealing with squeezing conditions in alpine tunnels. Rock Mechanics and Rock Engineering 29(3): 145-153.
Schubert, W. & Riedmüller, G. 1997. Influence of Faults on Tunnelling. Felsbau 15(6): 483-488.
Schubert, W., Goricki, A., Button, E.A., Riedmüller, G., Pölsler, P., Steindorfer, A. & Vanek, R. 2001. Excavation and Support Determination for the Design and Construction of Tunnels. In: P. Särkkä, P. Eloranta (eds.), Rock Mechanics a Challenge for Society, ISRM Reg. Symp. Eurock 2001, Espoo, Finland, 383 -388
Schweiger, H.F., Peschl, G., Pöttler, R. & Thurner, R. 2002. Verknüpfung von Probabilistik und Numerik im Tunnelbau. Felsbau 20(5): 39-47
Steidl A., Goricki A., Schubert W. & Riedmüller G. 2001. Geological and Geotechnical Ground Characterisation for the Koralm Tunnel Route Selection. Felsbau 19/6, 14-21
Steidl A. 2003. Engineering geological investigation of Quaternary faulting and deep-seated gravitational slope deformation mechanics – with reference to the Kaponig Pilot Tunnel, Mallnitz, Austria. Doctoral Thesis, Institute for Engineering Geology and Applied Mineralogy, Graz University of Technology.
Thurner, R. 2000. Probabilistische Untersuchungen in der Geotechnik mittels deterministischer Finite Elemente-Methode. Doctoral Thesis, Institute for Soil Mechanics and Foundation Engineering, Graz University of Technology
Vavrovsky, G.M., Schneider, K.M. & Harer G. 2001 Koralmbahn – A New Railway Line in Southern Austria. Felsbau 19(6), 8-12
3G Gruppe Geotechnik Graz ZT GmbH. 2004. Geological and geotechnical report for the tender design of the Paierdorf Exploratory Tunnel. Unpublished.