Embed Size (px)
Citation preview
Accep
ted M
anus
cript
Not Cop
yedit
ed
1
Deterioration modeling of steel components in support of collapse prediction
of steel moment frames under earthquake loading
Dimitrios G. Lignos, A.M. ASCE
1, Helmut Krawinkler, M. ASCE
2
Abstract: Reliable collapse assessment of structural systems under earthquake loading requires analytical
models that are able to capture component deterioration in strength and stiffness. For calibration and
validation of these models a large set of experimental data is needed. This paper discusses the
development of a database on experimental data of steel components and the use of this database for
quantification of important parameters that affect the cyclic moment-rotation relationship at plastic hinge
regions in beams. Based on information deduced from the steel component database, empirical
relationships for modeling of pre-capping plastic rotation, post-capping rotation and cyclic deterioration
for beams with reduced beam section (RBS) and beams other than RBS are proposed. Quantitative
information is also provided for modeling of the effective yield strength, post-yield strength ratio, residual
strength, and ductile tearing of steel components subjected to cyclic loading.
Keywords: Component deterioration; steel database; steel moment connections; sidesway collapse;
moment-rotation relationships; residual strength; deterioration models; reduced beam section
Introduction
1 Assistant Professor, Dept. Of Civil Engineering and Applied Mechanics, McGill University, Montreal, QC,
H3A2K6 2 Professor Emeritus, Dept. Of Civil and Environmental Engineering, Stanford University, Stanford CA 94305
Journal of Structural Engineering. Submitted February 16, 2010; accepted December 27, 2010; posted ahead of print December 30, 2010. doi:10.1061/(ASCE)ST.1943-541X.0000376
Copyright 2010 by the American Society of Civil Engineers
Accep
ted M
anus
cript
Not Cop
yedit
ed
2
Significant progress has been made in recent years in methods to predict collapse under earthquake
loading (e.g., Ibarra et al. 2002; Vamvatsikos and Cornell 2002; Ibarra and Krawinkler 2005; Haselton
and Deierlein 2007; Zareian and Krawinkler 2009) and to develop engineering approaches for collapse
protection (FEMA P695 2009; ATC-76-1 2009; Zareian et al. 2010). The collapse mode addressed in
these studies is associated with sidesway instability in which P-Delta effects accelerated by component
deterioration fully offset the first order story shear resistance and dynamic instability occurs. One of the
main challenges has been, and still is, the ability to reliably predict deterioration properties of structural
components and to incorporate these properties into analysis tools.
Experimental studies have shown that the hysteretic behavior of structural components depends
upon numerous structural parameters that affect the deformation and energy dissipation characteristics,
leading to the development of a wide range of versatile deterioration models. A summary of various
hysteresis models developed during the 1960s and 70s for reinforced concrete elements is presented in
Otani (1981). More recently, Baber and Noori (1985), Casciati (1989), and Reinhorn et al. (1995)
modified the widely known Bouc-Wen model (1967, 1980) to incorporate component deterioration. Song
and Pincheira (2000) developed a model that simulates post-capping behavior but does not incorporate
cyclic strength deterioration. Sivaselvan and Reinhorn (2000, 2006), based on earlier models by Iwan
(1966) and Mostaghel (1999), developed a smooth hysteretic model with stiffness and strength
degradation and pinching characteristics, derived from inelastic material behavior. More recently, Ibarra
et al. (2005) developed an energy-based phenomenological deterioration model that captures most
important modes of component deterioration.
Reliable deterioration modeling of structural components requires validation of analytical models
described earlier with experimental data from components that have been subjected to various loading
histories. Specific databases of experimental data are available for this purpose for reinforced concrete
components [e.g. PEER database, (Berry et al. 2004), http://nisee.berkeley.edu/spd] and in part for steel
components (SAC database, http://www.sacsteel.org/connections/). The latter database does not include
Journal of Structural Engineering. Submitted February 16, 2010; accepted December 27, 2010; posted ahead of print December 30, 2010. doi:10.1061/(ASCE)ST.1943-541X.0000376
Copyright 2010 by the American Society of Civil Engineers

Accep
ted M
anus
cript
Not Cop
yedit
ed
3
cyclic moment-rotation hysteresis diagrams, which are much needed for the development of deterioration
parameters of steel components.
In this paper the primary focus is to provide information for the missing aspects of comprehensive
modeling of the deterioration characteristics of structural steel components based on a recently developed
database that includes comprehensive data of more than 300 experiments on steel wide flange beams
(Lignos and Krawinkler 2007, 2009). The experimental data is used to calibrate deterioration parameters
of the phenomenological deterioration model summarized in the next section, and to develop relationships
that associate parameters of this deterioration model with geometric and material properties that control
deterioration in structural steel components.
Deterioration model
The deterioration model developed by Ibarra et al. (2005), referred to as Ibarra-Krawinkler (IK) model,
forms the basis of the deterioration modeling discussed in this paper. This model was modified by Lignos
and Krawinkler (2009) to address asymmetric component hysteretic behavior including different rates of
cyclic deterioration in the two loading directions, residual strength, and incorporation of an ultimate
deformation u at which the strength of a component drops to zero because of unstable crack growth and
fracture.
The modified IK model establishes strength bounds based on a monotonic backbone curve (see Fig.
1a) and a set of rules that define the characteristics of hysteretic behavior between the bounds (see Fig.
1b). For a bilinear hysteretic response three modes of cyclic deterioration are defined with respect to the
backbone curve (basic strength, post-capping strength, and unloading/reloading stiffness deterioration) as
illustrated in Fig. 1b. The model can be applied to any force-deformation relationship, but in this
discussion is described in terms of moment and rotation quantities as defined in Fig.1. The backbone
curve is defined by three strength parameters [ y =effective yield moment, c = capping moment
Journal of Structural Engineering. Submitted February 16, 2010; accepted December 27, 2010; posted ahead of print December 30, 2010. doi:10.1061/(ASCE)ST.1943-541X.0000376
Copyright 2010 by the American Society of Civil Engineers
Accep
ted M
anus
cript
Not Cop
yedit
ed
4
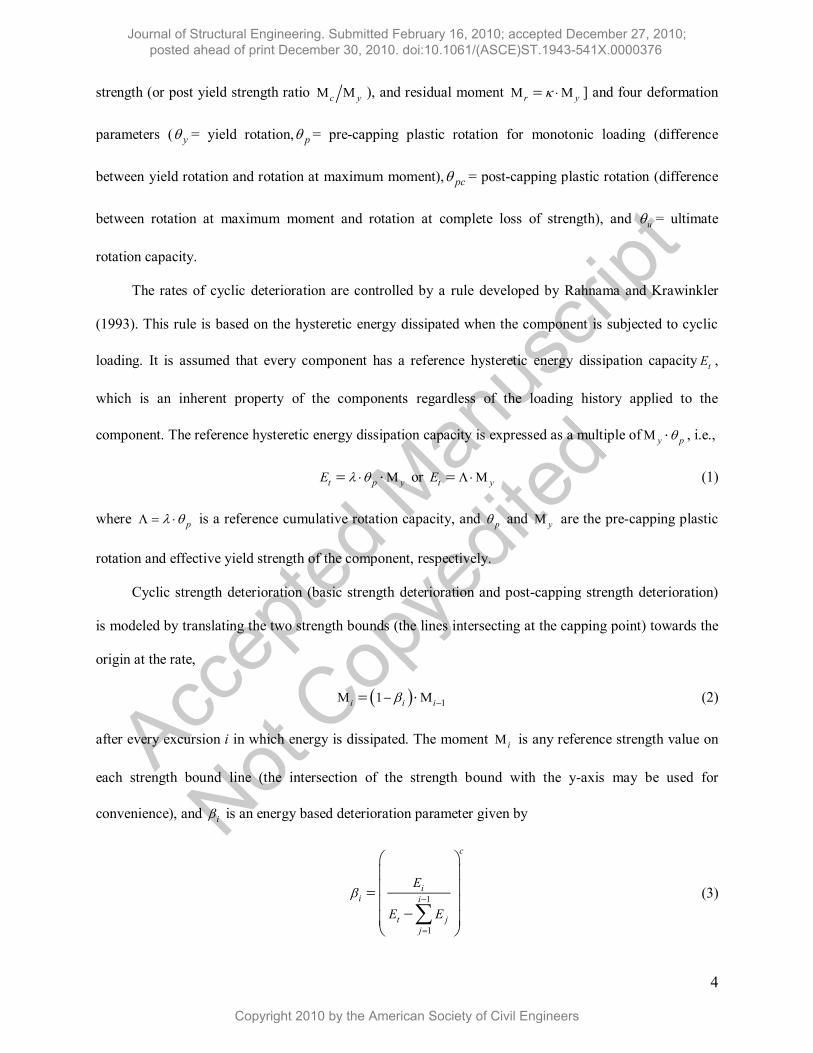
strength (or post yield strength ratio c y ), and residual moment r y ] and four deformation
parameters ( y = yield rotation, p = pre-capping plastic rotation for monotonic loading (difference
between yield rotation and rotation at maximum moment), pc = post-capping plastic rotation (difference
between rotation at maximum moment and rotation at complete loss of strength), and u = ultimate
rotation capacity.
The rates of cyclic deterioration are controlled by a rule developed by Rahnama and Krawinkler
(1993). This rule is based on the hysteretic energy dissipated when the component is subjected to cyclic
loading. It is assumed that every component has a reference hysteretic energy dissipation capacity tE ,
which is an inherent property of the components regardless of the loading history applied to the
component. The reference hysteretic energy dissipation capacity is expressed as a multiple of y p , i.e.,
t p yE or t yE (1)
where p is a reference cumulative rotation capacity, and p and y are the pre-capping plastic
rotation and effective yield strength of the component, respectively.
Cyclic strength deterioration (basic strength deterioration and post-capping strength deterioration)
is modeled by translating the two strength bounds (the lines intersecting at the capping point) towards the
origin at the rate,
11i i i (2)
after every excursion i in which energy is dissipated. The moment i is any reference strength value on
each strength bound line (the intersection of the strength bound with the y-axis may be used for
convenience), and i is an energy based deterioration parameter given by
1
1
c
ii i
t j
j
E
E E
(3)
Journal of Structural Engineering. Submitted February 16, 2010; accepted December 27, 2010; posted ahead of print December 30, 2010. doi:10.1061/(ASCE)ST.1943-541X.0000376
Copyright 2010 by the American Society of Civil Engineers

Accep
ted M
anus
cript
Not Cop
yedit
ed
5
where iE is the hysteretic energy dissipated in excursion i, jE is the total energy dissipated in past
excursions, tE is the reference energy dissipation capacity from Eq. (1), and c is an empirical parameter,
usually taken as 1.0. Different rates of deterioration in the positive and negative direction, such as in the
case of a beam with a composite slab, can be accommodated by multiplying the right hand side of Eq. (3)
by a parameter 0 < /
D
≤ 1, which slows down the rate of deterioration in one direction and results in
two different values of in each direction (see Lignos and Krawinkler 2009).
The same concepts apply to modeling of unloading stiffness deterioration, i.e., the deteriorated
stiffness after excursion i is given by
11i i iK K (4)
Different rates of deterioration for each cyclic deterioration mode can be incorporated by using
different values for each mode. Extensive calibration studies (Lignos and Krawinkler 2007, 2009) have
shown that for steel components this refinement does not lead to significant model improvements. For
more details on this deterioration model the reader is referred to Ibarra et al. (2005) and Lignos and
Krawinkler (2009).
For each experiment of the database discussed in the next section, parameters of the modified IK
model were determined by matching the digitized moment-rotation response to a hysteretic response
controlled by the backbone curve shown in Fig. 1 and a cyclic deterioration parameter . A combination
of engineering mechanics concepts and visual observations is employed to select appropriate parameters
and pass judgment on satisfactory matching. For this purpose an interactive Matlab based tool was
developed to automate the calibration process (Lignos and Krawinkler 2009). An example of a
satisfactory calibration of the modified IK deterioration model is shown in Fig. 2 for two steel beams with
and without composite action. Ma et al. (2006), Yun et al. (2007) have used system identification and self
learning simulation for calibration of degrading systems with respect to experimental data. However, the
use of visual observation and judgment (in addition to mechanics concepts) was found to be preferable to
attempts to use rigorous approaches such as a nonlinear least square optimization technique (Dennis
Journal of Structural Engineering. Submitted February 16, 2010; accepted December 27, 2010; posted ahead of print December 30, 2010. doi:10.1061/(ASCE)ST.1943-541X.0000376
Copyright 2010 by the American Society of Civil Engineers
Accep
ted M
anus
cript
Not Cop
yedit
ed
6
1977) and neural networks (Medsker and Jain 2000). The former was partially unsuccessful because of
the large number of variables, and the latter was found to be unreliable because the size of the steel
database was too small to train the network.
The modified Ibarra Krawinkler deterioration model has been implemented in DRAIN-2DX
(Prakash et al. 1993) and Open System for Earthquake Engineering Simulation (OpenSees 2010) analysis
software. Collapse prediction of steel moment frames, which accounts for component deterioration based
on the model parameters discussed in this publication, has been validated through comparisons with
recent small and full scale shaking table collapse tests (Lignos and Krawinkler 2009; Lignos et al. 2010a,
2010b).
A new database for deterioration modeling of steel components
The missing aspect of comprehensive modeling of deterioration characteristics of structural components
is the availability of relationships that associate parameters of deterioration models, such as the ones
discussed in the previous section, with geometric and material properties and detailing criteria that control
deterioration in actual structural elements. In order to provide information for deterioration model
parameters in support of collapse assessment of steel moment resisting frames, a data collection of
component tests is needed in a consistent format that permits validation and calibration of deterioration
models. For this purpose, three databases have been developed [(1) wide flange beams, (2) steel tubular
sections and (3) concrete beams. The focus of this paper is in the first one. More information about the
other two databases can be found in Lignos and Krawinkler (2009, 2010).
The steel database includes steel W-sections (mostly beams but also a few columns from Newell
and Uang 2006). At this stage of development the steel W-section database includes more than 300
specimens. The complete set of data together with comprehensive documentation can be downloaded
through the Network for Earthquake Engineering Simulation (NEES) Central repository (available from
https://nees.org/warehouse/project/84).
Journal of Structural Engineering. Submitted February 16, 2010; accepted December 27, 2010; posted ahead of print December 30, 2010. doi:10.1061/(ASCE)ST.1943-541X.0000376
Copyright 2010 by the American Society of Civil Engineers

Accep
ted M
anus
cript
Not Cop
yedit
ed
7
The database contains data in the following three categories: (1) metadata [ includes (a) distinction
based on configuration of beam-to-column subassembly and test setup; (b) connection type, (c) measured
material properties of beam and column components, (d) slab details, (e) report excerpts that contain a
qualitative summary for the individual tests]; (2) reported results (measurements and observations as
reported in test documentation, including digitized hysteretic load displacement response, moment-
rotation response and panel zone shear force –distortion response (if reported); and (3) deduced data
(information deduced from metadata and reported data for the purpose of calibration of deterioration
models).
The steel W-section database documents experimental data from tests that have been conducted on
beam-to-column subassemblies in which inelastic deformations are primarily concentrated in flexural
plastic hinge regions of W (or H) sections. The primary deterioration mode of the steel components that
develop a plastic hinge is local and/or lateral torsional buckling. Several cases in which components fail
in a brittle mode (e.g., fracture around weldments), and are referred as non-ductile, are included in the
database but are not part of any regression analysis discussed later in this paper since emphasis is on
modern connections that are currently used in engineering practice. Various types of beam-to-column
connections are employed in the test specimens, with the connection type clearly identified in each entry
of the database. About eighty of the specimens have “reduced beam sections” (RBS) in which plastic
hinges develop away from the beam-to-column connection.
Cyclic response data of many of the more recent experiments were received from researchers in
digitized format. However, more than 40 percent of the cyclic response data, primarily from older
experiments, were received in paper format. Force-deformation responses of these tests had to be
manually digitized from research reports. To facilitate this effort an object-oriented digitization software
called Digitizer was developed by Lignos and Krawinkler (2009) that provides all the digital data of
interest.
In the evaluation of modeling parameters presented in the subsequent sections, the data of the W-
section database are subdivided into RBS data and other-than-RBS data. The latter contained results from
Journal of Structural Engineering. Submitted February 16, 2010; accepted December 27, 2010; posted ahead of print December 30, 2010. doi:10.1061/(ASCE)ST.1943-541X.0000376
Copyright 2010 by the American Society of Civil Engineers
Accep
ted M
anus
cript
Not Cop
yedit
ed
8
tests of various beam-to-column connections in which a plastic hinge in the beam developed at or near the
column face and the pertinent model parameters could be quantified with confidence. Tests in which the
connection type clearly affected plastic hinge behavior, such as fracture at beam-to-column weldments or
at welded flange plates, were eliminated from consideration. Thus, the “other-than-RBS” connection
types used in the evaluation reflect general plastic hinge behavior in beams and not behavior of individual
connection types. For individual connection types the number of tests is relatively small and the trends are
not sufficiently clear to justify parameter quantification based on connection type. For the same reason
only beams without a slab are considered in this evaluation. With these limitations the focus is on
quantification of modeling parameters for moment-rotation relationships with symmetric hysteretic
response characteristics. The emphasis in the following discussion is on the deformation parameters p ,
pc , and , followed by a brief discussion on the modeling parameters y , c y , , and u .
Trends for deformation modeling parameters
This section illustrates trends that show the dependence of modeling parameters ( p , pc , and ) on
selected geometric properties of steel W sections. Trends are illustrated by plotting data points of a single
model parameter against a pertinent geometric parameter. The information presented in the plots (see Fig.
3 to 6) is obtained from calibrations in which the parameters of the modified IK deterioration model are
matched to the experimental moment-rotation relationships of the W-sections steel database (e.g. see Fig.
2). A regression line is included in the individual plots to illustrate the overall trends for the modeling
parameter, whenever the coefficient of determination, 2
R , is larger than 0.1. The parameter 2
R provides
insight into the “goodness” of linear fit assuming that each one of the geometric parameters can be treated
as an independent random variable ignoring the correlation between various geometric parameters. The
linear regression lines serve only to illustrate trends; they are not presented for quantitative evaluation of
data. The development of multivariate regression equations that account for correlations of geometric and
Journal of Structural Engineering. Submitted February 16, 2010; accepted December 27, 2010; posted ahead of print December 30, 2010. doi:10.1061/(ASCE)ST.1943-541X.0000376
Copyright 2010 by the American Society of Civil Engineers

Accep
ted M
anus
cript
Not Cop
yedit
ed
9
material parameters in the quantification of modeling parameters is discussed later in this paper. Trends
for the following four data sets are evaluated:
1. Beams with other-than-RBS connections and depth 102mm (4”) d 914mm (36”) (data set 1)
2. Beams with RBS connections and depth 457mm (18”) d 914mm (36”) (data set 2)
3. Beams with other-than-RBS connections and depth d 533mm (21”) (data set 3)
4. Beams with RBS connections and depth d 533mm (21”) (data set 4)
Data set (1) contains experiments on small sections, which are useful to observe trends but conceivably
de-emphasize trends for the sizes of sections used in engineering practice to design a steel moment
resisting frame in a seismic region. This is why we have generated data sets (3) and (4), which are subsets
that contain only beams with d 533mm (21”). However, for beams with RBS there are no tests
available with d 457mm (18”) hence data sets (2) and (4) do not differ by much. Only a few selected
plots are presented in this paper. A detailed discussion of trends of component deterioration parameters
with respect to geometric and material parameters is presented in Lignos and Krawinkler (2009).
Statistical information on parameters p , pc and
Cumulative distribution functions, CDFs, for p , pc and as obtained from the four data sets are shown
in Fig. 3. Each plot shows CDFs for other-than-RBS and RBS sections. The CDFs reveal general
statistical characteristics but do not display dependencies on individual properties. This information is
relevant for detailed studies concerned with quantification of modeling uncertainties and their effect on
the collapse capacity of structural systems subjected to earthquake excitations, since so far there was not
available a systematic collection of experimental data that could be used to document statistical
information (median and standard deviation) on deterioration parameters of components. The log-
normally distributed CDFs for the four data sets shown in Fig. 3 are comparable, but in general the
median value of the modeling parameters for beams with other-than-RBS connections is smaller than that
Journal of Structural Engineering. Submitted February 16, 2010; accepted December 27, 2010; posted ahead of print December 30, 2010. doi:10.1061/(ASCE)ST.1943-541X.0000376
Copyright 2010 by the American Society of Civil Engineers

Accep
ted M
anus
cript
Not Cop
yedit
ed
10
for beams with RBS connections. The dispersion is larger for beams other-than RBS compared to beams
with RBS, partially because this set includes experimental data from different connection types.
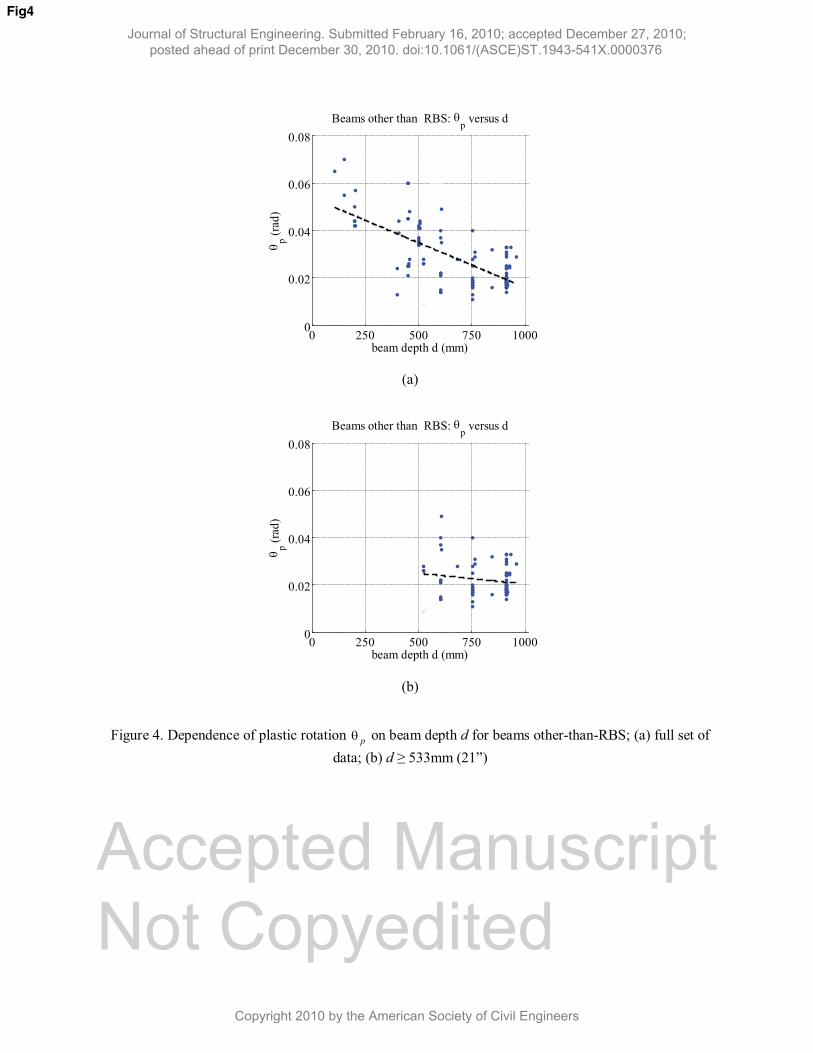
Dependence of modeling parameters on beam depth d
An increase in beam depth d is associated with a clear decrease in modeling parameters. This is supported
by Fig. 4a, which shows data and a linear regression line for the pre-capping plastic rotation p for data
set (1) (full data set for beams other-than-RBS). This data set includes beams with a depth varying from
102mm (4”) to 914mm (36”). Others (FEMA 2000; FEMA 2000a) have pointed out the strong
dependence of plastic rotation capacity on beam depth. This strong dependence is driven in part by the
incorporation of small sections in the database and is not confirmed for the range of primary interest for
tall buildings [d ≥ 533mm (21”)] based on Fig. 4b.
Dependence of modeling parameters on shear span to depth ratio L d
Based on simple curvature analysis with disregard of local instabilities, p of a given beam
section is perceived to be linearly proportional to the beam shear span L (distance from plastic
hinge location to point of inflection). This perception is supported by the plot in Fig. 5a, which
shows the dependence of p on L/d for the full other-than-RBS data set [beams with 102mm (4”)
d 914mm (36”)]. But the strong dependence on L/d is not evident when only beams of
depth ≥ 533mm (21”) are considered (see Fig. 5b). The reason is that most deep beams are
susceptible to a predominance of web buckling and lateral torsional buckling, and both of these
susceptibilities increase with a decrease in the moment gradient (more uniform moment, as
implied by an increase in the L d ratio). This phenomenon offsets much of the curvature
integration effect for a larger plastic hinge length. Based on this information it is concluded that
for beams with depth ≥ 533mm (21”) a description of beam plastic deformation capacity in terms
Journal of Structural Engineering. Submitted February 16, 2010; accepted December 27, 2010; posted ahead of print December 30, 2010. doi:10.1061/(ASCE)ST.1943-541X.0000376
Copyright 2010 by the American Society of Civil Engineers

Accep
ted M
anus
cript
Not Cop
yedit
ed
11
of a ductility ratio p y is often misleading because y increases linearly with L (for a given
beam section) but p does not. Assume two cantilever beams made of the same W section. One beam
has length L and the other L/2. The yield rotation θy for the first beam with length L will be My/6EI/L and
for the second beam with length L/2 will be My/(6EI/L/2), i.e. θy linearly increases with length. But the
experimental data for set with d ≥ 533mm show that θp does not depend strongly on L/d (see Fig. 5b). In
other words, the ratio p y depends strongly on beam span L. Similar observations are made for the
parameters pc and .
Dependence of modeling parameters on b yL r
This ratio is associated with sensitivity to lateral torsional buckling. The parameter bL is defined here as
the distance from the column face to the nearest lateral brace and yr is the radius of gyration about the y-
axis of the beam. AISC (2005) requires that this ratio be less than 2500/ yF . Results from the steel beam
database indicate that p is somewhat but not greatly affected by b yL r , provided that the ratio is close to
or smaller than the value required by seismic codes. A decrease of b yL r to 50% of the value required by
AISC (2005) increases in average p by 2.5% and 10% for beams other than RBS and beams with RBS,
respectively. Providing lateral bracing close to the RBS portion of a beam decreases the rate of cyclic
deterioration since twisting of the RBS region is delayed. Uang et al. (2000) reached to the same
conclusion for beams with RBS.
Dependence of modeling parameters on the width/thickness ratio of the beam flange f fb 2t
When the effect of f fb 2t ratio on p is viewed in isolation, a small f fb 2t ratio has a negligible effect
on p . For most of the deeper beams in the database a small f fb 2t implies a narrow wide flange beam
Journal of Structural Engineering. Submitted February 16, 2010; accepted December 27, 2010; posted ahead of print December 30, 2010. doi:10.1061/(ASCE)ST.1943-541X.0000376
Copyright 2010 by the American Society of Civil Engineers

Accep
ted M
anus
cript
Not Cop
yedit
ed
12
with small radius of gyration yr and large fillet to fillet web depth over web thickness ratio wh t , both of
which have a detrimental effect on p since (1) a larger wh t ratio makes a beam more susceptible to web
local buckling and (2) a small yr makes a beam more susceptible to lateral torsional buckling. On the
other hand, the data show a clear benefit of a smaller f fb 2t ratio for the parameters pc and since a
beam with smaller f fb 2t ratio does not develop a large flange local buckle, i.e. post-capping strength
deterioration and cyclic deterioration occur at a slower rate..
Dependence of modeling parameters on the depth to thickness ratio of the beam web wh t
This geometric parameter is found to be very important for all three modeling parameters (see Fig. 6).
The reason is that a beam with large wh t ratio is more susceptible to web local buckling. This triggers
flange local buckling and at larger inelastic cycles also triggers lateral torsional buckling (Lay 1965; Lay
and Galambos 1966) Figure 6 indicates also that the trends for all three modeling parameters are similar
for RBS and other-than-RBS sections.
Regression equations for pθ , pcθ , and Λ , accounting for geometric and material properties
In this section regression equations are proposed in order to predict deterioration modeling parameters
discussed previously. The primary focus is on p , pc , and . Recommendations for modeling of
effective bending strength y , post yield strength ratio c y , residual bending strength , and
ultimate rotation capacity u parameters are also presented.
Lay (1965) and Lay and Galambos (1966) showed that web local buckling is coupled with flange
local buckling and lateral torsional buckling. Hence a nonlinear regression model is used to evaluate the
Journal of Structural Engineering. Submitted February 16, 2010; accepted December 27, 2010; posted ahead of print December 30, 2010. doi:10.1061/(ASCE)ST.1943-541X.0000376
Copyright 2010 by the American Society of Civil Engineers

Accep
ted M
anus
cript
Not Cop
yedit
ed
13
contribution of each important property identified previously to the selected response parameter (RP). The
general nonlinear model used is
12 3
1 1 2naa a
nRP a X X X (5)
in which α1, α2,...αn+1 are constants known as regression coefficients and X1, X2 ...Xi are the predictor
variables. Based on an evaluation of steel database information and observations on trends discussed
partially in the previous section, six parameters are found to primarily affect the deterioration parameters
of steel components. Using these six parameters Eq. (5) becomes
73 4 62 5 21
12 533 355
aa a aa af unit yb unit
w f y
b c FL c dh LRP a
dt t r
(6)
in which, yF is the expected yield strength of the flange of the beam in MPa, which is normalized by
355MPa (typical nominal yield strength of European structural steel and equivalent with nominal yield
strength of about 50ksi US steel), and c1
unit and c2
unit are coefficients for units conversion. They both are
1.0 if mm and MPa are used, and they are c1
unit = 25.4 and c2
unit = 6.895 if d is in inches and yF is in ksi,
respectively.
Stepwise regression analysis (Chatterjee et al. 2000) is used to develop regression equations for the
three model parameters pθ , pcθ , and Λ . Only variables that are statistically significant at the 95% level
using a standard t-test and F-test (see Chatterjee et al. 2000) are included in the regression equations
presented in the subsequent sections. Variables with insignificant impact are not included in the
regression equations. Equations are presented for beams other-than-RBS and beams with RBS. For beams
other than RBS two sets of equations are proposed; one for the entire range of data and the other for the
dataset with d 533mm (21”). For beams with RBS the regression equations are based on the full set of
tests since there are no beams with RBS with d 457mm (18”) in the W-sections database.
Pre-capping plastic rotation pθ
Journal of Structural Engineering. Submitted February 16, 2010; accepted December 27, 2010; posted ahead of print December 30, 2010. doi:10.1061/(ASCE)ST.1943-541X.0000376
Copyright 2010 by the American Society of Civil Engineers

Accep
ted M
anus
cript
Not Cop
yedit
ed
14
For the full data set for beams other-than-RBS (data set 1) the equation for p obtained from multivariate
regression analysis using 107 specimens is
0.2300.140 0.7210.365 20.340 1
0.08652 533 355
f unit yunitp
w f
bh
t t
c Fc dL
d
(7)
2 0.505R , ln = 0.32
The large values of regression coefficients for web depth over thickness ratio wh t , beam depth d,
and span to depth ratio /L d confirm trends pointed out previously. Figure 7a shows data points for
predictions obtained from Eq. (7) plotted against the data points obtained from experimental results based
on the calibration process described earlier in this paper.
For the data set of beams with d ≥ 533mm (21") the regressed equation for pre-capping plastic
rotation p based on 78 specimens is given by
0.1300.345 0.0230 0.3300.550 0.090 21
0.3182 533 355
f unit yb unitp
w f y
b c FL c dh L
t t r d
(8)
2 0.457R , ln = 0.351
In Eq. (8) the effects of d and L/d on p are not as significant as in Eq. (7) for the entire range of data, as
concluded from the trends plots discussed in the previous section of this paper.
Based on 72 test specimens, with beams with RBS with d ≥ 533mm (21") the regressed equation for
pre-capping plastic rotation p is given by
0.07000.100 0.185 0.7600.314 0.113 21
0.192 533 355
f unit yb unitp
w f y
b c FL c dh L
t t r d
(9)
2 0.56R , ln = 0.24
Journal of Structural Engineering. Submitted February 16, 2010; accepted December 27, 2010; posted ahead of print December 30, 2010. doi:10.1061/(ASCE)ST.1943-541X.0000376
Copyright 2010 by the American Society of Civil Engineers
Accep
ted M
anus
cript
Not Cop
yedit
ed
15
Equation (9) indicates that the effect of wh t and d dominates on plastic rotation capacity p of beams
with RBS. Uang and Fan (1999) came to similar conclusions regarding the effect of wh t on p , based on
a data set of 55 RBS specimens and using the difference between the rotations at 80% of the ultimate
strength and at yield strength as a definition of plastic rotation capacity.
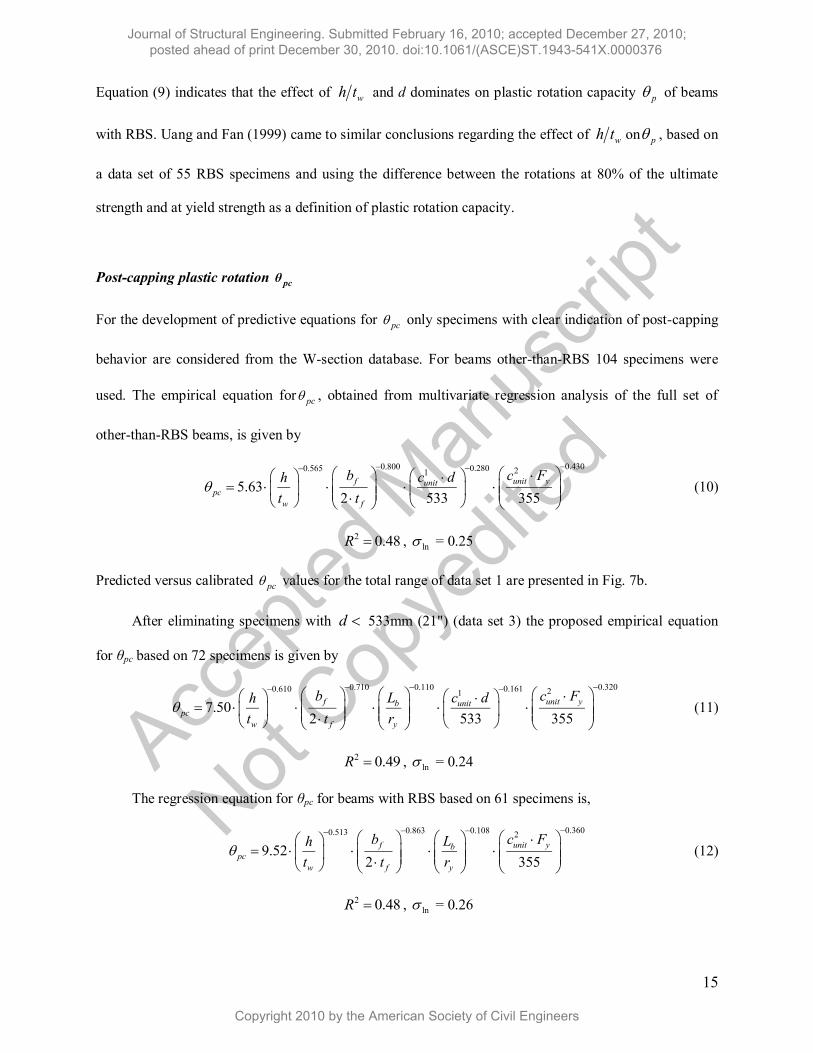
Post-capping plastic rotation pcθ
For the development of predictive equations for pc only specimens with clear indication of post-capping
behavior are considered from the W-section database. For beams other-than-RBS 104 specimens were
used. The empirical equation for pc , obtained from multivariate regression analysis of the full set of
other-than-RBS beams, is given by
0.4300.800 0.2800.565 21
5.632 533 355
f unit yunitpc
w f
b c Fc dh
t t
(10)
2 0.48R , ln = 0.25
Predicted versus calibrated pc values for the total range of data set 1 are presented in Fig. 7b.
After eliminating specimens with d 533mm (21") (data set 3) the proposed empirical equation
for θpc based on 72 specimens is given by
0.3200.710 0.110 0.1610.610 21
7.502 533 355
f unit yb unitpc
w f y
b c FL c dh
t t r
(11)
2 0.49R , ln = 0.24
The regression equation for θpc for beams with RBS based on 61 specimens is,
0.3600.863 0.1080.513 2
9.522 355
f unit ybpc
w f y
b c FLh
t t r
(12)
2 0.48R , ln = 0.26
Journal of Structural Engineering. Submitted February 16, 2010; accepted December 27, 2010; posted ahead of print December 30, 2010. doi:10.1061/(ASCE)ST.1943-541X.0000376
Copyright 2010 by the American Society of Civil Engineers

Accep
ted M
anus
cript
Not Cop
yedit
ed
16
Patterns reflected in Eqs. (10) to (12) agree with the ones from earlier studies by Axhag (1995) and
White and Barth (1998). These researchers proposed empirical equations for predicting the descending
slope of the moment-rotation curve of beams and concluded that flange and web local buckling are the
primary contributors to the descending slope of the beams.
Reference cumulative plastic rotation Λ
As discussed earlier, the reference cumulative plastic rotation is a parameter that defines the rate of
cyclic deterioration. The specimens considered for the development of predictive equations for are the
ones that fail in a ductile manner and for which cyclic deterioration is clearly observed. All modes of
cyclic deterioration are assumed to be defined by the same . The exponent c of Eq. (3) is kept equal to
1.0 for the sake of simplicity.
Equation (13) is the best-fit multivariate regression equation for predicting the cumulative rotation
capacity for the full set of other-than-RBS beams based on 85 specimens with clear indication of
cyclic deterioration,
0.3600.5951.34 2
4952 355
f unit yt
y w f
b c Fh
M t t
(13)
2 0.484R , ln = 0.35
Equation (13) indicates that the geometric parameter d, L/d, and b yL r become statistically insignificant.
The reason why b yL r ratio has a small effect on is that all the specimens included in the multivariate
regression analysis satisfy the AISC (2005) lateral bracing requirements. The small effect of b yL r was
pointed out also by Roeder, (2002).
For the data set of beams with nominal depth larger than 533mm (21") the following equation is
derived to predict (66 specimens showed clear indication of cyclic deterioration):
0.2910.525 0.1301.26 2
5362 355
f unit yt b
y w f y
b c FLh
M t t r
(14)
Journal of Structural Engineering. Submitted February 16, 2010; accepted December 27, 2010; posted ahead of print December 30, 2010. doi:10.1061/(ASCE)ST.1943-541X.0000376
Copyright 2010 by the American Society of Civil Engineers

Accep
ted M
anus
cript
Not Cop
yedit
ed
17
2 0.496R , ln = 0.34
The proposed equation for predicting the cumulative rotation capacity for beams with RBS
based on 55 specimens is
0.3910.632 0.2051.14 2
5852 355
f unit yt b
y w f y
b c FLh
M t t r
(15)
2 0.486R , ln = 0.35
Uang et al. (2000) have shown that beams with RBS are susceptible to twisting at the RBS region
because of the reduced flanges, and additional lateral bracing reduces the rate of strength deterioration at
large deformation levels because it reduces the lateral buckling amplitude near the RBS location. Roeder
(2002) came to the same conclusion. This is reflected in the exponent of the b yL r term in Eq. (15).
Experimental data with the following range of parameters are used in deriving Eqs (7) to (15):
20 ≤ wh t ≤ 55 for other-than-RBS; 21 ≤ wh t ≤ 55 for RBS.
20 ≤ b yL r ≤ 80 for other-than-RBS; 20 ≤ b yL r ≤ 65 for RBS.
4 ≤ 2f fb t ≤ 8 for other-than-RBS; 4.5 ≤ 2f fb t ≤ 7.5 for RBS.
2.5 ≤ L d ≤ 7 for other-than-RBS; 2.3 ≤ L d ≤ 6.3 for RBS.
102mm(4”) ≤ d ≤ 914mm (36”) for other-than-RBS; 533mm (21”) ≤ d ≤ 914mm (36”) for RBS.
240MPa (35ksi) ≤ yF ≤ 450MPa (65ksi) for other-than-RBS; 262MPa (38ksi) ≤ yF ≤ 435MPa
(63ksi) for RBS. The specimens included in the steel database were fabricated from three main types
of steel material; A36, A572, Grade 50 and A992, Grade 50. The yield strength values reported here
are the ones obtained from actual coupon tests conducted by the experimentalists.
The range of validity of the regression equations is only as good as the experimental data allows it
to be. The data does not include heavy W14 sections (heavier than W14x370) and heavy (heavier than
W36x150) and deep (e.g. deeper than W36) beam sections. The predictions from the regression equations
have been compared with data from the only series of experiments found in the literature on heavy W14
Journal of Structural Engineering. Submitted February 16, 2010; accepted December 27, 2010; posted ahead of print December 30, 2010. doi:10.1061/(ASCE)ST.1943-541X.0000376
Copyright 2010 by the American Society of Civil Engineers

Accep
ted M
anus
cript
Not Cop
yedit
ed
18
sections (Newell and Uang 2006) and have been found to provide reasonably close values of
experimentally obtained modeling parameters. Until more tests on columns become available, the above
equations provide the best estimates that can be offered for columns.
Tables 1 and 2 summarize the variation of deterioration parameters for beams other-than RBS and
with RBS, respectively, for a range of sections (W21 to W36) that satisfy seismic compactness criteria.
The range of deterioration parameter values is also reflected in the cumulative distribution functions of
these parameters presented in Fig. 3. Sections whose geometric or material properties are slightly outside
the range of properties, on which the predictive equations are based, are marked with an asterisk.
Effective yield strength y
As mentioned previously, the modified IK deterioration model does not account for cyclic hardening. But
the effect of isotropic hardening is incorporated approximately by increasing the yield moment (bending
strength) to an effective value y that accounts for isotropic hardening in average. The effective yield
strength typically is larger by a small amount than the predicted bending strength ,y p , which is defined
as the plastic section modulus Z times the measured material yield strength obtained from coupon tests.
Table 3 summarizes the mean and standard deviation of ,y y p ratios for beams other than RBS and
beams with RBS. For the latter, ,y p is defined based on the reduced section properties.
Options exist for more refined modeling that account explicitly for combined isotropic and
kinematic hardening (e.g., Sivaselvan and Reinhorn 2002; Jin and El-Tawil 2003). Such options were not
incorporated to keep the model relatively simple for engineering implementation.
Post-yield strength ratio yc
Post-yield hardening, and subsequently c
, is described by the ratio of the maximum moment on the
backbone curve shown in Fig. 1a over the effective yield bending strength, y
, discussed earlier. The
Journal of Structural Engineering. Submitted February 16, 2010; accepted December 27, 2010; posted ahead of print December 30, 2010. doi:10.1061/(ASCE)ST.1943-541X.0000376
Copyright 2010 by the American Society of Civil Engineers

Accep
ted M
anus
cript
Not Cop
yedit
ed
19
yc and yc
ratios define the strain hardening stiffness of the backbone curve shown in Fig. 1a.
This stiffness is important because of its effect on the P stability of a structural system (Medina and
Krawinkler 2003). Table 3 summarizes statistics (mean and standard deviation) of yc for RBS and
other-than-RBS connections based on information extracted from the database of steel components. In
general, yc is a more stable parameter to describe post-yield strength increase than the traditional
strain hardening ratio because the latter depends strongly on yield rotation, which in turn depends strongly
on the beam span selected in the experiment, i.e., on the moment gradient. Experimental data used in this
study have shown that the strength increase beyond yielding is much less sensitive to the moment
gradient than the yield rotation, which is linearly proportional to the beam span.
Residual strength ratio
Low cycle fatigue experimental studies (Krawinkler et al. 1983; Ricles et al. 2004) indicate four ranges of
cyclic deterioration: a range of negligible deterioration in which local instabilities have not yet occurred
or are insignificant. The second range involves an almost constant rate of cyclic deterioration due to
continuous growth of local buckles. In the third range, deterioration proceeds at a very slow rate due to
the stabilization in buckle size. This range is associated with the residual strength of a steel component.
These three ranges are followed by a range of very rapid deterioration, which is caused by crack
propagation at local buckles (ductile tearing). From the data sets for W-sections a residual strength ratio
= Mr/My of about 0.4 is suggested for sets (3) and (4). This value is based on a relatively small set of
data points from which an estimate of could be made with confidence. In order to assess residual
strength more reliably, more experiments with very large deformation cycles need to be conducted.
Ultimate rotation capacity u
At very large inelastic rotations cracks may develop in the steel base material close to the apex of the
most severe local buckle, and rapid crack propagation will then occur followed by ductile tearing and
Journal of Structural Engineering. Submitted February 16, 2010; accepted December 27, 2010; posted ahead of print December 30, 2010. doi:10.1061/(ASCE)ST.1943-541X.0000376
Copyright 2010 by the American Society of Civil Engineers
Accep
ted M
anus
cript
Not Cop
yedit
ed
20
essentially complete loss of strength (see Ricles et al. 2004 for illustrations and end of last loading cycle
of the experimental data shown in Fig. 2b). The modified IK deterioration model captures this failure
mode with the ultimate rotation capacity u . This rotation depends on the loading history and may be
very large for cases in which only a few very large cycles are executed (e.g. near fault loading history or
ratcheting type of global behavior) as discussed in Uang et al. (2000) and Lignos and Krawinkler (2009).
Estimates of u are made here only for experiments with step-wise increasing cycles of the type required
in the AISC (2005) seismic specifications. For beams other-than-RBS an estimate of u is 0.05 to 0.06
radians based on available data from various researchers (Allen et al. 1996; Ricles et al. 2000). For beams
with RBS, an estimate of u is 0.06 to 0.07 radians (Engelhardt et al. 2000; Ricles et al. 2004). For
monotonic type of loading u is on the order of three times as large as the u values reported above for
symmetric cyclic loading protocols. Ductile tearing is not found to be critical in analytical studies in
which the collapse capacity of a steel moment resisting frame has been evaluated because steel frame
structures approach their collapse capacity usually before ductile tearing occurs (Ibarra and Krawinkler
2005; Lignos and Krawinkler 2009; ATC-76-1 2009; Lignos et al. 2010a, 2010b).
Conclusions
This paper is concerned with deterioration modeling of steel components based on a recently developed
database on experimental studies of wide flange beams. The database of more than 300 specimens
contains, in consistent format, extensive information of worldwide experimental data on components that
have been subjected to monotonic and cyclic loading. The steel database can serve for validation and
improvement of deterioration models used for collapse assessment of steel moment resisting frames.
Based on statistical evaluation of calibrated moment rotation diagrams obtained from tests included in this
database, and with the use of multivariate regression analysis, empirical equations are proposed that
predict the deterioration modeling parameters p , pc and of beams with reduced beam sections (RBS)
Journal of Structural Engineering. Submitted February 16, 2010; accepted December 27, 2010; posted ahead of print December 30, 2010. doi:10.1061/(ASCE)ST.1943-541X.0000376
Copyright 2010 by the American Society of Civil Engineers

Accep
ted M
anus
cript
Not Cop
yedit
ed
21
and beams other-than RBS. Quantitative information for modeling of effective yield moment y , post-
yield strength ratio c y , residual strength ratio , and ultimate rotation capacity u is also provided.
From available trend plots, cumulative distribution functions on deterioration parameters, and predictive
equations the main conclusions are the following:
The median value of the pre-capping plastic rotation p is on the order of 0.02rad, the median of
post-capping rotation capacity pc is on the order of 0.20rad, and the median of the reference
cumulative rotation capacity is on the order of 1.0rad.
For all the connection types evaluated, the primary contributor to the deterioration parameters p ,
pc and is the beam web depth h over thickness ratio wh t . Of some importance is the effect
of flange width to thickness ratio 2f fb t , beam depth d and shear span over beam depth ratio L/d.
For sections used commonly in modern steel moment resisting frames [d ≥ 533mm (21")] a
description of beam deformation capacity in terms of a ductility capacity ratio p y is
misleading because y increases linearly with L (for a given beam section) but p does not.
Experimental data indicate that deterioration modeling parameters are not very sensitive to the
beam span (i.e., the length of the plastic hinge regions.
Closely spaced lateral bracing (small b yL r ratio) increases p , pc and , but not by a large
amount (provided that the b yL r ratio does not exceed an upper limit on the order of 70). The
effect of b yL r on of beams with RBS is somewhat more important compared to beams other
than RBS, particularly when additional bracing is installed near the RBS location.
The effective yield strength y used in the modified Ibarra – Krawinkler model, which accounts
in average for cyclic hardening, is about 1.10 times the plastic moment ,y p obtained from
Journal of Structural Engineering. Submitted February 16, 2010; accepted December 27, 2010; posted ahead of print December 30, 2010. doi:10.1061/(ASCE)ST.1943-541X.0000376
Copyright 2010 by the American Society of Civil Engineers

Accep
ted M
anus
cript
Not Cop
yedit
ed
22
plastic section modulus times actual material yield strength for both beams other-than-RBS and
beams with RBS.
The post yield strength ratio c y is in average 1.10 for both beams other-than-RBS and
beams with RBS. It is found that the ratio c y together with the ratio p/y provide a much
better definition of the post-yield stiffness than the traditional strain hardening ratio.
Α reasonable estimate of residual strength is 0.4 times the effective yield strength y . More
experiments with very large deformation cycles are needed in order to assess residual strength
with high confidence.
Ultimate rotation capacity u of steel components that fail in a ductile manner is strongly
dependent on loading history. For components subjected to symmetric cyclic loading histories u
is on the order of 0.06rad, but it is about three times as large when the component is subjected to
a near fault loading protocol or to monotonic loading.
The conclusion drawn here are based on interpretation of experimental data. Detailed analytical
validation studies have not been performed. The data are available for such studies at
https://nees.org/warehouse/project/84.
Acknowledgements
This study is based on work supported by the United States National Science Foundation (NSF) under
Grant No. CMS-0421551 within the George E. Brown, Jr. Network for Earthquake Engineering
Simulation (NEES) Consortium, and by a grant from the CUREE-Kajima Phase VI joint research
program. This financial support is gratefully acknowledged. The authors would like to thank graduate
students Yash Ahuja, Guillermo Soriano, Richard Weiner and Yavor Yotov for their invaluable assistance
Journal of Structural Engineering. Submitted February 16, 2010; accepted December 27, 2010; posted ahead of print December 30, 2010. doi:10.1061/(ASCE)ST.1943-541X.0000376
Copyright 2010 by the American Society of Civil Engineers

Accep
ted M
anus
cript
Not Cop
yedit
ed
23
in the steel database development. Any opinions, findings, and conclusions or recommendations
expressed in this paper are those of the authors and do not necessarily reflect the views of sponsors.
Journal of Structural Engineering. Submitted February 16, 2010; accepted December 27, 2010; posted ahead of print December 30, 2010. doi:10.1061/(ASCE)ST.1943-541X.0000376
Copyright 2010 by the American Society of Civil Engineers

Accep
ted M
anus
cript
Not Cop
yedit
ed
24
References
AISC (2005). “Seismic provisions for structural steel buildings, including supplement No. 1”, American
Institute of Steel Construction, Inc. Chicago, Illinois.
Allen, J. Partridge, J. E. and Richard, R. M. (1996). “Stress distribution in welded/bolted beam to column
moment connections”, Internal report of Seismic Structural Design Association, Inc.
ATC-76-1 (2009). “Evaluation of the FEMA P695 methodology for quantification of building seismic
performance factors”, 90% Draft, NEHRP Consultants Joint Venture, National Institute of Standards
and Technology.
Axhag, F. (1995). “Plastic design of composite bridges allowing for local buckling”, Rep. 95-09T, Lulea
University of Technology, 09T.
Baber, T., and Noori, M. N. (1985). “Random vibration of degrading, pinching systems”, J. Engrg Mech.,
ASCE, 111(8), 1010-1026.
Berry, M., Parrish, M., and Eberhard, M. (2004). “PEER structural performance database user‟s manual”,
Pacific Engineering Research Center, University of California, Berkeley, California, 38 pp.
Bouc, R. (1967). “Forced vibration of mechanical systems with hysteresis”, Abstract Proc., 4th
Conference on Nonlinear Oscillation.
Casciati, F. (1989). “Stochastic dynamics of hysteretic media”, Structural Safety, Amsterdam, 6, 259–
269.
Chatterjee, S., Hadi, A.S., and Price, B. (2000). “Regression analysis by example”, 3rd Edition, John
Wiley and Sons Inc., New York.
Dennis, J.E., Jr. (1977). “Nonlinear least-squares, state of the art in numerical analysis” ed. D. Jacobs,
Academic Press, 269-312.
Engelhardt, M. D., Fry, D. T., and Venti, M. J. (2000). “Behavior and design of radius cut reduced beam
section connections”, Rep. No. SAC/BD-00/17, SAC Joint Venture, Sacramento, CA.
FEMA 350 (2000). “Recommended seismic design criteria for new steel moment frame buildings”, Rep.
FEMA 350, Federal Emergency Management Agency, Washington, D.C.
Journal of Structural Engineering. Submitted February 16, 2010; accepted December 27, 2010; posted ahead of print December 30, 2010. doi:10.1061/(ASCE)ST.1943-541X.0000376
Copyright 2010 by the American Society of Civil Engineers

Accep
ted M
anus
cript
Not Cop
yedit
ed
25
FEMA 356 (2000a). “Prestandard and commentary for the seismic rehabilitation of buildings”, Rep.
FEMA 356, Federal Emergency Management Agency, Washington, D.C.
FEMA P695 (2009). “Quantification of building seismic performance factors”, Rep. FEMA P695, Federal
Emergency Management Agency, Washington, D.C.
Foliente, G. (1995). “Hysteresis modeling of wood joints and structural systems”, J. Struct. Engrg.,
ASCE, 121(6), 1013-1022.
Gupta, A., and Krawinkler, H. (1999). “Prediction of seismic demands for SMRFs with ductile
connections and elements”, Rep. No. SAC/BD-99/06, SAC Joint Venture, Sacramento, CA.
Haselton, C. B., and Deierlein, G. G. (2007). “Assessing seismic collapse safety of modern reinforced
concrete moment frames”, Rep. No. TB 157, John A. Blume Earthquake Engineering Center, Stanford
University, Stanford, CA.
Ibarra, L. F., Medina, R., and Krawinkler, H. (2002). “Collapse assessment of deteriorating SDOF
systems”, Proc. 12th
European Conference on Earthquake Engineering, London, UK, Paper 665,
Elsevier Science Ltd.
Ibarra L. F., and Krawinkler, H. (2005). “Global collapse of frame structures under seismic excitations”,
Rep. No. TB 152, The John A. Blume Earthquake Engineering Center, Stanford University, Stanford,
CA.
Ibarra L. F., Medina R. A., and Krawinkler H. (2005). “Hysteretic models that incorporate strength and
stiffness deterioration”, Earthquake Engineering and Structural Dynamics, 34(12), 1489-1511.
IBC (2003). “International building code IBC 2003,” International Code Council, Birmingham, AL.
Iwan, W. D. (1966). „„A distributed-element model for hysteresis and its steady-state dynamic response”,
J. Applied Mech. 33(42), 893–900.
Jin, J., and El‐Tawil, S. (2003). “Inelastic cyclic model for steel braces", J. of Engrg. Mech., ASCE,
129(5), 548-557.
Journal of Structural Engineering. Submitted February 16, 2010; accepted December 27, 2010; posted ahead of print December 30, 2010. doi:10.1061/(ASCE)ST.1943-541X.0000376
Copyright 2010 by the American Society of Civil Engineers

Accep
ted M
anus
cript
Not Cop
yedit
ed
26
Krawinkler, H., Zohrei, M., Irvani, B. L., Cofie, N., and Tamjed, H, H. (1983). “Recommendations for
experimental studies on the seismic behavior of steel components and materials”, Rep. No. TB 61,
The John. A. Blume Earthquake Engineering Center, Stanford University, Stanford, CA.
Lay, M. G., and Galambos, T. V., (1966). “Bracing requirements for inelastic steel beams”, J. of Struct.
Div., ASCE, 92(ST2), 207-228.
Lay, M. G. (1965). “Flange local buckling in wide-flange shapes”, J. of Struct. Div., ASCE, 91(ST6), 95-
116.
Lignos, D. G., and Krawinkler, H. (2007), “A database in support of modeling of component deterioration
for collapse prediction of steel frame structures”, Proc. ASCE Structures Congress, Long Beach CA,
SEI institute.
Lignos, D. G., and Krawinkler, H. (2009). “Sidesway collapse of deteriorating structural systems under
seismic excitations”, Rep. No. TB 172, The John A. Blume Earthquake Engineering Center, Stanford
University, Stanford, CA.
Lignos, D. G., and Krawinkler, H. (2010). “A steel database for component deterioration of tubular
hollow square steel columns under varying axial load for collapse assessment of steel structures under
earthquakes”, Proc. 7th International Conference on Urban Earthquake Engineering (7CUEE), March
3-5, Tokyo, Japan.
Lignos, D. G., Krawinkler, H. Whittaker, A. S. (2010a). “Prediction and validation of sidesway collapse
of two scale models of a 4-story steel moment frame”, Earthquake Engineering and Structural
Dynamics, (accepted for publication June 14th 2010).
Lignos, D. G., Hikino, T., Matsuoka, Y., Nakashima, M. (2010b). “Collapse assessment of steel moment
frames based on E-Defense full scale shake table collapse tests”, Proc., 13th Japan Earthquake
Engineering Symposium, Tsukuba, Japan, November, 17th-20
th, 2010.
Ma, F., Ng, C. H., and Ajavakom, N. (2006). “On system identification and response prediction of
degrading structures”, Structural Control and Health Monitoring, 13(1), 347-364.
Journal of Structural Engineering. Submitted February 16, 2010; accepted December 27, 2010; posted ahead of print December 30, 2010. doi:10.1061/(ASCE)ST.1943-541X.0000376
Copyright 2010 by the American Society of Civil Engineers

Accep
ted M
anus
cript
Not Cop
yedit
ed
27
Medina, R., and Krawinkler, H. (2003). “Seismic demands for nondeteriorating frame structures and their
dependence on ground motions”, Rep. No. TB 144, The John A. Blume Earthquake Engineering
Center, Stanford University, Stanford, CA.
Medsker, L.R., and Jain, L.C. (2000). “Recurrent neural networks: design and applications,” Boca Raton,
FL: CRC Press.
Mostaghel, N. (1999). „„Analytical description of pinching, degrading hysteretic systems‟‟, J. Engrg.
Mech., ASCE, 125(2), 216–224.
Newell, J., and Uang, C. M. (2006). “Cyclic behavior of steel columns with combined high axial load and
drift demand”, Rep. No. SSRP-06/22, American Institute of Steel Construction, Inc, Department of
Structural Engineering University of California, San Diego.
Otani, S. (1981). “Hysteresis models of reinforced concrete for earthquake response analysis”, J. Fac.
Engrg., University of Tokyo, XXXVI(2), 407 – 441.
OpenSees (2010). “Open System for Earthquake Engineering Simulation”. Pacific Earthquake
Engineering Research Center (PEER), (http://opensees.berkeley.edu).
Prakash, V., Powell, G. H., Campbell, S. (1993). “DRAIN-2DX: Basic program description and user
guide.” Rep. No. UCB/SEMM-1993/17, University of California, Berkeley, CA, 97 pages.
Rahnama, M. and Krawinkler, H. (1993). “Effect of soft soils and hysteresis models on seismic design
spectra”, Rep. No. TB 108, The John A. Blume Earthquake Engineering Center, Stanford University,
Stanford, CA.
Reinhorn, A. M., Madan, A., Valles, R. E., Reichmann, Y., and Mander, J. B. (1995). „„Modeling of
masonry infill panels for structural analysis‟‟, Rep. NCEER-95-0018, State University of New York at
Buffalo, Buffalo, N.Y.
Ricles, J. M., Mao, C., Lu, L.W., and Fisher, J.W. (2000). “Development and evaluation of improved
ductile welded unreinforced flange connections”, Rep. No. SAC/BD-00/24., SAC Joint Venture,
Sacramento, CA.
Journal of Structural Engineering. Submitted February 16, 2010; accepted December 27, 2010; posted ahead of print December 30, 2010. doi:10.1061/(ASCE)ST.1943-541X.0000376
Copyright 2010 by the American Society of Civil Engineers

Accep
ted M
anus
cript
Not Cop
yedit
ed
28
Ricles, J.M., Zhang, X., Lu, L.W., and Fisher, J. (2004). “Development of seismic guidelines for deep-
column steel moment connections”, Rep. No. 04-13, Advanced Technology for Large Structural
Systems.
Roeder, C.W. (2002). “General issues influencing connection performance”, J. Struct. Engrg, ASCE,
128(4), 420-428.
Sivaselvan, M., and Reinhorn, A.M. (2000). “Hysteretic models for deteriorating inelastic structures”, J.
Engrg, Mech., ASCE, 126(6), 633-640.
Sivaselvan, M., and Reinhorn, A.M. (2006). “Lagrangian approach to structural collapse simulation”, J.
Struct. Engrg, ASCE, 132(8), 795-805.
Song, J. and Pincheira, J. (2000). “Spectral displacement demands of stiffness and strength degrading
systems”, Earthquake Spectra, 16 (4), 817-851.
Uang, C.M., and Fan, C. C., (1999). “Cyclic instability of steel moment connections with reduced beam
sections”, Rep. No. SSRP–99/21, Depart. of Structural Engineering University of California, San
Diego.
Uang, C. M., Kent, Yu, K., and Gilton, C. (2000). “Cyclic response of RBS moment connections: loading
sequence and lateral bracing effects”, Rep. No. SSRP-99/13, Depart. of University of Calif. at San
Diego, La Jolla, Calif. USA.
Vamvatsikos, D., and Cornell, C. A. (2002). “Incremental Dynamic Analysis”, Earthquake Engineering
and Structural Dynamics, 31 (3): 491-514.
Wen, Y.-K. (1980). “Equivalent linearization for hysteretic systems under random excitation”, J. Applied
Mech., 47, 150-154.
White, D.W., and Barth, K. E. (1998). “Strength and ductility of compact flange I-girders in negative
bending”, J. Constr. Steel Research, 45(3) 241-280.
Yun, G. Y., Ghaboussi, J., Elnashai, A. S. (2007). “Modeling of hysteretic behavior of beam-column
connections based on self-learning simulation,” Rep. Mid-America Earthquake Center, Department of
Civil and Environmental Engineering, University of Illinois at Urbana-Champaign, Urbana, Illinois.
Journal of Structural Engineering. Submitted February 16, 2010; accepted December 27, 2010; posted ahead of print December 30, 2010. doi:10.1061/(ASCE)ST.1943-541X.0000376
Copyright 2010 by the American Society of Civil Engineers

Accep
ted M
anus
cript
Not Cop
yedit
ed
29
Zareian, F., and Krawinkler, H. (2009). “Simplified performance based earthquake engineering”, Rep. No.
TB 169, The John A. Blume Earthquake Engineering Research Center, Stanford University, Stanford,
CA.
Zareian, F., Lignos, D. G., and Krawinkler, H. (2010). “Evaluation of seismic collapse performance of
steel special moment resisting frames using ATC-63 methodology”, Proc. Structures Congress,
ASCE., May 12-14, Orlando, Florida.
Journal of Structural Engineering. Submitted February 16, 2010; accepted December 27, 2010; posted ahead of print December 30, 2010. doi:10.1061/(ASCE)ST.1943-541X.0000376
Copyright 2010 by the American Society of Civil Engineers

Rotation θ
Mom
ent M
θy
θc
θpc
θp
Mr=κMy
My
Mc
θu Rotation θ
Mom
ent M
Basic Strength Det.
UnloadingStiff. Det.
Post Cap.Strength Det.
(a) (b)
Figure 1. Modified Ibarra – Krawinkler (IK) deterioration model; (a) monotonic curve; (b) basic
modes of cyclic deterioration and associated definitions
Fig1
Accepted Manuscript Not Copyedited
Journal of Structural Engineering. Submitted February 16, 2010; accepted December 27, 2010; posted ahead of print December 30, 2010. doi:10.1061/(ASCE)ST.1943-541X.0000376
Copyright 2010 by the American Society of Civil Engineers

-0.08 -0.04 0 0.04 0.08-2500
-1250
0
1250
2500
Chord Rotation (rad)
Mom
ent (
kN-m
)
-0.08 -0.04 0 0.04 0.08-5000
-2500
0
2500
5000
Chord Rotation (rad)M
omen
t (kN
-m)
(a) (b)
Figure 2. Calibration examples of modified IK deterioration model; (a) beam with RBS (no slab, data
from Uang et al. 2000); (b) asymmetric hysteretic response considering composite action (data from
Ricles et al. 2004)
Fig2
Accepted Manuscript Not Copyedited
Journal of Structural Engineering. Submitted February 16, 2010; accepted December 27, 2010; posted ahead of print December 30, 2010. doi:10.1061/(ASCE)ST.1943-541X.0000376
Copyright 2010 by the American Society of Civil Engineers

0 0.02 0.04 0.06 0.080
0.2
0.4
0.6
0.8
1.0
θp
Prob
abili
ty o
f Exc
eede
nce
CDFs for Pre-Cap. Plastic Rot. θp (All Data)
θp (RBS)
Fitted Lognormal, β=0.32θ
p (Other than RBS)
Fitted Lognormal, β=0.43
0 0.02 0.04 0.06 0.080
0.2
0.4
0.6
0.8
1.0
θp
Prob
abili
ty o
f Exc
eede
nce
CDFs for Pre-Cap. Plastic Rot. θp [d>=533mm,(21")]
θp(RBS)
Fitted Lognormal, β=0.29θ
p (Other than RBS)
Fitted Lognormal, β=0.27
(a)
0 0.1 0.2 0.3 0.4 0.50
0.2
0.4
0.6
0.8
1.0
θpc
Prob
abili
ty o
f Exc
eede
nce
CDFs for Post-Cap. Plastic Rot. θpc (All Data)
θpc (RBS)
Fitted Lognormal, β=0.32θ
pc (Other than RBS)
Fitted Lognormal, β=0.41
0 0.1 0.2 0.3 0.4 0.50
0.2
0.4
0.6
0.8
1.0
θpc
Prob
abili
ty o
f Exc
eede
nce
CDFs for Post-Cap. Plastic Rot. θpc [d>=533mm,(21")]
θpc (RBS)
Fitted Lognormal, β=0.30θ
pc (Other than RBS)
Fitted Lognormal, β=0.35
(b)
0 1 2 3 40
0.2
0.4
0.6
0.8
1.0
Λ
Prob
abili
ty o
f Exc
eede
nce
CDFs for Cumul. Plastic Rot. Λ (All Data)
Λ (RBS)Fitted Lognormal, β=0.35Λ (Other than RBS)Fitted Lognormal, β=0.43
0 1 2 3 40
0.2
0.4
0.6
0.8
1.0
Λ
Prob
abili
ty o
f Exc
eede
nce
CDFs for Cumul. Plastic Rot. Λ [d>=533mm,(21")]
Λ (RBS)Fitted Lognormal, β=0.34Λ (Other than RBS)Fitted Lognormal, β=0.44
(c)
Figure 3. Cumulative distribution functions (CDFs) for: (a), pθ (b), pcθ and (c) Λ ; left = full data sets 1 and 2; right = data sets 3 and 4, d ≥ 533mm (21”)
Fig3
Accepted Manuscript Not Copyedited
Journal of Structural Engineering. Submitted February 16, 2010; accepted December 27, 2010; posted ahead of print December 30, 2010. doi:10.1061/(ASCE)ST.1943-541X.0000376
Copyright 2010 by the American Society of Civil Engineers
0 250 500 750 10000
0.02
0.04
0.06
0.08
beam depth d (mm)
θ p (rad
)
Beams other than RBS: θp versus d
(a)
0 250 500 750 10000
0.02
0.04
0.06
0.08
beam depth d (mm)
θ p (rad
)
Beams other than RBS: θp versus d
(b)
Figure 4. Dependence of plastic rotation pθ on beam depth d for beams other-than-RBS; (a) full set of data; (b) d ≥ 533mm (21”)
Fig4
Accepted Manuscript Not Copyedited
Journal of Structural Engineering. Submitted February 16, 2010; accepted December 27, 2010; posted ahead of print December 30, 2010. doi:10.1061/(ASCE)ST.1943-541X.0000376
Copyright 2010 by the American Society of Civil Engineers

0 5 10 150
0.02
0.04
0.06
0.08
L/d
θ p (rad
)
Beams other than RBS : θp versus L/d ratio
(a)
0 5 10 150
0.02
0.04
0.06
0.08
L/d
θ p (rad
)
Beams other than RBS : θp versus L/d ratio
(b)
Figure 5. Dependence of plastic rotation θp on shear span to depth ratio L/d for beams other-than-RBS;
(a) full data set; (b) d ≥ 533mm (21”)
Fig5
Accepted Manuscript Not Copyedited
Journal of Structural Engineering. Submitted February 16, 2010; accepted December 27, 2010; posted ahead of print December 30, 2010. doi:10.1061/(ASCE)ST.1943-541X.0000376
Copyright 2010 by the American Society of Civil Engineers

0 20 40 60 800
0.02
0.04
0.06
0.08
h/tw
θ p (rad
)
Beams other than RBS [d>=533mm,(21")]
0 20 40 60 800
0.02
0.04
0.06
0.08
h/tw
θ p (rad
)
Beams with RBS [d>=533mm,(21")]
(a) θp; other-than-RBS (b) θp; RBS
0 20 40 60 800
0.1
0.2
0.3
0.4
0.5
0.6
h/tw
θ pc (r
ad)
Beams other than RBS [d>=533mm,(21")]
0 20 40 60 800
0.1
0.2
0.3
0.4
0.5
0.6
h/tw
θ pc (r
ad)
Beams with RBS [d>=533mm,(21")]
(c) θpc; other-than-RBS (d) θpc; beams with RBS
0 20 40 60 800
1
2
3
4
h/tw
Λ
Beams other than RBS [d>=533mm,(21")]
0 20 40 60 800
1
2
3
4
h/tw
Λ
Beams with RBS [d>=533mm,(21")]
(e) Cumulative plastic rotation, Λ; other-than-RBS (f) Cumulative plastic rotation, Λ; RBS
Figure 6. Dependence of modeling parameters on h/tw ratio of beam web, d ≥ 533mm (21”)
Fig6
Accepted Manuscript Not Copyedited
Journal of Structural Engineering. Submitted February 16, 2010; accepted December 27, 2010; posted ahead of print December 30, 2010. doi:10.1061/(ASCE)ST.1943-541X.0000376
Copyright 2010 by the American Society of Civil Engineers

0 0.02 0.04 0.06 0.08 0.10
0.02
0.04
0.06
0.08
0.1
Calibrated θp (rad)
θ p,pr
ed. (r
ad)
Beams other than RBS (All Data)
(a) Predicted versus calibrated values of θp
0 0.1 0.2 0.3 0.4 0.50
0.1
0.2
0.3
0.4
0.5
Calibrated θpc (rad)
θ pc,p
red.
(rad
)
Beams other than RBS (All Data)
(b) Predicted versus calibrated values of θpc
Figure 7. Predicted versus calibrated θp and θpc parameters for beams other than RBS
Fig7
Accepted Manuscript Not Copyedited
Journal of Structural Engineering. Submitted February 16, 2010; accepted December 27, 2010; posted ahead of print December 30, 2010. doi:10.1061/(ASCE)ST.1943-541X.0000376
Copyright 2010 by the American Society of Civil Engineers

1
Table 1. Modeling parameters for various beam sizes (other-than-RBS) based on regression equations:
assumed beam shear span L=3810mm (150"), Lb/ry= 50, expected yield strength Fy=379MPa (55ksi)
Section Size θ p (rad) θ pc (rad) Λ h/t w b f /2t f L b /r y L/d d (mm)
W21x62 0.031 0.14 0.90 46.90 6.70 50.00 7.14 533
W21x147 0.038 0.22 2.23 26.10 5.43 50.00 6.79 561
W24x84 0.028 0.15 1.00 45.90 5.86 50.00 6.22 612
W24x207 0.034 0.28 2.81 24.80 4.14 50.00 5.84 653
W27x94 0.024 0.13 0.83 49.50 6.70 50.00 5.58 683
W27x217 0.029 0.22 2.14 28.70 4.70 50.00 5.28 721
W30x108 0.021 0.12 0.82 49.60 6.91 50.00 5.03 757
W30x235 0.024 0.19 1.76 32.20 5.03 50.00 4.79 795
W33x130 0.019 0.11 0.79 51.70 6.73 50.00 4.53 841
W33x241 0.021 0.16 1.42 35.90 5.68 50.00 4.39 869
W36x150 0.017 0.12 0.81 51.90 6.38 50.00 4.18 912
W36x210 0.020 0.18 1.45 39.10 4.49 50.00 4.09 932
Table1.doc
Accepted Manuscript Not Copyedited
Journal of Structural Engineering. Submitted February 16, 2010; accepted December 27, 2010; posted ahead of print December 30, 2010. doi:10.1061/(ASCE)ST.1943-541X.0000376
Copyright 2010 by the American Society of Civil Engineers

1
Table 2. Modeling parameters for various beam sizes (beams with RBS) based on regression equations;
assumed beam shear span L=3810mm (150"), Lb/ry= 50, expected yield strength Fy= 379MPa (55ksi)
Section Size θ p (rad) θ pc (rad) Λ h/t w b f /2t f L b /r y L/d d (mm)
W21x62 0.028 0.16 0.97 46.90 6.70 50.00 7.14 533
W21x147 0.033 0.27 2.15 26.10 5.43 50.00 6.79 561
W24x84 0.026 0.19 1.08 45.90 5.86 50.00 6.22 612
W24x207 0.030* 0.34* 2.71* 24.80 4.14 50.00 5.84 653
W27x94 0.022 0.16 0.91 49.50 6.70 50.00 5.58 683
W27x217 0.026* 0.29* 2.12* 28.70 4.70 50.00 5.28 721
W30x108 0.020 0.16 0.89 49.60 6.91 50.00 5.03 757
W30x235 0.023 0.25 1.78 32.20 5.03 50.00 4.79 795
W33x130 0.018 0.16 0.86 51.70 6.73 50.00 4.53 841
W33x241 0.020 0.22 1.46 35.90 5.68 50.00 4.39 869
W36x150 0.017 0.16 0.89 51.90 6.38 50.00 4.18 912
W36x210 0.019* 0.25* 1.53* 39.10 4.49 50.00 4.09 932
*Values slightly outside the range of experimental data
Table2.doc
Accepted Manuscript Not Copyedited
Journal of Structural Engineering. Submitted February 16, 2010; accepted December 27, 2010; posted ahead of print December 30, 2010. doi:10.1061/(ASCE)ST.1943-541X.0000376
Copyright 2010 by the American Society of Civil Engineers

1
Table 3. Statistics of ratios of effective to predicted component yield strength and
capping strength to effective yield strength
Connection
Type
Mean
My/My,p σMy/My,p
Mean
Mc/My σMc/My
RBS 1.06 0.12 1.09 0.03
Other than RBS 1.17 0.21 1.11 0.05
Table3.doc
Accepted Manuscript Not Copyedited
Journal of Structural Engineering. Submitted February 16, 2010; accepted December 27, 2010; posted ahead of print December 30, 2010. doi:10.1061/(ASCE)ST.1943-541X.0000376
Copyright 2010 by the American Society of Civil Engineers