Embed Size (px)
Citation preview

Improving the layout of recycling centres by use
of lean production principles
Erik Sundin, Mats Björkman, Mats Eklund, Jörgen Eklund and Inga-Lill Engkvist
Linköping University Post Print
N.B.: When citing this work, cite the original article.
Original Publication:
Erik Sundin, Mats Björkman, Mats Eklund, Jörgen Eklund and Inga-Lill Engkvist, Improving
the layout of recycling centres by use of lean production principles, 2011, WASTE
MANAGEMENT, (31), 6, 1121-1132.
http://dx.doi.org/10.1016/j.wasman.2010.12.021
Copyright: Elsevier Science B.V., Amsterdam.
http://www.elsevier.com/
Postprint available at: Linköping University Electronic Press
http://urn.kb.se/resolve?urn=urn:nbn:se:liu:diva-68775

Improving the Layout of Recycling Centres by Use of Lean Production Principles
Erik Sundin*1, Mats Björkman1, Mats Eklund2, Jörgen Eklund3 and Inga-Lill Engkvist3
*Corresponding author: Erik Sundin 1Division of Assembly Technology, Department of Management and Engineering,
Linköping University, SE-58381, Linköping, Sweden
Tel: +46-13-286601
Fax: +46-13-282798.
E-mail: [email protected]
Co-author #1: Mats Björkman 1Division of Assembly Technology, Department of Management and Engineering,
Linköping University, SE-58381, Linköping, Sweden
E-mail: [email protected]
Co-author # 2: Mats Eklund 2Division of Environmental Technology and Management, Department of Management and
Engineering, Linköping University, SE-58381, Linköping, Sweden
E-mail: [email protected]
Co-author #3: Jörgen Eklund 3Division of Ergonomics, School of Technology and Health,
Royal Institute of Technology, Alfred Nobels Allé 10, SE-141 52 Huddinge, Sweden
E-mail: [email protected]
Co-author #4: Inga-Lill Engkvist 3Division of Ergonomics, School of Technology and Health,
Royal Institute of Technology, Alfred Nobels Allé 10, SE-141 52 Huddinge, Sweden
E-mail: [email protected]
Abstract There has been increased focus on recycling in Sweden during recent years. This focus can be
attributed to external environmental factors such as tougher legislation, but also to the
potential gains for raw materials suppliers. Recycling centres are important components in the
Swedish total recycling system. Recycling centres are manned facilities for waste collection
where visitors can bring, sort and discard worn products as well as large-sized, hazardous, and
electrical waste. The aim of this paper was to identify and describe the main flows and layout
types at Swedish recycling centres. The aim is also to adapt and apply production theory for
designing and managing recycling centre operations. More specifically, this means using lean
production principles to help develop guidelines for recycling centre design and efficient
control.
Empirical data for this research was primarily collected through interviews and questionnaires
among both visitors and employees at 16 Swedish recycling centres. Furthermore, adapted
observation protocols have been used in order to explore visitor activities. There was also
close collaboration with a local recycling centre company, which shared their layout
experiences with the researchers in this project.
The recycling centres studied had a variety of problems such as queues of visitors,
overloading of material and improper sorting. The study shows that in order to decrease the
problems, the recycling centres should be designed and managed according to lean production
principles, i.e. through choosing more suitable layout choices with visible and linear flows,
providing better visitor information, and providing suitable technical equipment.
Improvements can be achieved through proper planning of the layout and control of the flow
of vehicles, with the result of increased efficiency and capacity, shorter visits, and cleaner
waste fractions. The benefits of a lean production mindset include increased visitor capacity,
waste flexibility, improved sorting quality, shorter time for visits and improved working
conditions.
Keywords: Recycling, Recycling centre, Lean Production, Lean Recycling, Lead Time,
Queues.
1. Introduction
1.1 Increased importance of recycling
Recycling centres are manned facilities for waste collection where visitors can bring, sort and
discard worn products as well as large-sized, hazardous, and electrical waste. The recycling
centres are primarily intended for use by private citizens and employees from smaller
companies. Different waste/material fractions in the form of different products and materials
(e.g. furniture, home appliances, wood, and garden waste) are placed in different large steel
containers, depending on the type of product or material. An example of a schematic view of
a recycling centre is shown in Fig. 1. Some types of waste are put into smaller cages or boxes
at designated areas for particular waste fractions. These are often waste fractions like
hazardous waste such as solvents, oils, and paint but also electrical apparatus. Almost
everything but kitchen waste is accepted at the centres, since that is dealt with by a separate
kerbside collection scheme. The items that the visitors bring to the recycling centres will
hereafter be denoted as „waste‟, whether these disposed items are worn products, materials, or
other waste. According to Swedish Waste Management (SWM), there are more than 700
recycling centres in Sweden (SWM, 2008).
Environmental legislation and directives have a strong affect on the recycling centres. For
example, the European Union has directives concerning how to handle waste; two such
directives are the Packaging and Packaging Waste (PPW) and Waste of Electric and
Electronics (WEEE) and (see EU, 1994 and EU, 2003). Industry and consumers are affected
by an even tougher Swedish environmental legislation. Sweden currently has one of the
world‟s highest amounts of collecting and recycling electrical and electronic equipment: 15.4
kg per inhabitant and year (SWM, 2010), a figure which illustrates the high impact of the
Swedish recycling centres.
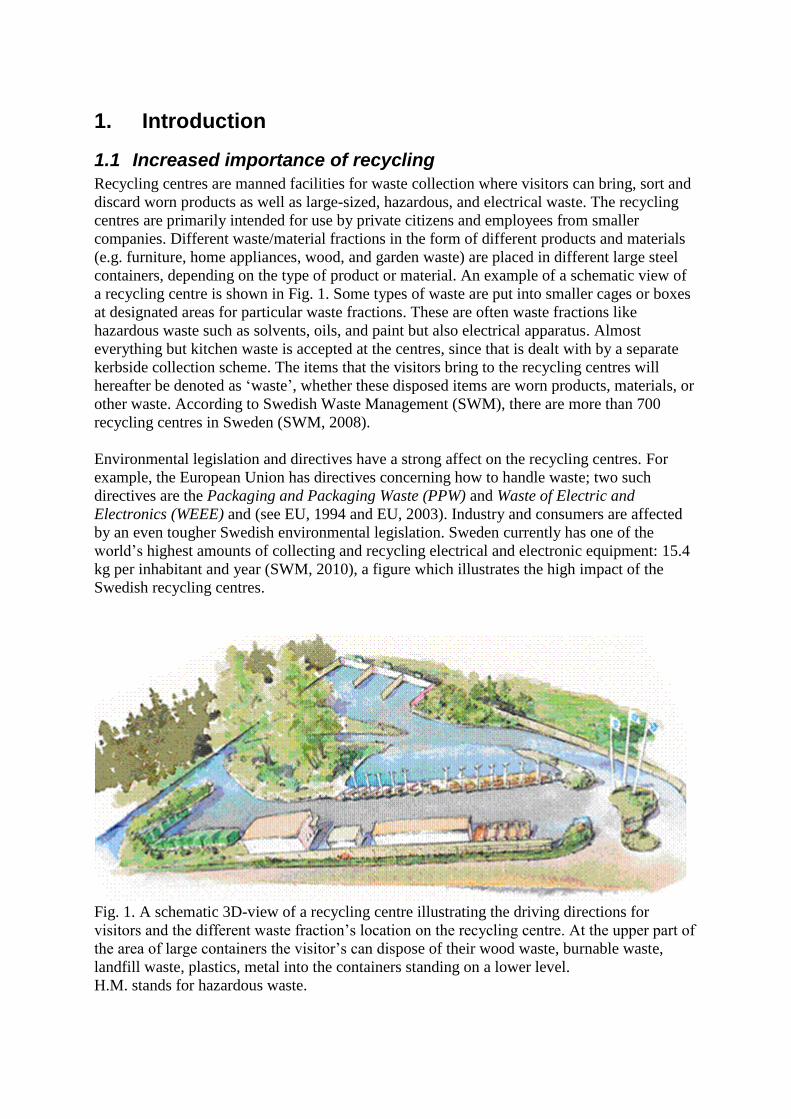
Fig. 1. A schematic 3D-view of a recycling centre illustrating the driving directions for
visitors and the different waste fraction‟s location on the recycling centre. At the upper part of
the area of large containers the visitor‟s can dispose of their wood waste, burnable waste,
landfill waste, plastics, metal into the containers standing on a lower level.
H.M. stands for hazardous waste.

1.2 Production challenges within recycling centres
As the trend towards recycling grows, so does the need for increasing the efficiency of
recycling centres. One way of doing this is to adapt ideas, theories, strategies, philosophies,
and principles from the area of production engineering. However, there are challenges in
translating and implementing established production theories and philosophies such as e.g.
Lean Production (Liker, 2004) to enhance the performance and efficiency of recycling
centres. Lean Production is widely adopted, and is claimed to increase productivity, decrease
lead-time and costs and enhance quality (Sanchez and Perez, 2001). The Lean Production
ideas developed by Toyota are in their most basic form the systematic elimination of waste,
and thus the increase of efficiency. The word „waste‟ in Lean Production context is not the
same as „waste‟ in the environmental and recycling context. Instead, waste in the Lean
Production context refers to issues like overproduction, waiting, transportation, inventory,
motion, over-processing, defective units. Furthermore, Lean Production is strongly associated
with the implementation of the concepts of continuous flow and customer pull (Womack et
al., 1996). Lean Production focuses on reducing waste in production, and is based on the
Toyota Production System (TPS), which relies on 14 principles to reduce waste (Liker, 2004).
For many years, industrial production systems have been analysed from a system performance
perspective. This includes analysis of the production system layout, lead time calculations,
reduction of bottlenecks, flexibility handling, reduction of queues etc., as discussed in e.g.
Shingo (1988). These analyses are often made in order to plan and control the flow of
production. Looking at recycling centres from an industrial production system perspective,
there is clearly a challenge when it comes to interpreting and implementing this industrial
mindset into recycling centre terms.
In production, much focus is put on shortening the lead time for the products leaving the
factory, e.g. allowing for fast assembly, testing and packing for delivery (time-to-customer).
Also, to minimize material and half-finished products, so-called work-in-progress (WIP) is
important since inventories occupy space and create capital costs. Furthermore, production
flexibility is something that manufacturers need to effectively manage in order to meet
variation in product demand (Slack et al., 1998). Large inventories normally reduce a
manufacturer‟s flexibility.
There are some principal differences between recycling centres and an ordinary industrial
production system. For example, it is the function of the recycling centres to receive and take
care of visitors‟ waste, i.e., „a push system‟, while industrial production systems normally
order the incoming material from their suppliers, i.e. „a pull system‟ (Slack et al., 1998).
Furthermore, the centres do not get paid for the majority of their output, while normal
production systems gain profit on almost all of their output. Thus, a recycling centre can be
regarded as a combination of a service and a production operation.
There are different types of lead time concerning recycling centres. The lead time can be
defined as the time from when the visitor enters the recycling centre until leaving it. In this
research, this recycling centre lead time has been in focus because designing and managing
recycling centre operations is in focus in the research. Another important type of lead time is
defined as the total time from a visitor‟s decision to leave their house to discard waste /
products until that person leaves the recycling centre or has returned to their home again. This
lead time may be a function of the recycling centre lead time, the location of the recycling

centre, the means of communications for the visitors to go to the recycling centre, etc. How
this function should be optimised has not been a part of this research, but is a very important
and interesting area for future research.
The recycling centres must be designed to minimise the recycling centre lead times and/or to
maximise the flow rate of the visitors‟ vehicles. There is obviously a trade-off situation
between lead time/capacity and cost in the form of investment cost as well as operation cost.
The challenge is to achieve a high level of efficiency in the form of short lead time/high
capacity at a low cost.
However, the notion that a visitor‟s time is also valuable is one that is all too often neglected.
Society cannot expect its citizens to spend excessive time waiting in queues at recycling
centres. Furthermore, minimisation of the lead time is also important from an environmental
point-of-view, as there is a substantial risk that people will try to dispose of their waste in
non-environmentally friendly ways if it is too cumbersome to use the recycling centres.
Another important design parameter is sorting quality; it must be easy to discard the waste in
the correct waste fraction container. The importance of this is further elucidated by Krook and
Eklund (2010a and 2010b).
1.3 Aim
The aim of this paper was to identify and describe the main flows and layout types at Swedish
recycling centres, as well as to adapt and apply production theory for designing and managing
recycling centre operations. More specifically, this means using lean production principles to
help develop guidelines for recycling centre design and efficient control.
2. Methodology This study was part of the multidisciplinary research project „Recycling centres in Sweden -
working conditions, environmental and system performance‟. The purpose of the project was
to form a basis for improving the function of centres with respect to these three fields. The
research group represents the disciplines of ergonomics, safety, external environment, and
production engineering.
The main data was collected through observations of visitors, questionnaires and interviews
with employees and visitors at 16 Swedish recycling centres. This data collection was
conducted during November and December 2003 during different days of the week. Although
the main data was collected in 2003, the layout of the recycling centres has been the same, at
least until this year, 2010. This has been confirmed through continual contact with Swedish
Waste Management and visits to recycling centres, as well as through seminars with staff
from recycling centres from the entire country. The main data collection from the 16 recycling
centres was also supplemented by a questionnaire collected from additional recycling centres
in Sweden, as described in Engkvist et al. (2010a). Based on this data collection and
experiences, the authors find that the data is representative for the current layouts of recycling
centres in Sweden.

2.1 Data collection from visitors
Visitors at the 16 recycling centres were asked to fill in a questionnaire consisting of 57 items;
ten of these items were used in this paper, since they concerned the flows and layout of the
centres. The questionnaires focused on the visit that specific day. Most questions had closed
response alternatives, but there were also a few open questions. Questions used in this article
were are as follows: whether the visitors had asked an employee for help in finding their way
at the recycling centre, the number of containers they had visited, the number of stops made
with their vehicle during the visit, and if the visitors had to reverse their cars during the visit.
The questionnaire was collected immediately after it had been filled in. In total, 317 visitors
filled in a questionnaire; 17 of these had disposed waste from a company.
Other visitors were interviewed using 37 questions, of which six were used for this paper. The
questions were mostly open, covering among other things: time for the visit, how easy it was
to determine the correct container/waste fraction, how easy it was to locate the container at
stake, and if there were any waste fractions the visitors thought were missing at the centre. In
total, 77 visitors were interviewed. Some questions were included in both the questionnaire
and the interviews. Using this type of data collection, it was possible to validate the questions
using triangulation (Engkvist et al., 2010a).
Before the visitors received a questionnaire or were interviewed, some of them were observed.
By filling in a prepared observation sheet, the visitors‟ behaviour at the centres was mapped.
The observations concerned the amount of waste brought, the type of waste, and how the
visitors moved around at the centre. In total, 163 observations were mapped.
2.2 Data collection from employees
The questionnaire for employees consisted of 130 questions and covered, among other things,
factors concerning: how the visitors spent their time during the visit; the portion of waste
which ended up in a container for the wrong waste fraction; which waste the visitors had the
greatest problem understanding where to dispose of (open question); which waste was most
often disposed of in the incorrect container (open question), and, if so, in which container
(open question); how often they saw visitors reversing in the opposite direction of the main
traffic at the facility, etc.
The interview protocol for the employees consisted of 31 questions in total, mostly open, and
covered among other things: whether or not queues were formed at the centre, and if so, how
they could be remedied; how sudden increases in volumes of a specific kind of
product/material were handled; and if there were any differences in how they handled a
sudden increase in volume during the year.
2.3 Data collection from a local recycling centre operator
During the three years that this research project ran, there was collaboration with Tekniska
Verken, a municipality-owned company which handles all waste in the city of Linköping,
including the recycling centres. Results from the research project were consecutively
discussed and used when planning and building two new recycling centres in Linköping.
Visitor flows and layout of the two new centres were important topics, e.g. the size of the area
for large waste fraction containers, the positions of the different containers and designated
areas of waste on the ground where the centres were built. The use of some parts of the land
was restricted. At one of the building sites there were protected oak trees rather centrally
situated and high voltage cables were located at the boundary of the centre. During this period,

Tekniska Verken was in a phase where it expanded from a single centre to three within the
city of Linköping. Therefore, these layout questions were of considerable importance to the
company.
3. Flows and layout at recycling centres On average, there were 400 visitors per day and recycling centre at the 16 recycling centres
visited. The recycling centres might receive almost any type of waste that the visitors want to
dispose of, in almost any quantity, during opening hours. The recycling centres must be
designed to handle these variations.
At the centres, two main types of vehicle flows have been identified. The first is the flow of
visitor‟s vehicles: the second is the flow of heavy vehicles utilised to handle the waste fraction
containers and to transport the containers from the centres to the next step in the total
recycling chain. There is also a flow of visitors on foot carrying waste between their vehicles
and the containers for the different waste fractions.
Flow of Visitor Vehicles. This flow starts when the vehicles enter the centre, and ends when
they leave the centre. The visitors stop their vehicles at one or several container(s). The
visitors leave their vehicles, unload their waste and throw it into the container(s). After
discarding their waste, the visitors leave the centre. Sometimes the visitors reverse or turn
around their vehicles; in other cases, they may exit the area where the large waste fraction
containers are placed, drive around the facility, and enter the container area once again.
The visitors reported that they most often only stop once (57%) or 2-5 times (41%), and 60%
of the visitors often throw their waste into a maximum of three different containers. However,
some visitors might even discard their waste in containers for 10 or more different waste
fractions1. Fig. 2 illustrates the flow of visitors at a conceptual centre.
The functions of the different parts/areas at recycling centres in Fig. 2 are described in more
detail in Engkvist et al., (2010b). Furthermore, it was identified that the visitors typically
chose one of the following two strategies for positioning their vehicles:
The most common strategy among the visitors was to stop their vehicles at a central
position in relation to the containers in which they planned to discard their waste. This
means that the vehicles were first parked, and that the visitors then walked several
times between their vehicles and the containers. This strategy was often used when the
visitors had waste to discard that was easy to carry to the containers.
A second strategy for the visitors was to drive their vehicles as close as possible to
each of the containers visited. This strategy was primarily used by visitors who had
only one or a few types of waste, or needed to discard waste that was heavy to unload
and throw into the container.
The visitors are supposed to throw their waste into the different containers, depending on the
type of material the waste consists of. It can be difficult to decide which container is most
suitable, as worn products are often composed of different materials and each of these
materials has a certain designated container. According to interviews with the employees at
1 A waste fraction is a designated area or container where the visitors discard their waste.

the centres, approximately 20% of the waste was placed in improper containers2. In some
cases, the employees corrected this by sorting out the misplaced waste and placing it in the
correct container. This was particularly the case, according to centre employees, when
„treated wood‟ was misplaced among „wood‟ and „gypsum‟ in the container for „combustible
waste‟. The employees utilised different kinds of technical equipment or tools, from very
simple to advanced, when they moved the misplaced waste to the correct container, see
Sundin et al. (2010). All different waste fractions and designated areas of the centres are
specified in detail in Engkvist et al. (2010b).
Office
H.M.
Recycling centre boundary
Upper ground level
Area of large containers
Containers for packaging and newspapers
H.M. Shed for Hazardous Materials (H.M.)
Container for waste (i.e. discarded products, materials, waste)
Increased or decreased elevation to upper or lower ground level
Flow of visitor’s vehicles (passenger cars)
Grass
Lower ground level
Fig. 2. A conceptual recycling centre illustrating the flow of visitors and their vehicles.
Flow of Heavy Vehicles. Heavy vehicles such as tractors, wheel-loaders, forklift trucks and
lorries/trucks are used for arranging, moving and transporting containers within and away
from the facility. The flow of lorries/trucks, for transporting the containers away from the
centre, often takes place at a lower ground level and separated from the flow of visitors and
their vehicles (Fig. 3). However, there is also quite often lorry/truck traffic at the same level
as the flow of visitors by foot and visitor‟s vehicles, e.g. the lorries/trucks that collect the
2 This estimate is a weighted average from the answers in a questionnaire for the employees. The answer to this
questionnaire question is further elaborated on in Krook and Eklund (2010a).

hazardous waste, electrical waste and packaging materials (Fig. 6). This flow is necessary
since the containers needs to be emptied as they are filled up quickly by the visitors. The flow
of heavy vehicles can be a problem from a safety point of view. Furthermore, there are also
flows of employees moving by foot that should be considered in addition to the flows that
have already been described. Employees also use tractors, for example, to compress waste,
which disturbs the flow of visitors.
Office
H.M.
Recycling centre boundary
Lower ground level
Upper ground level
Area of Large Containers
Containers for packaging and newspaper
H.M. Shed for Hazardous Materials (H.M.)
Container for waste (i.e. discarded products, materials, waste)
Increased or decreased elevation to upper or lower ground level
Flow of heavy vehicles (e.g tractors, lorries, wheel-loaders)
Grass
Fig. 3. A conceptual recycling centre illustrating the flow of heavy vehicles (e.g. lorries/trucks,
tractors etc.) used for exchanging the filled containers with empty ones as they operate at the
recycling centre. Also, the flow of lorries/trucks leaving the recycling centre with filled
containers is shown.
3.1 Layout
The layout of the studied centres substantially influences the different flows. A basic
approach to a layout problem is to reduce transports as much as possible. Of course, this must
be considered in relation to other aspects; in this context, these include for example lead time,
speed of the visitors‟ vehicles, quality of sorting, and working conditions.
For the 16 centres visited, the research group found two main types of centre layouts. The first
and most common layout, which in this paper is called „one-way-linear‟, has a row of

containers on one side of the container area. As a second type, „the square‟ was identified.
The types (Fig. 4) have been identified as having a distinguished difference in how wide the
area of large containers is. In „the square‟, the visitors have a large area to stop their vehicle
in, and walk reasonably short distances to all containers needed.
Stairs to Area of Large Containers (A. of L.C.)
Decreased elevation to lower level
Increased elevation to upper level
One-way-linear
Grass
Container for waste (i.e. discarded products, materials, waste)
The Square
M IB
B A
V
W IB
B T
R
T
A
M
F
P
F
G
VV
E
F
A
Office
Upper level
Upper level
Lower level
Lower level
Area of Large
Containers
D
B
P
L
T
R
T
A
M
W
T
I
F
A
F
A
Office
Upper level
Upper level
A. of L.C.
Lower level
Lower level
Flow of visitor’s vehicles (passenger cars)
Fig. 4. The two main types of recycling centres identified. On the left is the ‟one-way-linear‟
and on the right is „the square‟. The sketches are modifications from Porsborn (2004),
showing reconstructions of the recycling centres at Ödeshög and Upplands-Bro, Sweden.
The two types have different advantages and disadvantages. For example, „the square‟ type
has advantages for visitors, since it facilitates shorter walking distances and gives them a
better visual overview of the containers compared with „the one-way-linear‟ type. This is due
to the fact that the visitors can more easily park their vehicles in the middle of „the square‟.
They can then discard their waste in the containers by walking to them in the order they
prefer, since all containers are situated at a fairly reasonable distance from their cars. For „the
one-way-linear‟ type, the visitors need to walk or drive longer distances between the
containers, make more stops and sometimes reverse or drive another lap around the facility in
order to get to the right container. This also results in more transportation and the formation of
queues.

On the other hand, „the one-way-linear‟ type offers other advantages; for example, the visitors
are provided with a driving direction which they perceived to be more intuitive. The driving
directions and flows of vehicles should be intuitive in the sense that they are easier to
understand and comprehend for the visitor. One-way-linear flow is a very important
fundamental component of Lean Production. However, it can be very difficult to identify and
analyse what flows are perceived as intuitive by the visitors. Also, an easily understood layout
and very natural as well as visual flows are cornerstones of Lean Production (Liker, 2004).
This is an aspect that is too often neglected by the designers of production systems as well as
designers of recycling centres.
Another advantage of „the one-way-linear‟ type centres is that they may be smaller in size and
therefore cheaper to build and easier for the employees to monitor. Hence, a large „square-
type‟ centre could accommodate many visitors at the same time, whereas it could be
experienced as somewhat too large when there are not many visitors attending the centre. In
cases where there are fewer visitors, a smaller „one-way-linear‟ type could be a more suitable
alternative. During the visits to the centres, many different layouts varying between „the
square‟ and „the one-way-linear‟ have been identified (Porsborn, 2004). The distribution of
layout types at the 16 visited centres is shown in the following table (Table 1):
Table 1. Distribution of layout types for the 16 visited recycling centres.
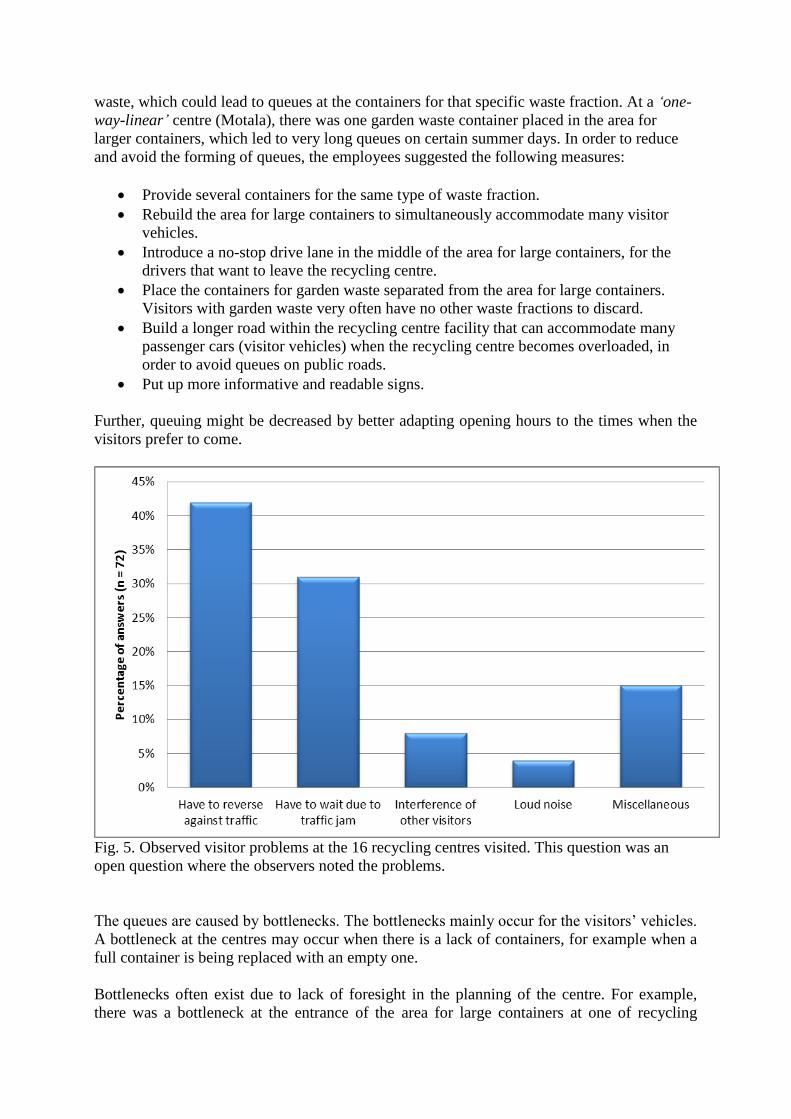
4. Identified flow problems and suggested solutions In order to analyse the potential flow problems at the 16 centres visited, the research group
observed and took notes on the prepared observation sheets concerning the visitors‟
behaviours. In all, 72 problems were noted and grouped as shown in Fig. 5.
The most common problems were related to queues and vehicles driving in the wrong
direction i.e. reversing against traffic (Fig. 5). According to the visitor questionnaire, 39
(12%) of the visitors reversed their vehicles at some point during their visit to the centre
(n=312). This was verified by the interviews with the employees, where half of the
respondents stated that they saw visitors reversing every day.
4.1 Queues and bottlenecks
The queues of visitor vehicles were one of the major problems occurring at the recycling
centres (Fig. 5). According to the 32 interviews with centre employees, queues were formed at
all of the 16 centres visited. In other words, every centre had visitor vehicle queue problems
on occasion. The queues were primarily formed at the area for large containers, since these
areas were often too confined to accommodate all the visitor vehicles needed. According to
the employees, the forming of queues was most common on Saturdays and sometimes also on
Mondays. Queues might also be formed on the public roads just outside the centres when the
centre had not yet opened or was overloaded with visitor vehicles. Such situations could occur
during some busy spring or summer days. Some types of waste are very seasonal, e.g. garden
Layout type One-way-linear in between
The Square
No. of recycling centres (n=16)
4 10 2
waste, which could lead to queues at the containers for that specific waste fraction. At a „one-
way-linear‟ centre (Motala), there was one garden waste container placed in the area for
larger containers, which led to very long queues on certain summer days. In order to reduce
and avoid the forming of queues, the employees suggested the following measures:
Provide several containers for the same type of waste fraction.
Rebuild the area for large containers to simultaneously accommodate many visitor
vehicles.
Introduce a no-stop drive lane in the middle of the area for large containers, for the
drivers that want to leave the recycling centre.
Place the containers for garden waste separated from the area for large containers.
Visitors with garden waste very often have no other waste fractions to discard.
Build a longer road within the recycling centre facility that can accommodate many
passenger cars (visitor vehicles) when the recycling centre becomes overloaded, in
order to avoid queues on public roads.
Put up more informative and readable signs.
Further, queuing might be decreased by better adapting opening hours to the times when the
visitors prefer to come.
Fig. 5. Observed visitor problems at the 16 recycling centres visited. This question was an
open question where the observers noted the problems.
The queues are caused by bottlenecks. The bottlenecks mainly occur for the visitors‟ vehicles.
A bottleneck at the centres may occur when there is a lack of containers, for example when a
full container is being replaced with an empty one.
Bottlenecks often exist due to lack of foresight in the planning of the centre. For example,
there was a bottleneck at the entrance of the area for large containers at one of recycling

centres (Ullstämma) that the local company, Tekniska Verken, recently established in
Linköping (see Fig. 6 and Fig. 10). Here, queues were formed because the entrance was too
narrow. As can be seen in Fig. 6, there are lampposts in the area where the visitors drive their
cars. These lampposts hinder the natural flow of visitors‟ cars. In this specific centre, there is
a lamppost placed near the entrance, contributing to the bottleneck problem.
-
Fig. 6. The bottleneck at the entrance of the Ullstämma recycling centre in the city of
Linköping, Sweden, can be seen in the picture. The visitors to the right in the picture are
throwing their packaging waste while the people to the left are throwing away bulky waste
and all contributes to the bottleneck problem at the entrance of the area of large containers.
4.2 Lead time
The most important lead time concerning recycling centres is the time from the entrance to the
centre of a loaded visitor vehicle until the vehicle has been emptied and it leaves the centre
unloaded. The centre managers intend to increase the visitor flow rate, which can be
exemplified by one centre manager:
“They (the visitors) should come through as fast as possible”.
In many cases, a typical visit to a centre takes no more than 2 to 3 minutes. According to the
interviews with centre employees, visitors spend their time as shown in Fig. 7.
The visitors spend most of their time at the centres unloading their vehicles and sorting their
material (see Fig. 7). Less time is generally spent on finding the correct container or asking
the employees where to throw their waste or seeking help with unloading their vehicles. This
is supported by interviews with visitors and questionnaires. One should note that the rate of
first time visitors was only 4% (n=372). The finding that it takes a limited amount of time to
find the correct container is also supported from the questionnaires (Fig. 8).

Fig. 7. Breakdown of visitors‟ time spent in different activities at the recycling centres,
according to its employees. The bars show the estimations of the employees. The total number
of answers is from the semi-structured interviews of the employees at the 16 recycling centres
visited and the questionnaire sent out to other recycling centre employees.
Fig. 8. The visitors‟ perceptions of whether it was easy or difficult to find the right container.
The bars in the figure show the alternatives that the respondents had to choose between when
answering the question. The answers reflect the aggregated answers to the same question from
the semi-structured interviews with the visitors and the questionnaires filled in by private
visitors and business visitors at the 16 recycling centres visited (n=387).

From the visitors‟ perspective, 97% of them stated that their visits took the expected amount
of time or less. According to Fig. 7, most of them thought that it was easy (25%) or even very
easy (56%) to find the correct container for their material. The reason why it was easy to find
the right container, according to visitors, was that (in descending order):
1. They had previous experience with the facility layout
2. Signs directed them to the designated containers
3. They received help from the recycling centre employees
Even though the visitors found it relatively easy to find the correct container for their waste,
there is room for further improvement in this respect, as the waste does not always end up in
correct containers. Waste that ends up in incorrect containers contributes to external
environmental problems downstream in the waste management chain (see also Krook and
Eklund, 2010a). Quality issues within recycling centres are further described in Krook and
Eklund (2010a). In addition, the employees are forced to work in awkward positions and to
perform heavy lifts when picking up incorrectly sorted waste (Svensson et al., 2010 and
Sundin et al., 2010).
Of the 314 visitors at the 16 centres visited, most visitors (71%) did not ask the employees for
advice before discarding their waste. However, the most common reason for visitors to ask
employees for advice was to get information/confirmation regarding where to discard their
waste. Only a few of the visitors (3%) asked the employees for help to unload their waste
(n=314). In this matter it should be noted that most of the employees did not have unloading
waste from visitor‟s vehicle as a part of their work tasks.
The lead time, or throughput time, at the centre could be reduced if the visitors pre-sorted all
their waste according to the different waste fractions at the centre, and if they loaded their
vehicles in an order which corresponded to the order of containers at the specific centre.
Information at home that facilitates this kind of preparation would have decreased time spent
at the centres substantially (see Eklund et al., 2010). Also, lead times increased when the flow
of visitors was so high that queues were formed. Hence, improvements that reduce queuing
would also improve visitors‟ vehicle lead times.
4.3 Capacity flexibility
One definition in production engineering literature of volume flexibility is: „the ability to
operate economically at different product volumes‟ (Da Silveira, 1998). In the context of
recycling centres, the focus is on how to meet the demands for flexibility regarding changes in
amounts of waste and numbers of visitors.
The employees interviewed (n=32) were asked how they handled a sudden increase in volume
of a specific kind of waste, and gave the following responses: extra containers were provided
(7 employees); the frequency of container shifts was increased (5); the lorry driver was called
in for collection earlier than planned (5); and the material in the container was compressed (4).
These strategies were conducted independently of, or in combination with, each other.
A sudden seasonal increase in volume during the year was handled by providing more
containers for items such as scrap metal, wood and garden waste (9 employees), by extending
opening hours (2 employees) and by placing containers in dense residential areas during
spring and autumn (1 employees).

The issue of flexibility is a question of increasing capacity when needed and an issue of
attempting to control the flow, i.e. decreasing the peak flow of visitors. Better manning, in
terms of more personnel and experienced and competent employees during busy (high flow)
periods, can increase capacity. Placing the containers so that frequently-visited containers are
spread out and not placed beside one another is also a possible improvement. Furthermore, to
inform potential visitors about time periods when queuing are expected could help to decrease
peak flows. If these figures were displayed on the website of the centre, this could also serve
to reduce peak flows. Another example would simply be to set up a web camera with an
overview of the centre, showing the current status of the visitor load.
4.4 Efficiency
Efficiency, often measured in production systems, is defined according to Slack et al. (1998)
as „actual output / effective capacity‟. However, improving efficiency makes sense only when
it is tied to cost reduction. According to Ohno (1988), there are two ways to increase
efficiency: by increasing production quantity and/or by reducing the cost.
It is difficult to gather information about the overall cost structures of the different recycling
centres. This is mainly due to the fact that many of the centres have evolved gradually from
being traditional „city dumps‟, and a complete picture of the cost structure of these centres
does not exist. However, the labour cost constitutes very substantial sums, often the
dominating part of the total operating cost of the centres.
If the number of workers in the centres is reduced, and consequently the cost, there is a risk
that sorting quality will be reduced. This is because one of the employees‟ most important
tasks is to advise visitors to throw their waste into the correct containers. If the visitors are
better informed regarding where to throw their waste, sorting quality will be improved and
capacity will be increased. In order to enhance the visitors‟ knowledge, it is recommended to:
use more informative and readable signs,
have information systems on-site to provide advice,
inform the visitors through other information channels on how to prepare, sort
and load their waste, and
improve the quality of advice and service given by the centre employees.
4.5 Case: Recycling centres in Linköping
As part of this research programme, there has been collaboration with the local operator,
Tekniska Verken, which is responsible for the recycling centres in the city of Linköping.
During the first data collection at the 16 centres in 2003, there was only one centre in
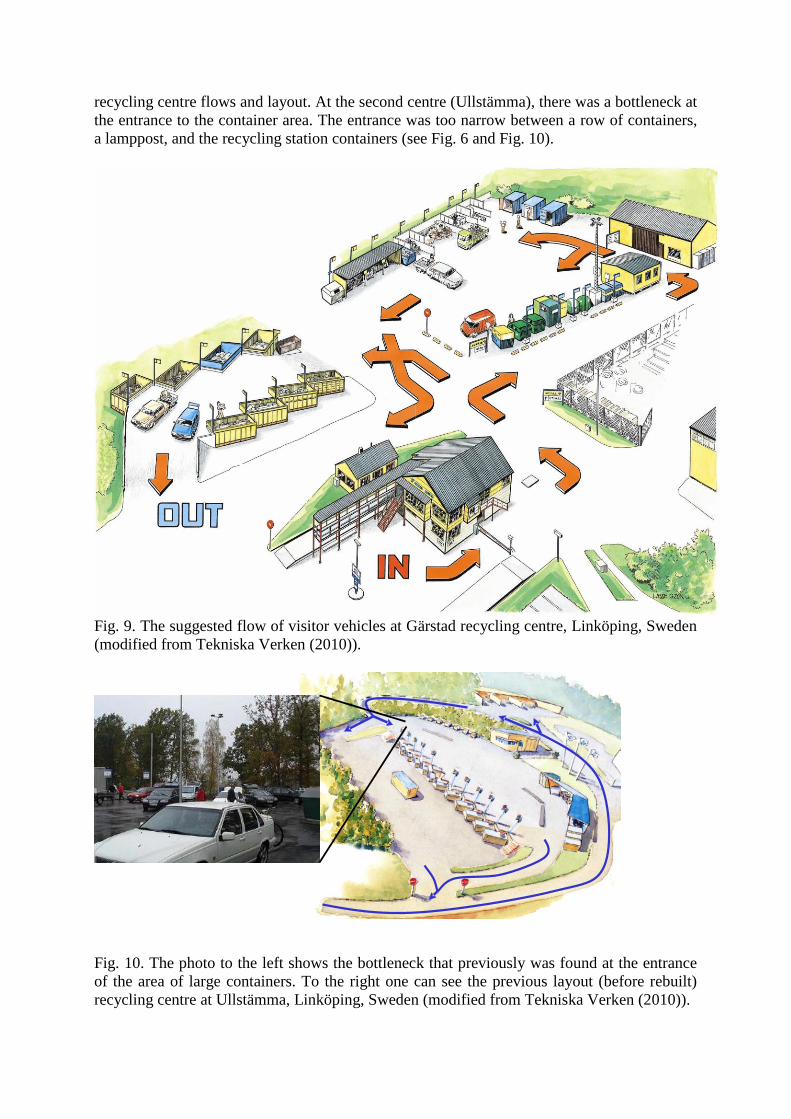
Linköping. The first recycling centre (Gärstad) is shown in Fig. 9.
As seen in Fig. 9, the flows of visitor vehicles are crossing each other. Furthermore, there are
also lorries/trucks crossing the centre in order to reach other areas of the facility, which makes
the flows even more complicated.
During late 2003 and early 2004, a second centre was designed and constructed and finally
opened in spring 2004. The experience and knowledge from this research programme and the
first two centres was considered when a third centre was designed, constructed and opened
during autumn 2005. These experiences and knowledge concerned among other aspects of
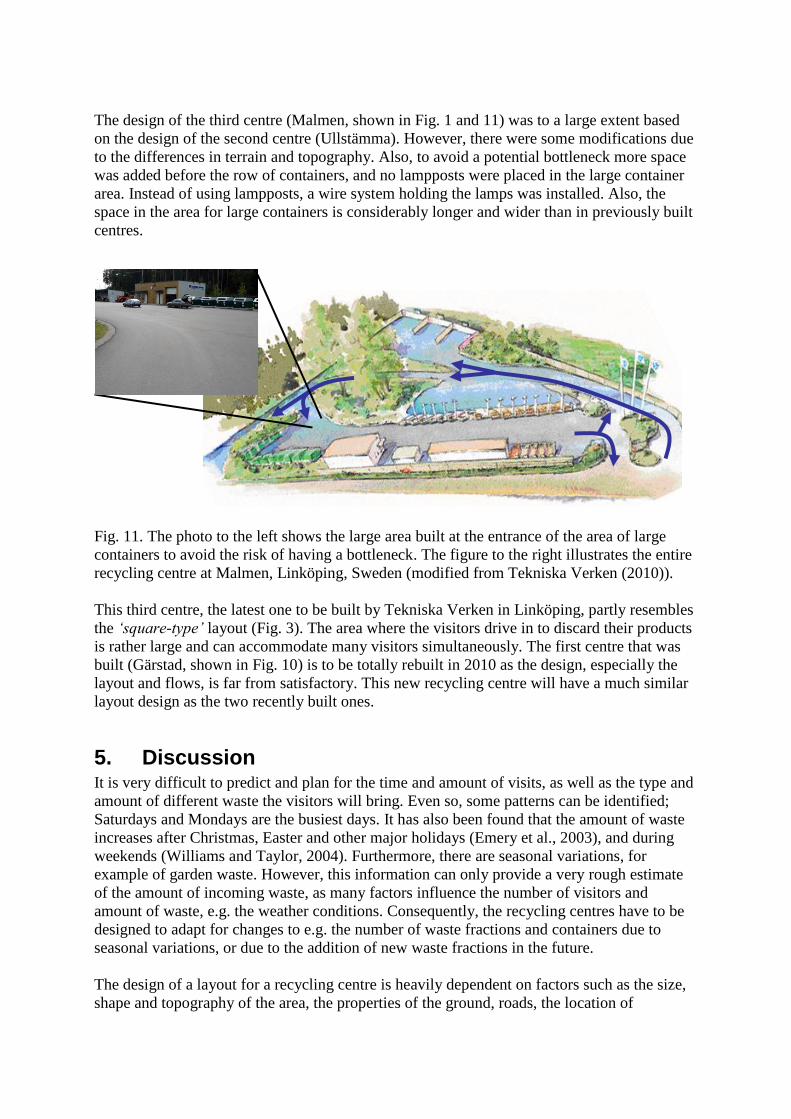
recycling centre flows and layout. At the second centre (Ullstämma), there was a bottleneck at
the entrance to the container area. The entrance was too narrow between a row of containers,
a lamppost, and the recycling station containers (see Fig. 6 and Fig. 10).
Fig. 9. The suggested flow of visitor vehicles at Gärstad recycling centre, Linköping, Sweden
(modified from Tekniska Verken (2010)).
Fig. 10. The photo to the left shows the bottleneck that previously was found at the entrance
of the area of large containers. To the right one can see the previous layout (before rebuilt)
recycling centre at Ullstämma, Linköping, Sweden (modified from Tekniska Verken (2010)).
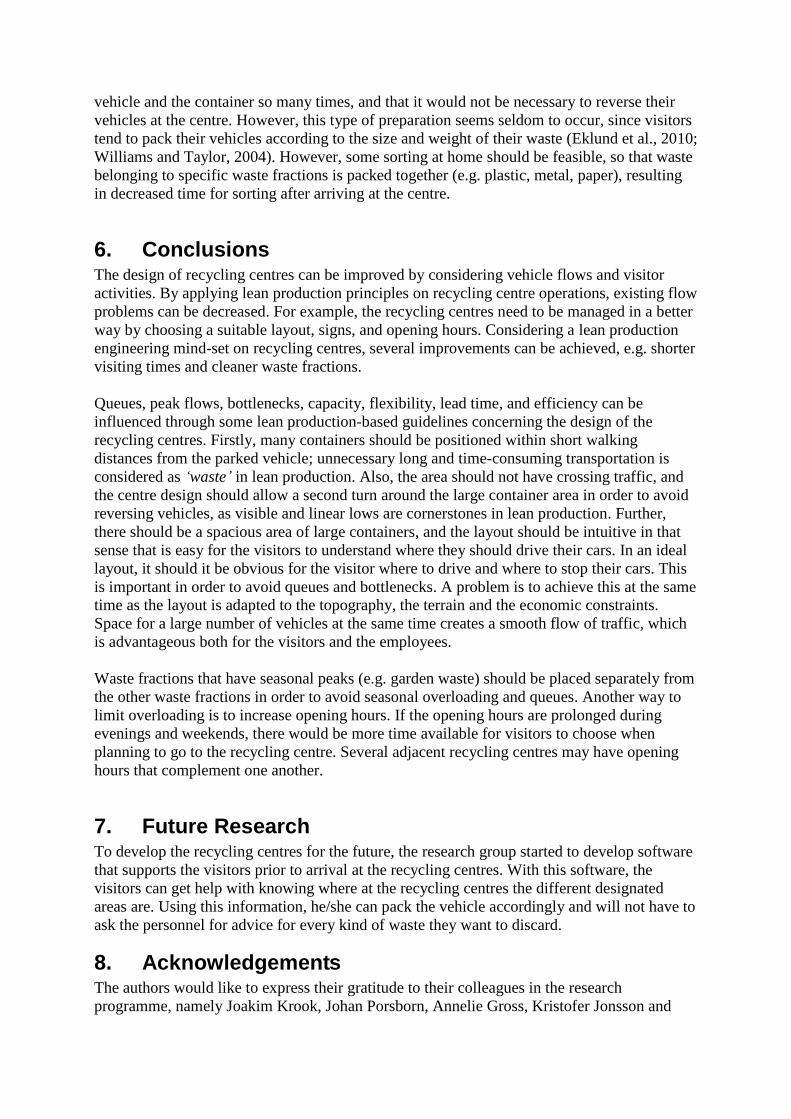
The design of the third centre (Malmen, shown in Fig. 1 and 11) was to a large extent based
on the design of the second centre (Ullstämma). However, there were some modifications due
to the differences in terrain and topography. Also, to avoid a potential bottleneck more space
was added before the row of containers, and no lampposts were placed in the large container
area. Instead of using lampposts, a wire system holding the lamps was installed. Also, the
space in the area for large containers is considerably longer and wider than in previously built
centres.
Fig. 11. The photo to the left shows the large area built at the entrance of the area of large
containers to avoid the risk of having a bottleneck. The figure to the right illustrates the entire
recycling centre at Malmen, Linköping, Sweden (modified from Tekniska Verken (2010)).
This third centre, the latest one to be built by Tekniska Verken in Linköping, partly resembles
the „square-type‟ layout (Fig. 3). The area where the visitors drive in to discard their products
is rather large and can accommodate many visitors simultaneously. The first centre that was
built (Gärstad, shown in Fig. 10) is to be totally rebuilt in 2010 as the design, especially the
layout and flows, is far from satisfactory. This new recycling centre will have a much similar
layout design as the two recently built ones.
5. Discussion It is very difficult to predict and plan for the time and amount of visits, as well as the type and
amount of different waste the visitors will bring. Even so, some patterns can be identified;
Saturdays and Mondays are the busiest days. It has also been found that the amount of waste
increases after Christmas, Easter and other major holidays (Emery et al., 2003), and during
weekends (Williams and Taylor, 2004). Furthermore, there are seasonal variations, for
example of garden waste. However, this information can only provide a very rough estimate
of the amount of incoming waste, as many factors influence the number of visitors and
amount of waste, e.g. the weather conditions. Consequently, the recycling centres have to be
designed to adapt for changes to e.g. the number of waste fractions and containers due to
seasonal variations, or due to the addition of new waste fractions in the future.
The design of a layout for a recycling centre is heavily dependent on factors such as the size,
shape and topography of the area, the properties of the ground, roads, the location of

neighbouring buildings and other valuable items that need to be protected. It is therefore not
possible to recommend a general optimal layout for recycling centres. Most visitors come by
car, as has also been identified at other collection facilities (Belton et al., 1994; Petersen and
Berg, 2004). Therefore, the design and layout should have a traffic flow that is easy to
understand, and clear road signs and direction markers should help visitors to find their
correct way. However, when the traffic flow is not perceived as intuitive, natural and obvious
is it very difficult to correct this by having clear road signs and direction markers on the
ground. This should be the case under conditions of sunshine as well as darkness, rain, and
snowfall. An easily understood layout and very natural as well as visual flows are
cornerstones of Lean Production (Liker, 2004).
A facility where the area is too confined leads to traffic problems and unnecessary irritation,
also found by (Woodard et al., 2004). An efficient flow of visitors is good both for the visitors
and the employees. In order to achieve an efficient flow of visitors‟ vehicles, it should be
made easy for the visitors to discard their waste correctly. Most visitors that know where at
the centre they should discard their waste know so because of previous visits and knowledge
of the centre layout. However, to facilitate that these visitors sort correctly, information
should be available both before and during the visit to the centre (Eklund et al., 2010;
Williams and Taylor, 2004). This also correlates to Lean Production, where relevant
information should always be displayed where it is needed. For example, assembly
instructions should always be very clearly displayed at an assembly station, regardless of it
the present assembly operator has worked at the station for a long time (Liker, 2004).
Much of the waste that the visitors discard at the centres is incorrectly sorted, they throw it in
the wrong waste fraction container (see also Eklund et al., 2010; Williams and Taylor, 2004).
In some cases, this creates problems for the downstream treatments and therefore action needs
to be taken at the centres. The employees have to sort out the waste that has been incorrectly
sorted, something which takes unnecessary working time and costs and also leads to poor
working conditions and risks. This work and these costs are to be considered as waste from a
Lean Production standpoint (Liker, 2004). Also, many of the visited centres do not have
proper equipment for this task (Sundin et al., 2010). If the visitors‟ knowledge of how to sort
and discard their waste were to improve, both the quality of sorting and the working
conditions of the centre employees would also be improved (Eklund et al., 2010, Engkvist,
2010).
Changing the opening hours of the centres could indirectly control the number of visitors, as
also proposed by other researchers (e.g. Williams and Taylor, 2004). If, for example, all three
centres in Linköping are open when the demand is highest, the loads at the centres could
become more even. In Lean Production, this is called „levelling‟ (Liker, 2004). However, this
requires good possibilities to adapt the number of centre employees. Furthermore, there could
be pictures from web cameras or other information concerning the current number of visitors
displayed on a website, to inform visitors of whether it is a good time to go to the centre or
not. On the website there could also be general guidelines concerning the times when it is
usually best to visit the centres. Visitors often use a webpage in order to find out the centres
opening hours; therefore, extra information about visitor load could easily be displayed.
A way for decreasing lead time and increasing efficiency at the recycling centre would be to
get the visitors to better prepare prior to their visit. This means e.g. loading their vehicle with
waste according to type of material/waste fractions and the order in which the containers are
placed at the centre. This in turn means that the visitor would not need to walk between the
vehicle and the container so many times, and that it would not be necessary to reverse their
vehicles at the centre. However, this type of preparation seems seldom to occur, since visitors
tend to pack their vehicles according to the size and weight of their waste (Eklund et al., 2010;
Williams and Taylor, 2004). However, some sorting at home should be feasible, so that waste
belonging to specific waste fractions is packed together (e.g. plastic, metal, paper), resulting
in decreased time for sorting after arriving at the centre.
6. Conclusions The design of recycling centres can be improved by considering vehicle flows and visitor
activities. By applying lean production principles on recycling centre operations, existing flow
problems can be decreased. For example, the recycling centres need to be managed in a better
way by choosing a suitable layout, signs, and opening hours. Considering a lean production
engineering mind-set on recycling centres, several improvements can be achieved, e.g. shorter
visiting times and cleaner waste fractions.
Queues, peak flows, bottlenecks, capacity, flexibility, lead time, and efficiency can be
influenced through some lean production-based guidelines concerning the design of the
recycling centres. Firstly, many containers should be positioned within short walking
distances from the parked vehicle; unnecessary long and time-consuming transportation is
considered as „waste‟ in lean production. Also, the area should not have crossing traffic, and
the centre design should allow a second turn around the large container area in order to avoid
reversing vehicles, as visible and linear lows are cornerstones in lean production. Further,
there should be a spacious area of large containers, and the layout should be intuitive in that
sense that is easy for the visitors to understand where they should drive their cars. In an ideal
layout, it should it be obvious for the visitor where to drive and where to stop their cars. This
is important in order to avoid queues and bottlenecks. A problem is to achieve this at the same
time as the layout is adapted to the topography, the terrain and the economic constraints.
Space for a large number of vehicles at the same time creates a smooth flow of traffic, which
is advantageous both for the visitors and the employees.
Waste fractions that have seasonal peaks (e.g. garden waste) should be placed separately from
the other waste fractions in order to avoid seasonal overloading and queues. Another way to
limit overloading is to increase opening hours. If the opening hours are prolonged during
evenings and weekends, there would be more time available for visitors to choose when
planning to go to the recycling centre. Several adjacent recycling centres may have opening
hours that complement one another.
7. Future Research To develop the recycling centres for the future, the research group started to develop software
that supports the visitors prior to arrival at the recycling centres. With this software, the
visitors can get help with knowing where at the recycling centres the different designated
areas are. Using this information, he/she can pack the vehicle accordingly and will not have to
ask the personnel for advice for every kind of waste they want to discard.
8. Acknowledgements The authors would like to express their gratitude to their colleagues in the research
programme, namely Joakim Krook, Johan Porsborn, Annelie Gross, Kristofer Jonsson and

Annika Kihlstedt, for their encouragement and help with data collection. Furthermore, we
would like to thank the recycling employees involved, especially the local recycling centre
operator in Linköping, Tekniska Verken, for their willingness to let us participate in their
recycling centre development projects. Finally, the Swedish Governmental Agency for
Innovation Systems (VINNOVA) is gratefully acknowledged for financially supporting this
research programme.
9. References Belton, V., Crowe, D.V., Matthews, R., Scott, S., 1994. A survey of public attitudes to
recycling in Glasgow (U.K.). Waste Management and Research, 12, pp 351-367.
Da Silveira G., 1998, A Framework for the Management of Product Variety, International
Journal of Operations & Production Management, 18/3:271-285.
Eklund, J., Kihlstedt, A., Engkvist, I.-L., 2010. Sorting and disposing of waste at recycling
centres - A user perspective. Applied Ergonomics, 41(3), pp 355-361.
Emery, A.D., Griffiths, A.J., Williams, K.P., 2003. An in depth study of the effects of socio-
economic conditions on household waste recycling practices. Waste Management and
Research 21, 180-190.
Engkvist, I.-L., Krook, J., Eklund, J., Björkman, M., Sundin, E., Svensson, R., Eklund, M.,
2010a. Joint investigation of working conditions, environmental and system
performance at recycling centres - Development of instruments and their usage,
Applied Ergonomics, 41(3), pp, 336-346.
Engkvist, I.-L., Eklund, J., Björkman, M., 2010b. Recycling of waste - working conditions,
environmental and system performance. (Submitted).
Engkvist, I.-L 2010. Working conditions at recycling centres in Sweden - Physical and
psychosocial work environment. Applied Ergonomics, 41(3) pp, 347-354.
EU, 1994. European Parliament and Council Directive 94/62/EC of 20 December 1994 on
packaging and packaging waste, Accessed 2010-12-07 from
http://europa.eu/legislation_summaries/environment/waste_management/l21207_en.htm
EU, 2003. Official Journal of the European Union, Directive 2002/96/EC of the European
Parliament and of the Council of 27 January 2003 on waste electrical and electronic
equipment (WEEE), Accessed 2010-12-07 and downloadable from:
http://www.epeat.net/Docs/EU%20WEEE%20Directive.pdf
Krook, J., Eklund, M., 2010a. The strategic role of recycling centres for environmental
performance of waste management systems, Applied Ergonomics, Vol. 41(3), pp 362-
367.
Krook, J., Eklund, M., 2010b. Developing a monitoring method facilitating continual
improvements in the sorting of waste at recycling centres. Waste Management, Vol.
30(1), pp 32-40.
Liker, J., 2004, The Toyota Way 14 Management Principles from the World‟s Greatest
Manufacturer, McGraw-Hill.
Ohno T., 1988. Toyota production system: beyond large scale production, 1988, Productivity
press, Cambridge, Mass.
Petersen, C.H.M., Berg, P.E.O., 2004. Use of recycling stations in Borlänge, Sweden -
volume weights and attitudes. Waste Management, 24 (9), 911-918.
Porsborn, J., 2004. Hur ska en återvinningscentral se ut? Inflödesanalyser av 16 anläggningar.
(Recycling centres – what should they look like?). Master thesis 2161, Environmental
Technology and Management, Linköping University.
SWM, 2008. Swedish Waste Management, Malmö, Sweden.

SWM, 2010. Svensk Avfallshantering 2010 (in Swedish), Report about Swedish Waste
Management published online by Swedish Waste Management at:
http://www.avfallsverige.se/fileadmin/uploads/Rapporter/SAH2010_WEB.pdf
Sanchez, A.M. and Perez, M.P., 2001, Lean indicators and manufacturing strategies.
International Journal of Operations and Production Management, 21(11), pp 1433-
1451.
Shingo S., 1988. Non-Stock Production: The Shingo System for Continuous Improvement,
Productivity Press.
Slack N., Chambers, Harland, Harrison and Johnston, 1998. Operations Management 2nd
Edition, Financial Times Pitman Publishing.
Sundin E., Svensson R., Jonsson K., 2010. Developing technical equipment for employees
and visitors at recycling centres. (Submitted).
Svensson, R., Eklund, J., Engkvist, I.-L., 2010. Risks in the physical work environment at
Swedish recycling centres. (Submitted).
Tekniska Verken, 2010. Pictures modified from the webpage of Tekniska Verken,
http://www.tekniskaverken.se. Accessed 2010-12-07.
Williams, I.D., Taylor, C., 2004. Maximising household waste recycling at civic amenity sites
in Lancashire, England. Waste Management 24(9), pp 861-874.
Womack, J. P. and Jones, D. T., 1996, Lean Thinking – Banish Waste and Create Wealth in
your Corporation. New York: Simon & Schuster.
Woodard, R., Bench, M., Harder, M.K., Stantzos, N., 2004. The optimisation of household
waste recycling centres for increased recycling--a case study in Sussex, UK. Resour.
Conservat. Recycl. 43(1), pp 75-93.
VITAE of the authors:
Erik Sundin works presently as an Associate Professor at Linköping University in Sweden.
Erik holds a M.Sc. degree in Applied Physics and Electrical Engineering and a Ph.D. from
2004 in Assembly Technology from the same university. His thesis was entitled: „Product and
Process Design for Successful Remanufacturing‟. His teaching and research interests are in
the area of remanufacturing, ecodesign, integrated product service engineering (IPSE) and
product/service systems (PSS) with a focus on design. Erik has published articles in journals
such as the Computer-Aided Design, Journal of Cleaner Production, International Journal of
Production Economics and Journal of Industrial Ecology.
Division of Assembly Technology, Department of Management and Engineering,
Linköping University, SE-58381, Linköping, Sweden
E-mail: [email protected]
Professor Mats Björkman is head the div of Assembly Technology at Linköping University,
Sweden. He is also Deputy Head of the Department of Management and Engineering. The
research interests have had a focus on development, operation and justification of flexible
manufacturing systems. The research interests have gradually expanded to how the systems
interact with the rest of the company and supply chain issues. The interface and integration
between manufacturing and product design, including design science, is also a research area.
Furthermore, the research has developed over the last 15 years to also include
remanufacturing and recycling.
Division of Assembly Technology, Department of Management and Engineering,
Linköping University, SE-58381, Linköping, Sweden
E-mail: [email protected]
Mats Eklund, Professor in Environmental Technology and Management, Linköping
University is doing research in industrial ecology and symbiosis focusing on turning
environmental challenges into business opportunities. He acquired his Ph D in 1995 in the
interdisciplinary research school at the Tema Department, Linköping University with a thesis
on metal flows in a historical perspective. Since then, he has developed research in the areas
of substance flow analysis, life-cycle oriented environmental assessments, environmental
impact assessments and industrial symbiosis. These studies have been addressing the
environmental performance of large technical systems in the energy and waste sectors.
Division of Environmental Technology and Management, Department of Management and
Engineering, Linköping University, SE-58381, Linköping, Sweden
E-mail: [email protected]
Jörgen Eklund is professor in Industrial ergonomics at the Royal Institute of Technology in
Sweden. He has an MSc in Mechanical Engineering from Chalmers University of Technology in
Sweden and a PhD in Industrial Ergonomics from University of Nottingham in England. His
research interests have been within the field of applied ergonomics, largely in industry,
workplace design and design of work equipment. In particular, he has done extensive research on
the interactions between the ergonomics and the quality fields, which also includes work
organisation, change and interventions. Recent applications deal with recycling, lift truck drivers,
mail carriers and meat cutters.
Division of Ergonomics, School of Technology and Health
Royal Institute of Technology, Alfred Nobels Allé 10, SE-141 52 Huddinge, Sweden
E-mail: [email protected]

Inga-Lill Engkvist is an Associate Professor. She has a PhD in Rehabilitation Medicine from
Karolinska Institute in Sweden. She was the project leader for the multidisciplinary research
programme “Recycling centres in Sweden – working conditions, environmental and system
performance”, at Linköping University in Sweden, of which present study is a part. She has
performed research covering nurses work environment in both Sweden and Australia. Recent
applications deal with remanufacturing and meat cutters. Inga-Lill has published articles in
journals such as Applied Ergonomics, Epidemiology, International Journal of Industrial
Ergonomics, Safety Science, and Scandinavian Journal of Work and Environmental Health.
Division of Ergonomics, School of Technology and Health
Royal Institute of Technology, Alfred Nobels Allé 10, SE-141 52 Huddinge, Sweden
E-mail: [email protected]