Embed Size (px)
Citation preview
Design and validation of a sensor guided robotcontrol system for welding in shipbuilding
Mikael Fridenfalk, Gunnar S. Bolmsjö
Division of Robotics, Dept. of Mechanical EngineeringLund University, Box 118SE-221 00 Lund, Sweden
Abstract
New areas in welding large structures in shipbuilding include joininglarge sections such as double-hull constructions. Joining these sectionscreate great problems for a manual welder since the welding takes placein a closed area with associated work environmental problems. The ac-cessibility to the working area is limited to a man-hole and the use ofrobots for welding such structures requires new robot design that areadapted for the task as well as the additional requirements of one-offproduction.
This paper will describe research work and results within the ROWER-2 project. The aim of the project is to design a robot system for joiningship sections in the final stage when ship sections are to be assembledtogether in dry dock. Due to a high degree of manual work involved inthe assembly procedure of the ship, the project addresses both produc-tivity and quality issues. In addition, much welding operations are donein closed areas and the improvement of working conditions is of greatimportance as well.
An important part within the project is to develop control algorithmsfor seam tracking during welding. The aim is to be able to cope with toler-ances in the joints after manual set-up and tack welding of the structure.The seam tracking method is based on the "through-arc" principle anddevelopment of the algorithms was made using simulation techniques. Aspecial software system, FUSE, was developed for this purpose that seam-
1
lessly integrates commercial available software tools such as Matlab andEnvision (robot simulator).
Experimentals were made in two stages. The first stage included de-tailed analysis and simulations to ensure a correct behavior of the seamtracking procedure during welding motions. This was followed by a firsttry-out using the real robot. The first try-out showed that the basic prin-ciples worked but some changes of the torch had to be made. The secondstage included a theoretical up-date of the control algorithms followedby simulation based validation. A second try-out using the real robotshowed results similar to those from simulations.
Simulation in FUSE showed that the major part of the developmentof sensor control algorithms should be performed by simulation, sinceit cuts time, expenses and efforts, especially when software simulationis included in the methodology.
1 Introduction
1.1 Robot welding
Since manual labor is a highly limited resource, especially when it comesto skilled craftsmen, robot automation is essential for future industrialexpansion. One application area is presently robot welding, by whichthe welding quality and the environmental conditions for welders are im-proved and the productivity is increased. This applies especially to robotwelding in shipbuilding [25, 23, 24] where large structures are welded,including the joining of large double-hull sections.
1.2 Seam tracking
Seam tracking [5, 7, 8, 12, 19] is essential for automation in shipbuildingfor manufacturing of large passenger and cargo ships, such as super-cruisers and oil-tankers, where high tolerances in the sheet material areallowed to minimize manufacturing costs.
A great number of Sensor Guided Robot Control (SGRC) systems forseam tracking at arc welding have been developed. The patents withinthis application area during the last 40 years indicates that a there is aclear tendency that old methods using mechanical, inductive, electricaland infrared sensors are becoming less important along with the use of
2
electron beams, cameras and optical lens systems. Today laser scannersand arc-sensors mainly replace these systems.
The difference between systems based on laser scanners and arc-sensors is accuracy, geometry and price. Laser scanners provide for amore accurate signal than arc-sensors, which contain much noise due tothe interference of the welding process. On the other hand, laser scan-ners have to be mounted on the torch, decreasing the workspace of therobot. Laser scanners are also significantly more expensive than arc-sensors, which perhaps is one of the reasons why the majority of thepatents that have been issued during the last 10 years within this appli-cation area [26, 3, 27, 17, 16] are based on through-arc sensing, whilesystems based on laser scanners are hardly even represented.
1.3 Process control
Besides the geometry of the seam, considerations has to be made in seamtracking of the process-related welding parameters [29, 1]. The weldingprocess contains many parameters, such as the arc voltage, wire-speedand wire material. The aim is to determine feasible parameters for awelding procedure before seam tracking. This may be done by the per-formance of experiments or the use of knowledge based systems [4, 28].If it is however not possible or desirable to keep these settings constantthrough the entire seam [14, 15, 18, 27], for instance due to the char-acteristics of the power-source, adaptive control may be introduced intothe seam tracking procedure for maintaining the desired welding quality.
1.4 Through-arc sensing
The usual methods used for automated arc welding are gas metal arcwelding (GMAW), flux-cored arc welding (FCAW) and submerged arc weld-ing (SAW). In GMAW, metal parts are joined together by heating themwith an arc established between a continuous, consumable filler metalelectrode and the workpiece. The filler metal is either transferred tothe workpiece in discrete drops under the influence of electromagneticforces and gravity or in the form of molten electrode produced by repet-itive short-circuiting.
Through-arc sensing was introduced in the beginning of the 80th andis described by among others G. E. Cook et al. [9]. According to exper-imental results, the approximate relationship between the arc voltageV , the arc current I and the nearest distance between the electrode and
3
55555555555555555555555555555555555555555555555555555555555555555555555555555555555555555555555555555555555555555555555555555555555555555555555555555555555555555555555555555555555555555555555555555555555555555555555555555555555555555555555555555555555555555555555555555555555555555555555555555555555555555555555555555555555555555555555555555555555555555555555555555555555555555555555555555555555555555555555555555555555555555555555555555555555555555555555555555555555555555555555555555555555555555555555555555555555555555555555555555555555555555555555555555555555555555555555555555555555555555555555555555555555555555555555555555555555555555555555555
nk
x
y
z
Ωk
okak
TCP
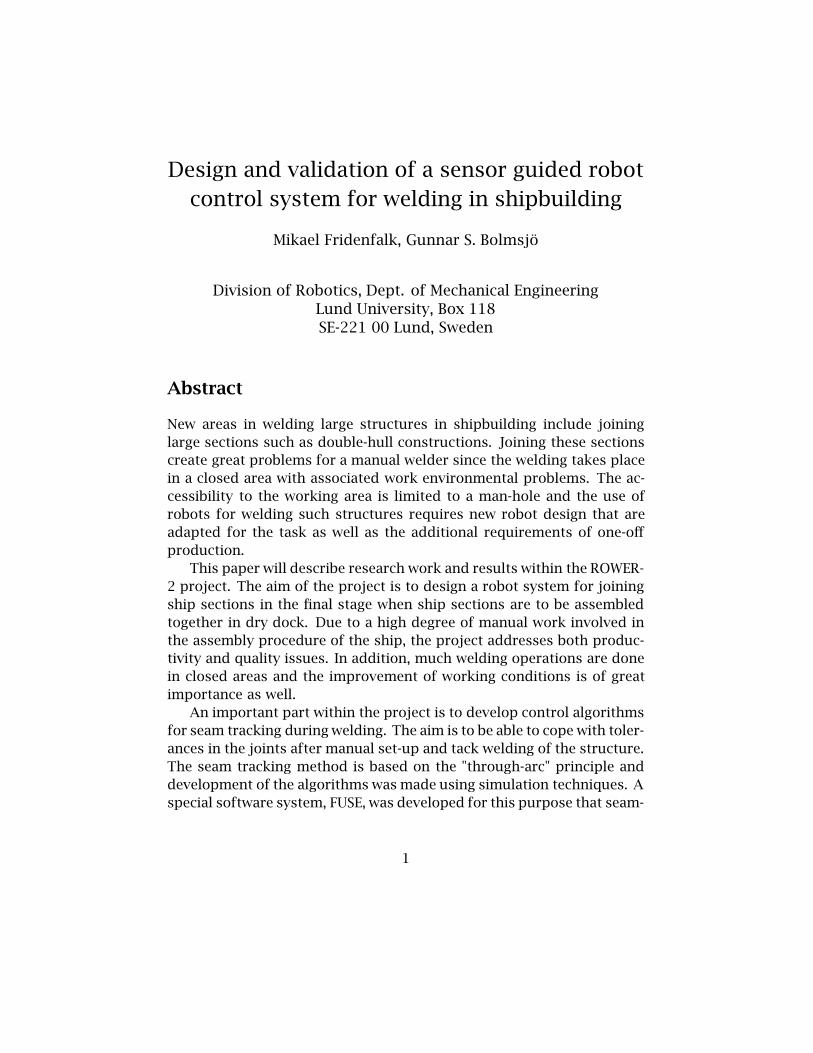
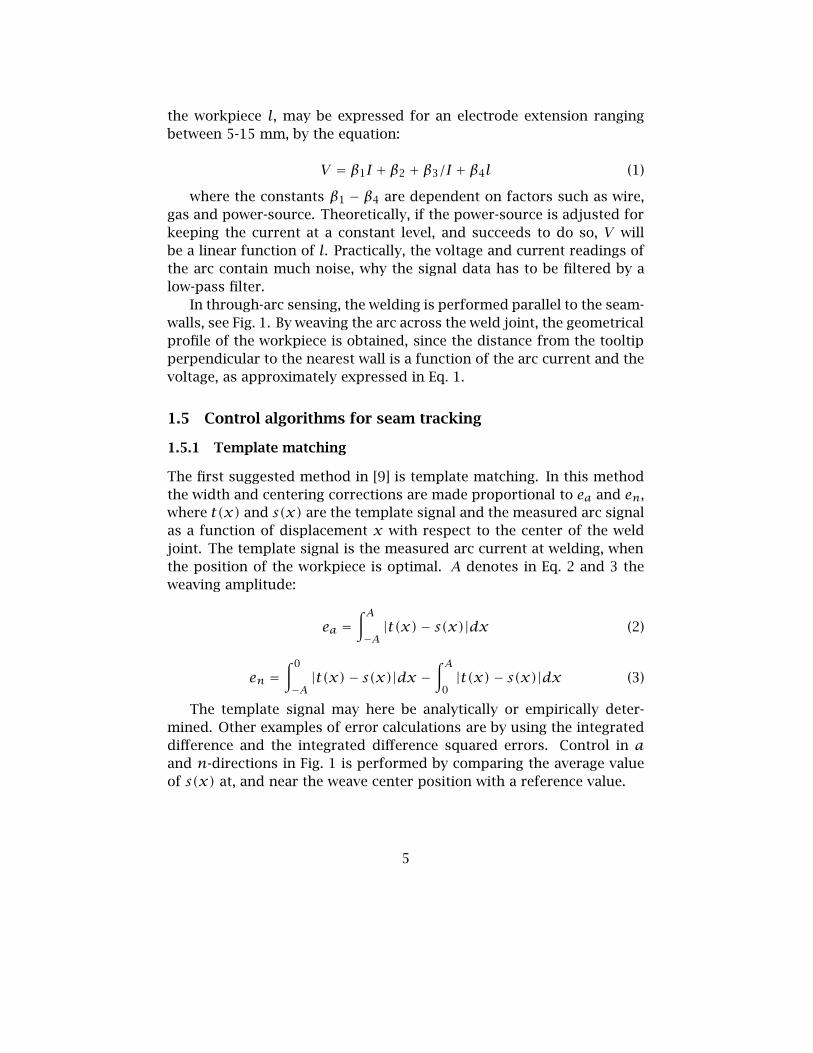
Figure 1: Seam tracking setup. Definition of the coordinate systems of theworkpiece and the Tool Center Point (TCP). The ak is called the approachaxis and coincides with the welding wire. Surface Ωk is per definitionalways perpendicular to ok.
4
the workpiece l, may be expressed for an electrode extension rangingbetween 5-15 mm, by the equation:
V = β1I + β2 + β3/I + β4l (1)
where the constants β1 − β4 are dependent on factors such as wire,gas and power-source. Theoretically, if the power-source is adjusted forkeeping the current at a constant level, and succeeds to do so, V willbe a linear function of l. Practically, the voltage and current readings ofthe arc contain much noise, why the signal data has to be filtered by alow-pass filter.
In through-arc sensing, the welding is performed parallel to the seam-walls, see Fig. 1. By weaving the arc across the weld joint, the geometricalprofile of the workpiece is obtained, since the distance from the tooltipperpendicular to the nearest wall is a function of the arc current and thevoltage, as approximately expressed in Eq. 1.
1.5 Control algorithms for seam tracking
1.5.1 Template matching
The first suggested method in [9] is template matching. In this methodthe width and centering corrections are made proportional to ea and en,where t(x) and s(x) are the template signal and the measured arc signalas a function of displacement x with respect to the center of the weldjoint. The template signal is the measured arc current at welding, whenthe position of the workpiece is optimal. A denotes in Eq. 2 and 3 theweaving amplitude:
ea =∫ A−A|t(x)− s(x)|dx (2)
en =∫ 0
−A|t(x)− s(x)|dx −
∫ A0|t(x)− s(x)|dx (3)
The template signal may here be analytically or empirically deter-mined. Other examples of error calculations are by using the integrateddifference and the integrated difference squared errors. Control in aand n-directions in Fig. 1 is performed by comparing the average valueof s(x) at, and near the weave center position with a reference value.
5
1.5.2 Differential control
The second method consists of differential control. It is computationallymore simple and has proven to be quite reliable for control in a andn directions. Instead of sampling data during the whole weaving cycle,sampling is only made at the turning points in the weaving trajectory.Measuring the arc-signal, i.e. the current in the case of GMAW, FCAW orSAW, the vertical distance error ea will be proportional to the differencebetween the average current sampled at the center of the oscillation i(0),and the reference current value Iref :
ea = Ka[i(0)− Iref ] (4)
In similar manner, the difference between the two samples is propor-tional to the magnitude of the cross-seam distance error en:
en = Kn[i+A − i−A] (5)
where i+A and i−A are the average measured current at a pair of ad-jacent extreme points. The parameters Ka and Kn are dependent on theweld joint geometry and other process parameters such as shielding gasand wire feed rate. Since these parameters will be known in advancehowever, Ka and Kn may be defined for any welding application.
1.6 Simulation using virtual sensors
Virtual sensors are presently used in many application areas, such asrobotics, aerospace and marine technologies [6, 10, 20, 22]. The develop-ment of new robot systems, such as for seam tracking may be acceleratedby the application of simulation. In general the design methodology ofvirtual sensors may vary due to their specific characteristics. If the char-acteristics are not known for the design of analytical sensor models, ar-tificial neural networks are sometimes used to make approximations ofthe behavior of the sensors [2, 21].
1.7 ROWER-2 application
The objective of the European ROWER-2 project was to automate thewelding process in shipbuilding, more specifically for joining double-hullsections in supercruisers and oil tankers. According to the specificationsthe workers should be able to mount the robot system inside the cell and
6
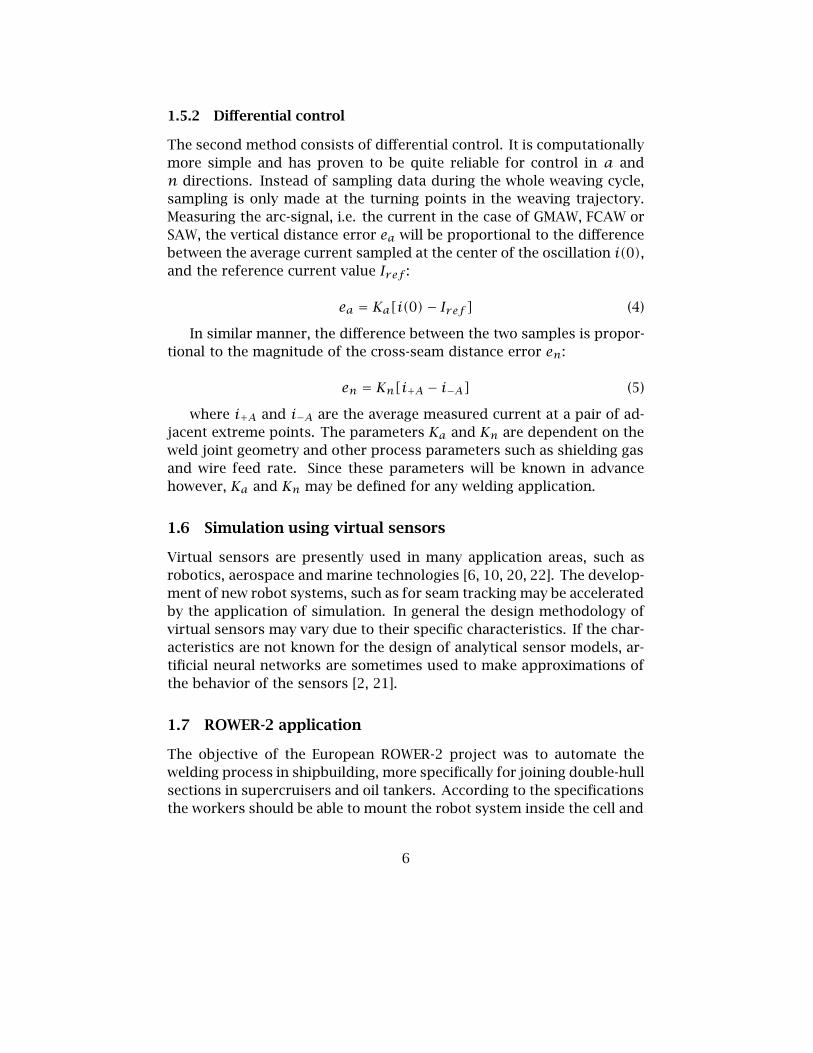
supervise the welding-process from a remote distance. Every hull-cellshould be equipped with a man-hole, through which the robot may betransported, see Fig. 2. Since the robot has to be transported manually,the constraints on the robot are that each part is not allowed to weighmore than 50 kg. Further on, the robot system should be designed tooperate in standard hull-cells with predefined variations in dimension.To be able to meet the specifications, a robot manipulator was built basedhighly on aluminum alloy. The robot was mounted on a mobile platformwith 1 degrees of freedom to increase its workspace.
Figure 2: A double hull-cell in ROWER-2 with man-hole through which therobot equipment is manually transported. One of the walls and the floorhave been excluded from the picture.
The method chosen for automatic welding in the ROWER-2 projectwas GMAW using through the arc-sensing at seam tracking [9]. A simpleseam tracking algorithm was developed at an early stage of the project[13]. By the application of the Flexible Unified Simulation Environment1
(FUSE) [11], this algorithm was optimized and evolved into many new al-gorithms. They were initially designed to contain the basic functionalityof the Yaskawa COM-ARC III sensor [30] but were further developed tomeet the ROWER-2 and other specifications.
Since one of the simple algorithms showed by simulation to meet the
1An integrated software system based on Envision (robot simulator) and Matlab
7
ROWER-2 specifications, it was chosen for implementation in the project.The implementation was performed in C++, running on a QNX-based2
embedded system. The algorithm was further developed to be able tohandle long welds by using linear interpolation. A method was addition-ally developed to compensate for the power-source controller that in-terfered with the seam tracking process by disabling control in negativea-direction of the TCP. An automatic delay detection for synchronizationbetween the control system and the data from the arc-sensor was alsodesigned to secure the control in the n-direction of TCP.
2QNX is an operating system for embedded controllers.
8
2 Material and methods
2.1 Systems development methodology
The methodology is based on the assumption that software developmentin robotics is the part that requires most time, money and effort at de-velopment of robot systems. To optimize the procedure of robot designfrom virtual prototyping and systems development to the final integra-tion of the robot in a production line, a new software system was designedthat can be used during the whole process. FUSE fills the gap that tra-ditionally exists between CAD/CAM/CAE, robot simulation systems andsoftware simulation environments.
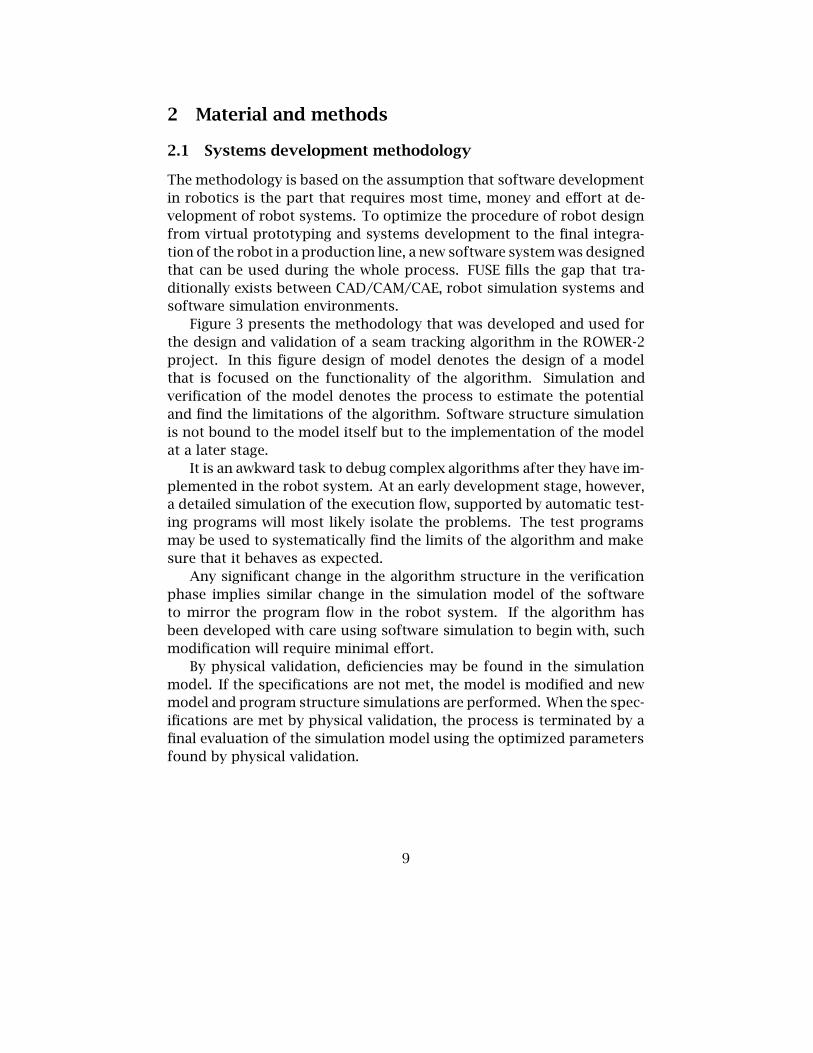
Figure 3 presents the methodology that was developed and used forthe design and validation of a seam tracking algorithm in the ROWER-2project. In this figure design of model denotes the design of a modelthat is focused on the functionality of the algorithm. Simulation andverification of the model denotes the process to estimate the potentialand find the limitations of the algorithm. Software structure simulationis not bound to the model itself but to the implementation of the modelat a later stage.
It is an awkward task to debug complex algorithms after they have im-plemented in the robot system. At an early development stage, however,a detailed simulation of the execution flow, supported by automatic test-ing programs will most likely isolate the problems. The test programsmay be used to systematically find the limits of the algorithm and makesure that it behaves as expected.
Any significant change in the algorithm structure in the verificationphase implies similar change in the simulation model of the softwareto mirror the program flow in the robot system. If the algorithm hasbeen developed with care using software simulation to begin with, suchmodification will require minimal effort.
By physical validation, deficiencies may be found in the simulationmodel. If the specifications are not met, the model is modified and newmodel and program structure simulations are performed. When the spec-ifications are met by physical validation, the process is terminated by afinal evaluation of the simulation model using the optimized parametersfound by physical validation.
9
Yes
No
Design of model based on specifications
Simulation and verification of model
Simulation of software structure
Evaluation of simulation model
Are the specifications met?
Implementation ofsoftware code in C++
Physical experiments and validation
QN
XE
XP
FU
SE
FU
SE
FU
SE
FU
SE
Figure 3: The methodology developed for the design and physical valida-tion of the seam tracking algorithm in the ROWER-2 project.
10
2.2 Joint profiles
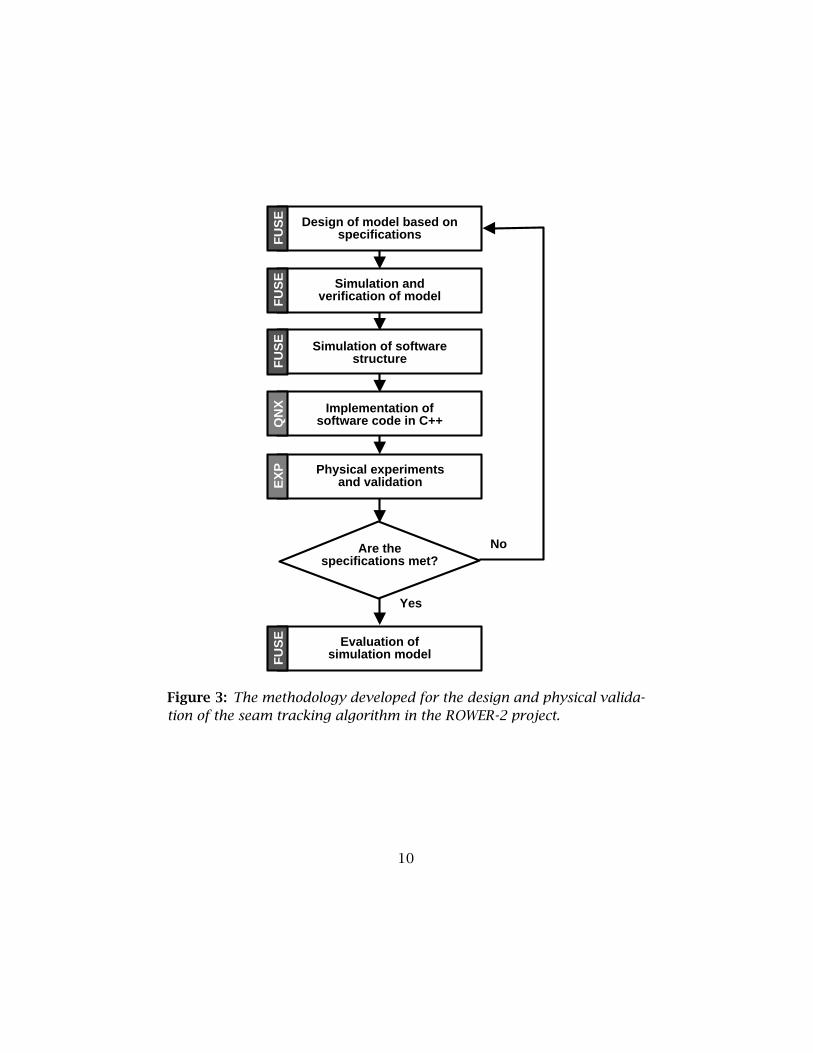
The simulation was performed on fillet and V-groove joints, according tothe specifications in the ROWER-2 project. Due to the specifications, thealgorithm had to be able to make compensations for a deviation of ±300mm in y and z directions during a 15 m long weld (see Fig. 1 and 4 forthe definition of the coordinate axes). This was redefined as a maximumdeviation of ±20 mm per meter weld, or ±2% expressed in percentage.Profiles of fillet and V-groove joints are presented in Fig. 4. Since thestart point of the seam is always found by image processing before seamtracking is performed, no special consideration has to be taken at start.
3−6 mm
70−1100 20−30 0
Fillet joint
V−groove joint
Plate thickness: 10−15 mm
y
zy
z
Figure 4: Fillet and V-groove joints were used in simulation and physicalvalidation. The lengths of the sample plates in the experiments were 600mm (orthogonal to the plane of the figure).
2.3 Experimental setup
The functionality of the seam tracking model and the essential featuresof the program structure were simulated in FUSE using SGI workstationsand manually translated to C++ for implementation in the robot systemrunning on QNX OS, using a real-time industrial PC. As power-source forwelding, a Migatronic BDH STB Pulse Sync 400 for MIG/MAG was chosenoperating together with a Planetics Mars-501 push-pull unit. Accordingto specifications the push-pull unit is suited for welding cables up to25 meters between the units and another 16 meters between the pullunit and the welding torch. OK Autrod 12.51 was used as welding wire
11
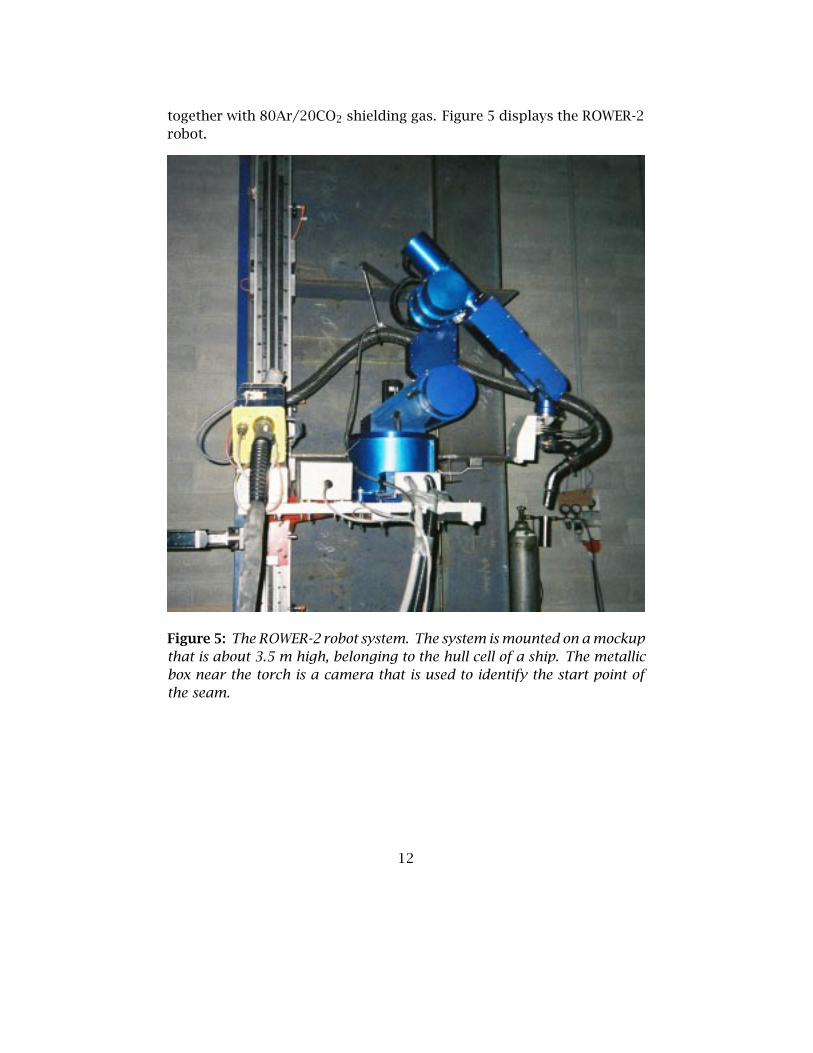
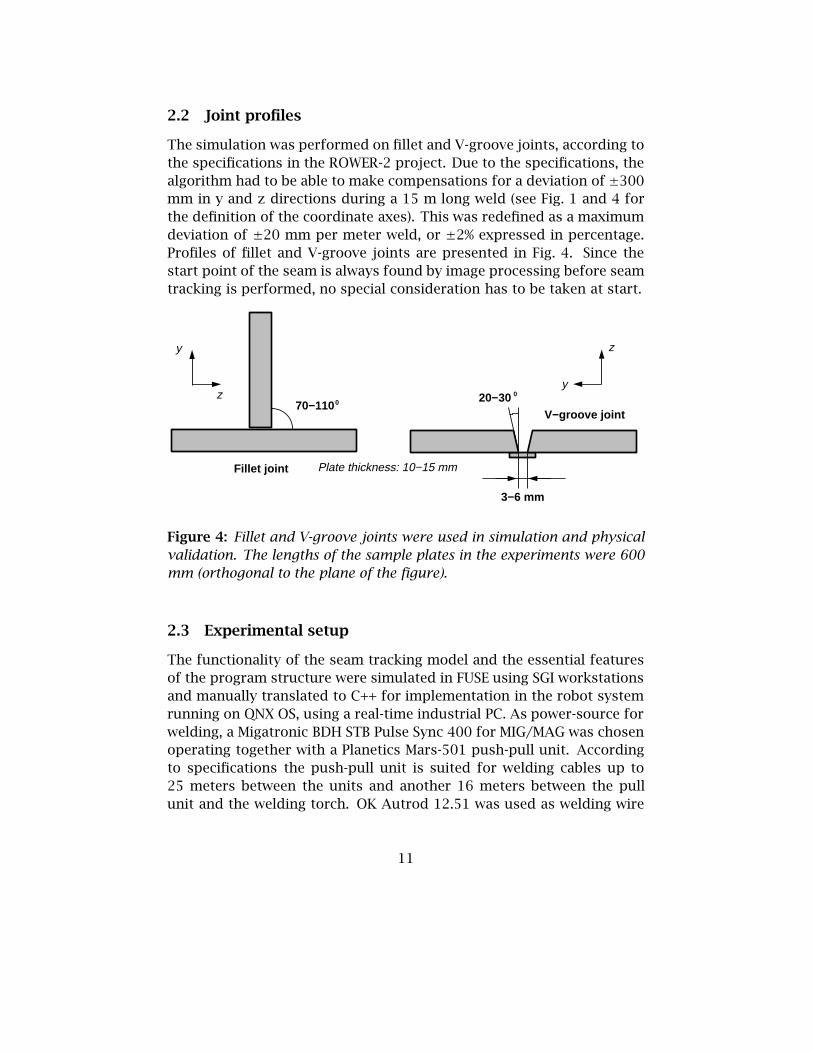
together with 80Ar/20CO2 shielding gas. Figure 5 displays the ROWER-2robot.
Figure 5: The ROWER-2 robot system. The system is mounted on a mockupthat is about 3.5 m high, belonging to the hull cell of a ship. The metallicbox near the torch is a camera that is used to identify the start point ofthe seam.
12
3 Experimental results
3.1 Simulation experiments
3.1.1 Overview
A number of seam tracking algorithms were developed and implementedin FUSE. The differential algorithm, which was considered to be the eas-iest one to implement and required the lowest amount o computationalpower yet satisfying the ROWER-2 specifications, was chosen for imple-mentation and physical validation in the ROWER-2 project. The simula-tion and validation work presented in this section is based on the differ-ential algorithm presented in the introduction.
3.1.2 FUSE simulations
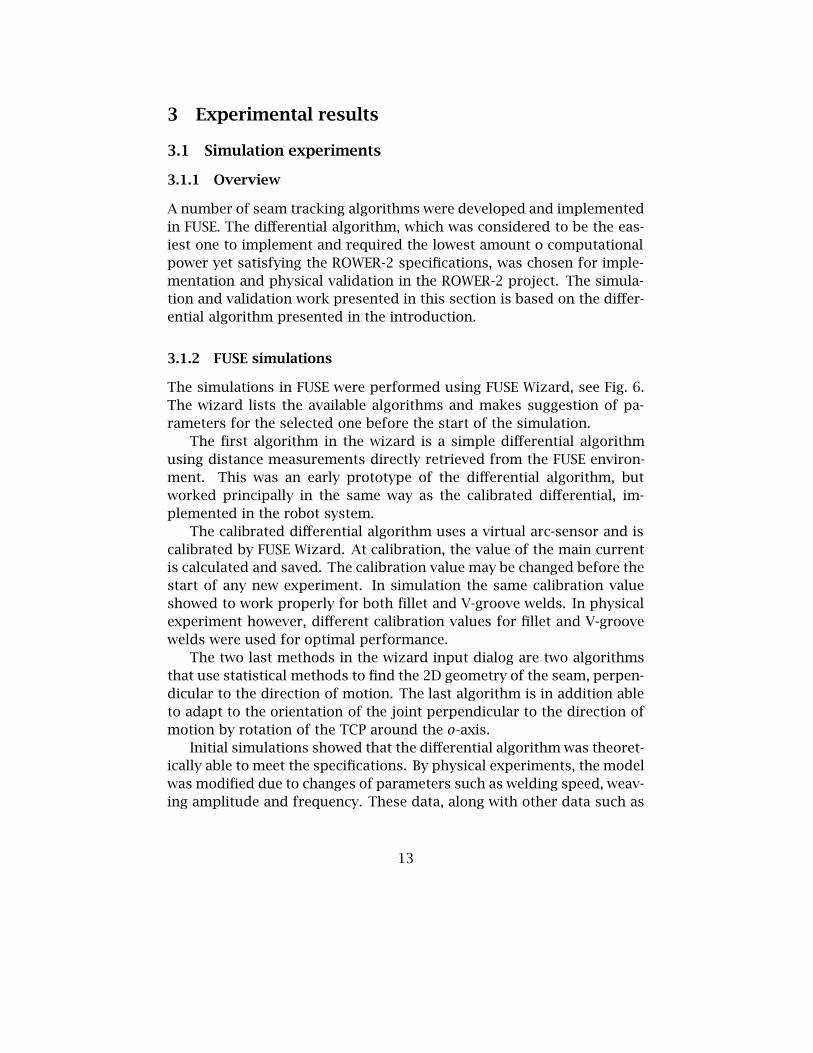
The simulations in FUSE were performed using FUSE Wizard, see Fig. 6.The wizard lists the available algorithms and makes suggestion of pa-rameters for the selected one before the start of the simulation.
The first algorithm in the wizard is a simple differential algorithmusing distance measurements directly retrieved from the FUSE environ-ment. This was an early prototype of the differential algorithm, butworked principally in the same way as the calibrated differential, im-plemented in the robot system.
The calibrated differential algorithm uses a virtual arc-sensor and iscalibrated by FUSE Wizard. At calibration, the value of the main currentis calculated and saved. The calibration value may be changed before thestart of any new experiment. In simulation the same calibration valueshowed to work properly for both fillet and V-groove welds. In physicalexperiment however, different calibration values for fillet and V-groovewelds were used for optimal performance.
The two last methods in the wizard input dialog are two algorithmsthat use statistical methods to find the 2D geometry of the seam, perpen-dicular to the direction of motion. The last algorithm is in addition ableto adapt to the orientation of the joint perpendicular to the direction ofmotion by rotation of the TCP around the o-axis.
Initial simulations showed that the differential algorithm was theoret-ically able to meet the specifications. By physical experiments, the modelwas modified due to changes of parameters such as welding speed, weav-ing amplitude and frequency. These data, along with other data such as
13
⇒
Figure 6: The FUSE Wizard. For each algorithm a special set of param-eters is suggested that may be modified by user input before simulation.New algorithms may be added or removed from the list throughout thedevelopment process.
14
nominal voltage, were optimized by a series of tests performed by an ex-perienced welding specialist tuning the welding system. To evaluate thesimulation model compared to real experiments, a final series of simula-tions were performed using the power-source parameters that had shownto give high quality welds.
According to the evaluation, the theoretical limits for the algorithmis a deviation in the interval between –10% and 30% with Ka = 0.01 andKn = .005. This is better than ±2% (specifications). The conclusion isthat the ideal case, when the current has very low amount of noise, andEq. 1 is valid, the maximum allowed deviation is ±20% (moving the off-set of the nominal welding trajectory to the middle). The asymmetricalperformance (–10% to 30%) is most likely related to the present controlsystem. A closer study of this phenomenon was however never made.
Figures 7-17 present a few simulations performed for evaluation pur-pose after the verification of the algorithm by series of real experiments.In all these experiments, Kn were 50% of Ka, which is an empirically de-rived optimal value verified by robot welding experiments.
The criterion for a good weld is that the final result should at ocularexamination be similar to a straight weld without seam tracking. To beable to produce such result, the instability that occurred during SGRC wasminimized by using gains that made it possible to meet the specifications.
At too low gains, the algorithm does not make compensation enoughto meet a specific deviation. On the other hand, if the gain is too large,instability will occur resulting in low welding quality. So the trick is tofind the largest gains for Ka and Kn both at positive and negative de-viations and both for fillet weld and V-groove welds at which the seamtracking remains stable and converges smoothly to the seam. At thesegains the maximum possible deviations are found by experimentally in-creasing the deviation step by step until the algorithm has reached thelimits of its performance.
3.1.3 Vector booster method
To increase the performance of the algorithm, a feature called the vec-tor booster was implemented. The vector booster method consists of apre-calculation of seam direction at the beginning of seam tracking andsubsequent alteration of nominal trajectory according to the initial prog-nosis for the rest of the seam.
This method showed to increase the performance of the algorithm bya factor of up to two. The vector booster is not optimized for dealing
15
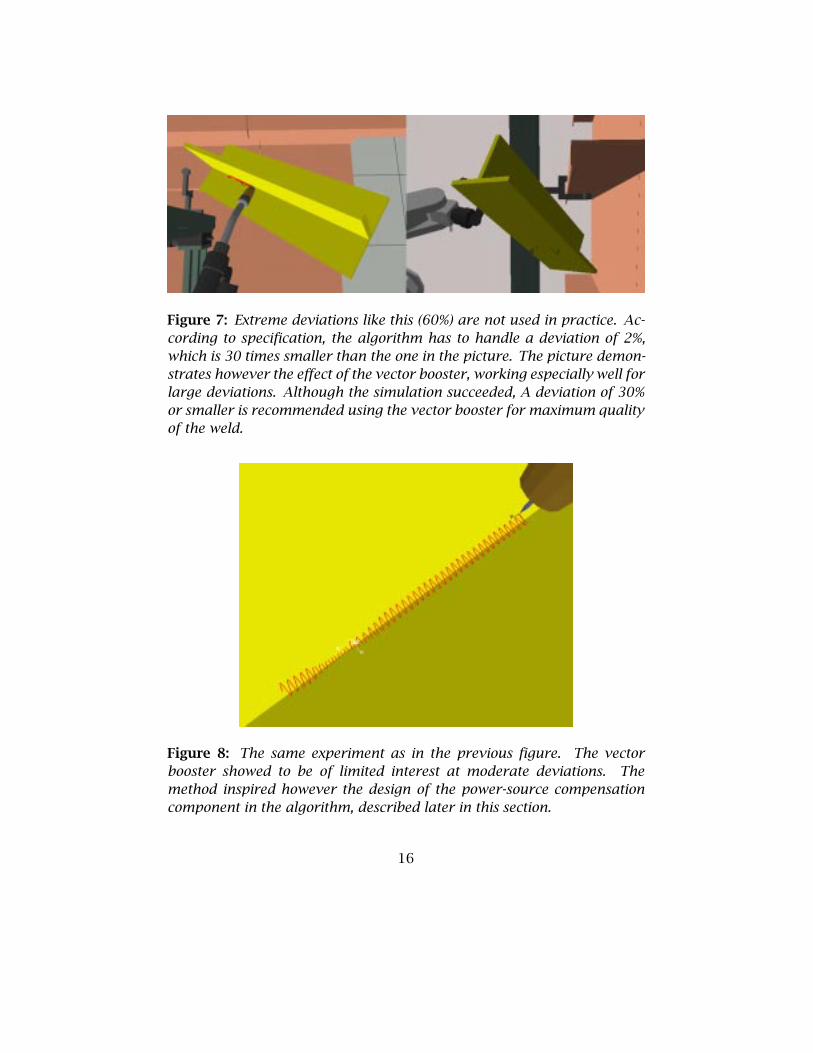
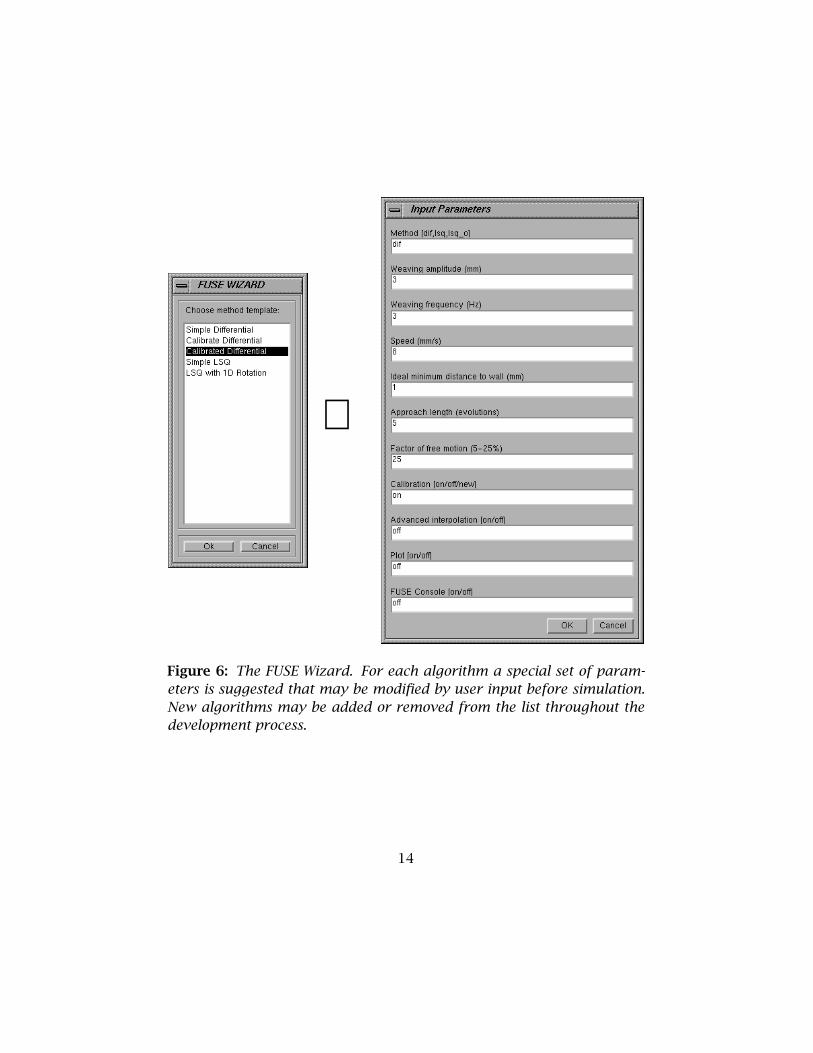
Figure 7: Extreme deviations like this (60%) are not used in practice. Ac-cording to specification, the algorithm has to handle a deviation of 2%,which is 30 times smaller than the one in the picture. The picture demon-strates however the effect of the vector booster, working especially well forlarge deviations. Although the simulation succeeded, A deviation of 30%or smaller is recommended using the vector booster for maximum qualityof the weld.
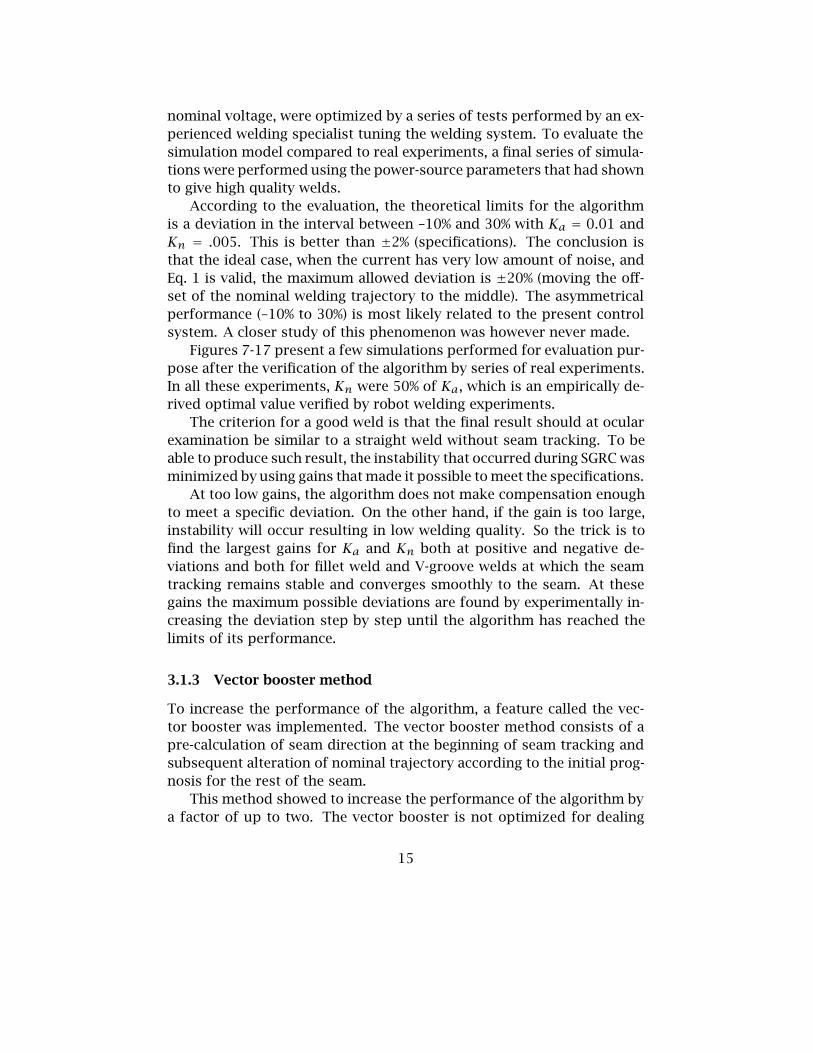
Figure 8: The same experiment as in the previous figure. The vectorbooster showed to be of limited interest at moderate deviations. Themethod inspired however the design of the power-source compensationcomponent in the algorithm, described later in this section.
16
with small deviations, but rather extreme deviations, many times largerthan the specifications, see Figs. 7-8.
The vector booster does theoretically increase the welding quality atlarge deviations, due to the need of lower gains in the SGRC system. Withlarger expected deviations, higher gains have to be set by the operator.And high SGRC gains may in turn decrease the welding quality due tohigher instability at seam tracking, by causing small oscillations.
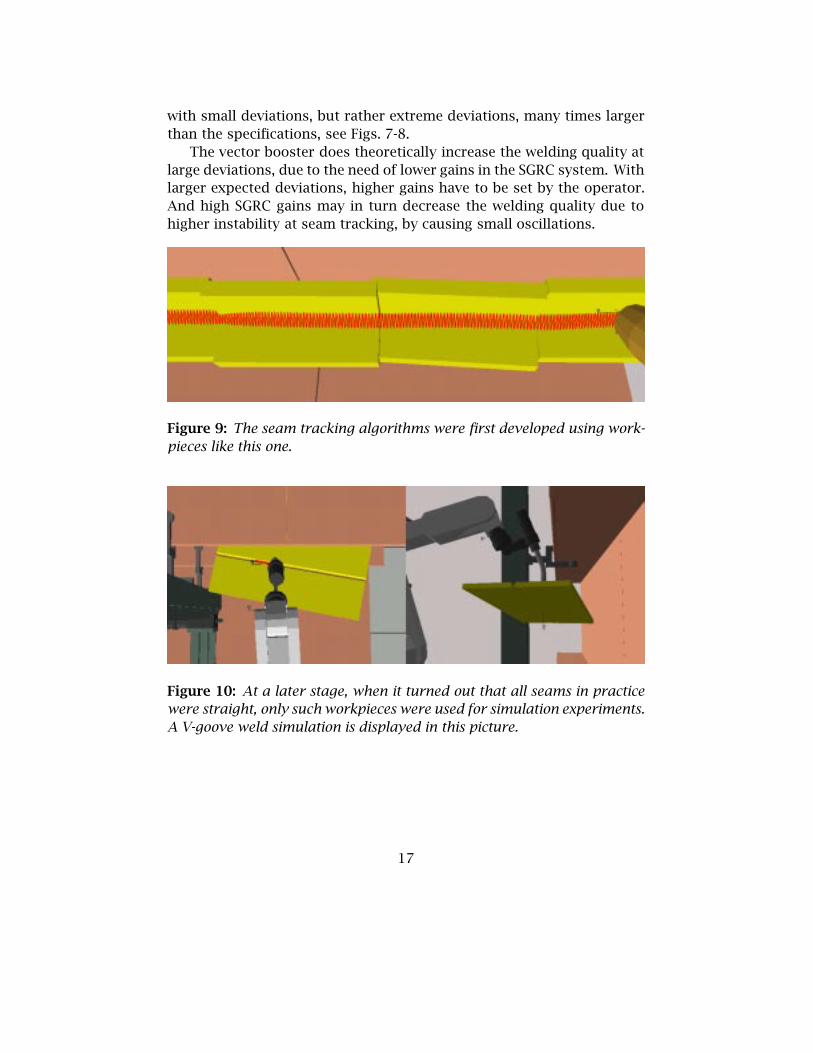
Figure 9: The seam tracking algorithms were first developed using work-pieces like this one.
Figure 10: At a later stage, when it turned out that all seams in practicewere straight, only such workpieces were used for simulation experiments.A V-goove weld simulation is displayed in this picture.
17
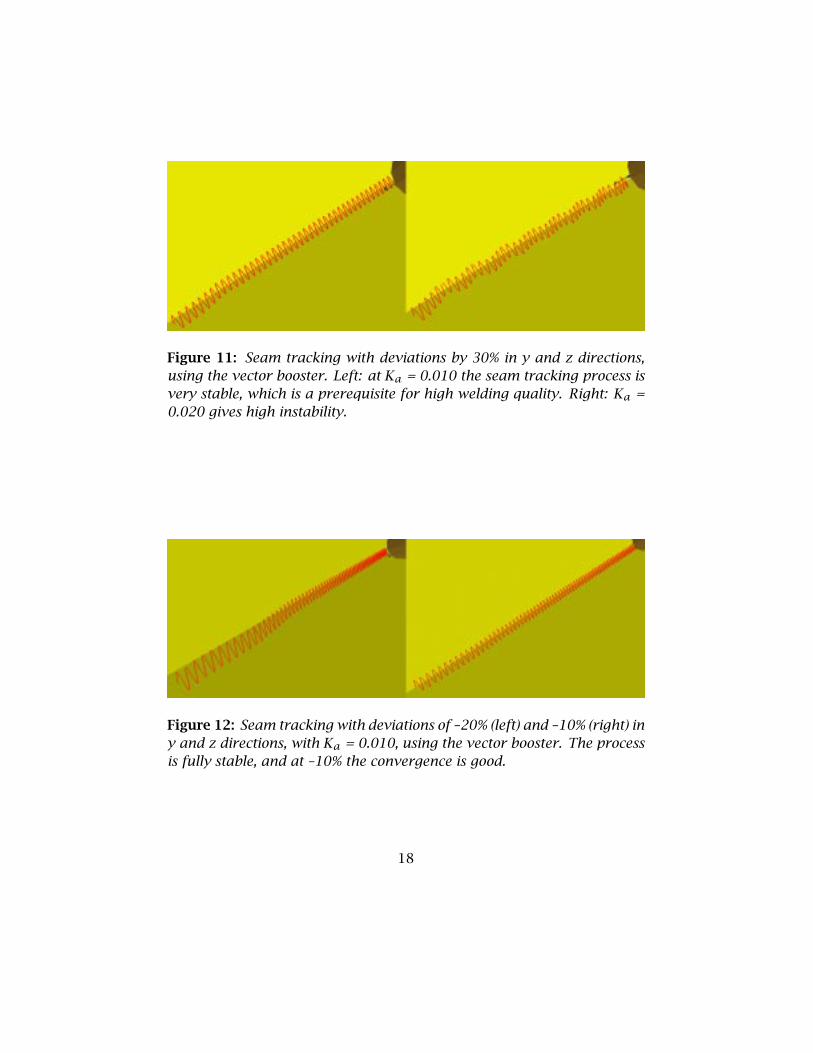
Figure 11: Seam tracking with deviations by 30% in y and z directions,using the vector booster. Left: at Ka = 0.010 the seam tracking process isvery stable, which is a prerequisite for high welding quality. Right: Ka =0.020 gives high instability.
Figure 12: Seam tracking with deviations of –20% (left) and –10% (right) iny and z directions, with Ka = 0.010, using the vector booster. The processis fully stable, and at –10% the convergence is good.
18
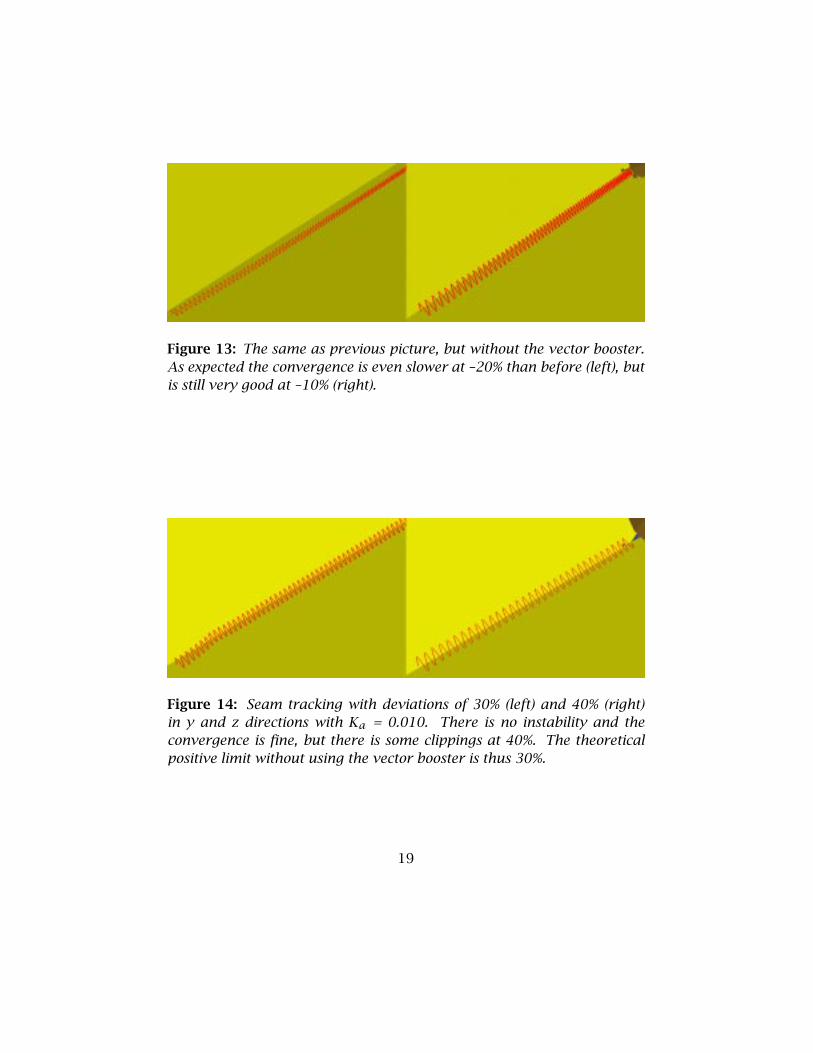
Figure 13: The same as previous picture, but without the vector booster.As expected the convergence is even slower at –20% than before (left), butis still very good at –10% (right).
Figure 14: Seam tracking with deviations of 30% (left) and 40% (right)in y and z directions with Ka = 0.010. There is no instability and theconvergence is fine, but there is some clippings at 40%. The theoreticalpositive limit without using the vector booster is thus 30%.
19
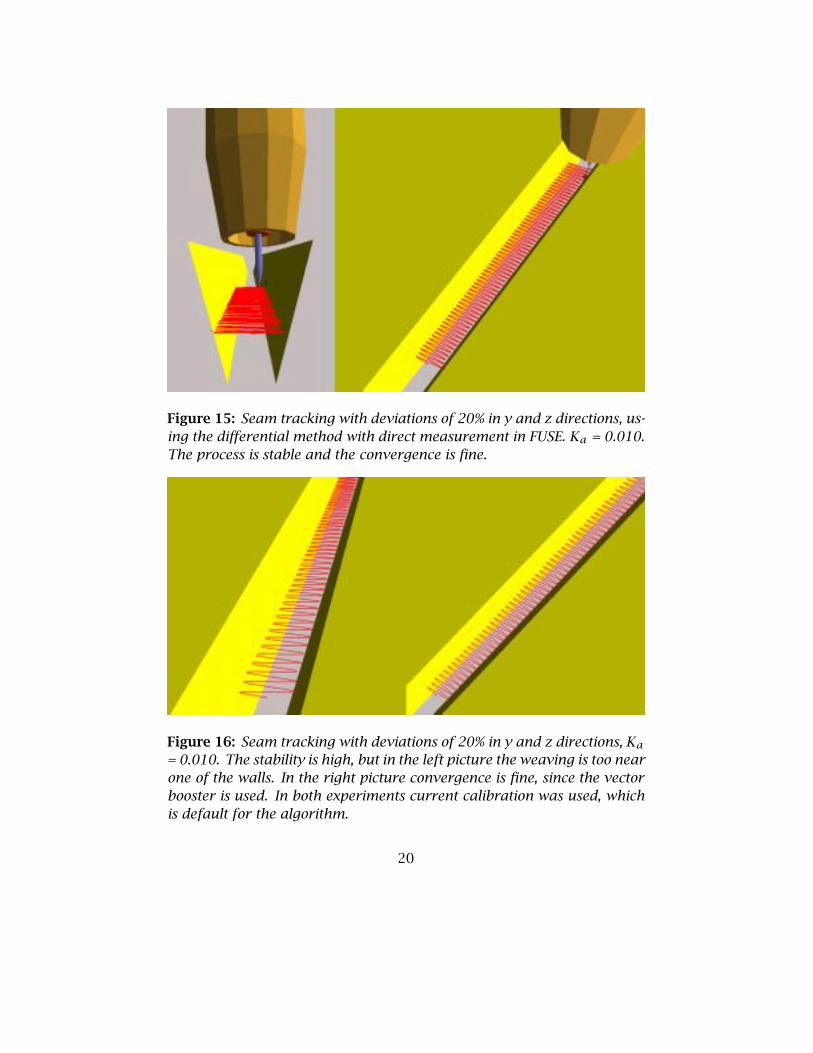
Figure 15: Seam tracking with deviations of 20% in y and z directions, us-ing the differential method with direct measurement in FUSE. Ka = 0.010.The process is stable and the convergence is fine.
Figure 16: Seam tracking with deviations of 20% in y and z directions, Ka= 0.010. The stability is high, but in the left picture the weaving is too nearone of the walls. In the right picture convergence is fine, since the vectorbooster is used. In both experiments current calibration was used, whichis default for the algorithm.
20
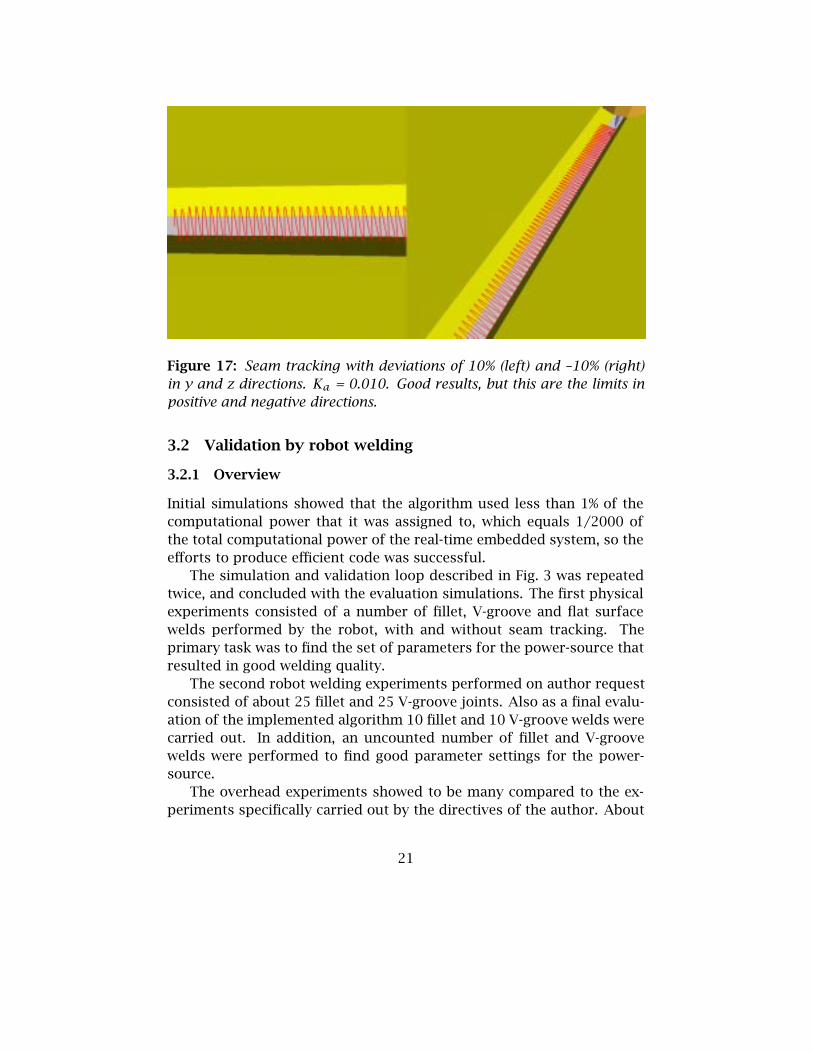
Figure 17: Seam tracking with deviations of 10% (left) and –10% (right)in y and z directions. Ka = 0.010. Good results, but this are the limits inpositive and negative directions.
3.2 Validation by robot welding
3.2.1 Overview
Initial simulations showed that the algorithm used less than 1% of thecomputational power that it was assigned to, which equals 1/2000 ofthe total computational power of the real-time embedded system, so theefforts to produce efficient code was successful.
The simulation and validation loop described in Fig. 3 was repeatedtwice, and concluded with the evaluation simulations. The first physicalexperiments consisted of a number of fillet, V-groove and flat surfacewelds performed by the robot, with and without seam tracking. Theprimary task was to find the set of parameters for the power-source thatresulted in good welding quality.
The second robot welding experiments performed on author requestconsisted of about 25 fillet and 25 V-groove joints. Also as a final evalu-ation of the implemented algorithm 10 fillet and 10 V-groove welds werecarried out. In addition, an uncounted number of fillet and V-groovewelds were performed to find good parameter settings for the power-source.
The overhead experiments showed to be many compared to the ex-periments specifically carried out by the directives of the author. About
21
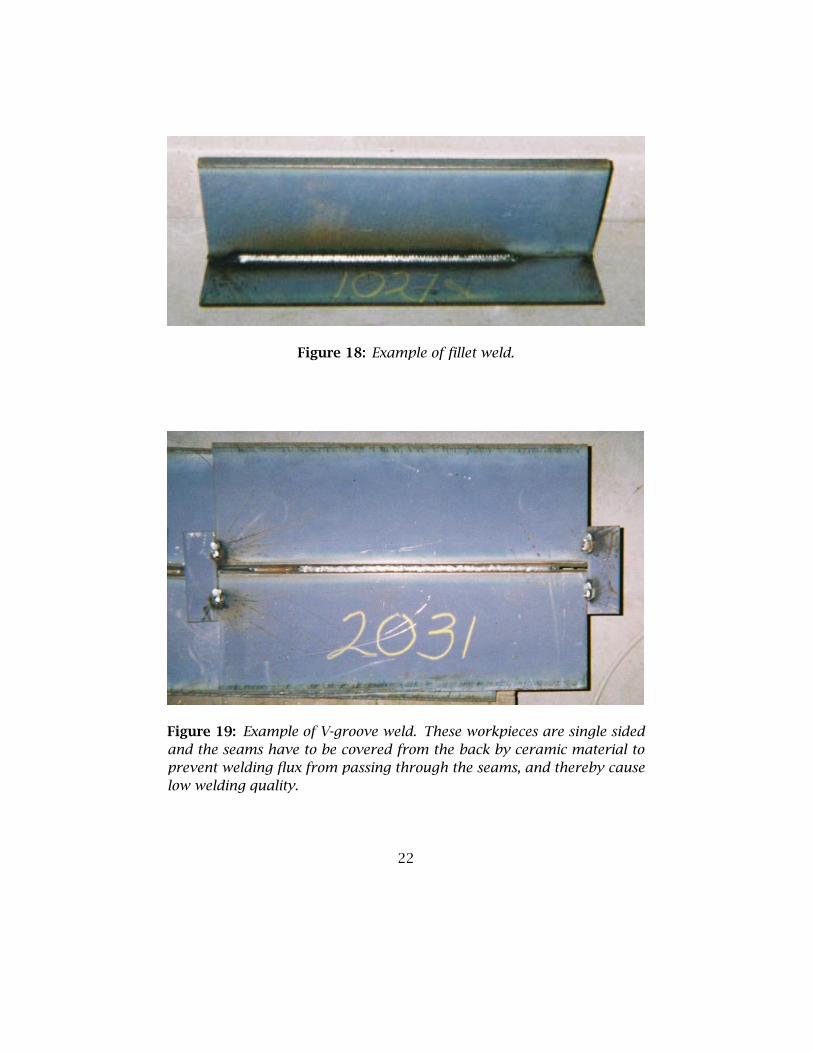
Figure 18: Example of fillet weld.
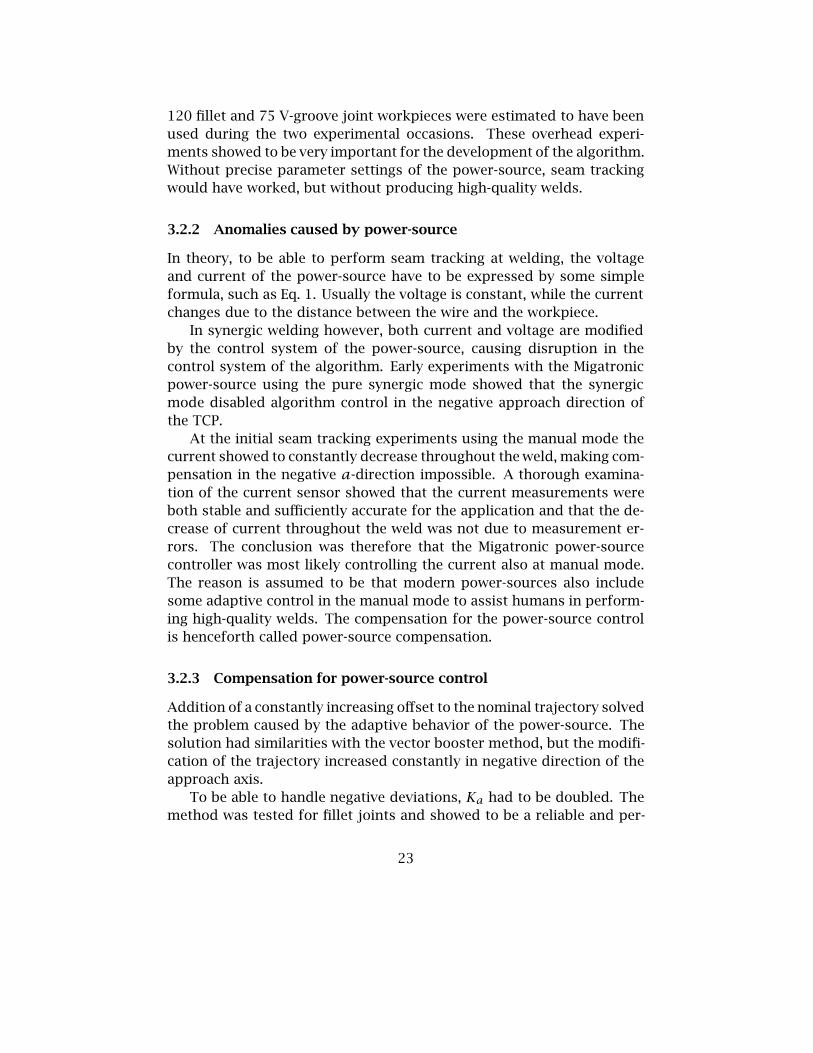
Figure 19: Example of V-groove weld. These workpieces are single sidedand the seams have to be covered from the back by ceramic material toprevent welding flux from passing through the seams, and thereby causelow welding quality.
22
120 fillet and 75 V-groove joint workpieces were estimated to have beenused during the two experimental occasions. These overhead experi-ments showed to be very important for the development of the algorithm.Without precise parameter settings of the power-source, seam trackingwould have worked, but without producing high-quality welds.
3.2.2 Anomalies caused by power-source
In theory, to be able to perform seam tracking at welding, the voltageand current of the power-source have to be expressed by some simpleformula, such as Eq. 1. Usually the voltage is constant, while the currentchanges due to the distance between the wire and the workpiece.
In synergic welding however, both current and voltage are modifiedby the control system of the power-source, causing disruption in thecontrol system of the algorithm. Early experiments with the Migatronicpower-source using the pure synergic mode showed that the synergicmode disabled algorithm control in the negative approach direction ofthe TCP.
At the initial seam tracking experiments using the manual mode thecurrent showed to constantly decrease throughout the weld, making com-pensation in the negative a-direction impossible. A thorough examina-tion of the current sensor showed that the current measurements wereboth stable and sufficiently accurate for the application and that the de-crease of current throughout the weld was not due to measurement er-rors. The conclusion was therefore that the Migatronic power-sourcecontroller was most likely controlling the current also at manual mode.The reason is assumed to be that modern power-sources also includesome adaptive control in the manual mode to assist humans in perform-ing high-quality welds. The compensation for the power-source controlis henceforth called power-source compensation.
3.2.3 Compensation for power-source control
Addition of a constantly increasing offset to the nominal trajectory solvedthe problem caused by the adaptive behavior of the power-source. Thesolution had similarities with the vector booster method, but the modifi-cation of the trajectory increased constantly in negative direction of theapproach axis.
To be able to handle negative deviations, Ka had to be doubled. Themethod was tested for fillet joints and showed to be a reliable and per-
23
manent solution to this problem. Since the same principal is valid forV-groove as fillet welds, no experimental series were considered neces-sary to prove the validity of the power-source compensation for V-groovewelds. Thus the result of the experiments is that an algorithm that the-oretically is able to produce an ideal quality weld, both for fillet andV-groove joints at seam tracking, has been developed and validated.
3.2.4 Power-source parameter settings
The following data was primarily acquired and logged during the secondexperimental series consisting of 80 fillet and V-groove experiments:
• objective,
• label,
• Ka, Kn,
• deviations in y and z directions,
• welding speed,
• weaving frequency and amplitude,
• weaving shape, see Fig. 20
• nominal voltage and current,
• wire speed,
• offset magnitude calculated by the vector booster, in x, y and zdirections,
• a detailed description of the results.
The optimal parameters that were experimentally found giving highwelding quality, are presented in Table 1.
3.2.5 Review of fillet welds
Example of typical fillet and V-groove samples are displayed in Figs. 18and 19. Information from these initial experiments was used for themodification of the algorithm, followed by a new series of simulations.Some selected fillet and V-groove experiments are presented by photos
24
Sine Sinesquare Square
Sawtooth Triangle Ellipse
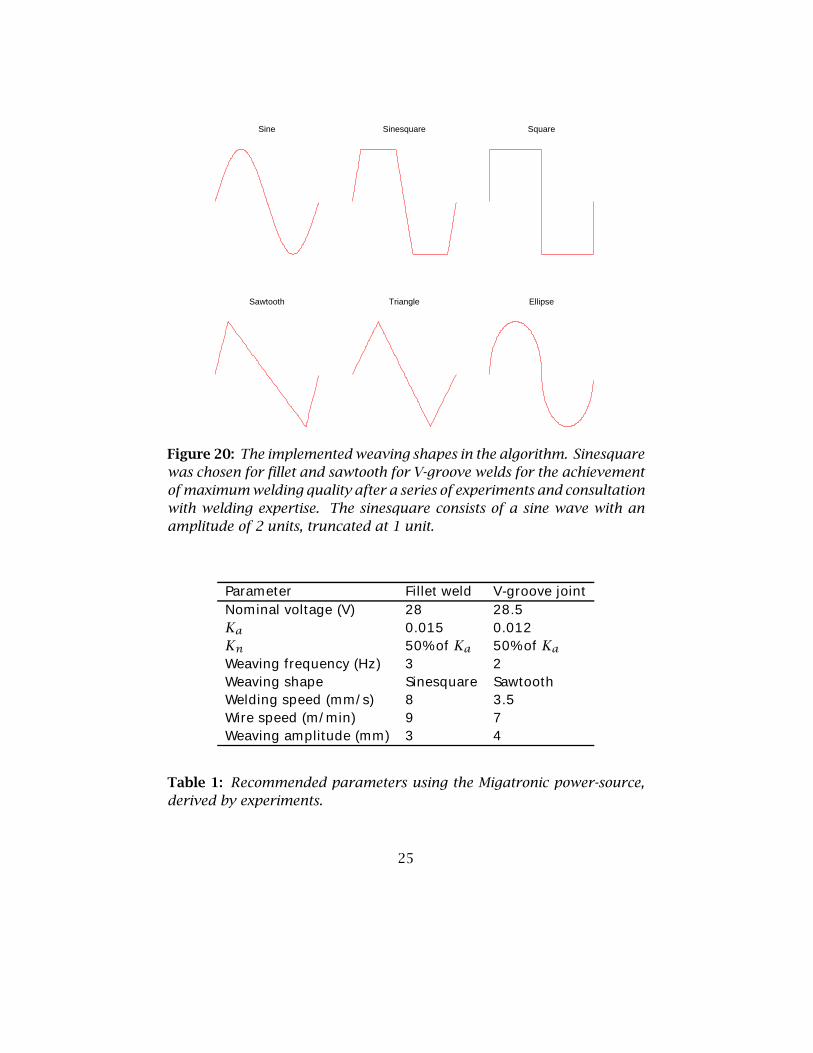
Figure 20: The implemented weaving shapes in the algorithm. Sinesquarewas chosen for fillet and sawtooth for V-groove welds for the achievementof maximum welding quality after a series of experiments and consultationwith welding expertise. The sinesquare consists of a sine wave with anamplitude of 2 units, truncated at 1 unit.
Parameter Fillet weld V-groove jointNominal voltage (V) 28 28.5Ka 0.015 0.012Kn 50% of Ka 50% of KaWeaving frequency (Hz) 3 2Weaving shape Sinesquare SawtoothWelding speed (mm/s) 8 3.5Wire speed (m/min) 9 7Weaving amplitude (mm) 3 4
Table 1: Recommended parameters using the Migatronic power-source,derived by experiments.
25
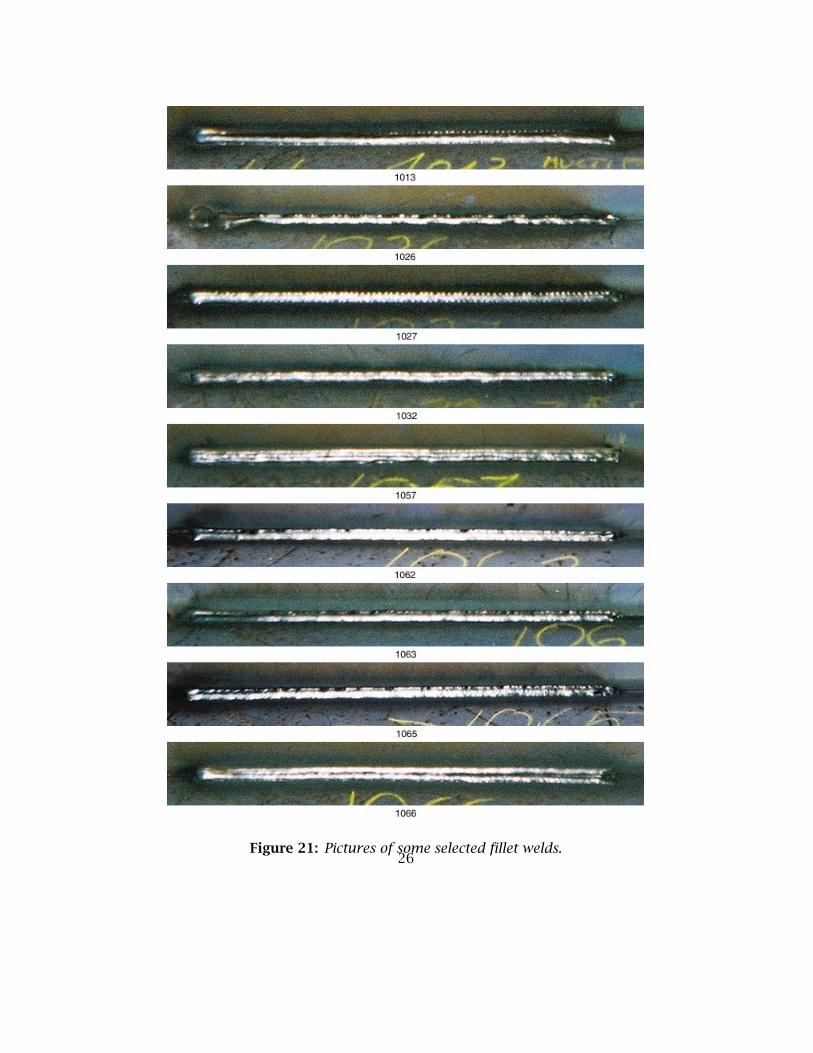
Figure 21: Pictures of some selected fillet welds.26
in Figures 21 and 24. These experiments are further commented andreviewed below.
1013. Seam tracking and deviation in z direction by 8%, followed bymultipass welding. Since the gains and the weaving frequency were toosmall, the seam tracking failed by a deviation of 2.3%. Ka = 0.05, f = 1.5Hz.
1026. Seam tracking and deviation in y direction by 4%. Kn was toohigh and caused oscillations in the n direction, Ka = 0.05, f = 3 Hz.
1027. Reference welding without seamtracking, nearly optimal. f = 3Hz, The distinct edges of the weaving indicate too high nominal voltage,cutting too deep into the workpiece.
1032. Seam tracking and deviation in both y and z directions by 8%each. High welding quality, but this is the limit for positive deviations.Ka = 0.025, f = 3 Hz.
1057. Seam tracking and a deviation of 2% in both y and z directions.High welding quality in both the root layer and multipass layers. Ka =0.0125, f = 3 Hz.
1062. Final test. Seam tracking and a deviation of –2% in y direction,using power-source compensation. High welding quality. Remarks: thestick-out was 3 mm too large at the end of the seam and some instabilityoccurred at the beginning of the seam. Ka = 0.015, f = 3 Hz.
1063. Final test. Seam tracking and a deviation of –2% in both yand z directions (specifications), using power-source compensation. Highwelding quality. Remarks: the stick-out was 3 mm too large throughoutthe seam. Ka = 0.015, f = 3 Hz.
1065. Final test. Seam tracking and a deviation of 2% in both y and zdirections (specifications), using power-source compensation. High weld-ing quality. Remarks: the stick-out was 3 mm too large in the end of theseam. Ka = 0.015, f = 3 Hz.
1066. Final test. Seam tracking and a deviation of 2% in both y andz directions (specifications), using power-source compensation, followedby multipass welding. High welding quality in the root layer. Remarks:the stick-out was 3 mm too large in the end of the seam, which had someeffects for the multipass welding. Due to interference with the root layer,the last of the three layers deviated by 2 mm at the end of the seam fromthe root layer. Ka = 0.015, f = 3 Hz.
Additional information and summary of the selected fillet experi-ments in Fig. 21 follows below:
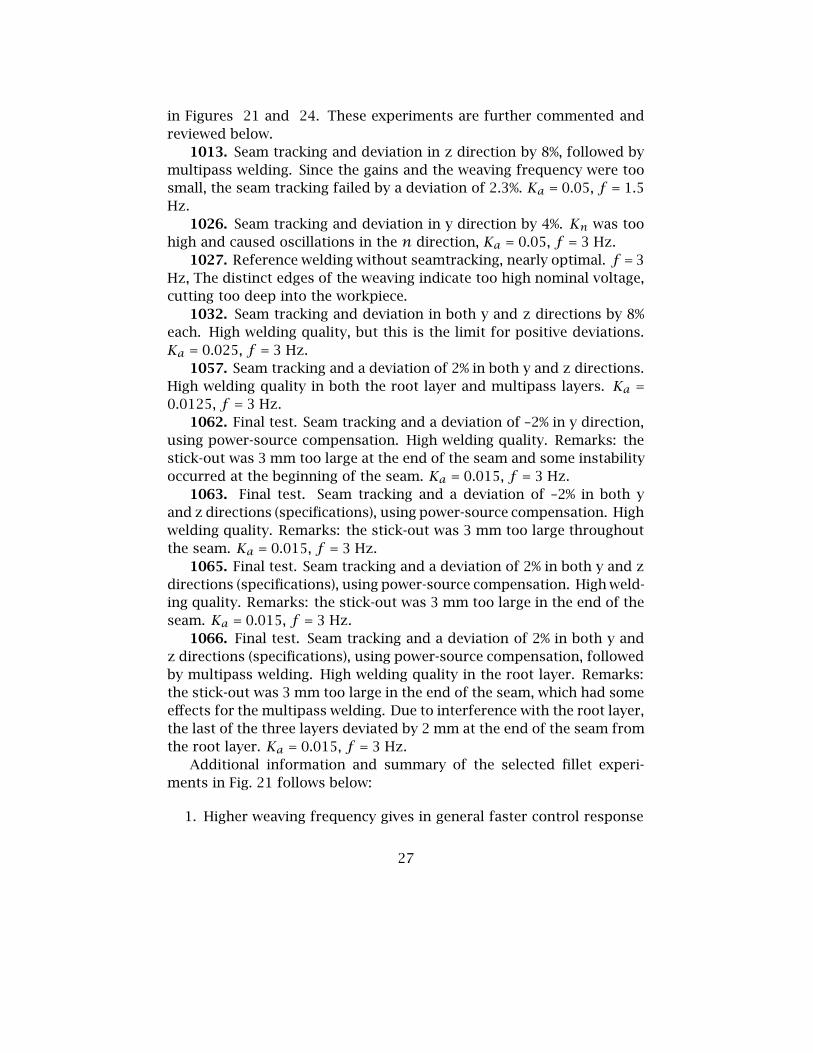
1. Higher weaving frequency gives in general faster control response
27
than lower. When the weaving frequency was increased from 1.5Hz in 1013 to 3 Hz in 1032, the performance of the algorithm wasmore than doubled, where by performance is meant the maximumdeviation error that the algorithm is able to compensate for, whilemaintaining high welding quality.
2. The experiments proved that Kn should be 50% or less than Ka, toavoid unstable control. This fact was previously discovered empir-ically at simulation.
3. In the presented fillet experiments, Kn was 50% of Ka in all casesexcept in 1013 where it was 75%. Due to problems in the newlydeveloped robot system regarding the tuning of motor control, onlya weaving frequency of 2-3 Hz could be used at most. At 3 Hz, theweaving amplitude was not able to exceed 3 mm despite the settingof 5 mm.
4. The fluctuation that occurred in the beginning of the seam in 1062,was due to the automatic calibration method that was applied. Itwas however found that the same main current value could be usedas a reference point in the algorithm for all fillet welds. In futureversions of the algorithm this feature will therefore not be used andthe small fluctuation that sometimes occured in the beginning willbe eliminated.
5. The wire stick-out was sometimes 3 mm larger than desired, ac-cording to the welding specialist. This does not effect the weldingquality in the root layer, but may effect the multi-pass layers, sincethe subsequent layers interfere with the root layer. This interfer-ence is very small, only about 2 mm, but for high welding quality atmultipass the algorithm should be fine-tuned to be able to reducethe stick-out some millimeters. One way to achieve this is to slightlyincrease the main current value. The power-source compensationfactor should also be increased to avoid collision of the torch withthe workpiece.
6. The most important experience from this experimental series wasprobably that the power-source compensation method showed towork properly.
28
0 50 100 150 200 250 3000
200
400
600
800
1000Fillet weld 1057
150 160 170 180 190 200 210 220 230
200
250
300
350
ticks
A
rc c
urre
nt (
A)
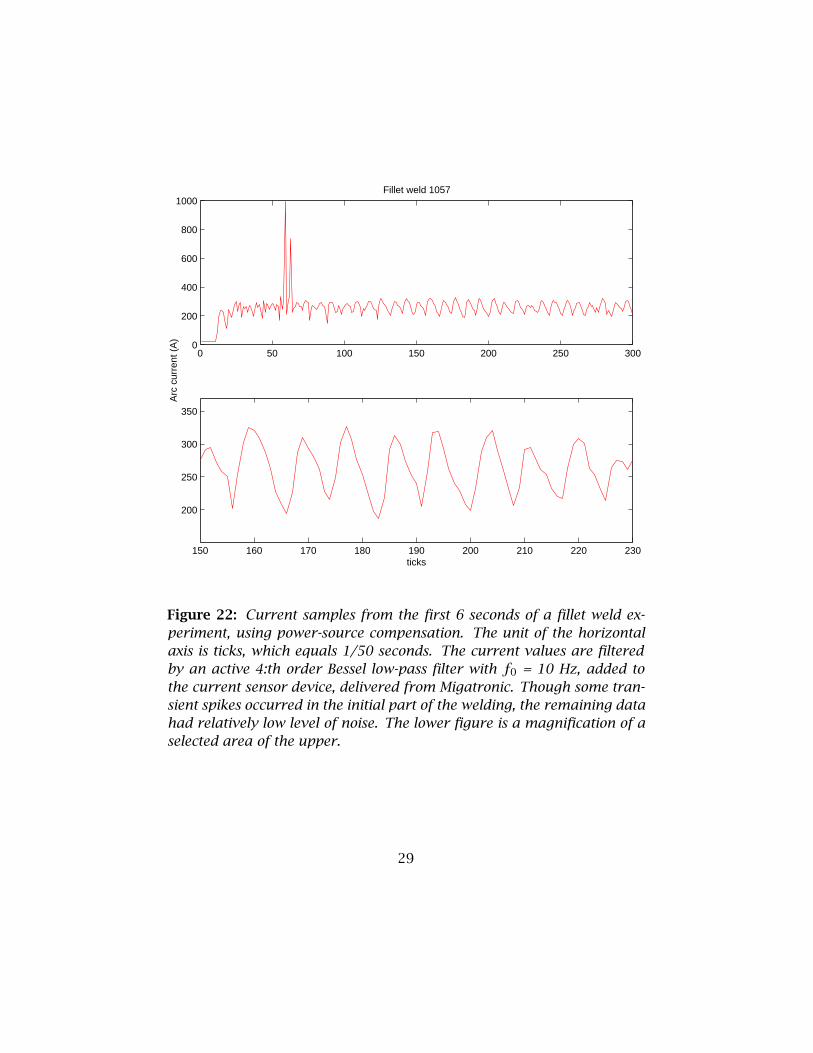
Figure 22: Current samples from the first 6 seconds of a fillet weld ex-periment, using power-source compensation. The unit of the horizontalaxis is ticks, which equals 1/50 seconds. The current values are filteredby an active 4:th order Bessel low-pass filter with f0 = 10 Hz, added tothe current sensor device, delivered from Migatronic. Though some tran-sient spikes occurred in the initial part of the welding, the remaining datahad relatively low level of noise. The lower figure is a magnification of aselected area of the upper.
29
0 50 100 150 200
200
300
400
Fillet weld 1057
0 50 100 150 200
200
300
400
Arc
cur
rent
(A
)
0 50 100 150 200
200
300
400
setpoints
Ia
In1
In2
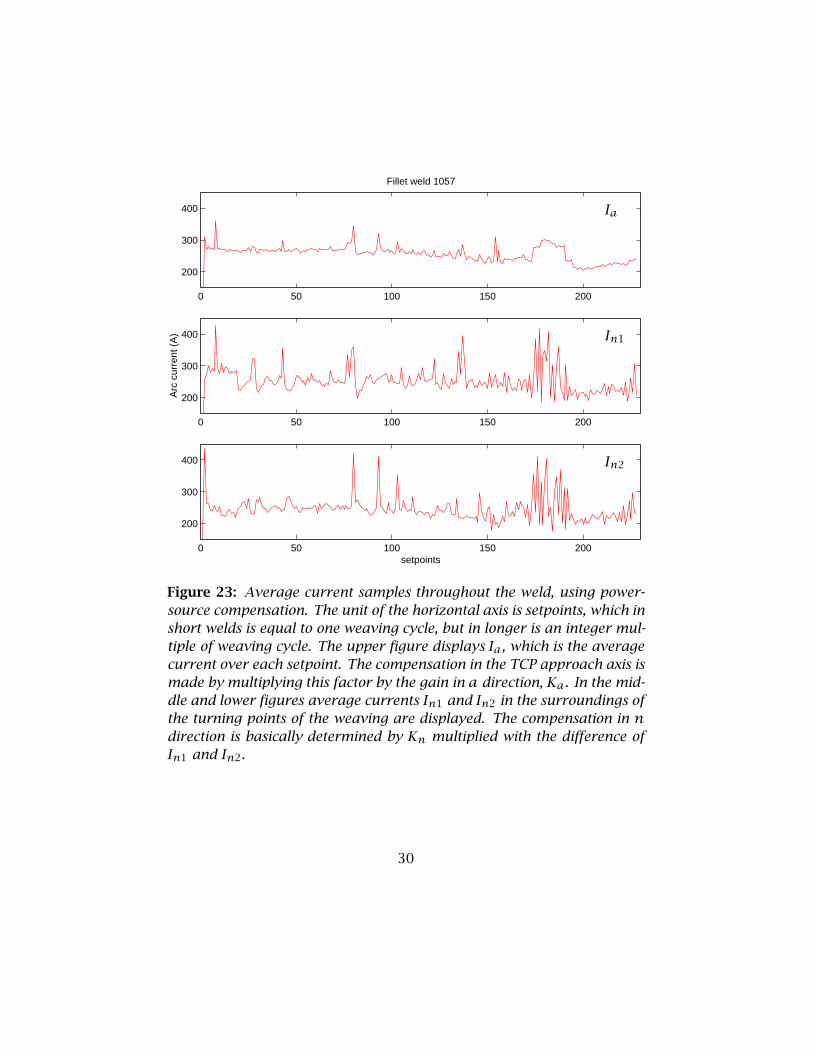
Figure 23: Average current samples throughout the weld, using power-source compensation. The unit of the horizontal axis is setpoints, which inshort welds is equal to one weaving cycle, but in longer is an integer mul-tiple of weaving cycle. The upper figure displays Ia, which is the averagecurrent over each setpoint. The compensation in the TCP approach axis ismade by multiplying this factor by the gain in a direction, Ka. In the mid-dle and lower figures average currents In1 and In2 in the surroundings ofthe turning points of the weaving are displayed. The compensation in ndirection is basically determined by Kn multiplied with the difference ofIn1 and In2.
30
3.2.6 Review of V-groove welds
Below follows comments and a review of the selected V-groove weldingexperiments presented in Fig. 24.
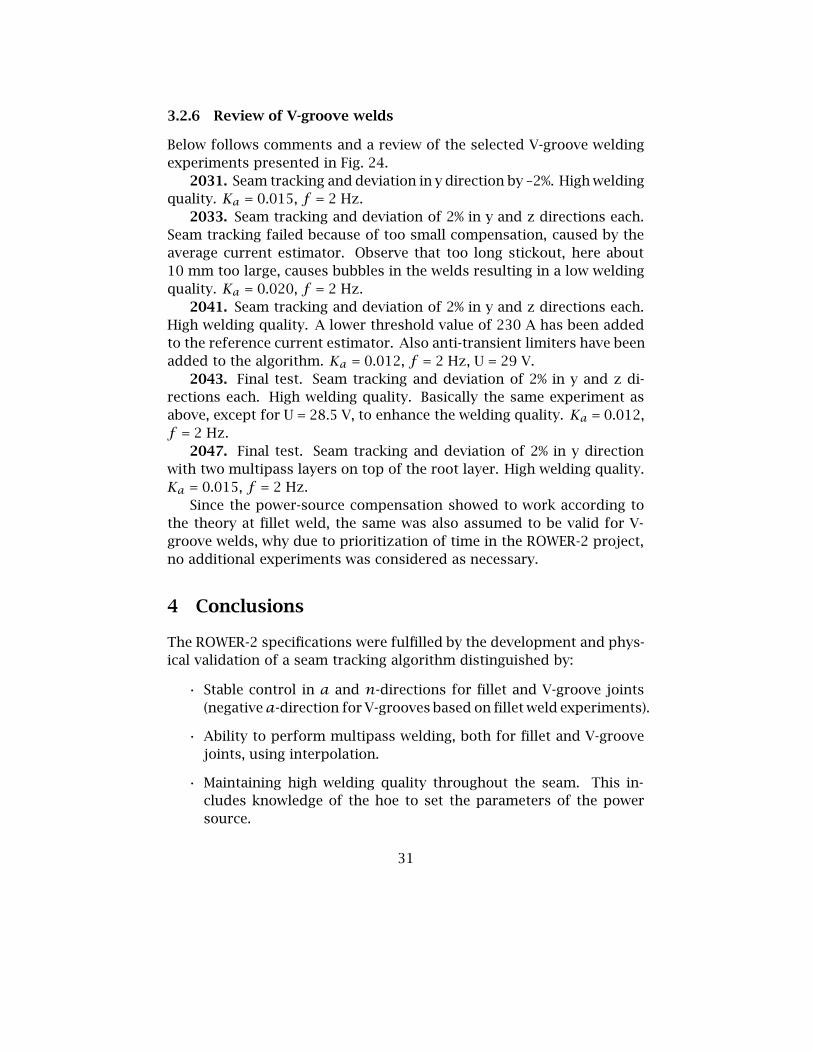
2031. Seam tracking and deviation in y direction by –2%. High weldingquality. Ka = 0.015, f = 2 Hz.
2033. Seam tracking and deviation of 2% in y and z directions each.Seam tracking failed because of too small compensation, caused by theaverage current estimator. Observe that too long stickout, here about10 mm too large, causes bubbles in the welds resulting in a low weldingquality. Ka = 0.020, f = 2 Hz.
2041. Seam tracking and deviation of 2% in y and z directions each.High welding quality. A lower threshold value of 230 A has been addedto the reference current estimator. Also anti-transient limiters have beenadded to the algorithm. Ka = 0.012, f = 2 Hz, U = 29 V.
2043. Final test. Seam tracking and deviation of 2% in y and z di-rections each. High welding quality. Basically the same experiment asabove, except for U = 28.5 V, to enhance the welding quality. Ka = 0.012,f = 2 Hz.
2047. Final test. Seam tracking and deviation of 2% in y directionwith two multipass layers on top of the root layer. High welding quality.Ka = 0.015, f = 2 Hz.
Since the power-source compensation showed to work according tothe theory at fillet weld, the same was also assumed to be valid for V-groove welds, why due to prioritization of time in the ROWER-2 project,no additional experiments was considered as necessary.
4 Conclusions
The ROWER-2 specifications were fulfilled by the development and phys-ical validation of a seam tracking algorithm distinguished by:
• Stable control in a and n-directions for fillet and V-groove joints(negativea-direction for V-grooves based on fillet weld experiments).
• Ability to perform multipass welding, both for fillet and V-groovejoints, using interpolation.
• Maintaining high welding quality throughout the seam. This in-cludes knowledge of the hoe to set the parameters of the powersource.
31
Figure 24: Pictures of some selected V-groove welds.
• Implementation of an auto-phase analyzer, calculating the total de-lay in the robot system, for optimal control. A new version of theFFT algorithm was designed and implemented in the auto-phase an-alyzer. This special version was faster and simpler to implementthan an ordinary FFT for this specific task.
• Implementation of the vector booster method.
• Implementation of automatic current calibration at the start of theweld.
5 Acknowledgements
The ROWER-2 project is funded by European Commission under the BRITE/EURAMprogram.
References
[1] S. Adolfsson. Simulation and execution of autonomous robot systems.PhD thesis, Department of Production and Materials Engineering,Lund University, 1998.
32
[2] M. Arroyo Leon, A. Ruiz Castro, and R. Leal Ascencio. An artificialneural network on a field programmable gate array as a virtual sen-sor. In Design of Mixed-Mode Integrated Circuits and Applications,1999. Third International Workshop on, pages 114–117, July 1999.
[3] P. Berbakov, D. MacLauchlan, and D. Stevens. Edge detection andseam tracking with emats. Patent No. US6155117, December 2000.
[4] G. Bolmsjö. Knowledge based systems in robotized arc welding. InInternational Journal for the Joining of Materials, volume 9 (4), pages139–151, 1997.
[5] G. Bolmsjö. Sensor systems in arc welding. Technical report,Robotics Group, Department of Production and Materials Engineer-ing, Lund University, Sweden, 1997.
[6] G. Bolmsjö. Programming robot welding systems using advancedsimulation tools. In Proceedings of the International Conference onthe Joining of Materials, pages 284–291, Helsingør, Denmark, May16-19 1999.
[7] K. Brink, M. Olsson, and G. Bolmsjö. Increased autonomy in indus-trial robotic systems: A framework. In Journal of Intelligent andRobotic Systems, volume 19, pages 357–373, 1997.
[8] P. Cederberg, M. Olsson, and G. Bolmsjö. A generic sensor interfacein robot simulation and control. In Proceedings of ScandinavianSymposium on Robotics 99, pages 221–230, Oulu, Finland, October14-15 1999.
[9] G. E. Cook, K. Andersen, K. R. Fernandez, M. E. Shepard, and A. M.Wells. Electric arc sensing for robot positioning control. Robot Weld-ing, pages 181–216. Editor: J. D. Lane. IFS Publications Ltd, UK,Springer-Verlag, 1987.
[10] W. Doggett and S. Vazquez. An architecture for real-time interpre-tation and visualization of structural sensor data in a laboratoryenvironment. In Digital Avionics Systems Conferences, 2000. Pro-ceedings. DASC. The 19th, volume 2, pages 6D2/1–6D2/8, Oct. 2000.
[11] M. Fridenfalk and G. Bolmsjö. The Unified Simulation Environment- Envision telerobotics and Matlab merged in one application. In theProceedings of the Nordic Matlab Conference, pages 177–181, Oslo,Norway, October 2001.
33

[12] M. Fridenfalk, U. Lorentzon, and G. Bolmsjö. Virtual prototyping andexperience of modular robotics design based on user involvement.In the Proceedings of the 5th European Conference for the Advance-ment of Assistive Technology, Düsseldorf, Germany, Nov. 1999.
[13] M. Fridenfalk, M. Olsson, and G. Bolmsjö. Simulation based designof a robotic welding system. In Proceedings of the ScandinavianSymposium on Robotics 99, pages 271–280, Oulu, Finland, October14-15 1999.
[14] G. Ågren and P. Hedenborg. Integration of sensors for robot andwelding power supply control. In Proceedings of Fifth InternationalWelding Computerization Conference, pages 198–204, Golden, USA(AWS), August 1994.
[15] P. Hedenborg and G. Bolmsjö. Task control in robotics arc weldingby use of sensors. In Proceedings of the Tampere International Con-ference on Machine Automation - Mechatronics Spells Profitability,IFAC/IEEE, pages 437–445, Tempre, Finland, February 15-18 1994.
[16] K. Hedengren and K. Haefner. Seam-tracking apparatus for a weldingsystem employing an array of eddy current elements. Patent No.US5463201, October 1995.
[17] J. Huissoon and D. Strauss. System and method for tracking a fea-ture on an object using a redundant axis. Patent No. US5465037,November 1995.
[18] L.-O. Larsson and G. Bolmsjö. A model of optical observable parame-ters to control robotic GMA welding in sheet steel. In Proceedings ofthe Fifth International Conference on Computer Technology in Weld-ing, pages 2–10, paper 42, Paris, France, June 15-16 1994.
[19] M. Olsson. Simulation and execution of autonomous robot systems.PhD thesis, Division of Robotics, Department of Mechanical Engi-neering, Lund University, 2002.
[20] M. Oosterom and R. Babuska. Virtual sensor for fault detection andisolation in flight control systems - fuzzy modeling approach. InDecision and Control, 2000. Proceedings of the 39th IEEE Conferenceon, volume 3, pages 2645–2650, Dec. 2000.
34
[21] H. Pasika, S. Haykin, E. Clothiaux, and R. Stewart. Neural networksfor sensor fusion in remote sensing. In Neural Networks, 1999.IJCNN ’99. International Joint Conference on, volume 4, pages 2772–2776, July 1999.
[22] P. Ridao, J. Battle, J. Amat, and M. Carreras. A distributed environ-ment for virtual and/or real experiments for underwater robots. InRobotics and Automation, 2001. Proceedings 2001 ICRA. IEEE Inter-national Conference on, volume 4, pages 3250–3255, May 2001.
[23] B. Rooks. Robot welding in shipbuilding. The Industrial Robot,24(6):413–417, 1997.
[24] S. Sagatun and S. Hendseth. Efficient off-line programming of robotproduction systems. In Proceedings of the 27th International Sympo-sium on Industrial Robots. Robotics Towards 2000, pages 787–792,CEU-Centro Esposizioni UCIMU, Cinisello Balsamo, Italy, 1996.
[25] P. Sorenti. Efficient robotic welding for shipyards—virtual realitysimulation holds the key. The Industrial Robot, 24(4):278–281, 1997.
[26] Y. Suzuki. Method and apparatus for determining seam trackingcontrol of arc welding. Patent No. EP1077101, February 2001.
[27] J. Villafuerte. Arc welding torch. Patent No. US6130407, October2000.
[28] M. Xie and G. Bolmsjö. Using expert systems in arc monitoring andcausal diagnosis in robotic arc welding. In International Journal forthe Joining of Materials, volume 4 (4), 1992.
[29] M. Xie and G. Bolmsjö. Quality assurance and control for roboticGMA welding - part 1: QA model and welding procedure specifica-tion. In Joining Sciences, volume 1 (4), 1993.
[30] Yaskawa. Arc Sensor COM-ARC III Instructions.
35